impacts of aging the canadian market on tourism in ontario
TRANSCRIPT
If the future were now…
Impacts of Aging the Canadian Market on Tourism in Ontario
A Special Analysis of the Travel Activities and Motivation Survey (TAMS)
July 2002
TAMS Travel Activities &Motivation Survey
Table of Contents
I. Introduction ............................................................................................................ 3
II. Executive Summary ....................................................................................... 7
A. Impacts of Population Changes for Ontario .............................................................. 7
B. Implications for Tourism Product Development in Ontario...................................... 7
III. Ontario Resident Travel Behaviour in 2026 .................................... 10
1. A Canadian Overview ............................................................................................ 10
2. Demographic Changes Among Ontario Residents .................................................... 10
a) Gender & Age ............................................................................................................ 10
b) Household Income & Education ................................................................................ 11
c) Household Composition ............................................................................................. 12
d) Place of Birth.............................................................................................................. 12
3. Destination Choices ............................................................................................... 14
4. Product-based Tourist Groups................................................................................. 16
5. Immigration and Activities on Trips - 2026.............................................................. 20
6. Ontarians’ Activities at Home ................................................................................. 22
C. Appendix ................................................................................................................. 23
1. Additional Summary Tables ................................................................................... 23
2. Activities Measured in TAMS................................................................................. 24
D. Notes........................................................................................................................ 26
2
I. Introduction If the future were “now”, would the market for tourism in Ontario be the same as it cur-rently is? If not, how will the future differ from the current tourism market for the prov-ince? These were the questions posed by the Ontario Ministry of Tourism and Recreation (MTR) when it commissioned a special analysis and review of the Travel Activities and Motivation Survey (TAMS).1 Using population projections for Canada and the USA ob-tained by MTR from Statistics Canada and the U.S. Census Bureau, TAMS data were “aged” twenty-five years into the future.2 Comparisons of the market size, composition, and travel behaviour of Canadians in 2000 with estimates of the market profile in 2026 provide tourism policy makers and planners with critical information about the products and services that may be required in the future. Similarly, as the USA’s population changes in composition over the next twenty-five years, the size and composition of Ontario’s largest source of foreign tourism may also change. Those familiar with the TAMS survey are aware that it captures destinations visited in the past couple of years and considerable information on the types of specific outdoor, cultural and other experiences travellers have sought on trips in the recent past. These current be-haviour patterns are projected into the future, assuming that all other factors apart from age, gender, education and place of birth and immigration flows remain the same. The es-timates provided herein do not take into account changes in the economy or social factors such as the potential for an increasingly “physically fit” senior citizen population that might impact travel behaviour, major shifts in immigration policy or major political or economic changes in North America.3 Consequently, the reader should use the findings as general guideposts. The purpose of this summary report is to provide a broad-strokes guide to the future. Which types of tourism activities are likely to grow? Which are likely to shrink as the population ages? What are the possible implications for tourism development in Ontario? These questions are best answered within the context of Ontario’s major North American markets – Ontario and residents of the Great Lakes states. In 2001, Ontario residents ac-counted for 26.1 million of the 29.6 million overnight domestic person visits in the prov-ince (88%).4 Approximately two-thirds of all overnight tourism activity from the United States to Ontario originated in the eight states that border the Great Lakes (“Great Lakes States”).5
3
This report focuses on the Ontario resident market for tourism in the province. It is sup-ported by detailed computer tabulations under separate cover and is divided into two major sections: Executive Summary Ontario Resident Travel Behaviour in 2026
A second report, featuring impacts of the changing population in the Great Lakes states in 2025 will be issued in the summer of 2002. Toronto July, 2002
4
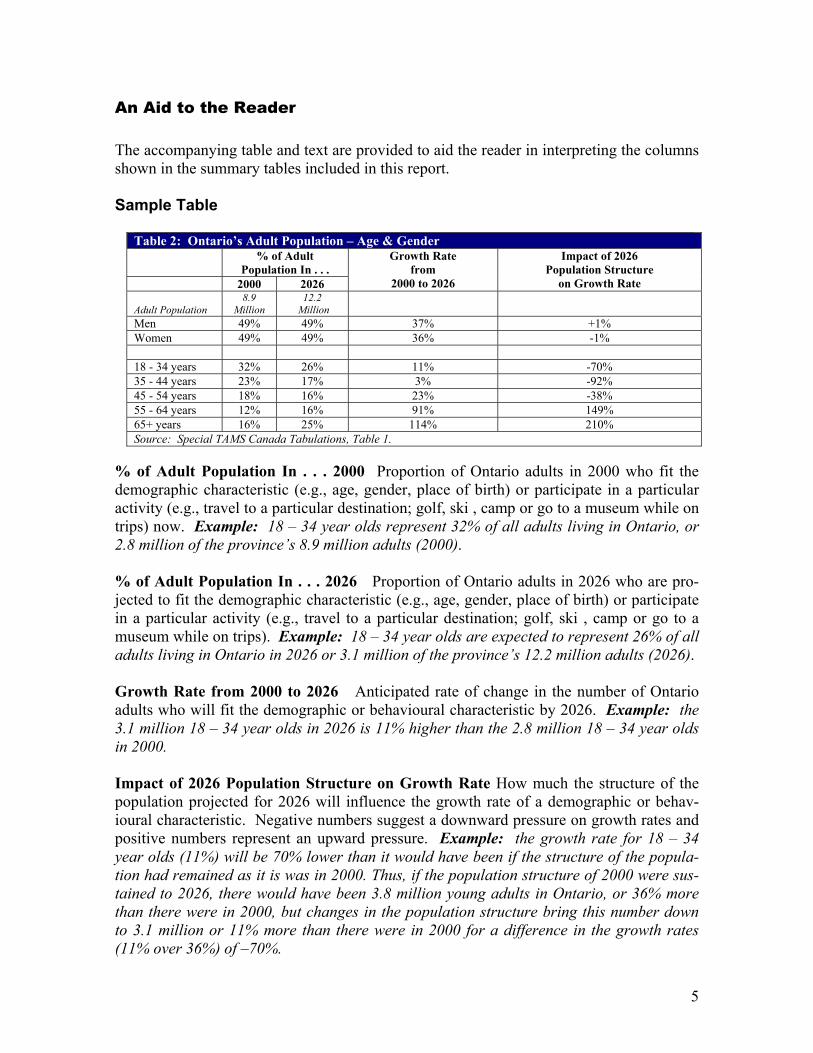
An Aid to the Reader The accompanying table and text are provided to aid the reader in interpreting the columns shown in the summary tables included in this report. Sample Table
Table 2: Ontario’s Adult Population – Age & Gender % of Adult
Population In . . . 2000 2026
Growth Rate from
2000 to 2026
Impact of 2026 Population Structure
on Growth Rate
Adult Population 8.9
Million 12.2
Million
Men 49% 49% 37% +1% Women 49% 49% 36% -1% 18 - 34 years 32% 26% 11% -70% 35 - 44 years 23% 17% 3% -92% 45 - 54 years 18% 16% 23% -38% 55 - 64 years 12% 16% 91% 149% 65+ years 16% 25% 114% 210% Source: Special TAMS Canada Tabulations, Table 1.
% of Adult Population In . . . 2000 Proportion of Ontario adults in 2000 who fit the demographic characteristic (e.g., age, gender, place of birth) or participate in a particular activity (e.g., travel to a particular destination; golf, ski , camp or go to a museum while on trips) now. Example: 18 – 34 year olds represent 32% of all adults living in Ontario, or 2.8 million of the province’s 8.9 million adults (2000). % of Adult Population In . . . 2026 Proportion of Ontario adults in 2026 who are pro-jected to fit the demographic characteristic (e.g., age, gender, place of birth) or participate in a particular activity (e.g., travel to a particular destination; golf, ski , camp or go to a museum while on trips). Example: 18 – 34 year olds are expected to represent 26% of all adults living in Ontario in 2026 or 3.1 million of the province’s 12.2 million adults (2026). Growth Rate from 2000 to 2026 Anticipated rate of change in the number of Ontario adults who will fit the demographic or behavioural characteristic by 2026. Example: the 3.1 million 18 – 34 year olds in 2026 is 11% higher than the 2.8 million 18 – 34 year olds in 2000. Impact of 2026 Population Structure on Growth Rate How much the structure of the population projected for 2026 will influence the growth rate of a demographic or behav-ioural characteristic. Negative numbers suggest a downward pressure on growth rates and positive numbers represent an upward pressure. Example: the growth rate for 18 – 34 year olds (11%) will be 70% lower than it would have been if the structure of the popula-tion had remained as it is was in 2000. Thus, if the population structure of 2000 were sus-tained to 2026, there would have been 3.8 million young adults in Ontario, or 36% more than there were in 2000, but changes in the population structure bring this number down to 3.1 million or 11% more than there were in 2000 for a difference in the growth rates (11% over 36%) of –70%.
5

6
II. Executive Summary
A. Impacts of Population Changes for Ontario
Three fundamental changes in Ontario’s population structure will influence tourism plan-ning and product development over the next two decades: 1. As the primary market for tourism in the province, Ontario’s population will grow at an
appreciably higher rate than will the population of Canada as a whole. At an estimated 37% increase in Ontario’s adult population by 2026 compared to a 27% increase for Canada, the pool from which Ontario has to draw for the all-important resident market will increase. By 2026, this population is estimated to be over 12 million adults (18+).
2. Older people – those who are at least 55 years of age – will represent an increasingly sizeable proportion of the province’s population. They currently account for approxi-mately one-quarter of the adult population (26%) but will represent about two-fifths by 2026 (41%).
3. As the population ages, the proportion of Ontario residents living in households with children will decline. At this time, close to 4-in-10 adult residents live in households with teenagers or children (37%), but this proportion will decline to less than 3-in-10 by 2026 (29%).
4. A higher proportion of Ontario residents will be foreign-born in 2026 (37%) than is the case now (31%) with particular increases in Eastern European and Asian immigrants predicted, assuming pre-September 11, 2001 immigration policies.
B. Implications for Tourism Product Development in Ontario
Increases in the absolute number of Ontario residents between 2000 and 2026 will
boost customers and audiences in almost all tourism activities and for all sectors of tourism in Ontario, simply because of the 37% increase in the province’s adult popula-tion over this time period. Nonetheless, the rates at which various tourism activities are likely to be adopted by the Ontario public in 2026 relative to current rates will in-crease or decrease because of changes in the structure of the province’s population. These rates of change in participation by the travelling public and the opportunity costs that demographic shifts will impose on Ontario’s tourism industry are the sub-jects of this analysis.
Changes to the population mix in Ontario over the next two decades could result in a
decline in the rate at which Ontarians travel and the number of leisure trips they take in their own province. If the current population structure were projected to 2026, Ontario residents would be expected to take approximately 49.1 million leisure trips in their own province over a two year period. With the expected population structure in 2026,
7
this number would be closer to 46.9 million adult person trips, or a 17% reduction in the growth rate.6 Specifically, a 37% increase in leisure trips by Ontario residents would be expected if the current population structure were in place in 2026. With the new population structure, the volume of leisure travel by Ontario residents in their own province is anticipated to increase by about 30%.
If the new generation of Ontario residents displays similar tourism activity preferences
to their 2000 counterparts, the impact of an aging population will result in a shift away from strenuous outdoor activities and a corresponding shift toward non-strenuous warm weather outdoor activities and indoor cultural events and attractions.
The comparative reluctance of foreign-born residents to participate in strenuous out-
door experiences will contribute to the move away from traditional outdoor tourism experiences by Ontario residents.7
Predicted declines in Ontario residents’ interest in traditional outdoor activities such as
fishing, canoeing, hunting and camping could have substantive implications for prod-uct development and marketing of tourism in the province over the coming years.
Will demand for lakeside or ski resorts or for hunting or fishing outposts keep pace
with population growth? These findings suggest that changes may be required to sus-tain market share for traditional outdoor product:
current product may have to be enhanced to meet the needs of an aging population,
with more comforts and amenities and with programming that permits visitors to enjoy Ontario’s natural settings in a less strenuous manner;
more highly targeted and effective marketing may be required to attract a higher
proportion of the shrinking young-adult and family markets; greater efforts may have to be made within new immigrant communities to increase
awareness and appreciation of the outdoor experiences Ontario can offer and to provide special language and cultural amenities.
As the population ages, there is also likely to be a decline in Ontario residents’ interest
in family-oriented products. Utilization rates for products such as children’s museums, zoos and theme or amusement parks are predicted to be lower by 2026 than they are now. From a product development perspective, investment in mega theme parks on the scale of Disney’s should be viewed with caution, particularly if the primary target mar-ket is expected to be the shrinking “family” and/or “youth” markets.
With an increasing immigrant, urban-based and aging population, Ontario’s resident
demand for cultural attractions and performances is expected to grow. For example, art galleries and general history museums can expect increases in the proportions of On-tario travellers who will seek these experiences while on trips. While still relatively small niche markets, wineries, dance and classical music or opera performances are
8
also likely to benefit from the aging of the travelling public. In contrast, the participa-tion rate for casinos is predicted to remain static over the next two decades.
Even though cultural attractions may benefit from the changing population structure
among Ontario travellers, these institutions may need to review their physical plant and programming plans to ensure that they provide the types of amenities and services that an increasingly older and ethnically diverse audience may require. Demand for these amenities and services will be driven not only by tourists but also by the aging and in-creasingly immigrant urban local population that is central to the financial viability of many museums, galleries, theatres and other performance venues.
As the largest population centre in the province, Toronto is a major market for all other
parts of Ontario. By 2026, this city will represent a full fifty percent of Ontario’s adult population . . . and the structure of the population will be quite different than it is now. In fact, of the projected 6.1 million adult residents of the Toronto Census Metropolitan Area in 2026, approximately 3.3 million, or over half, will be new Canadians. If attractions and particularly outdoor products in non-urban areas of the province are going to continue to rely on Toronto for much of their market, they may need to customize their product offering to the particular needs of some of the city’s major immigrant groups.
At present, immigrants travel within the province at appreciably lower rates than do
Canadian-born Ontario residents. To transform these new Canadians into “tourists” for Ontario’s outdoors, more study is required to determine the product, language and cul-tural characteristics that are most apt to lure them to outdoor destinations.
9
III. Ontario Resident Travel Behaviour in 2026 1. A Canadian Overview
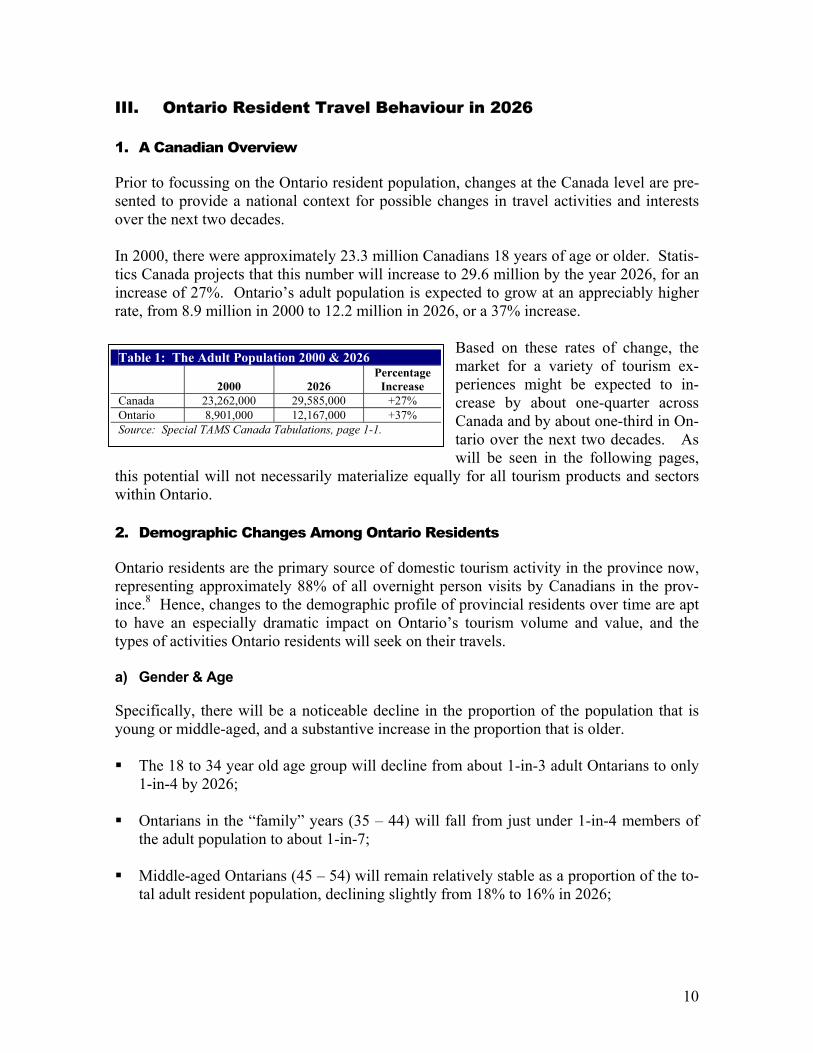
Prior to focussing on the Ontario resident population, changes at the Canada level are pre-sented to provide a national context for possible changes in travel activities and interests over the next two decades. In 2000, there were approximately 23.3 million Canadians 18 years of age or older. Statis-tics Canada projects that this number will increase to 29.6 million by the year 2026, for an increase of 27%. Ontario’s adult population is expected to grow at an appreciably higher rate, from 8.9 million in 2000 to 12.2 million in 2026, or a 37% increase.
Based on these rates of change, the market for a variety of tourism ex-periences might be expected to in-crease by about one-quarter across Canada and by about one-third in On-
Table 1: The Adult Population 2000 & 2026
2000
2026 Percentage
Increase Canada 23,262,000 29,585,000 +27% Ontario 8,901,000 12,167,000 +37% Source: Special TAMS Canada Tabulations, page 1-1.
tario over the next two decades. As will be seen in the following pages,
this potential will not necessarily materialize equally for all tourism products and sectors within Ontario. 2. Demographic Changes Among Ontario Residents
Ontario residents are the primary source of domestic tourism activity in the province now, representing approximately 88% of all overnight person visits by Canadians in the prov-ince.8 Hence, changes to the demographic profile of provincial residents over time are apt to have an especially dramatic impact on Ontario’s tourism volume and value, and the types of activities Ontario residents will seek on their travels. a) Gender & Age
Specifically, there will be a noticeable decline in the proportion of the population that is young or middle-aged, and a substantive increase in the proportion that is older. The 18 to 34 year old age group will decline from about 1-in-3 adult Ontarians to only
1-in-4 by 2026; Ontarians in the “family” years (35 – 44) will fall from just under 1-in-4 members of
the adult population to about 1-in-7; Middle-aged Ontarians (45 – 54) will remain relatively stable as a proportion of the to-
tal adult resident population, declining slightly from 18% to 16% in 2026;
10
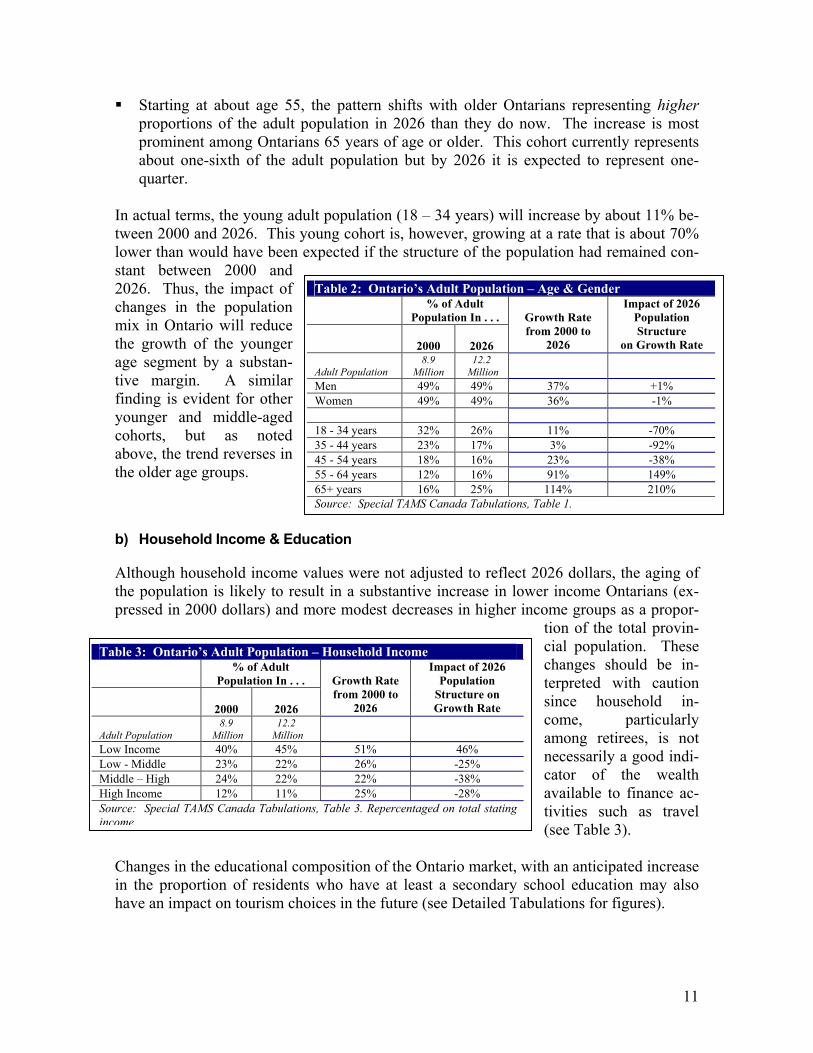
Starting at about age 55, the pattern shifts with older Ontarians representing higher proportions of the adult population in 2026 than they do now. The increase is most prominent among Ontarians 65 years of age or older. This cohort currently represents about one-sixth of the adult population but by 2026 it is expected to represent one-quarter.
In actual terms, the young adult population (18 – 34 years) will increase by about 11% be-tween 2000 and 2026. This young cohort is, however, growing at a rate that is about 70% lower than would have been expected if the structure of the population had remained con-stant between 2000 and 2026. Thus, the impact of changes in the population mix in Ontario will reduce the growth of the younger age segment by a substan-tive margin. A similar finding is evident for other younger and middle-aged cohorts, but as noted above, the trend reverses in the older age groups.
b) Household Income & Education
Although household income values were not adjusted to reflect 2026 dollars, the aging of the population is likely to result in a substantive increase in lower income Ontarians (ex-pressed in 2000 dollars) and more modest decreases in higher income groups as a propor-
tion of the total provin-cial population. These changes should be in-terpreted with caution since household in-come, particularly among retirees, is not necessarily a good indi-cator of the wealth available to finance ac-tivities such as travel (see Table 3).
Table 3: Ontario’s Adult Population – Household Income % of Adult
Population In . . .
2000
2026
Growth Rate from 2000 to
2026
Impact of 2026 Population
Structure on Growth Rate
Adult Population 8.9
Million 12.2
Million
Low Income 40% 45% 51% 46% Low - Middle 23% 22% 26% -25% Middle – High 24% 22% 22% -38% High Income 12% 11% 25% -28% Source: Special TAMS Canada Tabulations, Table 3. Repercentaged on total stating income.
Table 2: Ontario’s Adult Population – Age & Gender % of Adult
Population In . . .
2000
2026
Growth Rate from 2000 to
2026
Impact of 2026 Population Structure
on Growth Rate
Adult Population 8.9
Million 12.2
Million
Men 49% 49% 37% +1% Women 49% 49% 36% -1% 18 - 34 years 32% 26% 11% -70% 35 - 44 years 23% 17% 3% -92% 45 - 54 years 18% 16% 23% -38% 55 - 64 years 12% 16% 91% 149% 65+ years 16% 25% 114% 210% Source: Special TAMS Canada Tabulations, Table 1.
Changes in the educational composition of the Ontario market, with an anticipated increase in the proportion of residents who have at least a secondary school education may also have an impact on tourism choices in the future (see Detailed Tabulations for figures).
11
c) Household Composition
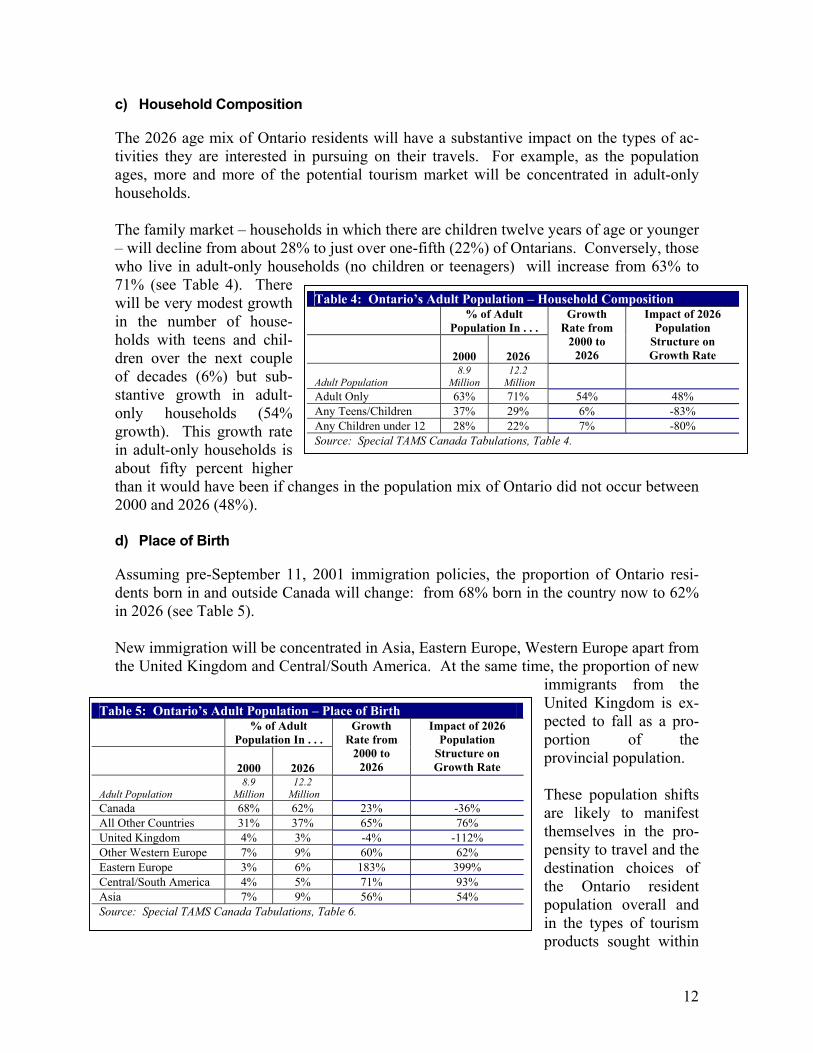
The 2026 age mix of Ontario residents will have a substantive impact on the types of ac-tivities they are interested in pursuing on their travels. For example, as the population ages, more and more of the potential tourism market will be concentrated in adult-only households. The family market – households in which there are children twelve years of age or younger – will decline from about 28% to just over one-fifth (22%) of Ontarians. Conversely, those who live in adult-only households (no children or teenagers) will increase from 63% to 71% (see Table 4). There will be very modest growth in the number of house-holds with teens and chil-dren over the next couple of decades (6%) but sub-stantive growth in adult-only households (54% growth). This growth rate in adult-only households is about fifty percent higher than it would have been if changes in the population mix of Ontario did not occur between 2000 and 2026 (48%). d) Place of Birth
Assuming pre-September 11, 2001 immigration policies, the proportion of Ontario resi-dents born in and outside Canada will change: from 68% born in the country now to 62% in 2026 (see Table 5). New immigration will be concentrated in Asia, Eastern Europe, Western Europe apart from the United Kingdom and Central/South America. At the same time, the proportion of new
immigrants from the United Kingdom is ex-pected to fall as a pro-portion of the provincial population. These population shifts are likely to manifest themselves in the pro-pensity to travel and the destination choices of the Ontario resident population overall and
Table 5: Ontario’s Adult Population – Place of Birth % of Adult
Population In . . .
2000
2026
Growth Rate from
2000 to 2026
Impact of 2026 Population
Structure on Growth Rate
Adult Population 8.9
Million 12.2
Million
Canada 68% 62% 23% -36% All Other Countries 31% 37% 65% 76% United Kingdom 4% 3% -4% -112% Other Western Europe 7% 9% 60% 62% Eastern Europe 3% 6% 183% 399% Central/South America 4% 5% 71% 93% Asia 7% 9% 56% 54% Source: Special TAMS Canada Tabulations, Table 6.
Table 4: Ontario’s Adult Population – Household Composition % of Adult
Population In . . .
2000
2026
Growth Rate from
2000 to 2026
Impact of 2026 Population
Structure on Growth Rate
Adult Population 8.9
Million 12.2
Million
Adult Only 63% 71% 54% 48% Any Teens/Children 37% 29% 6% -83% Any Children under 12 28% 22% 7% -80% Source: Special TAMS Canada Tabulations, Table 4.
in the types of tourism products sought within
12

the province since under current conditions, Ontario residents who were born outside Can-ada travel in Ontario at a lower rate than do those born within the country (see Section 5 for a discussion of immigrant impacts).9
13
3. Destination Choices
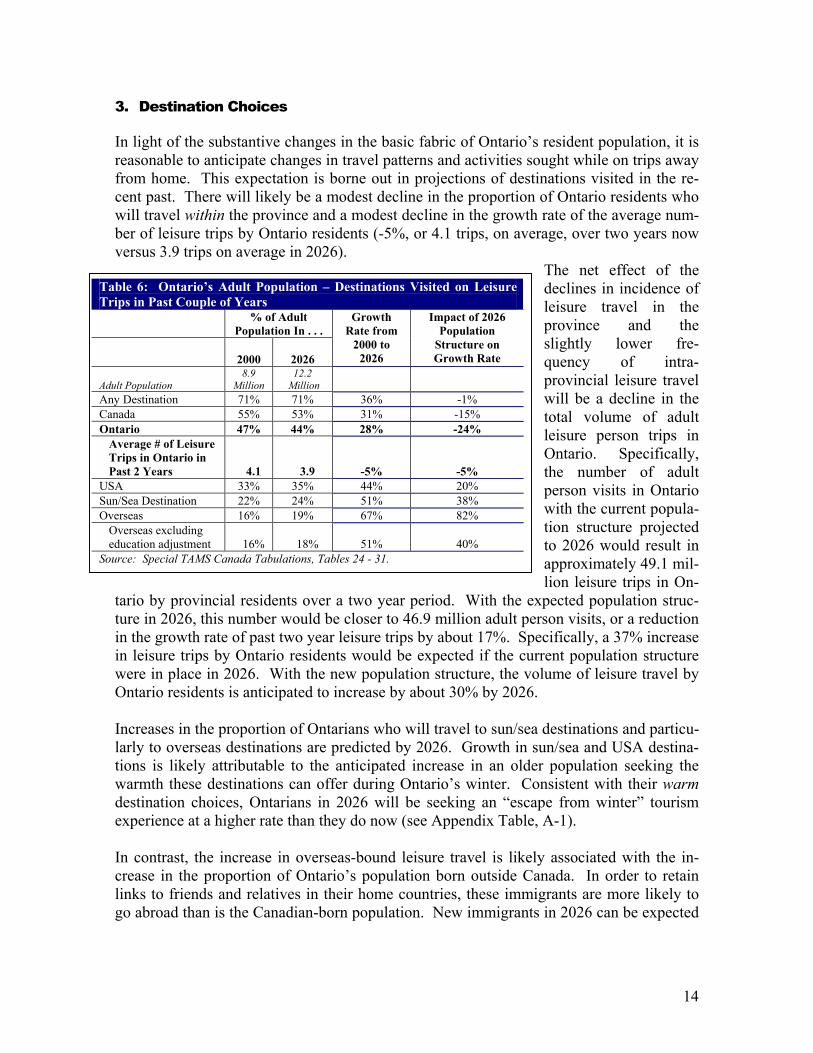
In light of the substantive changes in the basic fabric of Ontario’s resident population, it is reasonable to anticipate changes in travel patterns and activities sought while on trips away from home. This expectation is borne out in projections of destinations visited in the re-cent past. There will likely be a modest decline in the proportion of Ontario residents who will travel within the province and a modest decline in the growth rate of the average num-ber of leisure trips by Ontario residents (-5%, or 4.1 trips, on average, over two years now versus 3.9 trips on average in 2026).
The net effect of the declines in incidence of leisure travel in the province and the slightly lower fre-quency of intra-provincial leisure travel will be a decline in the total volume of adult leisure person trips in Ontario. Specifically, the number of adult person visits in Ontario with the current popula-tion structure projected to 2026 would result in approximately 49.1 mil-
Table 6: Ontario’s Adult Population – Destinations Visited on Leisure Trips in Past Couple of Years % of Adult
Population In . . .
2000
2026
Growth Rate from
2000 to 2026
Impact of 2026 Population
Structure on Growth Rate
Adult Population 8.9
Million 12.2
Million
Any Destination 71% 71% 36% -1% Canada 55% 53% 31% -15% Ontario 47% 44% 28% -24%
Average # of Leisure Trips in Ontario in Past 2 Years 4.1 3.9
-5%
-5% USA 33% 35% 44% 20% Sun/Sea Destination 22% 24% 51% 38% Overseas 16% 19% 67% 82%
Overseas excluding education adjustment 16% 18%
51%
40%
Source: Special TAMS Canada Tabulations, Tables 24 - 31.
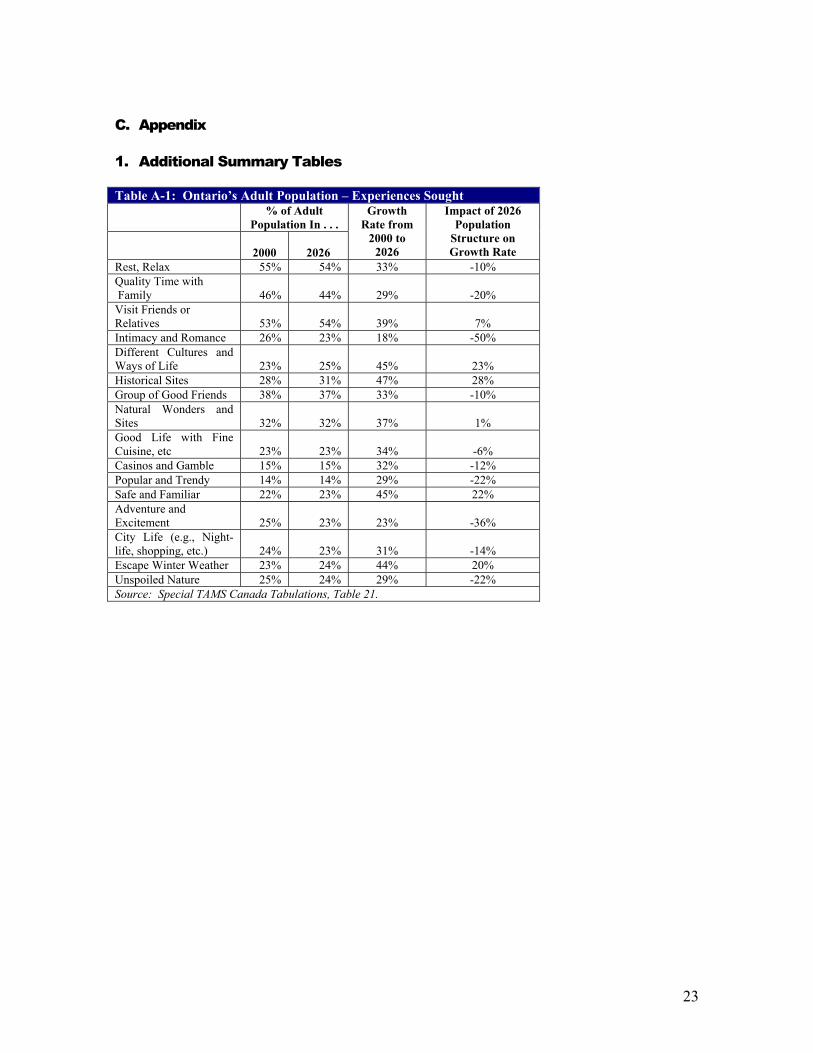
lion leisure trips in On-tario by provincial residents over a two year period. With the expected population struc-ture in 2026, this number would be closer to 46.9 million adult person visits, or a reduction in the growth rate of past two year leisure trips by about 17%. Specifically, a 37% increase in leisure trips by Ontario residents would be expected if the current population structure were in place in 2026. With the new population structure, the volume of leisure travel by Ontario residents is anticipated to increase by about 30% by 2026. Increases in the proportion of Ontarians who will travel to sun/sea destinations and particu-larly to overseas destinations are predicted by 2026. Growth in sun/sea and USA destina-tions is likely attributable to the anticipated increase in an older population seeking the warmth these destinations can offer during Ontario’s winter. Consistent with their warm destination choices, Ontarians in 2026 will be seeking an “escape from winter” tourism experience at a higher rate than they do now (see Appendix Table, A-1). In contrast, the increase in overseas-bound leisure travel is likely associated with the in-crease in the proportion of Ontario’s population born outside Canada. In order to retain links to friends and relatives in their home countries, these immigrants are more likely to go abroad than is the Canadian-born population. New immigrants in 2026 can be expected
14
to travel abroad at about three times the rate (33%) as will Ontario residents who were born in Canada (12%).10 Whether as a result of their diminished income vis à vis Canadian-born Ontario residents or their cultural and/or language preferences, new immigrants living in Ontario in 2026 will be less likely to take a leisure trip to any destination (63%) than will their Canadian-born counterparts (77%). Projecting current immigrant behaviour into the future, new-comers to Ontario in 2026 will also travel less within the province (incidence, 28%; aver-age number of leisure trips over two years, 2.2) than will adult residents born in Canada (incidence, 54%; average number of leisure trips over two years, 4.9).11 The more educated adults in Ontario become, the more likely they may be to seek overseas destinations when they travel. This suggestion is based on the fact that if no adjustment is made for increased educational achievement as the population grows between 2000 and 2026, there would be a 40% increase in overseas travel by Ontario residents over what would have been expected had the population structure of Ontario remained as it is today. With a further adjustment for the educational achievement of Ontario’s adult population, the increase over expectations rises to 82% (see Table 6 and special calculations).
15
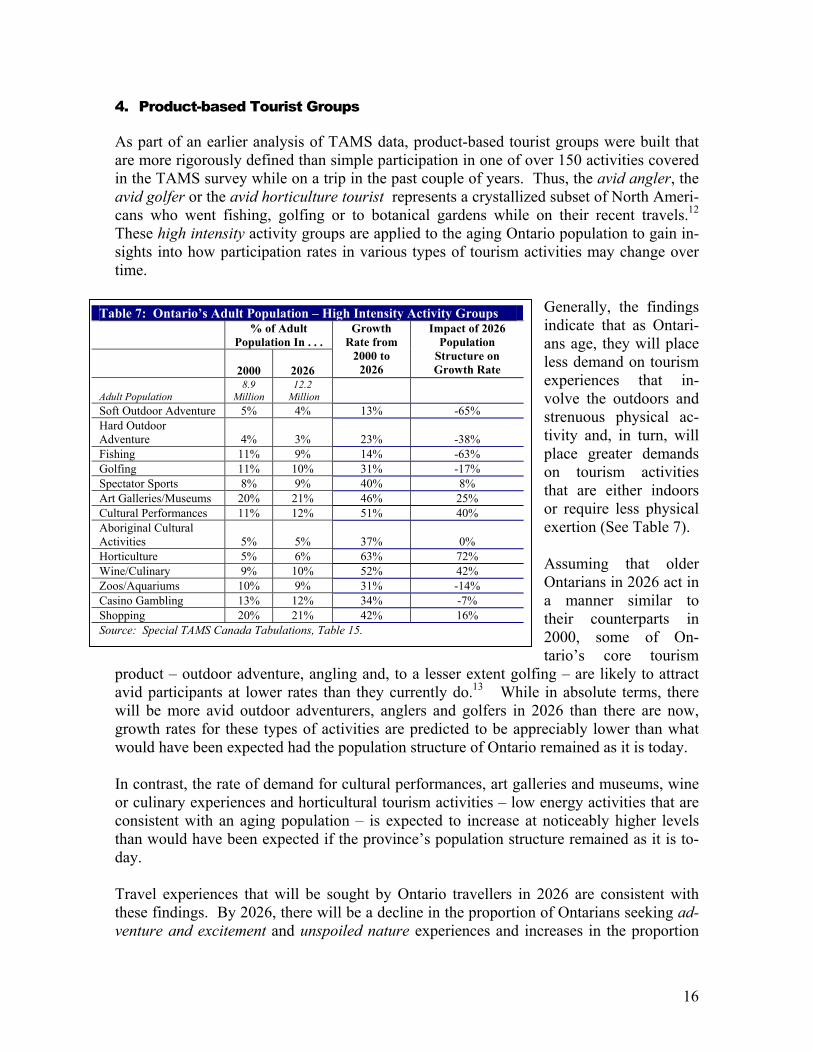
4. Product-based Tourist Groups
As part of an earlier analysis of TAMS data, product-based tourist groups were built that are more rigorously defined than simple participation in one of over 150 activities covered in the TAMS survey while on a trip in the past couple of years. Thus, the avid angler, the avid golfer or the avid horticulture tourist represents a crystallized subset of North Ameri-cans who went fishing, golfing or to botanical gardens while on their recent travels.12 These high intensity activity groups are applied to the aging Ontario population to gain in-sights into how participation rates in various types of tourism activities may change over time.
Generally, the findings indicate that as Ontari-ans age, they will place less demand on tourism experiences that in-volve the outdoors and strenuous physical ac-tivity and, in turn, will place greater demands on tourism activities that are either indoors or require less physical exertion (See Table 7). Assuming that older Ontarians in 2026 act in a manner similar to their counterparts in
Table 7: Ontario’s Adult Population – High Intensity Activity Groups % of Adult
Population In . . .
2000
2026
Growth Rate from
2000 to 2026
Impact of 2026 Population
Structure on Growth Rate
Adult Population 8.9
Million 12.2
Million
Soft Outdoor Adventure 5% 4% 13% -65% Hard Outdoor Adventure 4% 3% 23% -38% Fishing 11% 9% 14% -63% Golfing 11% 10% 31% -17% Spectator Sports 8% 9% 40% 8% Art Galleries/Museums 20% 21% 46% 25% Cultural Performances 11% 12% 51% 40% Aboriginal Cultural Activities 5% 5% 37% 0% Horticulture 5% 6% 63% 72% Wine/Culinary 9% 10% 52% 42% Zoos/Aquariums 10% 9% 31% -14% Casino Gambling 13% 12% 34% -7% Shopping 20% 21% 42% 16% Source: Special TAMS Canada Tabulations, Table 15.
2000, some of On-tario’s core tourism product – outdoor adventure, angling and, to a lesser extent golfing – are likely to attract avid participants at lower rates than they currently do.13 While in absolute terms, there will be more avid outdoor adventurers, anglers and golfers in 2026 than there are now, growth rates for these types of activities are predicted to be appreciably lower than what would have been expected had the population structure of Ontario remained as it is today. In contrast, the rate of demand for cultural performances, art galleries and museums, wine or culinary experiences and horticultural tourism activities – low energy activities that are consistent with an aging population – is expected to increase at noticeably higher levels than would have been expected if the province’s population structure remained as it is to-day. Travel experiences that will be sought by Ontario travellers in 2026 are consistent with these findings. By 2026, there will be a decline in the proportion of Ontarians seeking ad-venture and excitement and unspoiled nature experiences and increases in the proportion
16
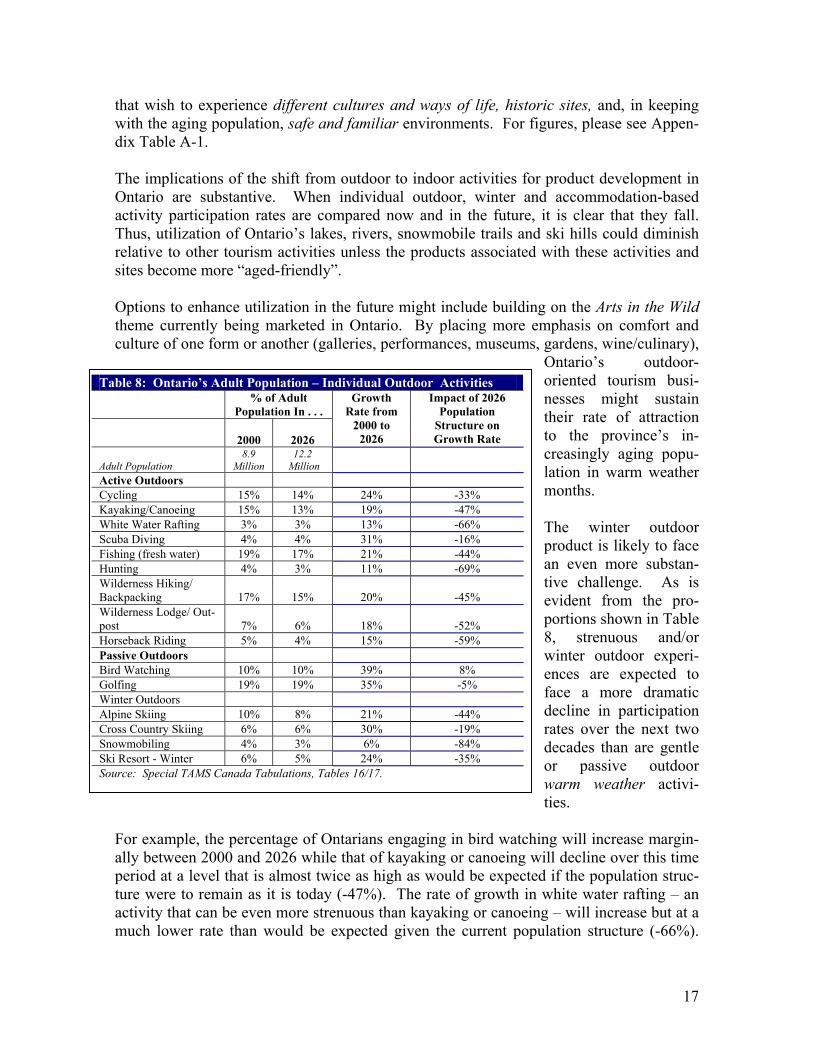
that wish to experience different cultures and ways of life, historic sites, and, in keeping with the aging population, safe and familiar environments. For figures, please see Appen-dix Table A-1. The implications of the shift from outdoor to indoor activities for product development in Ontario are substantive. When individual outdoor, winter and accommodation-based activity participation rates are compared now and in the future, it is clear that they fall. Thus, utilization of Ontario’s lakes, rivers, snowmobile trails and ski hills could diminish relative to other tourism activities unless the products associated with these activities and sites become more “aged-friendly”. Options to enhance utilization in the future might include building on the Arts in the Wild theme currently being marketed in Ontario. By placing more emphasis on comfort and culture of one form or another (galleries, performances, museums, gardens, wine/culinary),
Ontario’s outdoor-oriented tourism busi-nesses might sustain their rate of attraction to the province’s in-creasingly aging popu-lation in warm weather months. The winter outdoor product is likely to face an even more substan-tive challenge. As is evident from the pro-portions shown in Table 8, strenuous and/or winter outdoor experi-ences are expected to face a more dramatic decline in participation rates over the next two decades than are gentle or passive outdoor warm weather activi-ties.
Table 8: Ontario’s Adult Population – Individual Outdoor Activities % of Adult
Population In . . .
2000
2026
Growth Rate from
2000 to 2026
Impact of 2026 Population
Structure on Growth Rate
Adult Population 8.9
Million 12.2
Million
Active Outdoors Cycling 15% 14% 24% -33% Kayaking/Canoeing 15% 13% 19% -47% White Water Rafting 3% 3% 13% -66% Scuba Diving 4% 4% 31% -16% Fishing (fresh water) 19% 17% 21% -44% Hunting 4% 3% 11% -69% Wilderness Hiking/ Backpacking 17% 15% 20% -45% Wilderness Lodge/ Out-post 7% 6% 18% -52% Horseback Riding 5% 4% 15% -59% Passive Outdoors Bird Watching 10% 10% 39% 8% Golfing 19% 19% 35% -5% Winter Outdoors Alpine Skiing 10% 8% 21% -44% Cross Country Skiing 6% 6% 30% -19% Snowmobiling 4% 3% 6% -84% Ski Resort - Winter 6% 5% 24% -35% Source: Special TAMS Canada Tabulations, Tables 16/17.
For example, the percentage of Ontarians engaging in bird watching will increase margin-ally between 2000 and 2026 while that of kayaking or canoeing will decline over this time period at a level that is almost twice as high as would be expected if the population struc-ture were to remain as it is today (-47%). The rate of growth in white water rafting – an activity that can be even more strenuous than kayaking or canoeing – will increase but at a much lower rate than would be expected given the current population structure (-66%).
17
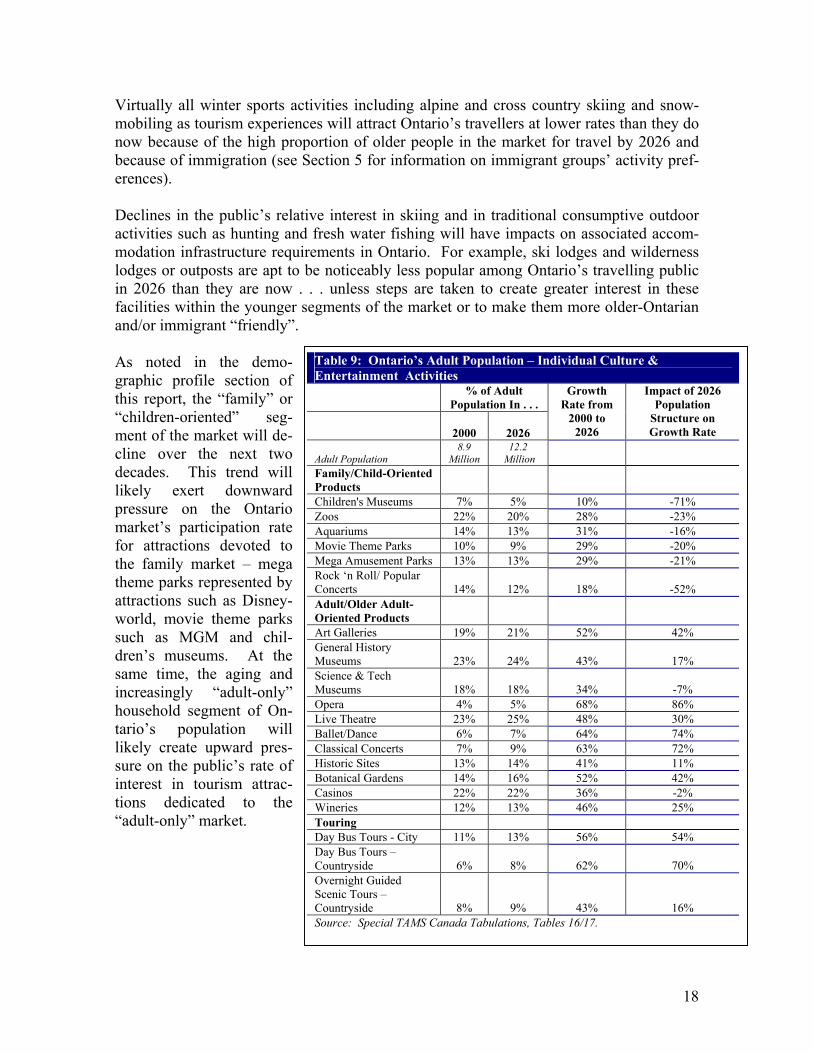
Virtually all winter sports activities including alpine and cross country skiing and snow-mobiling as tourism experiences will attract Ontario’s travellers at lower rates than they do now because of the high proportion of older people in the market for travel by 2026 and because of immigration (see Section 5 for information on immigrant groups’ activity pref-erences). Declines in the public’s relative interest in skiing and in traditional consumptive outdoor activities such as hunting and fresh water fishing will have impacts on associated accom-modation infrastructure requirements in Ontario. For example, ski lodges and wilderness lodges or outposts are apt to be noticeably less popular among Ontario’s travelling public in 2026 than they are now . . . unless steps are taken to create greater interest in these facilities within the younger segments of the market or to make them more older-Ontarian and/or immigrant “friendly”. As noted in the demo-graphic profile section of this report, the “family” or “children-oriented” seg-ment of the market will de-cline over the next two decades. This trend will likely exert downward pressure on the Ontario market’s participation rate for attractions devoted to the family market – mega theme parks represented by attractions such as Disney-world, movie theme parks such as MGM and chil-dren’s museums. At the same time, the aging and increasingly “adult-only” household segment of On-tario’s population will likely create upward pres-sure on the public’s rate of interest in tourism attrac-tions dedicated to the “adult-only” market.
Table 9: Ontario’s Adult Population – Individual Culture & Entertainment Activities % of Adult
Population In . . .
2000
2026
Growth Rate from
2000 to 2026
Impact of 2026 Population
Structure on Growth Rate
Adult Population 8.9
Million 12.2
Million
Family/Child-Oriented Products
Children's Museums 7% 5% 10% -71% Zoos 22% 20% 28% -23% Aquariums 14% 13% 31% -16% Movie Theme Parks 10% 9% 29% -20% Mega Amusement Parks 13% 13% 29% -21% Rock ‘n Roll/ Popular Concerts 14% 12% 18% -52% Adult/Older Adult-Oriented Products Art Galleries 19% 21% 52% 42% General History Museums 23% 24% 43% 17% Science & Tech Museums 18% 18% 34% -7% Opera 4% 5% 68% 86% Live Theatre 23% 25% 48% 30% Ballet/Dance 6% 7% 64% 74% Classical Concerts 7% 9% 63% 72% Historic Sites 13% 14% 41% 11% Botanical Gardens 14% 16% 52% 42% Casinos 22% 22% 36% -2% Wineries 12% 13% 46% 25% Touring Day Bus Tours - City 11% 13% 56% 54% Day Bus Tours – Countryside 6% 8% 62% 70% Overnight Guided Scenic Tours – Countryside 8% 9% 43% 16% Source: Special TAMS Canada Tabulations, Tables 16/17.
18
As is evident from estimates of demand for attractions detailed in Table 9, participation rates for art galleries, history museums, wineries, botanical gardens, historic sites and op-era, ballet, and classical music performances will increase as the population ages. Utiliza-tion of children’s museums, theme parks, zoos and aquariums will increase by 2026 but at a much lower rate than would be expected given the current population structure unless these attractions customize their products to the needs of an older market or enhance their appeal within the shrinking family market. Older Ontarians show a more marked interest in being taken to tourism attractions and des-tinations than does the younger segment of the travelling public. Although TAMS data on packaged sightseeing tours is quite limited, it would appear that the aging population will exhibit a heightened rate of interest in overnight and day packaged tours among Ontario’s travellers by 2026.
19
5. Immigration and Activities on Trips - 2026
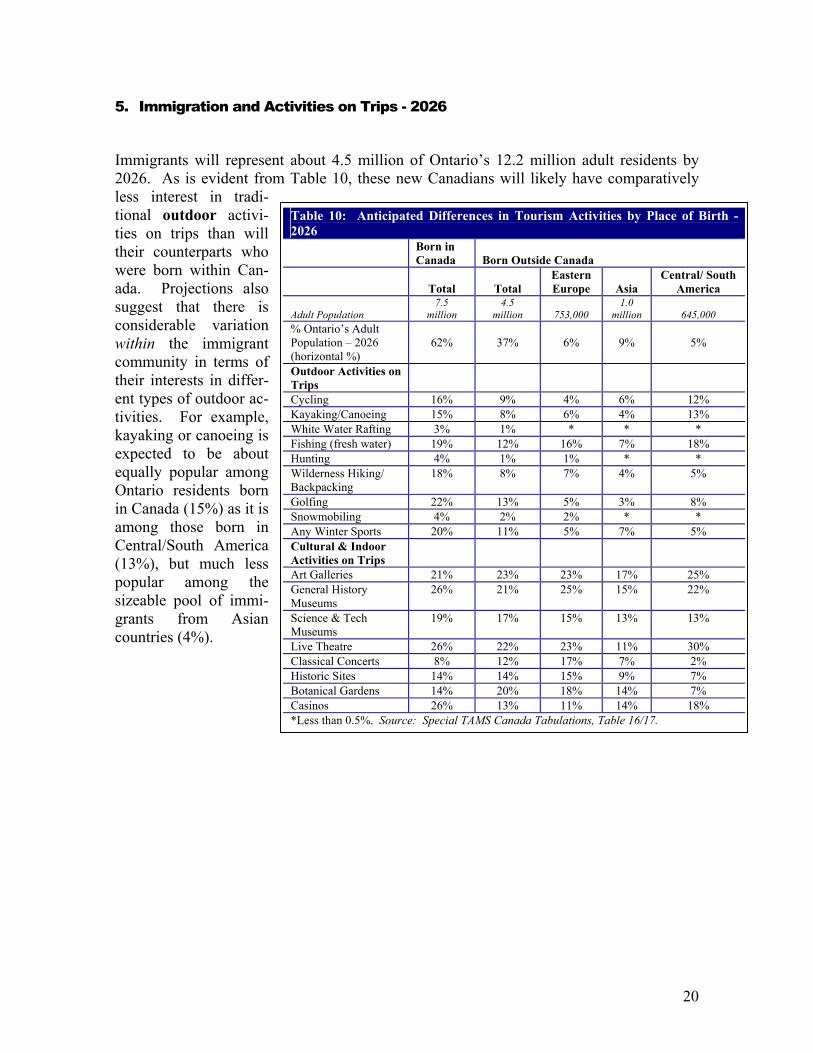
Immigrants will represent about 4.5 million of Ontario’s 12.2 million adult residents by 2026. As is evident from Table 10, these new Canadians will likely have comparatively less interest in tradi-tional outdoor activi-ties on trips than will their counterparts who were born within Can-ada. Projections also suggest that there is considerable variation within the immigrant community in terms of their interests in differ-ent types of outdoor ac-tivities. For example, kayaking or canoeing is expected to be about equally popular among Ontario residents born in Canada (15%) as it is among those born in Central/South America (13%), but much less popular among the sizeable pool of immi-grants from Asian countries (4%).
Table 10: Anticipated Differences in Tourism Activities by Place of Birth - 2026 Born in
Canada Born Outside Canada
Total
Total Eastern Europe
Asia
Central/ South America
Adult Population 7.5
million 4.5
million
753,000 1.0
million
645,000 % Ontario’s Adult Population – 2026 (horizontal %)
62%
37%
6%
9%
5%
Outdoor Activities on Trips
Cycling 16% 9% 4% 6% 12% Kayaking/Canoeing 15% 8% 6% 4% 13% White Water Rafting 3% 1% * * * Fishing (fresh water) 19% 12% 16% 7% 18% Hunting 4% 1% 1% * * Wilderness Hiking/ Backpacking
18% 8% 7% 4% 5%
Golfing 22% 13% 5% 3% 8% Snowmobiling 4% 2% 2% * * Any Winter Sports 20% 11% 5% 7% 5% Cultural & Indoor Activities on Trips
Art Galleries 21% 23% 23% 17% 25% General History Museums
26% 21% 25% 15% 22%
Science & Tech Museums
19% 17% 15% 13% 13%
Live Theatre 26% 22% 23% 11% 30% Classical Concerts 8% 12% 17% 7% 2% Historic Sites 14% 14% 15% 9% 7% Botanical Gardens 14% 20% 18% 14% 7% Casinos 26% 13% 11% 14% 18% *Less than 0.5%. Source: Special TAMS Canada Tabulations, Table 16/17.
20
The comparatively low levels of interest in some of Ontario’s hallmark outdoor products among new Canadians may reflect their low level of exposure to the vast natural expanses of Ontario. As noted previously, new Canadians are expected to travel in the province at a lower rate and less frequently than their counterparts who were born in Canada (see Sec-tion 3). Because Toronto is a major reception centre for immigrants, the city will likely house three-quarters (73%) of the province’s new immigrants by 2026. This high concentration of new immigrants in the southern end of the province and in a highly urbanized setting suggests that if inroads are to be made to encourage new Canadians to participate in out-door tourism in Ontario, special efforts may be required to expose them to other parts of the province. There may also be requirements for special services that respect the lan-guage, dietary and religious customs of these groups if they are to feel “at home” in On-tario’s outdoor tourism settings. In light of their urban concentration, it may not be surprising that cultural attractions are expected to be about equally popular as tourism activities for those born in and outside Canada. Art galleries, museums, live theatre and classical music performances are at least as likely to be included as a travel activity among most immigrant groups in 2026 as they are to be experienced by Ontario residents born in Canada. The one exception to the popu-larity of these types of activities is found among new Canadians from Asian countries. Entertainment facilities such as casinos can also expect to experience the impact of immi-gration. By 2026, this type of activity is projected to be sought on trips by over 1-in-4 On-tario adults born in Canada (26%). Only about half this proportion of Ontario’s new immigrants will likely frequent casinos while travelling in 2026 (13%). The cultural attractions sought by immigrants may not be those Ontario has to offer. As noted earlier, new immigrants are especially apt to travel abroad and especially unlikely to travel in Ontario. Hence, the cultural products that are included in their trips may be those offered by overseas countries rather than by destinations in Ontario.
21
6. Ontarians’ Activities at Home
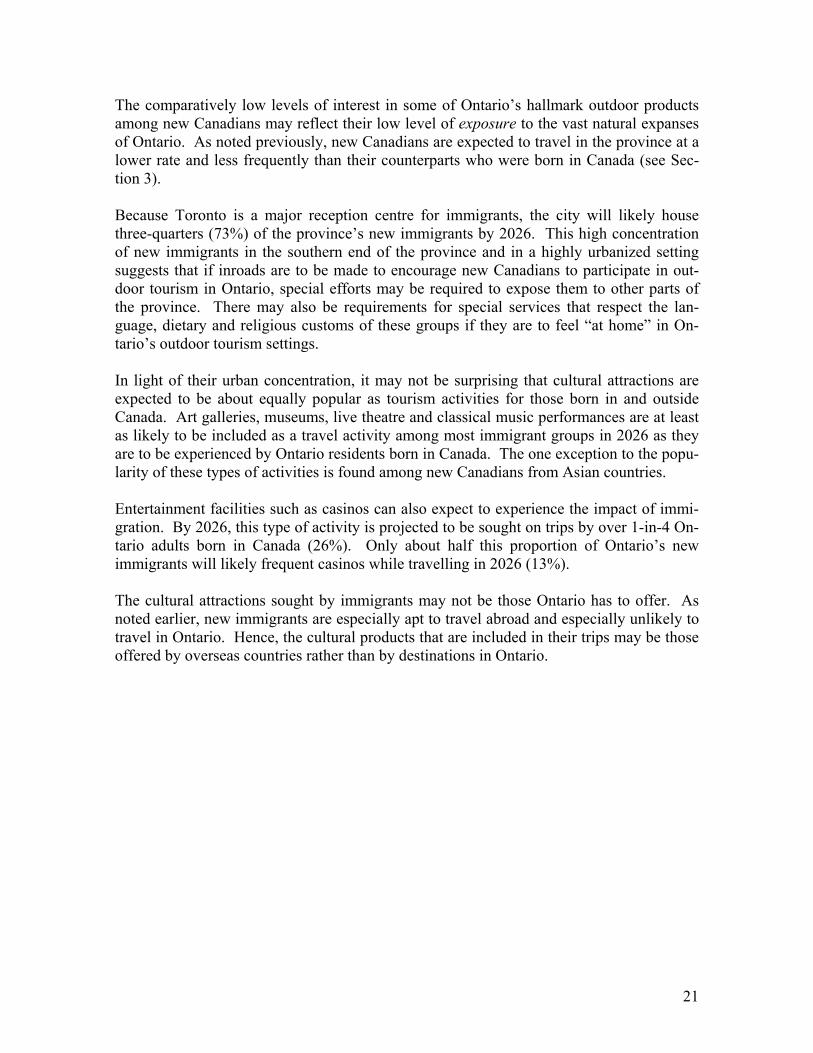
Since many tourism attractions secure the base of their operations within the “resident” market, changes to the population structure in Ontario will have implications for the sus-tainability of many cultural and entertainment facilities. Will there continue to be suffi-cient local demand for spectator sports, museums, galleries and cultural performances in the future so that these attractions remain vibrant lures for tourists? Assuming that the
types of activities en-gaged in within the lo-cal community on a frequent or occasional basis in 2026 reflect current tastes and pref-erences, Ontario’s cit-ies, towns and country-side can expect rates of participation in outdoor and child-oriented rec-reational activities to fall relative to other ac-tivities and the rates of participation in indoor and cultural activities to increase relative to other activities over the next two decades. These projected shifts are wholly consistent with the changes pre-dicted for Ontarians’ travel activities outside
Table 11: Ontario’s Adult Population – Frequent/Occasional Activities at Home % of Adult
Population In . . .
2000
2026
Growth Rate from
2000 to 2026
Impact of 2026 Population
Structure on Growth Rate
Adult Population 8.9
Million 12.2
Million Gardening 52% 49% 30% -19% Golf 27% 24% 24% -34% Fishing 24% 20% 15% -59% Hunting 7% 5% 4% -89% Camping/Hiking 39% 32% 14% -61% Cycling 40% 36% 22% -41% Cross Country Skiing 11% 10% 25% -33% Alpine Skiing 15% 13% 18% -50% Snowmobiling 11% 8% 3% -91% Pro Sports Events 33% 31% 29% -20% Amusement Parks 34% 31% 24% -35% Art Galleries 27% 32% 59% 61% Museums 33% 35% 48% 30% Opera 9% 13% 95% 159% Live Theatre 40% 43% 47% 29% Ballet/Dance 9% 13% 90% 146% Zoo/Botanical Gardens 33% 33% 37% 0% Casinos 16% 15% 27% -25% Source: Special TAMS Canada Tabulations, Table 23.
their local communities. Specifically, declines in the proportion of local residents who participate in sporting activi-ties such as fishing, hunting, camping, canoeing, skiing and snowmobiling are expected by 2026. Amusement parks, casinos, spectator sports facilities and golf courses might also anticipate lower proportions of local residents over time. Conversely, art galleries and per-formances including opera and ballet may see higher proportions of the local market in their audiences over the next two decades than they do now.
22
C. Appendix
1. Additional Summary Tables
Table A-1: Ontario’s Adult Population – Experiences Sought % of Adult
Population In . . .
2000
2026
Growth Rate from
2000 to 2026
Impact of 2026 Population
Structure on Growth Rate
Rest, Relax 55% 54% 33% -10% Quality Time with Family 46% 44% 29% -20% Visit Friends or Relatives 53% 54% 39% 7% Intimacy and Romance 26% 23% 18% -50% Different Cultures and Ways of Life 23% 25% 45% 23% Historical Sites 28% 31% 47% 28% Group of Good Friends 38% 37% 33% -10% Natural Wonders and Sites 32% 32% 37% 1% Good Life with Fine Cuisine, etc 23% 23% 34% -6% Casinos and Gamble 15% 15% 32% -12% Popular and Trendy 14% 14% 29% -22% Safe and Familiar 22% 23% 45% 22% Adventure and Excitement 25% 23% 23% -36% City Life (e.g., Night-life, shopping, etc.) 24% 23% 31% -14% Escape Winter Weather 23% 24% 44% 20% Unspoiled Nature 25% 24% 29% -22% Source: Special TAMS Canada Tabulations, Table 21.
23
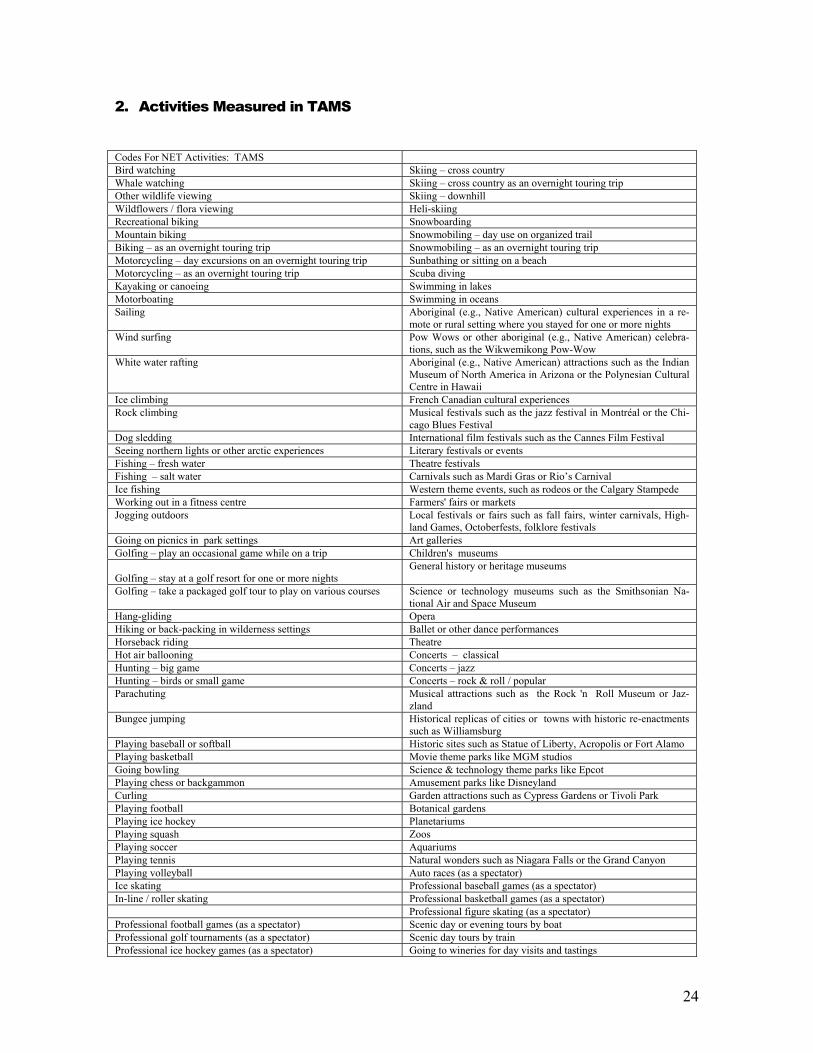
2. Activities Measured in TAMS
Codes For NET Activities: TAMS Bird watching Skiing – cross country Whale watching Skiing – cross country as an overnight touring trip Other wildlife viewing Skiing – downhill Wildflowers / flora viewing Heli-skiing Recreational biking Snowboarding Mountain biking Snowmobiling – day use on organized trail Biking – as an overnight touring trip Snowmobiling – as an overnight touring trip Motorcycling – day excursions on an overnight touring trip Sunbathing or sitting on a beach Motorcycling – as an overnight touring trip Scuba diving Kayaking or canoeing Swimming in lakes Motorboating Swimming in oceans Sailing Aboriginal (e.g., Native American) cultural experiences in a re-
mote or rural setting where you stayed for one or more nights Wind surfing Pow Wows or other aboriginal (e.g., Native American) celebra-
tions, such as the Wikwemikong Pow-Wow White water rafting Aboriginal (e.g., Native American) attractions such as the Indian
Museum of North America in Arizona or the Polynesian Cultural Centre in Hawaii
Ice climbing French Canadian cultural experiences Rock climbing Musical festivals such as the jazz festival in Montréal or the Chi-
cago Blues Festival Dog sledding International film festivals such as the Cannes Film Festival Seeing northern lights or other arctic experiences Literary festivals or events Fishing – fresh water Theatre festivals Fishing – salt water Carnivals such as Mardi Gras or Rio’s Carnival Ice fishing Western theme events, such as rodeos or the Calgary Stampede Working out in a fitness centre Farmers' fairs or markets Jogging outdoors Local festivals or fairs such as fall fairs, winter carnivals, High-
land Games, Octoberfests, folklore festivals Going on picnics in park settings Art galleries Golfing – play an occasional game while on a trip Children's museums Golfing – stay at a golf resort for one or more nights
General history or heritage museums
Golfing – take a packaged golf tour to play on various courses Science or technology museums such as the Smithsonian Na-tional Air and Space Museum
Hang-gliding Opera Hiking or back-packing in wilderness settings Ballet or other dance performances Horseback riding Theatre Hot air ballooning Concerts – classical Hunting – big game Concerts – jazz Hunting – birds or small game Concerts – rock & roll / popular Parachuting Musical attractions such as the Rock 'n Roll Museum or Jaz-
zland Bungee jumping Historical replicas of cities or towns with historic re-enactments
such as Williamsburg Playing baseball or softball Historic sites such as Statue of Liberty, Acropolis or Fort Alamo Playing basketball Movie theme parks like MGM studios Going bowling Science & technology theme parks like Epcot Playing chess or backgammon Amusement parks like Disneyland Curling Garden attractions such as Cypress Gardens or Tivoli Park Playing football Botanical gardens Playing ice hockey Planetariums Playing squash Zoos Playing soccer Aquariums Playing tennis Natural wonders such as Niagara Falls or the Grand Canyon Playing volleyball Auto races (as a spectator) Ice skating Professional baseball games (as a spectator) In-line / roller skating Professional basketball games (as a spectator) Professional figure skating (as a spectator) Professional football games (as a spectator) Scenic day or evening tours by boat Professional golf tournaments (as a spectator) Scenic day tours by train Professional ice hockey games (as a spectator) Going to wineries for day visits and tastings
24
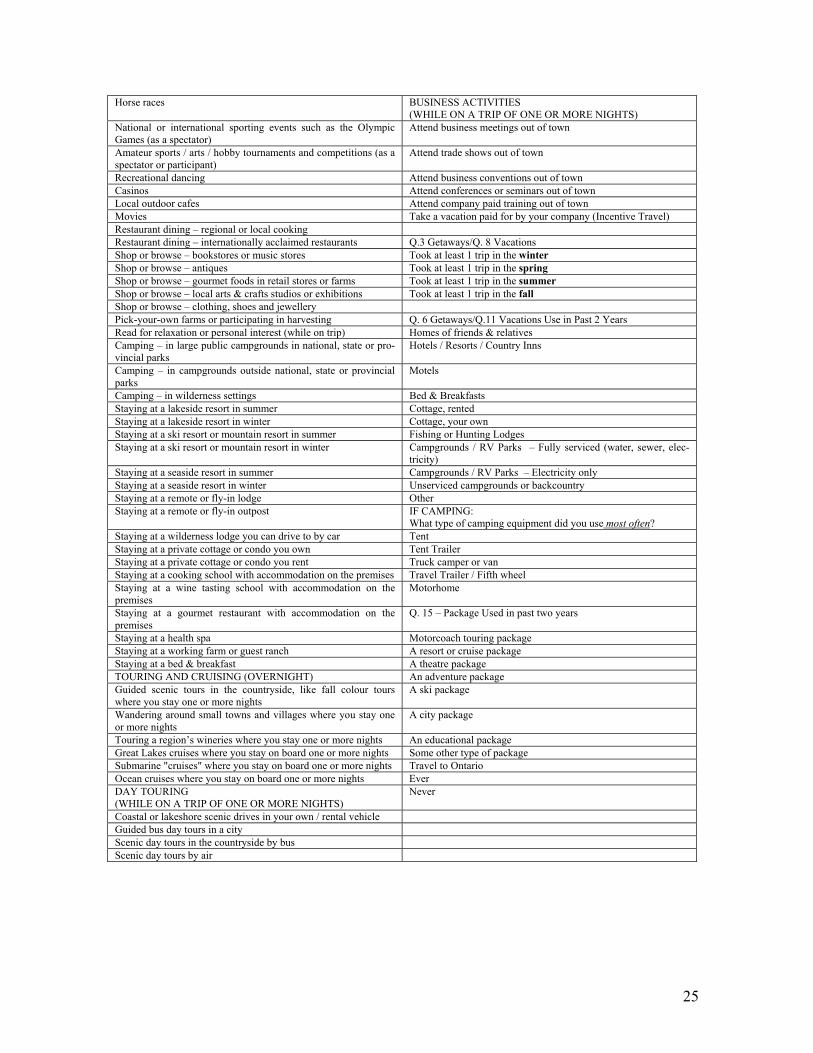
Horse races BUSINESS ACTIVITIES (WHILE ON A TRIP OF ONE OR MORE NIGHTS)
National or international sporting events such as the Olympic Games (as a spectator)
Attend business meetings out of town
Amateur sports / arts / hobby tournaments and competitions (as a spectator or participant)
Attend trade shows out of town
Recreational dancing Attend business conventions out of town Casinos Attend conferences or seminars out of town Local outdoor cafes Attend company paid training out of town Movies Take a vacation paid for by your company (Incentive Travel) Restaurant dining – regional or local cooking Restaurant dining – internationally acclaimed restaurants Q.3 Getaways/Q. 8 Vacations Shop or browse – bookstores or music stores Took at least 1 trip in the winter Shop or browse – antiques Took at least 1 trip in the spring Shop or browse – gourmet foods in retail stores or farms Took at least 1 trip in the summer Shop or browse – local arts & crafts studios or exhibitions Took at least 1 trip in the fall Shop or browse – clothing, shoes and jewellery Pick-your-own farms or participating in harvesting Q. 6 Getaways/Q.11 Vacations Use in Past 2 Years Read for relaxation or personal interest (while on trip) Homes of friends & relatives Camping – in large public campgrounds in national, state or pro-vincial parks
Hotels / Resorts / Country Inns
Camping – in campgrounds outside national, state or provincial parks
Motels
Camping – in wilderness settings Bed & Breakfasts Staying at a lakeside resort in summer Cottage, rented Staying at a lakeside resort in winter Cottage, your own Staying at a ski resort or mountain resort in summer Fishing or Hunting Lodges Staying at a ski resort or mountain resort in winter Campgrounds / RV Parks – Fully serviced (water, sewer, elec-
tricity) Staying at a seaside resort in summer Campgrounds / RV Parks – Electricity only Staying at a seaside resort in winter Unserviced campgrounds or backcountry Staying at a remote or fly-in lodge Other Staying at a remote or fly-in outpost IF CAMPING:
What type of camping equipment did you use most often? Staying at a wilderness lodge you can drive to by car Tent Staying at a private cottage or condo you own Tent Trailer Staying at a private cottage or condo you rent Truck camper or van Staying at a cooking school with accommodation on the premises Travel Trailer / Fifth wheel Staying at a wine tasting school with accommodation on the premises
Motorhome
Staying at a gourmet restaurant with accommodation on the premises
Q. 15 – Package Used in past two years
Staying at a health spa Motorcoach touring package Staying at a working farm or guest ranch A resort or cruise package Staying at a bed & breakfast A theatre package TOURING AND CRUISING (OVERNIGHT) An adventure package Guided scenic tours in the countryside, like fall colour tours where you stay one or more nights
A ski package
Wandering around small towns and villages where you stay one or more nights
A city package
Touring a region’s wineries where you stay one or more nights An educational package Great Lakes cruises where you stay on board one or more nights Some other type of package Submarine "cruises" where you stay on board one or more nights Travel to Ontario Ocean cruises where you stay on board one or more nights Ever DAY TOURING (WHILE ON A TRIP OF ONE OR MORE NIGHTS)
Never
Coastal or lakeshore scenic drives in your own / rental vehicle Guided bus day tours in a city Scenic day tours in the countryside by bus Scenic day tours by air
25
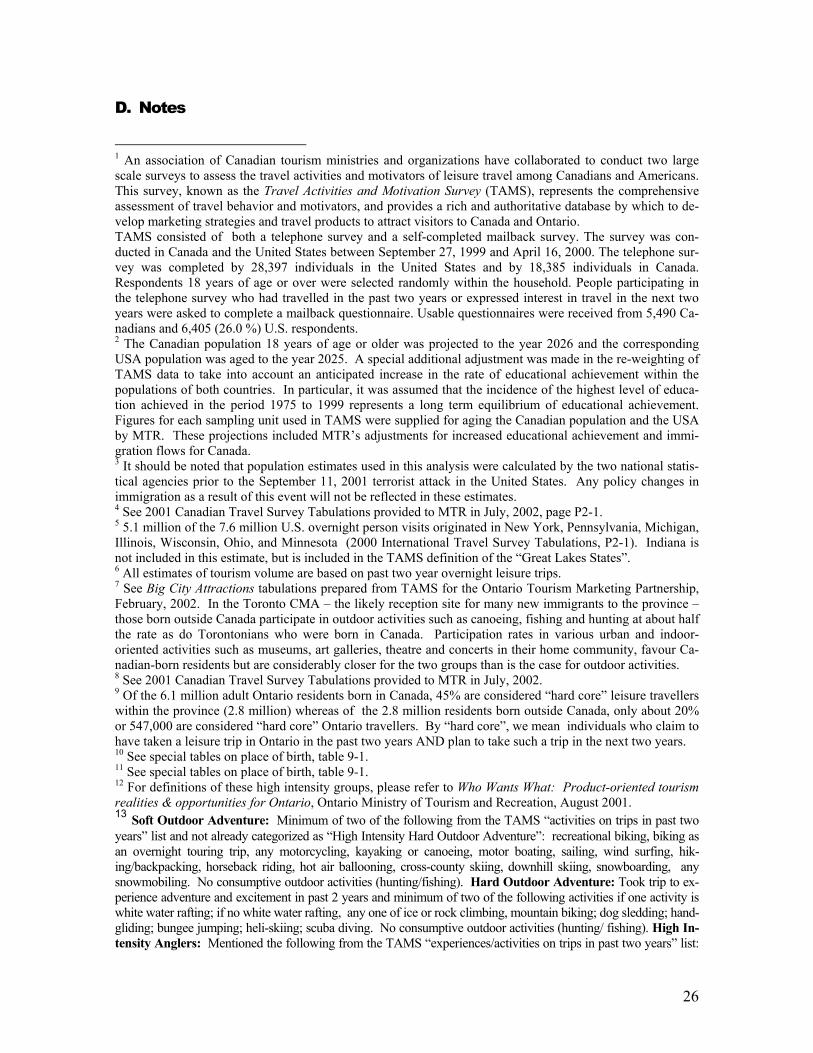
D. Notes
1 An association of Canadian tourism ministries and organizations have collaborated to conduct two large scale surveys to assess the travel activities and motivators of leisure travel among Canadians and Americans. This survey, known as the Travel Activities and Motivation Survey (TAMS), represents the comprehensive assessment of travel behavior and motivators, and provides a rich and authoritative database by which to de-velop marketing strategies and travel products to attract visitors to Canada and Ontario. TAMS consisted of both a telephone survey and a self-completed mailback survey. The survey was con-ducted in Canada and the United States between September 27, 1999 and April 16, 2000. The telephone sur-vey was completed by 28,397 individuals in the United States and by 18,385 individuals in Canada. Respondents 18 years of age or over were selected randomly within the household. People participating in the telephone survey who had travelled in the past two years or expressed interest in travel in the next two years were asked to complete a mailback questionnaire. Usable questionnaires were received from 5,490 Ca-nadians and 6,405 (26.0 %) U.S. respondents. 2 The Canadian population 18 years of age or older was projected to the year 2026 and the corresponding USA population was aged to the year 2025. A special additional adjustment was made in the re-weighting of TAMS data to take into account an anticipated increase in the rate of educational achievement within the populations of both countries. In particular, it was assumed that the incidence of the highest level of educa-tion achieved in the period 1975 to 1999 represents a long term equilibrium of educational achievement. Figures for each sampling unit used in TAMS were supplied for aging the Canadian population and the USA by MTR. These projections included MTR’s adjustments for increased educational achievement and immi-gration flows for Canada. 3 It should be noted that population estimates used in this analysis were calculated by the two national statis-tical agencies prior to the September 11, 2001 terrorist attack in the United States. Any policy changes in immigration as a result of this event will not be reflected in these estimates. 4 See 2001 Canadian Travel Survey Tabulations provided to MTR in July, 2002, page P2-1. 5 5.1 million of the 7.6 million U.S. overnight person visits originated in New York, Pennsylvania, Michigan, Illinois, Wisconsin, Ohio, and Minnesota (2000 International Travel Survey Tabulations, P2-1). Indiana is not included in this estimate, but is included in the TAMS definition of the “Great Lakes States”. 6 All estimates of tourism volume are based on past two year overnight leisure trips. 7 See Big City Attractions tabulations prepared from TAMS for the Ontario Tourism Marketing Partnership, February, 2002. In the Toronto CMA – the likely reception site for many new immigrants to the province – those born outside Canada participate in outdoor activities such as canoeing, fishing and hunting at about half the rate as do Torontonians who were born in Canada. Participation rates in various urban and indoor-oriented activities such as museums, art galleries, theatre and concerts in their home community, favour Ca-nadian-born residents but are considerably closer for the two groups than is the case for outdoor activities. 8 See 2001 Canadian Travel Survey Tabulations provided to MTR in July, 2002. 9 Of the 6.1 million adult Ontario residents born in Canada, 45% are considered “hard core” leisure travellers within the province (2.8 million) whereas of the 2.8 million residents born outside Canada, only about 20% or 547,000 are considered “hard core” Ontario travellers. By “hard core”, we mean individuals who claim to have taken a leisure trip in Ontario in the past two years AND plan to take such a trip in the next two years. 10 See special tables on place of birth, table 9-1. 11 See special tables on place of birth, table 9-1. 12 For definitions of these high intensity groups, please refer to Who Wants What: Product-oriented tourism realities & opportunities for Ontario, Ontario Ministry of Tourism and Recreation, August 2001. 13 Soft Outdoor Adventure: Minimum of two of the following from the TAMS “activities on trips in past two years” list and not already categorized as “High Intensity Hard Outdoor Adventure”: recreational biking, biking as an overnight touring trip, any motorcycling, kayaking or canoeing, motor boating, sailing, wind surfing, hik-ing/backpacking, horseback riding, hot air ballooning, cross-county skiing, downhill skiing, snowboarding, any snowmobiling. No consumptive outdoor activities (hunting/fishing). Hard Outdoor Adventure: Took trip to ex-perience adventure and excitement in past 2 years and minimum of two of the following activities if one activity is white water rafting; if no white water rafting, any one of ice or rock climbing, mountain biking; dog sledding; hand-gliding; bungee jumping; heli-skiing; scuba diving. No consumptive outdoor activities (hunting/ fishing). High In-tensity Anglers: Mentioned the following from the TAMS “experiences/activities on trips in past two years” list:
26

Took trip to participate in hobby or sport (e.g., golf, fishing, photography) in past 2 years and either went fresh water or ice fishing . High Intensity Golfers: Mentioned the following from the TAMS “experiences/activities on trips in past two years” list: Took trip to participate in hobby or sport (e.g., golf, fishing, photography) in past 2 years and any of occasional golf game while travelling; stay at golf resort for one or more nights; take a packaged golf tour to play on various courses.
27