impact of the indian ocean high pressure system on winter ... · impact of the indian ocean high...
TRANSCRIPT
159
Australian Meteorological and Oceanographic Journal 61 (2011) 159–170
Impact of the Indian Ocean high pressure system on winter precipitation over western
and southwestern Australia
(Manuscript received May 2010; Revised October 2011)
Sultan Hameed1, M.J. Iqbal2, Saqib-ur-Rehman2, Dean Collins3
1School of Marine and Atmospheric Sciences, Stony Brook University, NY 2Department of Mathematics, University of Karachi, Karachi
3Bureau of Meteorology, Melbourne, Australia
Introduction
The decrease in winter precipitation in southwest Western Australia (SWWA) has been investigated in several observational and modelling studies and a review can be found in Nicholls (2006). It has been recognized that inter-annual rainfall variations over SWWA are related to variations in atmospheric pressure over SWWA and over the surrounding region including the Indian Ocean (Allan and Haylock 1993; Smith et al. 2000). Averaged June–July pressures over SWWA have increased in recent decades (Hope et al. 2006). On the synoptic time scale, the number of low pressure systems crossing the southwest region has declined (Simmonds and Keay 2000 ; Smith et al. 2000; Hope et al. 2006).
Causes for the decline in winter rainfall have been investigated in climate models. Narisma and Pitman (2003) and Pitman et al. (2004) showed that rainfall in this region is sensitive to the amount of local vegetation. They found that an increase in SWWA rainfall occurs if the vegetation cover in a regional climate model is switched from its present distribution to the one estimated for the 18th century. Global climate models (GCMs) have been used to probe causes of decline in rainfall in SWWA rainfall but the results are equivocal (Nicholls 2006). One difficulty is that SWWA consists of only a few grid points of a typical global climate model; it is therefore difficult to obtain a reliable calculation of regional climate change from GCM simulations. Grotch and MaCracken (1991) pointed out that eight grid points represent the minimum scale of meaningful information from GCM simulations. Nonetheless, it is interesting to note that examination of 20th century rainfall simulations at the one grid point closest to SWWA in eight Intergovernmental
Corresponding author address: Sultan Hameed, School of Marine and At-mospheric Sciences, Stony Brook University, NY 11794-5000email: [email protected]
Previous studies have linked ongoing winter drought in southwest Western Aus-tralia (SWWA) to changes in local, as well as large-area, sea-level pressure. Be-cause the area of SWWA occupies only a few grid points of a typical global climate model (GCM), it is difficult to infer the possible role of global climate change in the drought in SWWA. Since the Indian Ocean High is a robust and large scale fea-ture of atmospheric general circulation, it is simulated qualitatively in all GCMs. A quantitative comparison of the simulated past changes in its pressure and position in a GCM with those found in reanalysis data can be used to verify its suitability in projecting future changes in winter rainfall in southwest Western Australia. This paper examines the linkages between changes in the Indian Ocean High and rainfall in SWWA, as well as a larger section of Western Australia. By introduc-ing objective indices for area-weighted pressure, the area-weighted latitude and longitude positions of the High, this analysis shows that winter rainfall in a large section of Western Australia and in SWWA is significantly correlated with lon-gitudinal displacement of the Indian Ocean High. Rainfall in SWWA is also cor-related with the area-averaged pressure of the High. A regression model of May to August rainfall in SWWA using the pressure and longitude of the Indian Ocean High as independent variables explains 52 per cent of the rainfall variance during 1951–2008.

160 Australian Meteorological and Oceanographic Journal 61:3 September 2011
Panel on Climate Change (IPCC) coupled ocean atmosphere global climate models showed that all the models calculated decreases in June–July rainfall ranging from two to seventeen per cent during 1976 to 2000 (Hope 2006). It is well known that global climate models can simulate large scale features of atmospheric circulation more successfully than regional and local changes. Downscaling methods can be used to relate changes in large scale patterns to local phenomena. Timbal et al. (2006) used a downscaling method in which winter rainfall at stations in SWWA was related to large-scale sea-level pressure and rainfall by regression methods over an area surrounding and including the Australian continent. Results using the output of an atmosphere-ocean GCM forced with natural forcings were compared to the results with simulations in which the model was forced with natural plus anthropogenic forcings. Greater decline in rainfall was estimated from the model runs with anthropogenic forcings but the timing of the rainfall decline was incorrect. Timbal et al. (2006) concluded that anthropogenic influences seem to have contributed to the decline in rainfall but the evidence is ambiguous. The Southern Annular Mode (SAM) is the leading empirical orthogonal function of winter sea-level pressure over the southern hemisphere and its principal component is correlated with rainfall over SWWA (Cai et al. 2005; Cai and Cowan 2006; Meneghini et al. 2006; Hendon et al. 2007). This study aims to investigate the variability of winter precipitation over Western Australia using the Centres Of Action (COA) approach. The large-scale semi-permanent High and Low pressure centres which are prominent on a global map of monthly averaged sea-level pressure were called the ‘centres of action’ by Rossby et al. (1939). A key point noted by Rossby et al. was that changes not only in the pressure, but also the position of a centre of action
influence regional circulation. In the scheme used in this paper a COA is characterized by three indices representing its area-averaged longitude, latitude and pressure. Figure 1 shows the distribution of sea-level pressure in the southern subtropical Indian and Pacific Oceans during the austral winter (May to August) over 1971–2000. Australia is seen to be flanked by the Indian Ocean High to the west and the South Pacific High to the east. The Indian Ocean High (IOH) is seen to be stronger and situated closer to Western Australia. The results presented in this paper suggest that change in the longitude position of the Indian Ocean High is one of the factors that influence winter rainfall in SWWA and over a larger section of Western Australia. Rainfall in SWWA, in addition, is significantly correlated with the area-averaged pressure of the IOH. Our results indicate the South Pacific High does not influence winter rainfall in Western Australia. However, in a separate paper we plan to present results that both of these centres significantly influence rainfall variations in southeast Australia. Recently, the COA approach has been found to be useful in investigations of a number of regional phenomena. Hameed and Piontkovski (2004) showed that the inter-annual variability of Gulf Stream northwall position has higher correlation with the longitude position of the Icelandic Low than with the North Atlantic Oscillation (NAO). The variability of the transport of Saharan dust to the tropical Atlantic in winter has a higher correlation with the latitude position of the Azores High than with the NAO (Riemer et al. 2006) and the transport of dust to the Caribbean islands in summer is governed by the longitude of the Azores High (Doherty et al. 2008). The Greenland Tipjet, which is associated with deep water formation in the Irminger Sea, is related to the latitude position of the Icelandic Low (Bakalian et al. 2007). Variations in winter rainfall in northern South
Fig. 1 Climatological mean winter sea-level pressure (1971–2000) shows the Indian Ocean High and the South Pacific High pres-sure systems to the west and east of Australia, respectively.

Hameed et al.: Impact of Indian Ocean high pressure system on winter precipitation 161
Asia are related to changes in Icelandic Low pressure (Iqbal and Ilyas 2011).
Data
The monthly historical Australian rainfall data used in this study is based on a new high-resolution (0.25° x 0.25°) gridded dataset developed by the Australian Bureau of Meteorology (Jones et al. 2009). The dataset was developed using topography-resolving analysis methods applied to all available rainfall station data passed by a series of internal quality tests. It is the best available dataset for the analysis of climate variability and change in Australian rainfall. Monthly averaged gridded mean sea-level pressure (MSLP) data from the National Center for Environmental Prediction (NCEP) reanalysis on a 2.5° x 2.5° grid (Kalnay et al. 1996) for 1948–2008 were used for calculating objective COA indices for the monthly averaged pressure, latitude and longitude of the Indian Ocean High and the South Pacific High systems, as described by Hameed and Piontkovski (2004). The NCEP reanalysis was also used for constructing composite maps to understand meteorological changes that accompany different extreme conditions of the Indian Ocean High. Rainfall in Australia was also correlated with the Southern Oscillation Index (SOI) and the Indian Ocean Dipole Mode monthly index. The SOI index is available at the Climate Data Centre, National Centers for Environmental Prediction. Indices for SAM prior to 1979 are based on very limited observations because there are only a small number of stations over the high latitudes of the southern hemisphere. Several SAM indices are available; we use the index based on Marshall (2003) available from David Thompson’s website. This SAM index is close to the index previously used in studies of SWWA precipitation by Cai and Cowan (2006). All calculations in this paper are for the season from May to August (MJJA).
Method
An estimate of the influence of atmospheric pressure fluctuations on rainfall variability over Australia can be attained through a quantitative assessment of the fluctuation in the pressure and locations of the Indian Ocean High and the South Pacific High, the two atmospheric centres of action that flank Australia. The pressure index Ip of a High pressure system can be defined as an area-weighted pressure departure from a threshold value over the domain (I, J) as suggested by Hameed et al. (1995) and Santer (1988):
Where Pi j , Δt is the MSLP value at grid point (i, j) averaged over a time interval Δt, in this case monthly MSLP values are taken from NCEP reanalysis, Pt is the threshold MSLP value (Pt = 1016 hPa for both the Indian Ocean High and the South Pacific High), φi j is the latitude of the grid point (i, j). δ = 1 if (Pi j, Δt – Pt) > 0 and δ = 0 if (Pi j, Δt – Pt) < 0. This ensures that the pressure difference is due to the High pressure system. The intensity is thus a measure of the anomaly of the atmospheric mass over the section (I, J). The domain of the Indian Ocean High was chosen as 10°S to 45°S and 40°E to 120°E and that of the South Pacific High as 10°S to 45°S and 160°E to 70°W. The domains of the two Highs and their threshold values Pt were chosen by examining their geographical ranges in NCEP reanalysis data over the period 1948–2006. Similarly, the latitudinal index is defined as:
Iφ,Δ t = (Pij, Δt – Pt)φijcosφijδij,Δ t
(Pij, Δt – Pt)cosφijδij,Δ t
i = 1 j = 1S S
I J
i = 1 j = 1S S
I J
Ip,Δ t = (Pij, Δt – Pt)cosφijδij,Δ t
i = 1 j = 1S S
I J
i = 1 j = 1S S
I J
cosφijδij,Δ t
and the longitudinal index Iλ, Δt is defined in an analogous
manner.
Results
We have calculated correlations between the pressure, latitude and longitude of the Indian Ocean High (IOH), the South Pacific High (SPH) and precipitation over Australia for the winters of 1951–2008. In this paper, we present results that relate to variability of precipitation over Western Australia. The shaded areas in Fig. 2(a) are those where the correlation between precipitation and IOH pressure is significant at the p < 0.05 level. A region in the southwest is identified as significantly related to IOH pressure. The correlation between winter precipitation and Indian High longitude is shown in Fig. 2(b) where we see a large region of Western Australia (approximately 113–126°E, 20–35°S) is significantly influenced by zonal movement of the Indian High. The smaller strip of the southwest recognized in Fig. 2(a) as correlated with the IOH pressure is a sub-region of the larger section of the west in Fig. 2(b) which is correlated with the IOH longitude. An interesting question is whether the IOH pressure and IOH longitude provide independent information about precipitation in the sub-region. Based on these results, we have selected two regions for further investigation:
(1) West Australia (2) Southwest Western Australia (SWWA)
Note that the region defined here as west Australia (113–126°E, 20–35°S) is smaller than the State of Western Australia and excludes the tropical northern parts of the State as well as the strip east of 126°E; west Australia is mostly a desert where annual precipitation averages less than 25 cm per year.
162 Australian Meteorological and Oceanographic Journal 61:3 September 2011
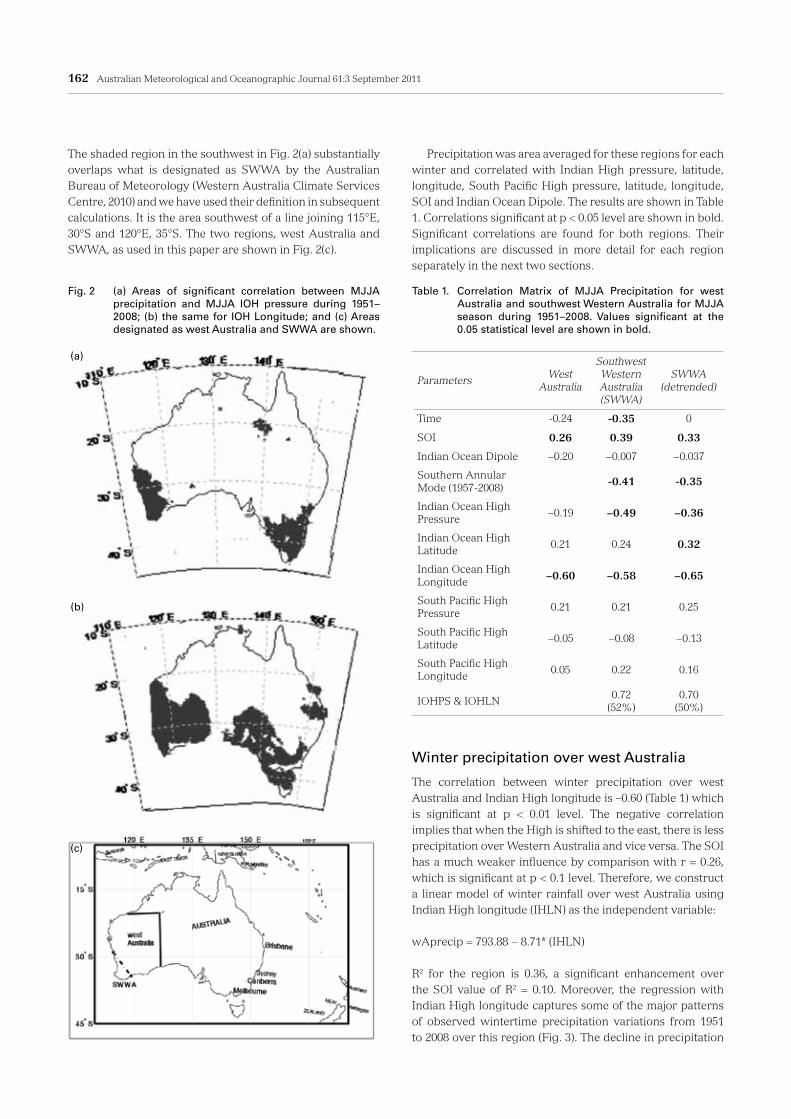
The shaded region in the southwest in Fig. 2(a) substantially overlaps what is designated as SWWA by the Australian Bureau of Meteorology (Western Australia Climate Services Centre, 2010) and we have used their definition in subsequent calculations. It is the area southwest of a line joining 115°E, 30°S and 120°E, 35°S. The two regions, west Australia and SWWA, as used in this paper are shown in Fig. 2(c).
Precipitation was area averaged for these regions for each winter and correlated with Indian High pressure, latitude, longitude, South Pacific High pressure, latitude, longitude, SOI and Indian Ocean Dipole. The results are shown in Table 1. Correlations significant at p < 0.05 level are shown in bold. Significant correlations are found for both regions. Their implications are discussed in more detail for each region separately in the next two sections.
Winter precipitation over west Australia
The correlation between winter precipitation over west Australia and Indian High longitude is –0.60 (Table 1) which is significant at p < 0.01 level. The negative correlation implies that when the High is shifted to the east, there is less precipitation over Western Australia and vice versa. The SOI has a much weaker influence by comparison with r = 0.26, which is significant at p < 0.1 level. Therefore, we construct a linear model of winter rainfall over west Australia using Indian High longitude (IHLN) as the independent variable:
wAprecip = 793.88 − 8.71* (IHLN)
R2 for the region is 0.36, a significant enhancement over the SOI value of R2 = 0.10. Moreover, the regression with Indian High longitude captures some of the major patterns of observed wintertime precipitation variations from 1951 to 2008 over this region (Fig. 3). The decline in precipitation
Fig. 2 (a) Areas of significant correlation between MJJA precipitation and MJJA IOH pressure during 1951–2008; (b) the same for IOH Longitude; and (c) Areas designated as west Australia and SWWA are shown.
(a)
(b)
(c)
Table 1. Correlation Matrix of MJJA Precipitation for west Australia and southwest Western Australia for MJJA season during 1951–2008. Values significant at the 0.05 statistical level are shown in bold.
Parameters West Australia
Southwest Western Australia (SWWA)
SWWA(detrended)
Time -0.24 -0.35 0
SOI 0.26 0.39 0.33
Indian Ocean Dipole −0.20 −0.007 −0.037
Southern Annular Mode (1957-2008) -0.41 -0.35
Indian Ocean High Pressure
−0.19 −0.49 −0.36
Indian Ocean High Latitude
0.21 0.24 0.32
Indian Ocean High Longitude −0.60 −0.58 −0.65
South Pacific High Pressure
0.21 0.21 0.25
South Pacific High Latitude
−0.05 −0.08 −0.13
South Pacific High Longitude
0.05 0.22 0.16
IOHPS & IOHLN0.72
(52%)0.70
(50%)

Hameed et al.: Impact of Indian Ocean high pressure system on winter precipitation 163
in 1959–60 followed by the maximum in 1965 is reproduced by the regression. Similarly the maximum in precipitation and the subsequent decline until 1977 is seen to be captured by the regression model. During 1979–1993 west Australia precipitation fluctuated in a narrow range. Figure 3 shows that the IOH spanned a narrow range of east-west fluctuations during these years. The subsequent increase in precipitation during the 1990s is also captured by the regression model; however the estimated values for 2001 and 2002 are much larger than the observations.
Winter precipitation over southwest Western Australia
As shown in Table 1, the average winter precipitation over the SWWA region has significant correlations with the Indian High pressure, Indian High longitude, SOI and the Southern Annular Mode (SAM); the correlation coefficient with the SOI and SAM are smaller than the correlations with the IOH pressure or longitude. The correlation with Indian Ocean
Dipole is negligible. In order to evaluate interdependencies among these variables we calculated their correlation matrix shown in Table 2. We note that the IOH pressure (IHPS) and longitude are independent of each other while the SOI and SAM have statistically significant correlations with both the IOH pressure and IOH longitude. The SOI has a statistically significant correlation with the Indian Ocean Dipole, while it is not correlated with the Southern Annular Mode. The SAM is also not correlated with the IOD. Khalia et al. (2009) showed in their Fig. 5(e) that annually averaged MSLP over all of Australia is negatively correlated with the SOI during 1950–2005, thus an ENSO influence on inter-annual rainfall variability over all regions of Australia is to be expected. In order to gain some insight as to which of the mutually correlated variables most directly influence SWWA precipitation it is useful to consider their partial correlation coefficients with the precipitation. The first column in Table 3 lists the variables which were correlated with the SWWA winter rainfall while adjusting for the other variables, and the resulting partial correlations are given in the second column.
Fig. 3 West Australia precipitation (MJJA) compared with regression with IOH longitude.
Table 2. Correlation Matrix for Indian Ocean High pressure, Indian Ocean High Longitude, SOI, Indian Ocean Dipole and the South-ern Annular Mode for MJJA season during 1951–2008. Values significant at the 0.05 statistical level are shown in bold.
Indian Ocean High pressure
Indian Ocean High Longitude
SOI Indian Ocean Dipole Southern Annular Mode
Indian Ocean High pressure 1.00 0.17 −0.39 0.15 0.67
Indian Ocean High Longitude 0.17 1.00 −0.33 0.31 0.31
SOI −0.39 −0.33 1.00 −0.35 -0.16
Indian Ocean Dipole (IOD) 0.15 0.31 −0.35 1.00 0.23
Southern Annular Mode 0.67 0.31 −0.16 0.23 1.00
164 Australian Meteorological and Oceanographic Journal 61:3 September 2011
The results clearly show that the unique contributions of IOH pressure and longitude to the variability of SWWA winter precipitation exceed those of the SOI, IOD and SAM. Cai and Cowan (2006) have studied the relationship between SWWA JJA rainfall and the Southern Annular Mode during 1950–1999 by using a modification of the SAM data of Marshall (2003). They did not use the principal component of the EOF which is commonly considered as the SAM index, but instead considered the inter-annual change in the average sea-level pressure in the EOF pattern and found its correlation with SWWA rainfall to be −0.30 which is statistically significant at the 95 per cent confidence level. Considering that Cai and Cowan (2006) used a non-standard SAM index for JJA (our calculation is for MJJA) their result is not inconsistent with the correlation between SAM and SWWA rainfall we report in Table 1. However, the partial
correlations in Table 3 show that the Indian Ocean High, not SAM, is the direct driver of SWWA precipitation. As Indian Ocean High pressure and Indian Ocean longitude are mutually independent, we construct a linear model of winter rainfall over SWWA which yields:
SWWAprecip = 6.02 x 10⁴ − 12.6* (IHLN) − 57.8* (IHPS)
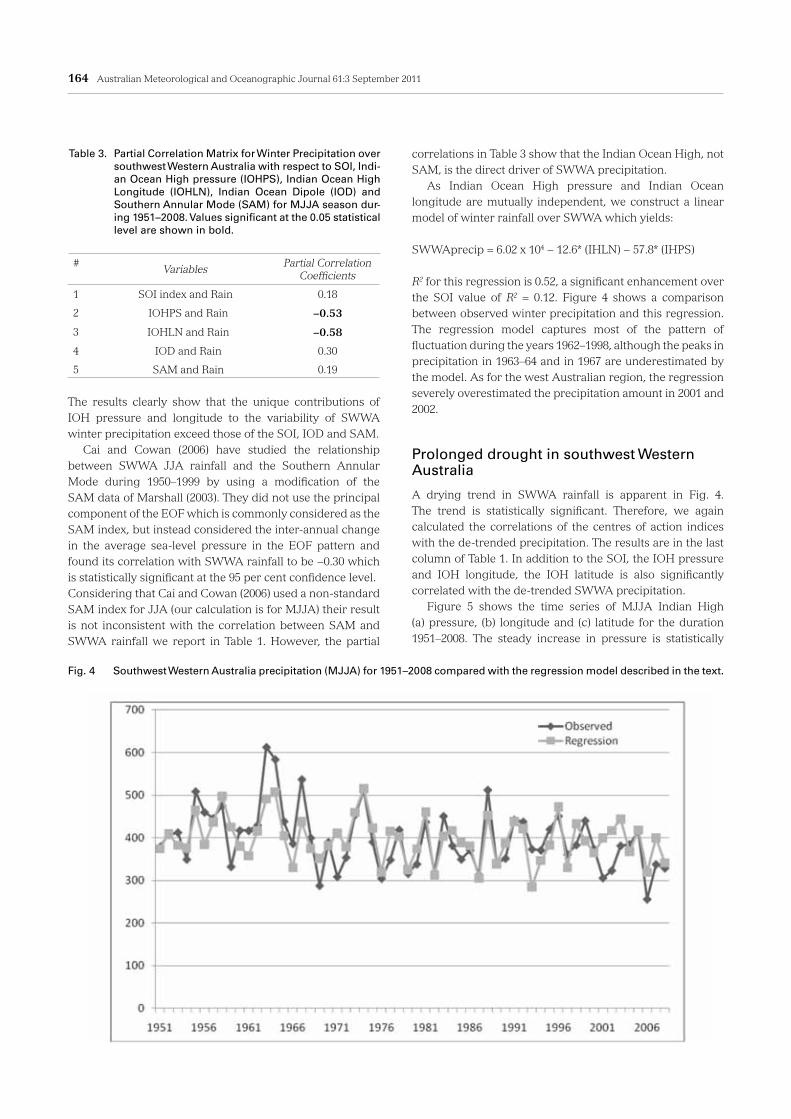
R2 for this regression is 0.52, a significant enhancement over the SOI value of R2 = 0.12. Figure 4 shows a comparison between observed winter precipitation and this regression.The regression model captures most of the pattern of fluctuation during the years 1962–1998, although the peaks in precipitation in 1963–64 and in 1967 are underestimated by the model. As for the west Australian region, the regression severely overestimated the precipitation amount in 2001 and 2002.
Prolonged drought in southwest Western Australia
A drying trend in SWWA rainfall is apparent in Fig. 4. The trend is statistically significant. Therefore, we again calculated the correlations of the centres of action indices with the de-trended precipitation. The results are in the last column of Table 1. In addition to the SOI, the IOH pressure and IOH longitude, the IOH latitude is also significantly correlated with the de-trended SWWA precipitation. Figure 5 shows the time series of MJJA Indian High (a) pressure, (b) longitude and (c) latitude for the duration 1951–2008. The steady increase in pressure is statistically
Table 3. Partial Correlation Matrix for Winter Precipitation over southwest Western Australia with respect to SOI, Indi-an Ocean High pressure (IOHPS), Indian Ocean High Longitude (IOHLN), Indian Ocean Dipole (IOD) and Southern Annular Mode (SAM) for MJJA season dur-ing 1951–2008. Values significant at the 0.05 statistical level are shown in bold.
# Variables Partial Correlation Coefficients
1 SOI index and Rain 0.18
2 IOHPS and Rain −0.53
3 IOHLN and Rain −0.58
4 IOD and Rain 0.30
5 SAM and Rain 0.19
Fig. 4 Southwest Western Australia precipitation (MJJA) for 1951–2008 compared with the regression model described in the text.

Hameed et al.: Impact of Indian Ocean high pressure system on winter precipitation 165
significant. The pressure of the High decreased during the early part of the record (1951–1962), and we can see a corresponding increase in precipitation in SWWA (Fig. 4) during this period. In Fig. 5(b) for IOH longitude we notice that it mostly fluctuates between 64°E and 74°E. There is a slight westward trend but it is not statistically significant. In Fig. 5(c) for IOH latitude we can notice a minor northward trend. The major anomaly during this period is the southward shift of the High during 1968–71 and the northward shift during 1971–1977. In the regression equation for SWWA, both IOH pressure and longitude contribute to precipitation but Fig. 5 shows that the drying trend is primarily due to the increase in IOH pressure, and changes in longitude contribute primarily to inter-annual fluctuations in precipitation. The multi-decadal strengthening of the Indian High pressure is likely due to an increase in subsidence associated with Hadley Circulation.
This result is consistent with that of Mitas and Clement (2006) who showed a statistically significant intensification of their Hadley circulation indices throughout the second part of the 20th century. Impacts of anthropogenically induced climate change have been simulated in the IPCC AR4 GCMs. These projections show decreases in (Precipitation – Evaporation) from the first twenty years to the last twenty years of the 21st century over the region encompassing the Indian Ocean High and Australia (Lu et al. 2007; Previdi and Liepert 2007). However, in the AR4 GCMs this change corresponds to a weakening of the zonally averaged Hadley circulation and its poleward expansion. As seen in Fig. 5(c), the latitude position of the IOH has not yet manifested a significant trend during 1951–2008.
Mechanisms for relationships between the Indian Ocean High and the variability of precipitation in west Australia
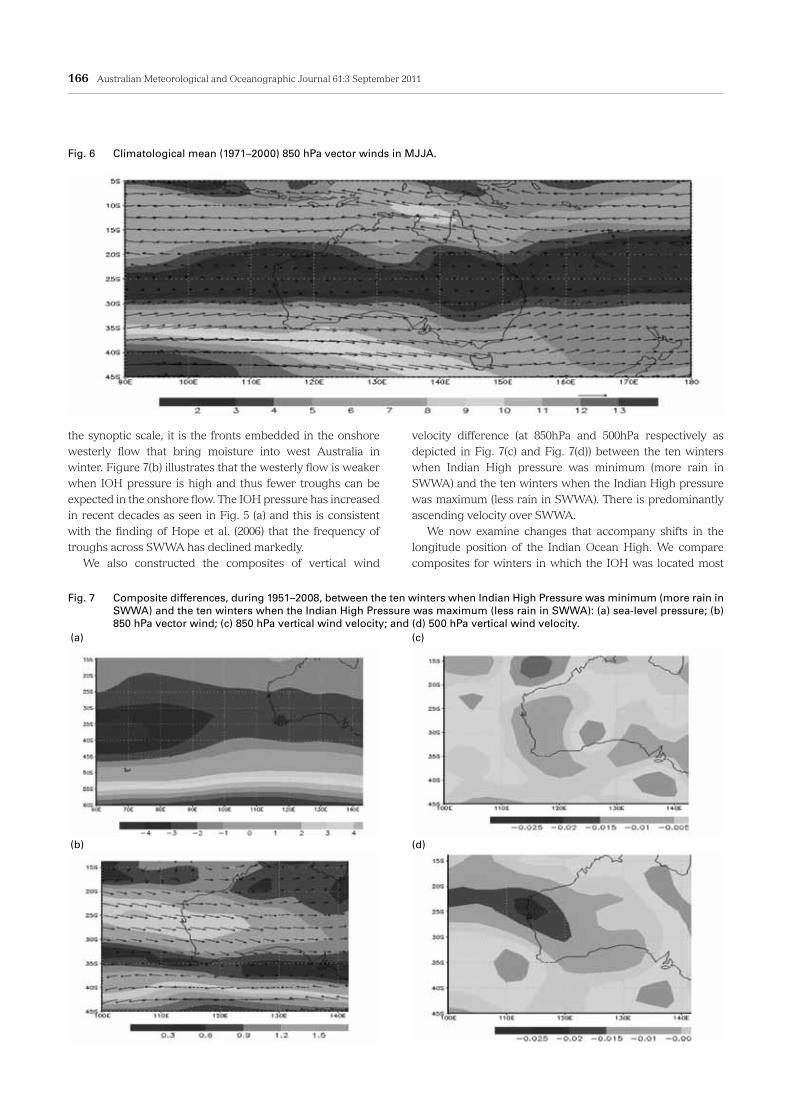
In this section we examine evidence that regional circulations of the atmosphere are consistent with the empirically determined relationships obtained above. For this purpose, we use the NCEP/NCAR reanalysis monthly averaged fields of winds, temperature and pressure. Westerly disturbances provide most of the moisture to Western Australia (Hope et al. 2006). This is illustrated in Fig. 6 which shows the climatology of 850 hPa vector winds for 1971 to 2000. The wind distribution is consistent with the distribution of atmospheric pressure seen in Fig. 1. There is flow from the west on the southern flank of the IOH bringing moisture into southern Australia and the easterly flow to the north of the IOH along the north coast of the country. Figure 6 illustrates that the Indian Ocean High dominates atmospheric circulations that bring moisture to SWWA. We examine changes in the distribution of meteorological variables in the region that correspond to changes in the IOH pressure by considering composites for the ten winters in which the IOH pressure was the lowest during 1951–2008 (these winters were in increasing order of IOH pressure 1962, 1963, 1955, 1974, 1959, 1977, 1960, 1988, 1981 and 1975) and the composites for the ten winters in which the IOH pressure was the highest (in decreasing order of IOH pressure 1993, 1989, 1982, 1997, 2004, 1979, 1980, 1987, 2000 and 1994). Figure 7(a) shows the composite differences of sea-level pressure between the ten winters when Indian High pressure was minimum (more rain in SWWA) and the ten winters when the IOH pressure was maximum (less rain in SWWA). We see low pressure anomalies of about 2 hPa extend across the southern half of Australia into the Pacific Ocean beyond New Zealand. Figure 7(b) shows the composite differences of 850 hPa vector wind between the ten winters when IOH pressure was minimum (more rain in SWWA) and the ten winters when the IOH pressure was maximum (less rain in SWWA). Westerly wind anomalies exceeding 1.5 m/s from the Indian Ocean to Western Australia are seen between 30°S and 22°S. On
Fig. 5 Time series of Indian Ocean High properties: (a) pres-sure; (b) longitude; and (c) latitude.
(a)
(b)
(c)
166 Australian Meteorological and Oceanographic Journal 61:3 September 2011
the synoptic scale, it is the fronts embedded in the onshore westerly flow that bring moisture into west Australia in winter. Figure 7(b) illustrates that the westerly flow is weaker when IOH pressure is high and thus fewer troughs can be expected in the onshore flow. The IOH pressure has increased in recent decades as seen in Fig. 5 (a) and this is consistent with the finding of Hope et al. (2006) that the frequency of troughs across SWWA has declined markedly. We also constructed the composites of vertical wind
velocity difference (at 850hPa and 500hPa respectively as depicted in Fig. 7(c) and Fig. 7(d)) between the ten winters when Indian High pressure was minimum (more rain in SWWA) and the ten winters when the Indian High pressure was maximum (less rain in SWWA). There is predominantly ascending velocity over SWWA. We now examine changes that accompany shifts in the longitude position of the Indian Ocean High. We compare composites for winters in which the IOH was located most
Fig. 6 Climatological mean (1971–2000) 850 hPa vector winds in MJJA.
Fig. 7 Composite differences, during 1951–2008, between the ten winters when Indian High Pressure was minimum (more rain in SWWA) and the ten winters when the Indian High Pressure was maximum (less rain in SWWA): (a) sea-level pressure; (b) 850 hPa vector wind; (c) 850 hPa vertical wind velocity; and (d) 500 hPa vertical wind velocity.
(a)
(b) (d)
(c)
Hameed et al.: Impact of Indian Ocean high pressure system on winter precipitation 167
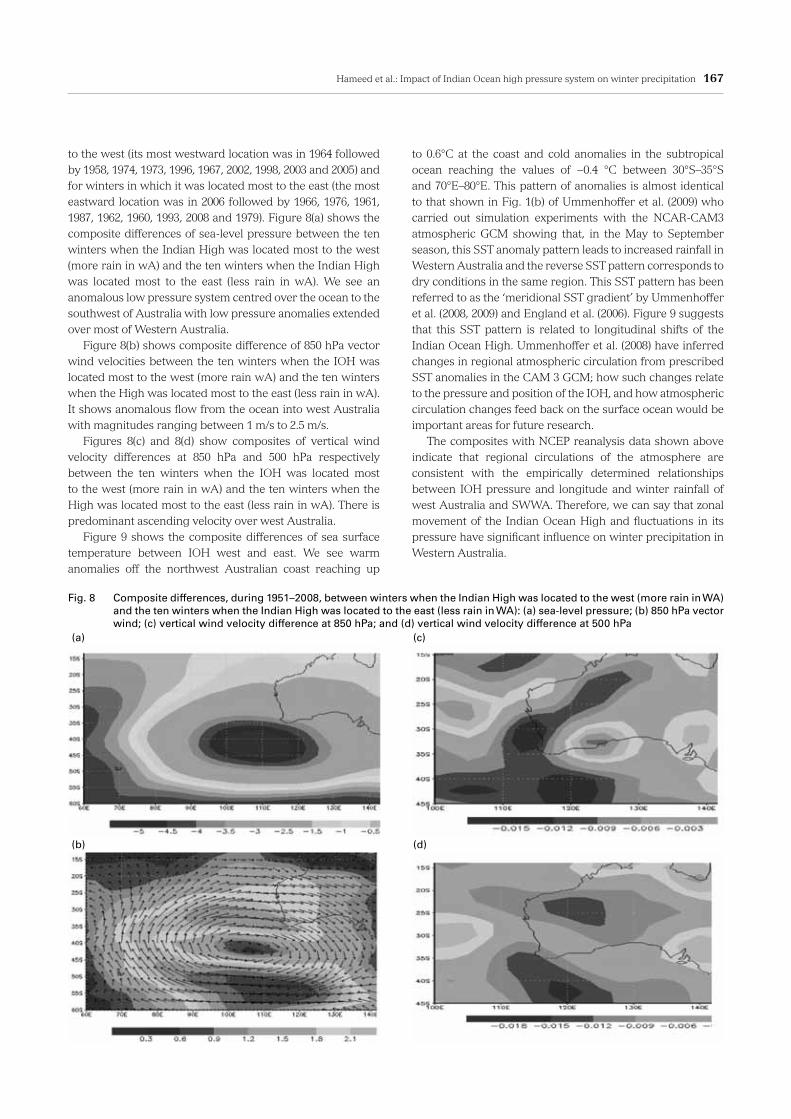
to the west (its most westward location was in 1964 followed by 1958, 1974, 1973, 1996, 1967, 2002, 1998, 2003 and 2005) and for winters in which it was located most to the east (the most eastward location was in 2006 followed by 1966, 1976, 1961, 1987, 1962, 1960, 1993, 2008 and 1979). Figure 8(a) shows the composite differences of sea-level pressure between the ten winters when the Indian High was located most to the west (more rain in wA) and the ten winters when the Indian High was located most to the east (less rain in wA). We see an anomalous low pressure system centred over the ocean to the southwest of Australia with low pressure anomalies extended over most of Western Australia. Figure 8(b) shows composite difference of 850 hPa vector wind velocities between the ten winters when the IOH was located most to the west (more rain wA) and the ten winters when the High was located most to the east (less rain in wA). It shows anomalous flow from the ocean into west Australia with magnitudes ranging between 1 m/s to 2.5 m/s. Figures 8(c) and 8(d) show composites of vertical wind velocity differences at 850 hPa and 500 hPa respectively between the ten winters when the IOH was located most to the west (more rain in wA) and the ten winters when the High was located most to the east (less rain in wA). There is predominant ascending velocity over west Australia. Figure 9 shows the composite differences of sea surface temperature between IOH west and east. We see warm anomalies off the northwest Australian coast reaching up
to 0.6°C at the coast and cold anomalies in the subtropical ocean reaching the values of −0.4 °C between 30°S–35°S and 70°E–80°E. This pattern of anomalies is almost identical to that shown in Fig. 1(b) of Ummenhoffer et al. (2009) who carried out simulation experiments with the NCAR-CAM3 atmospheric GCM showing that, in the May to September season, this SST anomaly pattern leads to increased rainfall in Western Australia and the reverse SST pattern corresponds to dry conditions in the same region. This SST pattern has been referred to as the ‘meridional SST gradient’ by Ummenhoffer et al. (2008, 2009) and England et al. (2006). Figure 9 suggests that this SST pattern is related to longitudinal shifts of the Indian Ocean High. Ummenhoffer et al. (2008) have inferred changes in regional atmospheric circulation from prescribed SST anomalies in the CAM 3 GCM; how such changes relate to the pressure and position of the IOH, and how atmospheric circulation changes feed back on the surface ocean would be important areas for future research. The composites with NCEP reanalysis data shown above indicate that regional circulations of the atmosphere are consistent with the empirically determined relationships between IOH pressure and longitude and winter rainfall of west Australia and SWWA. Therefore, we can say that zonal movement of the Indian Ocean High and fluctuations in its pressure have significant influence on winter precipitation in Western Australia.
Fig. 8 Composite differences, during 1951–2008, between winters when the Indian High was located to the west (more rain in WA) and the ten winters when the Indian High was located to the east (less rain in WA): (a) sea-level pressure; (b) 850 hPa vector wind; (c) vertical wind velocity difference at 850 hPa; and (d) vertical wind velocity difference at 500 hPa
(a)
(b) (d)
(c)

168 Australian Meteorological and Oceanographic Journal 61:3 September 2011
Conclusions
Previous researchers have identified increases in sea-level pressures in southwest Western Australia as the immediate cause of the ongoing drought in this region. The present paper has examined this relationship in terms of the dynamics of the Indian Ocean High pressure system. Specifically, it was found that east-west shifts in the position of this subtropical high significantly influence winter rainfall in west Australia and SWWA. When the Indian Ocean High shifts to the west, rainfall in west Australia and SWWA increases, and vice versa. In addition, rainfall in SWWA is significantly and negatively correlated with the area-averaged pressure of the Indian Ocean High. The pressure and the longitude position of the IOH are not significantly correlated with each other. A statistical model of MJJA rainfall in SWWA using the IOH pressure and longitude as independent variables is presented. It explains 52 per cent of the observed rainfall variance during 1951–2008. Marshall (2003) pointed out that pressure from NCEP reanalysis in the high latitudes of the southern hemisphere has spurious negative trends, particularly in austral winter. We have repeated the calculations presented in this paper with ERA-40 reanalysis data. The ERA-40 reanalysis is available for 1957–2002 and it confirmed the results presented in this paper. Specifically, the Indian Ocean High pressure has a statistically significant positive trend in the ERA-40 data, as it does in the NCEP data. Also, winter precipitation in SWWA has statistically significant correlation with the IOH pressure and longitude. The causes of rainfall reduction in SWWA in July was investigated by Frederiksen and Frederiksen (2007) with the
use of a two-level primitive equation instability model with the 1949–1968 and 1975–1994 NCEP reanalyzed basic states. They found changes in the properties of the leading southern hemisphere cyclogenesis modes: the fastest growing mode for 1975–1994 grew 30 per cent slower than for 1949–1968. This and other results found by Frederiksen and Frederiksen (2007) suggest that rainfall reduction over SWWA has been caused by a reduction of the intensity of cyclogenesis (as observed by Hope et al. 2006) and the southward deflection of some storms, and that these changes in the transient instabilities are in turn attributable to the changes in the large-scale southern hemisphere circulation. The results obtained in the present paper suggest that the cause of this change in the large-scale circulation is the increase in pressure of the Indian Ocean High.. It is noteworthy that winter rainfall in west Australia and SWWA is much more sensitive to changes in the pressure and longitudinal position of the Indian Ocean High than it is to fluctuations of sea surface temperatures as represented by the Indian Ocean Dipole. The results presented in this paper offer an alternate pathway to diagnosing the role of global climate change in the progression of drought in SWWA. Timbal et al. (2006) in their Table 1 have demonstrated the difficulty in inferring rainfall trends in a small region from a few grid points in a GCM. They deployed a downscaling scheme which relates rainfall in southwest Western Australia to sea-level pressure and total rainfall over a large region surrounding the Australian continent. Positive and negative trends in both variables are present in subregions of the large region used in the downscaling scheme. The results presented in this paper would suggest examination of the Indian Ocean High
Fig. 9 Composite differences of sea surface temperature between the ten winters when the Indian High was located to the west and the ten winters when it was to the east.

Hameed et al.: Impact of Indian Ocean high pressure system on winter precipitation 169
in the GCMs. The Indian Ocean High, like other subtropical highs, is a coherent permanent feature of the climate system. Its genesis is in the subsidence of air in the local downward arm of Hadley circulation. Hope (2006) has discussed some aspects of the Indian Ocean High in several coupled GCMs used in the IPCC AR4. A more quantitative comparison of the area-weighted pressure and position of the High with those in reanalysis data can shed light on model skill in calculating regional rainfall in west Australia and southwest Western Australia, and projecting these quantities into the future. Another important reason for investigating the IOH is its role in Hadley circulation. Several recent studies have presented evidence that the subsiding branch of the Hadley circulation is moving poleward as a consequence of global warming (Mitas and Clement 2006; Lu et al. 2007; Hu and Fu 2007; Previdi et al. 2007; Gastineau et al. 2008). However, the evidence presented in these papers is in terms of the zonally symmetric quantities, but the real atmosphere is zonally asymmetric and regional impacts of changes in Hadley circulation have to be understood in terms of local factors. The poleward branch of the Hadley cell is characterized by subsidence, particularly in the regions of the subtropical Highs. In Fig. 5 we see that the IOH has registered increase in its area-averged pressure in recent decades but there is no significant shift in its latitude position. How this observation is to be reconciled with the poleward shift of the zonally averaged circulation would be an interseting area of future investigation. Each subtropical High is fed by its own set of zonally asymmetric sources of diabatic heating. While some work has been carried out in understanding the origins of the subtropical Highs in the northern hemisphere (Davis et al. 1997; Seager et al. 2003; Chen et al. 2001) there is much less understanding of the Indian Ocean High. In view of the role the IOH plays in the variability of weather and climate of Australia, it is important to investigate the sources of variations in its pressure as well as its latitudinal and longitudinal displacements.
ReferencesAllan, R.J. and Haylock, M.R. 1993. Circulation features associated with
the winter rainfall decrease in southwestern Australia. J. Clim., 6, 1356–67.
Bakalian F.M., Hameed, S. and Pickart R. 2007. Influence of the Icelandic Low Latitude on the frequency of Greenland Tip Jet Events: Implica-tions for Irminger Sea convection. J. Geophys. Res., 112, C04020.
Cai, W., Shi G. and Li, Y. 2005. Multidecadal fluctuations of winter rain-fall over southwest Western Australia simulated in the CSIRO Mark 3 coupled model, Geophys. Res. Lett., 32, L12701.
Cai, W. and Cowan, T. 2006. SAM and regional rainfall in IPCC AR4 mod-els: Can anthropogenic forcing account for southwest Western Aus-tralian winter rainfall reduction? Geophys. Res. Lett., 33, L24708.
Chen, P., Hoerling, M.P. and Dole, R.M. 2001. The Origin of the Subtropi-cal Anticyclones. J. Atmos. Sci., 58, 1827–1835.
Davis, R.E., Hayden, B.P., Gay, D.A., Phillips, W.L. and Jones, G.V. 1997. The North Atlantic Subtropical Anticyclone. J. Clim., 10, 728–744.
Doherty, O.M., Riemer, N. and Hameed, S. 2008. Saharan mineral dust transport into the Caribbean: Observed atmospheric controls and trends, J. Geophys. Res., 113, D07211, doi:10.1029/2007JD009171.
England, M.H., Ummenhofer, C.C. and Santoso, A. 2006. Inter-annual rainfall extremes over southwest Western Australia linked to Indian Ocean climate variability. J. Clim., 19, 1948–1969
Frederiksen, J.S. and Frederiksen, C.S. 2007, Inter-decadal changes in Southern Hemisphere winter storm track modes. Tellus, 59 A, 559–617.
Gastineau, G., Treut, H.L. and Li, L. 2008. Hadley circulation changes un-der global warming conditions indicated by coupled models, Tellus, 60, 863–884.
Grotch, S.L. and MaCracken, M.C. 1991. The use of general circulation models to predict regional climate change. J. Clim., 4, 286–303.
Hameed, S., Shi, W., Boyle, J. and Santer, B. 1995. Proceedings of the First International AMIP Scientific Conference, Monterey, California, WCRP 92, 221.
Hameed, S. and Piontkovski, S.A. 2004. The dominant influence of the Ice-landic Low on the position of the Gulf Stream northwall. Geophys. Res. Lett., 31, L09303.
Hendon, H.H., Thompson, D.W.J. and Wheeler, M.C. 2007. Australian rainfall and surface temperature variations associated with the South-ern Hemisphere Annular Mode, J. Clim., 20, 2452–2467
Hope, P.K. 2006. Projected future changes in synoptic systems influencing south west Australia. Clim. Dyn., 26, 765–780.
Hope, P.K., Drosdowsky, W. and Nicholls N. 2006. Shifts in the synop-tic systems influencing southwest Western Australia, Clim. Dyn., 26, 751–769.
Hu, Y. and Fu, Q. 2007. Observed poleward expansion of the Hadley circu-lation since 1979, Atmos. Chem. Phys. 7, 5229–5236.
Iqbal, M.J. and Ilyas, K. 2011. Influence of Icelandic Low Pressure on Win-ter Precipitation Variability over Northern Part of Indo-Pak Region, Arabian Journal of Geosciences, DOI 10.1007/s12517-011-0355-y.
Jones, D.A., Wang W. and Fawcett, R. 2009. High-quality spatial climate data-sets for Australia. Aust. Met. Oceanogr. J., 58, 233–248.
Kalnay, E., Kanamitsu, M., Kistler, R., Collins, W., Deaven, D., Gandin, L., Iredell, M., Saha, S., White, G., Woollen, J., Zhu, Y., Chelliah, M., Ebisuzaki, W., Higgins, W., Janowiak, J., Mo, K.C., Ropelewski, C., Wang, J., Leetmaa, A., Reynolds, R., Jenne, R. and Joseph, D. 1996: The NMC/NCAR 40-Year Reanalysis Project”. Bull. Am. Meteorol. Soc., 77, 437–471.
Khalia, J.H., Santoso, A. and England, M.H. 2009. Inter-annual Tasmanian Rainfall Variability Associated with Large-Scale Climate Modes, J. Clim., 22, 4383–4397.
Lu, J., Vecchi, G.A. and Reichler, T. 2007. Expansion of the Hadley cell under global warming, Geophys. Res. Lett., 34, L06805, doi:10.1029/ 2006GL028443.
Marshall, G.J. 2003. Trends in the Southern Annular Mode from Observa-tions and Reanalysis, J. Clim., 16, 4134–4143.
Meneghini, B., Simmonds, I. and Smith, I.N. 2006. Association between Australian rainfall and the Southern Annular Mode. Int. J. Climatol., 27, 109–121.
Mitas, C.M. and Clement, A. 2006. Recent behavior of the Hadley cell and tropical thermodynamics in climate models and reanalysis, Geophys. Res. Lett., 33, L01810, doi:10.1029/2005GL024406
Narisma, G.T. and Pitman, A.J. 2003. The impact of 200 years of land cover change on the Australian near-surface climate. J. Hydrometeorol., 4, 424–36.
Nicholls, N. 2006. Detecting and attributing Australian climate change: a review. Aust. Meteorol. Mag., 55, 199–211.
Pitman, A.J., Narisma, G.T., Pielke, R.A. and Holbrook, N.J. 2004. The im-pact of land cover change on the climate of south west Western Aus-tralia. J. Geophys. Res., 109, D18.109
Previdi, M. and Liepert, B.G. 2007. Annular Modes and Hadley Cell Ex-pansion Under Global Warming, Geophys. Res. Lett., 34, L22701, doi:10.1029/2007GL031243
Riemer R., Doherty, O.M. and Hameed, S. 2006. On the variability of Afri-can dust transport across the Atlantic, Geophys. Res. Lett., 33, L13814.
Rossby, C.-G. and co-authors. 1939. Relation between variations in the intensity of the zonal circulation of the atmosphere and the displace-ment of the semi-permanent centers of actions, J. Marine Res., 2, 38–55.
Saji, N.H., Goswami, B.N., Vinayachandran, P.N. and Yamagata, T. 1999. A dipole mode in the tropical Indian Ocean, Nature, 401, 360– 363.

170 Australian Meteorological and Oceanographic Journal 61:3 September 2011
Santer, B.D. 1988. Regional validation of general circulation models. Ph.D. Thesis, University of East Anglia, Norwich, England.
Seager, R., Murtugudde, R., Naik, N., Clement, A., Gordon, N. and Miller, J. 2003. Air–Sea Interaction and the Seasonal Cycle of the Subtropical Anticyclones. J. Clim., 16, 1948–1966
Simmonds, I. and Keay, K. 2000. Variability of Southern Hemisphere ex-tratropical cyclone behavior, 1958–97. J. Clim., 13, 550–61.
Smith, I.N., McIntosh, P., Ansell, T.J., Reason, C.J.C. and McInnes, K. 2000. Southwest Western Australian winter rainfall and its association with Indian Ocean climate variability. Int. J. Climatol., 20, 1913–30.
Timbal, B., Arblaster, J.M. and Power, S.P. 2006. Attribution of the late 20th century rainfall decline in Southwest Australia. J. Clim., 19, 2046–62.
Ummenhofer, C.C., Gupta, A. Sen., Pook, M.J. and England, M.H. 2008. Anomalous rainfall over southwest Western Australia forced by In-dian Ocean sea surface temperatures. J. Clim., 21, 5113–5134.
Ummenhofer, C.C., Gupta, A. Sen., Taschetto, A.S. and England, M.H. 2009. Modulation of Australian Precipitation by Meridional Gradients in East Indian Ocean Sea Surface Temperature, J. Clim., 22, 5597–5610.
Wenju, C. and Ge, S. 2005. Multidecadal fluctuations of winter rainfall over southwest Western Australia simulated in the CSIRO Mark 3 coupled model, Geophys, Res. Lett., 32, 1–4
Western Australia Climate Services Center 2010. A very dry year so far in southwest Western Australia, Bureau of Meteorology, Special Climate Statement 21.