impact of soil particle size and bioaccessibility on children and adult lead exposure in peri-urban...
TRANSCRIPT
Ie
Aa
b
a
ARR1AA
KBELPS
1
mryofieptdas
adioie
dT
0d
Journal of Hazardous Materials 186 (2011) 1870–1879
Contents lists available at ScienceDirect
Journal of Hazardous Materials
journa l homepage: www.e lsev ier .com/ locate / jhazmat
mpact of soil particle size and bioaccessibility on children and adult leadxposure in peri-urban contaminated soils
lbert L. Juhasza,b,∗, John Webera,b, Euan Smitha,b
Centre for Environmental Risk Assessment and Remediation, University of South Australia, Mawson Lakes, SA 5095, AustraliaCooperative Research Centre for Contamination Assessment and Remediation of the Environment, Mawson Lakes, SA 5095, Australia
r t i c l e i n f o
rticle history:eceived 12 October 2010eceived in revised form3 December 2010ccepted 17 December 2010vailable online 27 December 2010
a b s t r a c t
The impact of soil particle size and bioaccessibility on children and adult lead (Pb) exposure via theincidental soil ingestion pathway was assessed in 16 peri-urban contaminated soils. A comparison of Pbdistribution across 4 particle size fractions (<50 �m, <100 �m, <250 �m and <2 mm) found increasingPb concentrations associated with decreasing particle size fractions. Lead enrichment in the <50 �mparticle size fraction was up to 5 times the concentration observed in the bulk soil. When gastric phase
eywords:ioaccessibilityxposureeadarticle size
Pb bioaccessibility was determined in the <50, <100 and <250 �m particle size fractions using the SBRCassay, Pb bioaccessibility also increased with decreasing particle size fraction for 6 of the 16 soils tested.Assessment of children and adult Pb exposure indicated that particle size and bioaccessibility had asignificant influence on the contribution of incidental soil ingestion to daily Pb intake values. Althoughthe <250 �m particle size fraction is recommended for incidental soil ingestion calculations, using thisfraction has the potential to underestimate Pb exposure due to the preferential adhesion of smaller
evate
BRC particles to hands with el. Introduction
The assessment of Pb relative bioavailability and bioaccessibilityay be undertaken in order to refine exposure and human health
isk calculations for the incidental ingestion of soil. For these anal-ses, the <250 �m particle size fraction is currently utilised basedn the premise that it is this fraction that adheres to hands andngers and is therefore available for incidental ingestion [1]. How-ver, a recent review by Bright et al. [2] suggested that the <250 �marticle size fraction may not necessarily be the most relevant forhe soil ingestion exposure pathway. This suggestion was based onata from the literature showing the preferential adherence of soilnd dust particles to hands and fingers in the 0.5–65 �m particleize range [3–7].
Contaminant exposure through the incidental ingestion of soilnd dust is a particularly important exposure pathway for chil-ren as their behavioural patterns expose them to greater rates of
ngestion compared to adults [8,9]. Indoor dust generally consistsf particles <50 �m in diameter [10] and several Pb studies havedentified exposure to contaminated household dust as a majorxposure pathway for children <3 years of age [11,12]. A child’s
∗ Corresponding author at: Centre for Environmental Risk Assessment and Reme-iation, University of South Australia, Mawson Lakes, SA 5095, Australia.el.: +61 8 8302 5045; fax: +61 8 8302 3057.
E-mail address: [email protected] (A.L. Juhasz).
304-3894/$ – see front matter © 2011 Elsevier B.V. All rights reserved.oi:10.1016/j.jhazmat.2010.12.095
d Pb concentrations.© 2011 Elsevier B.V. All rights reserved.
exposure may therefore be considerably greater if the Pb concen-tration in the smaller particle size fractions is greater than the<250 �m soil particle fraction which is currently used for exposureassessment.
In addition, Bright et al. [2] identified that there was con-siderable variability in the distribution of contaminants acrossdifferent particle size fractions. When Schaider et al. [13] deter-mined the concentration of metals (Cd, Pb and Zn) in minewaste, the average concentration in the <37 �m particle size frac-tion was 3–9 times higher than bulk concentrations. Similarly,Morrison and Gulson [14] and Ljung et al. [15] identified thatsoil Pb concentrations increased with decreasing particle size.As a result of the variability in Pb concentration across parti-cle size fractions, exposure calculations may vary considerablydepending on which particle size fraction is utilised for its calcula-tion.
Given the variability in Pb concentration with soil particle sizefraction, the aim of this study was to investigate the distributionof Pb in four particle size fractions (<2 mm, <250 �m, <100 �mand <50 �m) for 16 contaminated soils. Lead bioaccessibility wasalso determined in particle size fractions pertinent to the inci-dental soil ingestion pathway (<250 �m, <100 �m and <50 �m)
due to the dearth of information on the influence of particle sizeon Pb bioaccessibility. In addition, the impact of soil particle sizeand bioaccessibility on Pb exposure for the incidental soil inges-tion pathway was determined for children and adult exposurescenarios.
A.L. Juhasz et al. / Journal of Hazardous Materials 186 (2011) 1870–1879 1871
Table 1Source and physicochemical properties of soils used in bioaccessibility studies.
Soil # Source Physicochemical propertiesa
Pb (mg kg−1) Fe (g kg−1) OC (%) pH
6 Shooting range 1801 15.0 4.7 4.79 Shooting range 661 13.2 6.9 7.5
10 Incinerator 1140 41.6 0.2 6.911 Incinerator 835 44.8 0.2 7.712 Incinerator 2248 57.9 0.2 6.815 Historical fill 640 36.8 10.6 7.016 Historical fill 954 62.6 9.5 6.422 Mining/smelting 6840 13.1 1.6 8.123 Mining/smelting 5101 15.3 1.7 8.724 Mining/smelting 736 13.8 3.0 8.925 Mining/smelting 1186 11.3 1.7 8.826 Mining/smelting 124 13.3 3.7 8.227 Mining/smelting 86 9.7 3.5 9.028 Mining/smelting 1274 33.0 2.3 8.329 Mining/smelting 1392 28.3 2.4 8.4
f
2
2
nwirgd<dytd
2
iupPeLc(a3prl
ia(l
te(
I
0 2000 4000 6000 80000
5000
10000
15000
20000y = 2.18x + 46.58 r 2 = 0.89
Pb in the < 2 mm particle size fraction (mg kg -1)
Pb
in t
he
< 5
0μ
m p
art
icle
siz
e f
rac
tio
ns
(m
g k
g-1
)0 2000 4000 6000 8000
0
5000
10000
15000
20000
y = 1.63x + 302.46 r 2 = 0.89
Pb in the < 2 mm particle size fraction (mg kg -1)
Pb
in t
he
< 1
00μ
m p
art
icle
siz
e f
rac
tio
ns
(m
g k
g-1
)
0 2000 4000 6000 80000
5000
10000
15000
20000
y = 1.28x + 234.55 r 2 = 0.90
Pb in the < 2 mm particle size fraction (mg kg -1)
Pb
in th
e <
25
0μ
m p
art
icle
siz
e fr
ac
tion
s (m
g k
g-1
)
30 Gasworks 1343 27.8 5.0 7.0
a Physicochemical properties were determined using the <2 mm soil particle sizeraction.
. Experimental
.1. Lead-contaminated soils
Soils used in this study were collected from areas contami-ated by Pb through a variety of activities. Surface soils (0–20 cm)ere randomly collected from small arms shooting ranges (n = 2),
ncinerator sites (n = 3), urban areas containing historical fill mate-ial (n = 2), areas near mining and smelting activities (n = 8) and aasworks site (n = 1) (Table 1). Following collection, soils were airried then sieved to collect the <50 �m, <100 �m, <250 �m and2 mm soil particle size fractions. Bulk soil (<2 mm) properties wereetermined for pH (1:5 soil:DI H2O) and OC (Leco Carbon Anal-ser) in duplicate. Total metal concentrations in the <2 mm and inhe <50 �m, <100 �m and <250 �m soil particle size fractions wasetermined using ICP-MS following acid digestion [16].
.2. Determination of Pb bioaccessibility
The Solubility Bioavailability Research Consortium (SBRC)n vitro assay [17], including both gastric and intestinal phases, wastilised for the assessment of Pb bioaccessibility. The SBRC gastrichase may also be utilised for the Relative Bioavailability Leachingrocedure (RBALP). The RBALP is a USEPA validated in vitro assay forstimating Pb relative bioavailability in contaminated soils [1,18].ead contaminated soils (n = 16; 3 particle size fractions; 3 repli-ates of each sample) were combined with gastric phase solution30.03 g l−1 glycine adjusted to pH 1.5 with concentrated HCl) tochieve a soil:solution ratio of 1:100. Samples were incubated at7 ◦C, 40 rpm on a Ratek suspension mixer for 1 h ensuring that theH was maintained at 1.5 by the addition of concentrated HCl whenequired. After gastric phase extraction, samples (10 ml) were col-ected and filtered through 0.45 �m filters for analysis by ICP-MS.
Following gastric phase dissolution, the gastric phase was mod-fied to the intestinal phase by adjusting the pH to 6.5 with NaOH (5nd 50%) and by the addition of bile (1750 mg l−1) and pancreatin500 mg l−1). After 4 h, intestinal phase samples (10 ml) were col-ected and filtered through 0.45 �m filters for analysis by ICP-MS.
Lead bioaccessibility was calculated by dividing the gas-ric phase extractable Pb (termed SBRC-G) or intestinal phase
xtractable Pb (termed SBRC-I) by the total soil Pb concentrationEq. (1)).n vitro Pb bioaccessibility (%) =(
In vitro PbTotal Pb
)× 100 (1)
Fig. 1. Comparison of Pb concentration in the <50 �m (�), <100 �m (�) and<250 �m (�) particle size fractions compared to Pb in bulk soils (<2 mm particlesize fraction).
where In vitro Pb = Pb (�g) extracted from soil following gastric(SBRC-G) or intestinal (SBRC-I) phase treatment and Total Pb = Pb(�g) present in contaminated soil or Pb acetate added to the in vitroassay prior to treatment [19].
2.3. Determination of Pb exposure
The impact of soil particle size and bioaccessibility on Pb expo-sure via the incidental soil ingestion pathway were calculatedfor both children and adults exposure scenarios. For calculatinga child’s (2-year-old) incidental soil ingestion exposure, an inges-tion rate of 135 mg day−1 was assumed as recommended by theIntegrated Exposure Uptake Biokinetic model for Pb in children
[20]. For adult exposure calculations, an incidental soil ingestionrate of 50 mg day−1 [21] was utilised. When Pb bioaccessibilitywas included in exposure calculations, gastric phase bioaccessibil-ity data was converted to Pb relative bioavailability values usingthe relative bioavailability–bioaccessibility linear regression model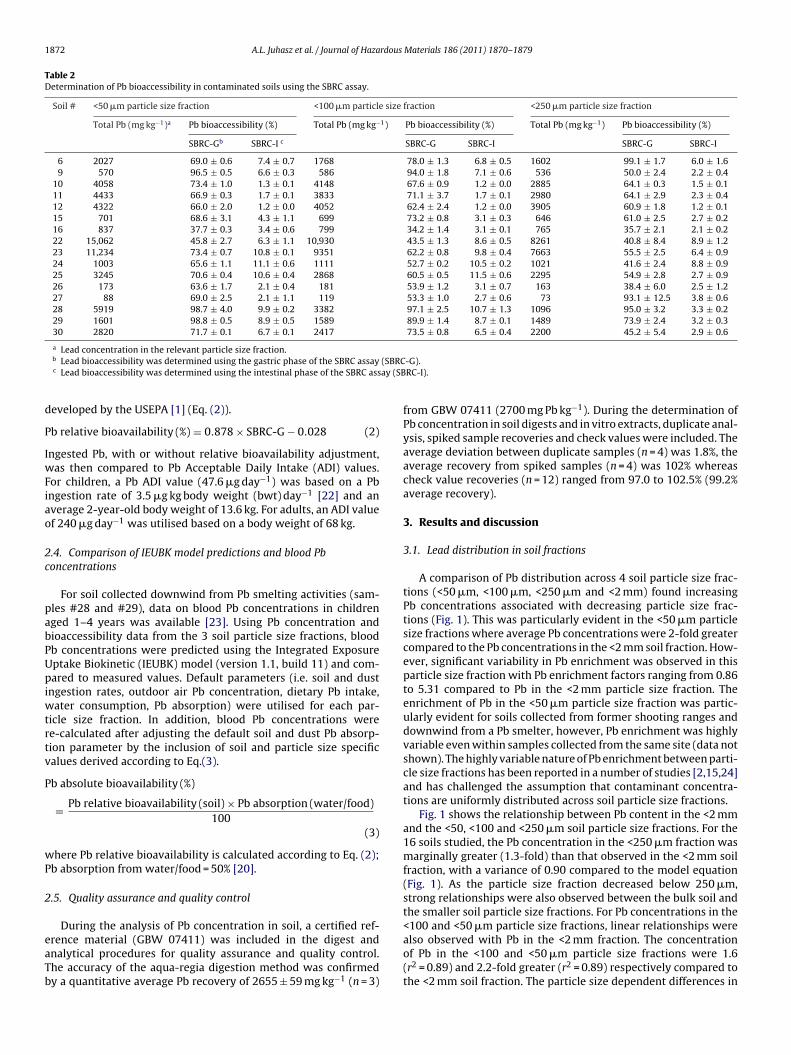
1872 A.L. Juhasz et al. / Journal of Hazardous Materials 186 (2011) 1870–1879
Table 2Determination of Pb bioaccessibility in contaminated soils using the SBRC assay.
Soil # <50 �m particle size fraction <100 �m particle size fraction <250 �m particle size fraction
Total Pb (mg kg−1)a Pb bioaccessibility (%) Total Pb (mg kg−1) Pb bioaccessibility (%) Total Pb (mg kg−1) Pb bioaccessibility (%)
SBRC-Gb SBRC-I c SBRC-G SBRC-I SBRC-G SBRC-I
6 2027 69.0 ± 0.6 7.4 ± 0.7 1768 78.0 ± 1.3 6.8 ± 0.5 1602 99.1 ± 1.7 6.0 ± 1.69 570 96.5 ± 0.5 6.6 ± 0.3 586 94.0 ± 1.8 7.1 ± 0.6 536 50.0 ± 2.4 2.2 ± 0.4
10 4058 73.4 ± 1.0 1.3 ± 0.1 4148 67.6 ± 0.9 1.2 ± 0.0 2885 64.1 ± 0.3 1.5 ± 0.111 4433 66.9 ± 0.3 1.7 ± 0.1 3833 71.1 ± 3.7 1.7 ± 0.1 2980 64.1 ± 2.9 2.3 ± 0.412 4322 66.0 ± 2.0 1.2 ± 0.0 4052 62.4 ± 2.4 1.2 ± 0.0 3905 60.9 ± 1.8 1.2 ± 0.115 701 68.6 ± 3.1 4.3 ± 1.1 699 73.2 ± 0.8 3.1 ± 0.3 646 61.0 ± 2.5 2.7 ± 0.216 837 37.7 ± 0.3 3.4 ± 0.6 799 34.2 ± 1.4 3.1 ± 0.1 765 35.7 ± 2.1 2.1 ± 0.222 15,062 45.8 ± 2.7 6.3 ± 1.1 10,930 43.5 ± 1.3 8.6 ± 0.5 8261 40.8 ± 8.4 8.9 ± 1.223 11,234 73.4 ± 0.7 10.8 ± 0.1 9351 62.2 ± 0.8 9.8 ± 0.4 7663 55.5 ± 2.5 6.4 ± 0.924 1003 65.6 ± 1.1 11.1 ± 0.6 1111 52.7 ± 0.2 10.5 ± 0.2 1021 41.6 ± 2.4 8.8 ± 0.925 3245 70.6 ± 0.4 10.6 ± 0.4 2868 60.5 ± 0.5 11.5 ± 0.6 2295 54.9 ± 2.8 2.7 ± 0.926 173 63.6 ± 1.7 2.1 ± 0.4 181 53.9 ± 1.2 3.1 ± 0.7 163 38.4 ± 6.0 2.5 ± 1.227 88 69.0 ± 2.5 2.1 ± 1.1 119 53.3 ± 1.0 2.7 ± 0.6 73 93.1 ± 12.5 3.8 ± 0.628 5919 98.7 ± 4.0 9.9 ± 0.2 3382 97.1 ± 2.5 10.7 ± 1.3 1096 95.0 ± 3.2 3.3 ± 0.229 1601 98.8 ± 0.5 8.9 ± 0.5 1589 89.9 ± 1.4 8.7 ± 0.1 1489 73.9 ± 2.4 3.2 ± 0.330 2820 71.7 ± 0.1 6.7 ± 0.1 2417 73.5 ± 0.8 6.5 ± 0.4 2200 45.2 ± 5.4 2.9 ± 0.6
(SBRCay (SB
d
P
IwFiao
2c
pabPUpiwtrtv
P
wP
2
eaTb
a Lead concentration in the relevant particle size fraction.b Lead bioaccessibility was determined using the gastric phase of the SBRC assayc Lead bioaccessibility was determined using the intestinal phase of the SBRC ass
eveloped by the USEPA [1] (Eq. (2)).
b relative bioavailability (%) = 0.878 × SBRC-G − 0.028 (2)
ngested Pb, with or without relative bioavailability adjustment,as then compared to Pb Acceptable Daily Intake (ADI) values.
or children, a Pb ADI value (47.6 �g day−1) was based on a Pbngestion rate of 3.5 �g kg body weight (bwt) day−1 [22] and anverage 2-year-old body weight of 13.6 kg. For adults, an ADI valuef 240 �g day−1 was utilised based on a body weight of 68 kg.
.4. Comparison of IEUBK model predictions and blood Pboncentrations
For soil collected downwind from Pb smelting activities (sam-les #28 and #29), data on blood Pb concentrations in childrenged 1–4 years was available [23]. Using Pb concentration andioaccessibility data from the 3 soil particle size fractions, bloodb concentrations were predicted using the Integrated Exposureptake Biokinetic (IEUBK) model (version 1.1, build 11) and com-ared to measured values. Default parameters (i.e. soil and dust
ngestion rates, outdoor air Pb concentration, dietary Pb intake,ater consumption, Pb absorption) were utilised for each par-
icle size fraction. In addition, blood Pb concentrations weree-calculated after adjusting the default soil and dust Pb absorp-ion parameter by the inclusion of soil and particle size specificalues derived according to Eq.(3).
b absolute bioavailability (%)
= Pb relative bioavailability (soil) × Pb absorption (water/food)100
(3)
here Pb relative bioavailability is calculated according to Eq. (2);b absorption from water/food = 50% [20].
.5. Quality assurance and quality control
During the analysis of Pb concentration in soil, a certified ref-rence material (GBW 07411) was included in the digest andnalytical procedures for quality assurance and quality control.he accuracy of the aqua-regia digestion method was confirmedy a quantitative average Pb recovery of 2655 ± 59 mg kg−1 (n = 3)
-G).RC-I).
from GBW 07411 (2700 mg Pb kg−1). During the determination ofPb concentration in soil digests and in vitro extracts, duplicate anal-ysis, spiked sample recoveries and check values were included. Theaverage deviation between duplicate samples (n = 4) was 1.8%, theaverage recovery from spiked samples (n = 4) was 102% whereascheck value recoveries (n = 12) ranged from 97.0 to 102.5% (99.2%average recovery).
3. Results and discussion
3.1. Lead distribution in soil fractions
A comparison of Pb distribution across 4 soil particle size frac-tions (<50 �m, <100 �m, <250 �m and <2 mm) found increasingPb concentrations associated with decreasing particle size frac-tions (Fig. 1). This was particularly evident in the <50 �m particlesize fractions where average Pb concentrations were 2-fold greatercompared to the Pb concentrations in the <2 mm soil fraction. How-ever, significant variability in Pb enrichment was observed in thisparticle size fraction with Pb enrichment factors ranging from 0.86to 5.31 compared to Pb in the <2 mm particle size fraction. Theenrichment of Pb in the <50 �m particle size fraction was partic-ularly evident for soils collected from former shooting ranges anddownwind from a Pb smelter, however, Pb enrichment was highlyvariable even within samples collected from the same site (data notshown). The highly variable nature of Pb enrichment between parti-cle size fractions has been reported in a number of studies [2,15,24]and has challenged the assumption that contaminant concentra-tions are uniformly distributed across soil particle size fractions.
Fig. 1 shows the relationship between Pb content in the <2 mmand the <50, <100 and <250 �m soil particle size fractions. For the16 soils studied, the Pb concentration in the <250 �m fraction wasmarginally greater (1.3-fold) than that observed in the <2 mm soilfraction, with a variance of 0.90 compared to the model equation(Fig. 1). As the particle size fraction decreased below 250 �m,strong relationships were also observed between the bulk soil andthe smaller soil particle size fractions. For Pb concentrations in the
<100 and <50 �m particle size fractions, linear relationships werealso observed with Pb in the <2 mm fraction. The concentrationof Pb in the <100 and <50 �m particle size fractions were 1.6(r2 = 0.89) and 2.2-fold greater (r2 = 0.89) respectively compared tothe <2 mm soil fraction. The particle size dependent differences in
A.L. Juhasz et al. / Journal of Hazardous Materials 186 (2011) 1870–1879 1873
Soi
l Pb
SB
RC
-G
SB
RC
-I x
Soi
l Pb
SB
RC
-G
SB
RC
-I x
Soi
l Pb
SB
RC
-G
SB
RC
-I0
20
40
60
80
100
120
0
500
1000
1500
2000
2500
Soi
l Pb
SB
RC
-G
SB
RC
-I x
Soi
l Pb
SB
RC
-G
SB
RC
-I x
Soi
l Pb
SB
RC
-G
SB
RC
-I0
20
40
60
80
100
120
0
250
500
750
1000
Soi
l Pb
SB
RC
-G
SB
RC
-I x
Soi
l Pb
SB
RC
-G
SB
RC
-I x
Soi
l Pb
SB
RC
-G
SB
RC
-I0
20
40
60
80
100
120
0
1000
2000
3000
4000
5000
Soi
l Pb
SB
RC
-G
SB
RC
-I x
Soi
l Pb
SB
RC
-G
SB
RC
-I x
Soi
l Pb
SB
RC
-G
SB
RC
-I0
20
40
60
80
100
120
0
1000
2000
3000
4000
5000
Soil #12
Soi
l Pb
SB
RC
-G
SB
RC
-I x
Soi
l Pb
SB
RC
-G
SB
RC
-I x
Soi
l Pb
SB
RC
-G
SB
RC
-I0
20
40
60
80
100
120
0
1000
2000
3000
4000
5000
Soil #15
Soi
l Pb
SB
RC
-G
SB
RC
-I x
Soi
l Pb
SB
RC
-G
SB
RC
-I x
Soi
l Pb
SB
RC
-G
SB
RC
-I0
20
40
60
80
100
120
0
250
500
750
1000
Soil #16
Soi
l Pb
SB
RC
-G
SB
RC
-I x
Soi
l Pb
SB
RC
-G
SB
RC
-I x
Soi
l Pb
SB
RC
-G
SB
RC
-I0
20
40
60
80
100
120
0
250
500
750
1000
Soil #22
Soi
l Pb
SB
RC
-G
SB
RC
-I x
Soi
l Pb
SB
RC
-G
SB
RC
-I x
Soi
l Pb
SB
RC
-G
SB
RC
-I0
20
40
60
80
100
120
0
5000
10000
15000
20000
F soils #T
Pfpb
< 50 μm < 100 μm < 250 μm
ig. 2. Lead bioaccessibility in the <50, <100 and <250 �m particle size fractions ofhe concentration of Pb in the various particle size fractions is also shown (�).
b concentrations demonstrate that the appropriate soil particleraction needs to be selected when assessing human Pb exposureathways. It has been estimated that indoor dust may contributeetween 30 and 69% [24] of the total Pb exposure for a 2-year-old
< 50 μm < 100 μm < 250 μm
6–#22 determined using gastric (�) and intestinal ( ) phases of the SBRC assays.
child. Indoor dust generally consists of particles <50 �m in diam-eter [10] with particle arising from soil sources markedly enrichedcompared to the bulk soil (<2 mm fraction) (Fig. 1). Young et al.[25] reported that the re-suspension of Pb contaminated surface
1874 A.L. Juhasz et al. / Journal of Hazardous Materials 186 (2011) 1870–1879
Soil #23
So
il P
b
SB
RC
-G
SB
RC
-I x
So
il P
b
SB
RC
-G
SB
RC
-I x
So
il P
b
SB
RC
-G
SB
RC
-I0
20
40
60
80
100
120
0
3000
6000
9000
12000
Pb
Bio
acc
ess
ibili
ty (
%)
Pb
(mg
kg
-1)
Soil #24
So
il P
b
SB
RC
-G
SB
RC
-I x
So
il P
b
SB
RC
-G
SB
RC
-I x
So
il P
b
SB
RC
-G
SB
RC
-I0
20
40
60
80
100
120
0
300
600
900
1200
1500
Pb
Bio
acc
ess
ibili
ty (
%)
Pb
(mg
kg
-1)
Soil #25
So
il P
b
SB
RC
-G
SB
RC
-I x
So
il P
b
SB
RC
-G
SB
RC
-I x
So
il P
b
SB
RC
-G
SB
RC
-I0
20
40
60
80
100
120
0
1000
2000
3000
4000
Pb
Bio
acc
ess
ibili
ty (
%)
Pb
(mg
kg
-1)
Soil #26
So
il P
b
SB
RC
-G
SB
RC
-I x
So
il P
b
SB
RC
-G
SB
RC
-I x
So
il P
b
SB
RC
-G
SB
RC
-I0
20
40
60
80
100
120
0
50
100
150
200
250
Pb
Bio
acc
ess
ibili
ty (
%)
Pb
(mg
kg
-1)
Soil #27
So
il P
b
SB
RC
-G
SB
RC
-I x
So
il P
b
SB
RC
-G
SB
RC
-I x
So
il P
b
SB
RC
-G
SB
RC
-I0
20
40
60
80
100
120
0
30
60
90
120
150
Pb
Bio
ac
ces
sib
ility
(%)
Pb
(mg
kg
-1)
Soil #28
Soi
l Pb
SB
RC
-G
SB
RC
-I x
Soi
l Pb
SB
RC
-G
SB
RC
-I x
Soi
l Pb
SB
RC
-G
SB
RC
-I0
20
40
60
80
100
120
0
2000
4000
6000
8000
Pb
Bio
ac
ces
sib
ility
(%
)
Pb
(mg
kg
-1)
Soil #29
Soi
l Pb
SB
RC
-G
SB
RC
-I x
Soi
l Pb
SB
RC
-G
SB
RC
-I x
Soi
l Pb
SB
RC
-G
SB
RC
-I0
20
40
60
80
100
120
0
500
1000
1500
2000
< 50 μm < 100 μm < 250 μm
Pb
Bio
acce
ssib
ility
(%)
Pb
(mg
kg-1)
Soil #30
Soi
l Pb
SB
RC
-G
SB
RC
-I x
Soi
l Pb
SB
RC
-G
SB
RC
-I x
Soi
l Pb
SB
RC
-G
SB
RC
-I0
20
40
60
80
100
120
0
500
1000
1500
2000
2500
3000
< 50 μm < 100 μm < 250 μm
Pb
Bio
ac
ce
ss
ibili
ty (
%)
Pb
(mg
kg
-1)
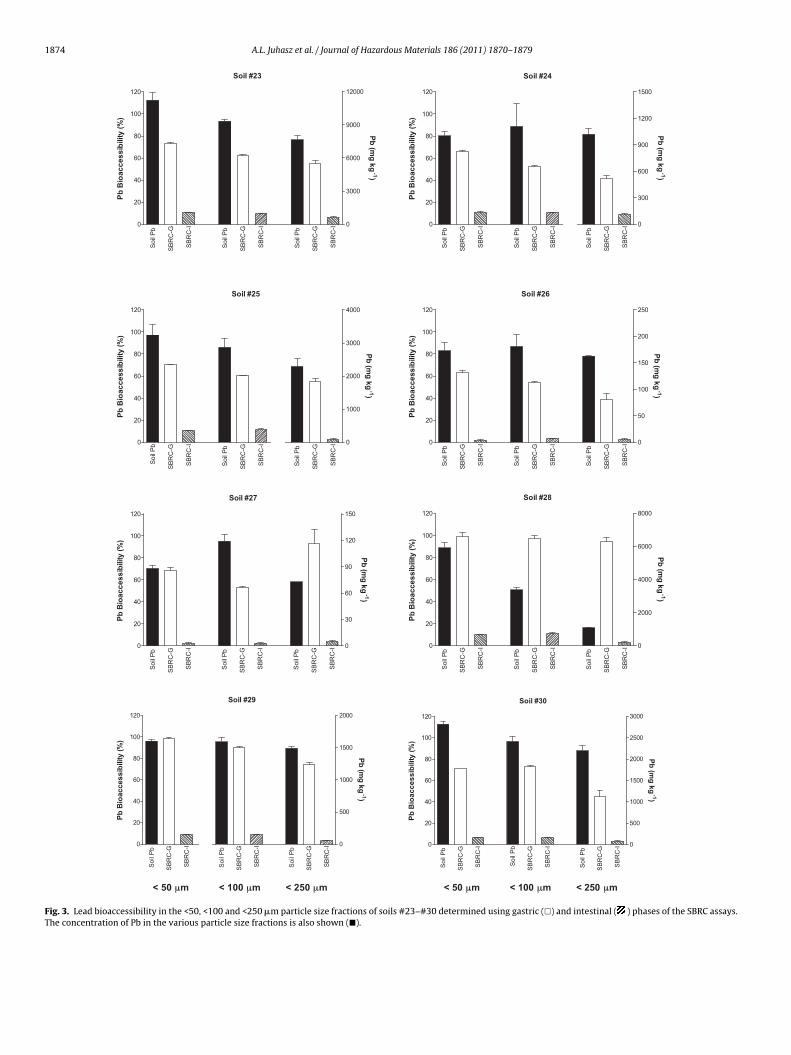
Fig. 3. Lead bioaccessibility in the <50, <100 and <250 �m particle size fractions of soils #23–#30 determined using gastric (�) and intestinal ( ) phases of the SBRC assays.The concentration of Pb in the various particle size fractions is also shown (�).

A.L. Juhasz et al. / Journal of Hazardous Materials 186 (2011) 1870–1879 1875
Table 3Impact of soil particle size and bioaccessibility on children’s Pb exposure via the incidental soil ingestion pathway.
Soil # Child’s incidental soil ingestion exposurea
<50 �m particle size fraction <100 �m particle size fraction <250 �m particle size fraction
Total Pb(�g day−1)b
ADIc BioAv Pb(�g day−1)d
ADI Total Pb(�g day−1)
ADI BioAv Pb(�g day−1)
ADI Total Pb(�g day−1)
ADI BioAv Pb(�g day−1)
ADI
6 273.6 5.75 169.5 3.56 238.7 5.01 163.4 3.43 216.3 4.54 188.0 3.959 77.0 1.62 65.2 1.37 79.1 1.66 65.3 1.37 72.4 1.52 31.7 0.67
10 547.8 11.51 353.1 7.42 560.0 11.76 332.1 6.98 389.5 8.18 219.1 4.6011 598.5 12.57 351.3 7.38 517.5 10.87 323.1 6.79 402.3 8.45 226.3 4.7512 583.5 12.26 338.0 7.10 547.0 11.49 299.7 6.30 527.2 11.08 281.7 5.9215 94.6 1.99 57.0 1.20 94.4 1.98 60.7 1.27 87.2 1.83 46.7 0.9816 113.0 2.37 37.3 0.78 107.9 2.27 32.4 0.68 103.3 2.17 32.3 0.6822 2033.4 42.72 817.4 17.17 1475.6 31.00 563.6 11.84 1115.2 23.43 399.6 8.4023 1516.6 31.86 976.7 20.52 1262.4 26.52 688.7 14.47 1034.5 21.73 503.7 10.5824 135.4 2.84 78.0 1.64 150.0 3.15 69.4 1.46 137.8 2.90 50.3 1.0625 438.1 9.20 271.3 5.70 387.2 8.13 205.7 4.32 309.8 6.51 149.4 3.1426 23.4 0.49 13.0 0.27 24.4 0.51 11.6 0.24 22.0 0.46 7.3 0.1527 11.9 0.25 7.2 0.15 16.1 0.34 7.5 0.16 9.9 0.21 8.1 0.1728 799.1 16.79 692.2 14.54 456.6 9.59 389.2 8.18 148.0 3.11 123.3 2.5929 216.1 4.54 187.5 3.94 214.5 4.51 169.3 3.56 201.0 4.22 130.3 2.7430 380.7 8.00 239.4 5.03 326.3 6.85 210.5 4.42 297.0 6.24 117.7 2.47
a An incidental soil ingestion rate of 135 mg day−1 (based on a 2-year-old child) was utilised for exposure assessment [20].b Total Pb ingested was calculated using the incidental soil ingestion rate and the Pb concentration in the relevant particle size fraction.c ily Pb intake for a 2-year-old child (47.6 �g day−1) based on 3.5 �g kg bwt day−1 [22] and
a, the Pb concentration in the relevant particle size fraction and Pb relative bioavailability
d 878 × SBRC-G − 0.028) [1].
patrtas
3
ifgt<i6wthlbSr5eewssasmhtf
p
0 10 20 30 40 500
10
20
30
40
50A
Fe (mmol l-1)
Pb
(m
mo
l l-1
)
0 2 4 6 8 100
2
4
6
8
10B
Fe (mmol l-1)
Pb
(m
mo
l l-1
)
Ratio of ingested Pb from the relevant particle size fraction to the acceptable dan average weight of 13.6 kg.d Bioavailable Pb ingested was calculated using the incidental soil ingestion rateetermined using gastric phase bioaccessibility data (Pb relative bioavailability = 0.
articles may be a major source of contaminated material in thetmosphere. However, even though the total Pb concentration inhe soil fractions may increase with decreasing particle size, theelative fraction that is bioaccessible may not follow the samerend. To understand the link between soil particle size fractionnd potential human exposure, the bioaccessibility of Pb wastudied in the <50, <100 and <250 �m particle size fractions.
.2. Lead bioaccessibility in soil fractions
Table 2 and Figs. 2 and 3 show the variability in Pb bioaccessibil-ty with varying particle size fractions. In all soils and particle sizeractions, Pb bioaccessibility was the greatest when assessed usingastric phase extraction with Pb bioaccessibility ranging from 37.7o 98.9%, from 34.2 to 97.1% and from 35.7 to 99.1% for the <50,100 and <250 �m soil particle size fractions respectively. Follow-ng gastric phase extraction, Pb bioaccessibility was in excess of9% irrespective of particle size fraction in soils #6, #28 and #29here Pb contamination was the result of shooting range activi-
ies and smelter emissions. High gastric phase Pb bioaccessibilityas previously been reported by Bannon et al. [26]. In soils col-
ected from small arms ranges (n = 8; 4549–24,484 mg Pb kg−1), Pbioaccessibility ranged from 83 to 100% (mean = 95 ± 6%). Similarly,mith et al. [27] reported that the bioaccessibility of Pb in shootingange contaminated soils (n = 9; 576–3026 mg Pb kg−1) ranged from0 to 105% (mean = 89 ± 18%). Bannon et al. [26] proposed that thelevated Pb bioaccessibility in these soils resulted from the pres-nce of highly soluble Pb oxides and carbonates arising from theeathering of Pb shot. Similarly, high gastric phase Pb bioacces-
ibility has previously been reported for soils contaminated frommelting emissions due to the presence of Pb oxides and carbon-tes [28]. Gastric phase Pb bioaccessibility was the lowest (<50%) inoils where the Pb source originated from historical fill (#16) andining activities (#22). In mine site soils, low Pb bioaccessibility
as previously been reported by a number of researchers due tohe presence of insoluble minerals such as sulphides, phosphates,erromanganese oxides and iron sulphates of Pb [29–31].
When gastric phase Pb bioaccessibility was compared acrossarticle size fractions for individual soils, percentage Pb bioac-
Fig. 4. Comparison of Pb and Fe solution concentrations during gastric and intestinalphase extraction of five representative Pb contaminated soils (#22, #23, #25, #28and #29). Lead and Fe concentrations are shown for gastric (A) and intestinal (B)phase extractions of the <50 (�), <100 (�) and <250 �m particle size fractions (�).

1876 A.L. Juhasz et al. / Journal of Hazardous Materials 186 (2011) 1870–1879
Table 4Impact of soil particle size and bioaccessibility on adult’s Pb exposure via the incidental soil ingestion pathway.
Soil # Adult’s incidental soil ingestion exposurea
<50 �m soil particle size fraction <100 �m soil particle size fraction <250 �m soil particle size fraction
Total Pb(�g day−1)b
ADIc BioAv Pb(�g day−1)d
ADI Total Pb(�g day−1)
ADI BioAv Pb(�g day−1)
ADI Total Pb(�g day−1)
ADI BioAv Pb(�g day−1)
ADI
6 101.4 0.42 62.8 0.26 88.4 0.37 60.5 0.25 80.1 0.33 69.6 0.299 28.5 0.12 24.1 0.10 29.3 0.12 24.2 0.10 26.8 0.11 11.8 0.05
10 202.9 0.85 130.8 0.54 207.4 0.86 123.0 0.51 144.3 0.60 81.1 0.3411 221.7 0.92 130.1 0.54 191.7 0.80 119.7 0.50 149.0 0.62 83.8 0.3512 216.1 0.90 125.2 0.52 202.6 0.84 111.0 0.46 195.3 0.81 104.3 0.4315 35.1 0.15 21.1 0.09 35.0 0.15 22.5 0.09 32.3 0.13 17.3 0.0716 41.9 0.17 13.8 0.06 40.0 0.17 12.0 0.05 38.3 0.16 12.0 0.0522 753.1 3.14 302.7 1.26 546.5 2.28 208.7 0.87 413.1 1.72 148.0 0.6223 561.7 2.34 361.8 1.51 467.6 1.95 255.1 1.06 383.2 1.60 186.6 0.7824 50.2 0.21 28.9 0.12 55.6 0.23 25.7 0.11 51.1 0.21 18.6 0.0825 162.3 0.68 100.5 0.42 143.4 0.60 76.2 0.32 114.8 0.48 55.3 0.2326 8.7 0.04 4.8 0.02 9.1 0.04 4.3 0.02 8.2 0.03 2.7 0.0127 4.4 0.02 2.7 0.01 6.0 0.02 2.8 0.01 3.7 0.02 3.0 0.0128 296.0 1.23 256.4 1.07 169.1 0.70 144.2 0.60 54.8 0.23 45.7 0.1929 80.1 0.33 69.4 0.29 79.5 0.33 62.7 0.26 74.5 0.31 48.3 0.2030 141.0 0.59 88.7 0.37 120.9 0.50 78.0 0.32 110.0 0.46 43.6 0.18
a An incidental soil ingestion rate of 50 mg day−1 was utilised for exposure assessment [21].b Pb co
ily Pbthe P
d 878 ×
cf(Ptioctnc#dsasatp
iifai[dflDatdwtphs
c
Total Pb ingested was calculated using the incidental soil ingestion rate and thec Ratio of ingested Pb from the relevant particle size fraction to the acceptable dad Bioavailable Pb ingested was calculated using the incidental soil ingestion rate,etermined using gastric phase bioaccessibility data (Pb relative bioavailability = 0.
essibility increased (p < 0.05) with decreasing soil particle sizeraction for 6 (samples #10, #23–#26, #29) of the 16 soils testedFigs. 2 and 3). This was most evident for soils #23–#26 whereb bioaccessibility increased from 38.4–55.5% to 63.6–73.4% inhe <250 �m and <50 �m particle size fractions respectively. Anncrease in Pb bioaccessibility with decreasing particle size was alsobserved for soils #9, #15 and #30 although there was no signifi-ant difference (p > 0.05) between percentage Pb bioaccessibility inhe <50 and <100 �m soil particle size fractions. While there waso significant difference (p > 0.05) between percentage Pb bioac-essibility across particle size fractions for soils #11, #12, #16,22 and #28, soluble Pb in gastric phase solutions increased withecreasing particle size fraction due to the enrichment of Pb in themaller particle size fractions (Figs. 2 and 3). In contrast, percent-ge Pb bioaccessibility decreased with decreasing particle size foroil #6, although soluble Pb in gastric phase solutions was similarcross particle sizes. In addition, soluble Pb in gastric phase solu-ions was similar across particle size fractions for soil #27, althoughercentage Pb bioaccessibility was variable (Fig. 3).
Although numerous researchers have reported the variabilityn Pb concentration in different soil particle size fractions, lim-ted information is available regarding Pb bioaccessibility in theseractions. However, it has been suggested that soil particle size isn influencing factor in contaminant bioaccessibility due to thencreasing surface area to volume ratio with decreasing particle size30]. Increased Pb bioaccessibility with decreasing particle size wasemonstrated by Morrison and Gulson [14]. Using simulated gastricuid based on the formulation used in the US Pharmacopeial Tabletissolution Test, Pb bioaccessibility in smelter slag was on aver-ge 27% greater in the 32–53 �m particle size fraction comparedo the <250 �m particle size fraction. Similarly, Schaider et al. [13]etermined that Pb bioaccessibility (SBRC-G extractable) in mineaste (<37 �m; 5500 ± 2600 mg Pb kg−1) was in excess of 65% even
hough ore at the site primarily consisted of refractory metal sul-hides with low bioaccessibility. In addition, studies on house dust
ave also demonstrated an increase in Pb bioaccessibility as particleize decreased [32–34].When in vitro conditions were modified to intestinal phaseonditions, Pb bioaccessibility was significantly reduced compared
ncentration in the relevant particle size fraction.intake for an adult (240 �g day−1) based on a 68 kg person.
b concentration in the relevant particle size fraction and Pb relative bioavailabilitySBRC-G − 0.028) [1].
to gastric phase values. In the intestinal phase, Pb bioaccessibil-ity ranged from 1.2 to 11.1%, from 1.2 to 11.5% and from 1.2to 8.9% for the <50, <100 and <250 �m particle size fractionsrespectively. For soils #6, #10, #11, #12, #15, #26 and #27, nosignificant difference (p > 0.05) in percentage Pb bioaccessibilitywas observed between the <50, <100 and <250 �m particle sizefractions although soluble Pb in the intestinal phase increasedin samples where Pb enrichment was observed. In contrast, forsoils #9, #16, #23–25 and #28–30 (n = 8) an increase in intestinalphase Pb bioaccessibility with decreasing soil particle size frac-tion was observed although there was no significant difference(p > 0.05) between percentage Pb bioaccessibility in the <50 and<100 �m soil particle size fractions (Table 2). However, for soil#22, percentage Pb bioaccessibility decreased in the <50 �m soilparticle size fraction compared to the <100 and <250 �m fractionsalthough the concentration of soluble Pb in the <50 �m soil parti-cle size fraction was ∼30% greater compared to that in the <250 �mfraction.
Similar decreases in Pb bioaccessibility when in vitro conditionswere modified from gastric to intestinal phase conditions have beenreported by a number of researchers [31,35,36]. The decrease in Pbbioaccessibility with increasing pH was not unexpected as pH isa predominant parameter controlling the solubility of Pb in aque-ous matrices [37]. Under intestinal phase conditions (pH 6.5), Pbmay precipitate or be readsorbed onto soil particles resulting ina significant reduction in Pb bioaccessibility compared to gastricphase values [38]. In addition, analysis of intestinal phase solu-tion showed that the decrease in Pb concentration in the intestinalphase was also accompanied by a corresponding decrease in sol-uble Fe concentration (Fig. 4). For soils #22, #23, #25, #28 and#29, Fe concentrations in the intestinal phase were 6–38-fold lowercompared to gastric phase concentrations for the <50, <100 and<250 �m particle size fractions respectively. Smith et al. [27] pro-posed that the decrease in Pb bioaccessibility in the intestinal phasemay also occur as a result of Pb being strongly associated with the
formation of ferrihydrite which precipitates due to the intestinalphase pH. XANES analysis identified that the co-existence Fe in theintestinal phase played an important role in reducing Pb bioacces-sibility in this in vitro phase [27].
dous M
3e
bctci#rStceewt#i
Fucpf2
A.L. Juhasz et al. / Journal of Hazar
.3. Impact of soil particle size and bioaccessibility on Pbxposure assessment
Table 3 shows the impact of soil particle size and bioaccessi-ility on Pb exposure via the incidental soil ingestion pathway forhildren. For soils #26 and #27, irrespective of soil particle size andhe inclusion of Pb relative bioavailability, incidental soil ingestionontributed <51% of a 2-year-old child’s Pb ADI (Table 3). Whilencidental soil ingestion contributed over double the Pb ADI for soil16, inclusion of Pb relative bioavailability into ADI calculations
educed the contribution of incidental soil ingestion to 68–78%.imilarly, inclusion of Pb relative bioavailability into ADI calcula-ions for the <250 �m particle size fraction of soil #9, reduced theontribution of the incidental soil ingestion pathway to 67%, how-ver, for the <50 and <100 �m particle size fraction, ADI values werexceeded by ∼1.4- and ∼1.7-fold when Pb relative bioavailability
as excluded or included respectively (Table 3). For all other soils,he contribution of incidental soil ingestion was equivalent (soil15, <250 �m particle size fraction with Pb relative bioavailability
nclusion) or exceeded ADI values, in some cases by up to 42-fold
1-2
yr
2-3
yr
3-4
yr
Av
1-4
yr
1-2
yr
2-3
yr
3-4
yr
Av
1-4
yr
1-2
yr
2-3
yr
3-4
yr
Av
1-4
yr
0
10
20
30
40
50 A
Blo
od
Pb
(μ
g d
l-1)
1-2
yr
2-3
yr
3-4
yr
Av
1-4
yr
1-2
yr
2-3
yr
3-4
yr
Av
1-4
yr
1-2
yr
2-3
yr
3-4
yr
Av
1-4
yr
0
5
10
15
20
25 B
Age group / Soil Particle Size Fraction
Blo
od
Pb
(μ
g d
l-1)
< 50 μm< 100 μm< 250 μm
ig. 5. Comparison of predicted blood Pb concentration using the IEUBK modelnder default (�) and bioavailability adjusted (�) settings and measured blood Pboncentrations (—-) [23] in children (1–4 years of age) from communities near sam-ling locations #28 (A) and #29 (B). Predicted blood Pb concentrations are shownor 3 soil particle size fractions (<50, <100 and <250 �m) and for 3 age groups (1–2,–3 and 3–4 years of age and an average of the 3 groups).
aterials 186 (2011) 1870–1879 1877
(soil #22, <50 �m particle size fraction). As expected, the increas-ing Pb concentration with decreasing particle size fraction (for mostsoils) resulted in greater exceedance of ADI values for the incidentalsoil ingestion pathway.
In contrast, when the impact of soil particle size and bioaccessi-bility was assessed for an adult’s exposure to Pb via the incidentalsoil ingestion pathway (Table 4), ADI values were only exceededfor 3 (#22, #23, #28) of the 16 soils. For soil #22, ingested Pb wasbelow ADI values when Pb relative bioavailability was consideredfor the <100 and <250 �m particle size fractions while for soil #23,inclusion of Pb relative bioavailability into ingestion calculationsreduced the ingested Pb concentration below the ADI value for the<250 �m particle size fraction. Due to the elevated concentrationof Pb in the <50 �m particle size fraction of soil #28 (compared to<100 and <250 �m particle size fractions), the Pb ADI value wasexceeded irrespective of Pb relative bioavailability inclusion.
As outlined in Tables 3 and 4, soil particle size had a signifi-cant influence on the contribution of incidental soil ingestion todaily Pb intake values. Although the use of the <250 �m particlesize fraction is recommended for incidental soil ingestion calcula-tions [1], Yamamoto et al. [39] and Siciliano et al. [40] reported thatthe median soil particle size adhering to human hands is between34 and 40 �m. While input values for soil ingestion rates are wellestablished, incongruency exists regarding the most appropriateparticle size fraction which adhering to the hands of humans. Asa result of Pb enrichment with decreasing particle size fraction,the particle size used for exposure assessment influenced calcula-tions by up to a factor of 5 (soil #28) when the <50 �m particlesize fraction was used instead of the ‘recommended’ <250 �mfraction. Bioaccessibility inclusion has the potential to reduce Pbexposure calculations, however, as seen for Pb concentration, Pbbioaccessibility may also increase with decreasing particle size.Tables 3 and 4 provide an indication of the concentration of Pbwhich may be ingested via the incidental soil ingestion pathway,however, the calculated values do not take into consideration otherpotential Pb exposure pathways such as consumption of contami-nated food/water and the inhalation of contaminated dust. WhilePb exposure through the consumption of food and water may beminor, the inhalation exposure route may represent a significantexposure pathway due to Pb enrichment in the aerially entrainedfraction [2].
3.4. Comparison of IEUBK model predictions and blood Pbconcentrations
IEUBK model simulations were performed to determine thepotential impact of soil particle size and bioavailability on blood Pbconcentrations of children living in the vicinity of a Pb smelter. Val-ues calculated using the default and bioavailability adjusted IEUBKmodel simulations were compared to measured blood Pb concen-trations in children (1–4 years of age) [23] from communities nearsampling locations #28 and #29. Fig. 5 shows the impact of Pb con-centration and bioavailability input parameters for the 3 particlesize fractions on the predicted children’s blood Pb concentration.When blood Pb concentrations were calculated for soil #28, pre-dicted values were up to 3 times greater when the <50 �m particlesize fraction was used compared to the <250 �m fraction (Fig. 5A).These calculations reflect Pb enrichment with decreasing particlesize for soil #28. While differences were observed in the calculatedblood Pb concentrations for soil #29, the variability between parti-cle size fractions was approximately 5% and 28% respectively when
default and bioavailability adjusted IEUBK model simulations wereperformed (Fig. 5B). For both soils, the default Pb absorption param-eter for soil and dust underestimated the measured value derivedfrom the in vitro assessment. This was most pronounced for soil #29and the <50 �m particle size fraction where the calculated blood Pb
1 rdous
cdTlp
cttu(sdtpm2bb
ipsTftPaaetH#dt
4
fhdrtcwe
A
CCR0tU
R
[
[
[
[
[
[
[
[
[
[
[
[
[
[
[
[
[
[
[
[
[
[
878 A.L. Juhasz et al. / Journal of Haza
oncentrations were 27–29% greater compared to concentrationsetermined using the default soil and dust absorption value (30%).he difference between default and bioavailability adjusted calcu-ations reflects the increase in Pb bioaccessibility with decreasingarticle size fraction for soil #29 (Table 2).
When calculated and measured blood Pb concentrations forhildren aged 1–4 years were compared, IEUBK model predic-ions significantly overestimated blood Pb concentrations whenhe <50 and <100 �m particle size fractions of soil #28 weretilised irrespective of default or bioavailability adjusted settingFig. 5). Inclusion of bioavailability adjustments in IEUBK modelimulations for the <50 �m particle size fraction resulted in a pre-icted blood Pb concentration 2-fold higher (41.7 �g dl−1) thanhe average measured value (20.5 �g dl−1). However, when inputarameters included data from the <250 �m particle size fraction,easured blood Pb concentrations were underestimated by 44 and
9% for default and bioavailability adjusted simulations. In contrast,lood Pb concentrations (20.8 �g dl−1) were underestimated byetween 7 and 31% for soil #29 following IEUBK model calculations.
The IEUBK model contains over 100 input parameters includ-ng 46 which may be changed by the user [41]. While the defaultarameters represent ‘plausible central values’, the inclusion ofite-specific values will lead to the most effective use of the model.he limitations of model simulations for soils #28 and #29 ariserom the attempt to predict community mean blood Pb concen-rations using soil data from single locations. Variables such asb concentration in environmental matrices (soil, dust, water, andir), children’s behaviour, diet, attention to hygiene, and physicalnd chemical properties that affect Pb bioavailability will influ-nce household Pb exposure which will impact on children’s andhe community’s geometric mean blood Pb concentrations [42].owever, the simplistic IEUBK model simulations for soils #28 and29 demonstrate the impact of soil particle size and site-specificetermination of Pb bioavailability on estimated blood Pb concen-rations.
. Conclusions
As a result of Pb enrichment with decreasing soil particle sizeraction, the particle size utilised to represent soil that adheres toands significantly influences exposure calculations for the inci-ental soil ingestion pathway. Inclusion of Pb bioaccessibility mayeduce exposure calculations, however, this parameter is also par-icle size sensitive. Up to a 5-fold difference in Pb exposure wasalculated when the <50 and <250 �m soil particle size fractionsere utilised illustrating the significance of soil particle size on
xposure and risk calculations.
cknowledgements
This research was funded through the Australian Researchouncil Linkage Grant Scheme (Grant number LP0347301) and theooperative Research Centre for Contamination Assessment andemediation of the Environment (CRC CARE) (Grant number 1-3-1-05/6). The authors would like to acknowledge the support ofhe Centre for Environmental Risk Assessment and Remediation,niversity of South Australia for this research.
eferences
[1] U.S. Environmental Protection Agency, Estimation of Relative Bioavailability of
Lead in Soil and Soil-like Material using In vivo and In vitro Methods, OSWER9285.7-77, EPA, Washington, DC, 2007.[2] D.A. Bright, G.M. Richardson, M. Dodd, Do current standards of practice inCanada measure what is relevant to human exposure at contaminated sites?I: a discussion of soil particle size and contaminant partitioning in soil, Hum.Ecol. Risk Assess. 12 (2006) 591–605.
[
[
Materials 186 (2011) 1870–1879
[3] M.J. Duggan, M.J. Inskip, Childhood exposure to Pb in surface dust and soil: acommunity health problem, Public Health Rev. 13 (1985) 1–54.
[4] M.J. Duggan, M.J. Inskip, S.A. Rundle, J.S. Moorcroft, Lead in playground dustand on the hands of school children, Sci. Total Environ. 44 (1985) 65–79.
[5] S.C. Sheppard, W.B. Evenden, Contaminant enrichment and properties of soiladhering to skin, J. Environ. Qual. 23 (1994) 604–613.
[6] J.C. Kissel, K.Y. Richter, R.A. Fenske, Factors affecting soil adherence to skin inhand-press trials, Bull. Environ. Contam. Toxicol. 56 (1996) 722–728.
[7] R.D. Edwards, P.J. Lioy, The EL sampler: a press sampler for the quantitative esti-mation of dermal exposure to pesticides in house dust, J. Expo. Anal. Environ.Epidemiol. 9 (1999) 521–529.
[8] D. Mukerjee, Assessment of risk from multimedia exposures of children toenvironmental chemicals, Air Waste Manage. Assoc. 48 (1998) 483–501.
[9] D.A. Belluck, S.L. Benjamin, P. Baveye, J. Sampson, B. Johnson, Widespreadarsenic contamination of soils in residential areas and public spaces: an emerg-ing regulatory or medical crisis? Int. J. Toxicol. 22 (2003) 109–128.
10] R.D. Edwards, E.J. Yurkow, P.J. Lioy, Seasonal deposition of housedusts ontohousehold surfaces, Sci. Total Environ. 224 (1998) 69–80.
11] A. Hunt, D.L. Johnson, I. Thornton, J.M. Watt, Apportioning the sources of leadin house dusts in the London Borough of Richmond, England, Sci. Total Environ.138 (1993) 183–206.
12] D.L. Simon, E.J. Maynard, K.D. Thomas, Living in a sea of lead – changes in blood-and hand-lead of infants living near a smelter, J. Expo. Sci. Environ. Epidemiol.17 (2007) 248–259.
13] L.A. Schaider, D.B. Senn, D.J. Brabander, K.D. McCarthy, J.P. Shine, Character-ization of zinc, lead and cadmium mine waste: implications for transport,exposure and bioavailability, Environ. Sci. Technol. 41 (2007) 4164–4171.
14] A.L. Morrison, B.L. Gulson, Preliminary findings of chemistry and bioaccessibil-ity in base metal smelter slags, Sci. Total Environ. 382 (2007) 30–42.
15] K. Ljung, O. Selinus, E. Otabbong, M. Berglund, Metal and arsenic distribution insoil particles relevant to soil ingestion by children, Appl. Geochem. 21 (2006)1613–1624.
16] U.S. Environmental Protection Agency, Method 3015A, microwave assisted aciddigestion of aqueous samples and extracts, in: USEPA Methods, EPA, Washing-ton, DC, 1998, pp. 3015A/1–3015A/18.
17] M.E. Kelley, S.E. Brauning, R.A. Schoof, M.V. Ruby, Assessing Oral Bioavailabilityof Metals in Soil, Battelle Press, Columbus, OH, 2002.
18] J.W. Drexler, W.J. Brattin, An in vitro procedure for the estimation of lead rela-tive bioavailability: with validation, Hum. Ecol. Risk Assess. 13 (2007) 383–401.
19] T.R. Van de Wiele, A.G. Oomen, J. Wragg, M. Cave, M. Minekus, A. Hack, C. Cor-nelis, C.J.M. Rompelberg, L.L. de Zwart, B. Klinck, J. van Wijen, W. Verstraete,A.J.A.M. Sips, Comparison of five in vitro digestion models to in vivo experimen-tal results: lead bioaccessibility in the human gastrointestinal tract, J. Environ.Sci. Health Part A 42 (2007) 1203–1211.
20] USEPA, Integrated Exposure Uptake Biokinetic Model Soil/Dust Ingestion Rates,EPA 540-F-00-007, Washington, DC, USA, 1999.
21] USEPA, Attachment E, Selection of Soil Ingestion Rates,http://www.epa.gov/region1/, 2010.
22] World Health Organization, Report of the 30th Meeting of the Joint FAO/WHOExpert Committee on Food Additives, Rome, June 2–11, Geneva, 1987.
23] E.J. Maynard, L.J. Franks, M.S. Malcolm, The Port Pirie Lead ImplementationProgram, Future Focus and Directions, Department of Health, Government ofSouth Australia, Adelaide, December 2005.
24] P.E. Rasmussen, K.S. Subramanian, B.J. Jessiman, A multi-element profile ofhousehold dust in relation to exterior dust and soils in the city of Ottawa,Canada, Sci. Total Environ. 267 (2001) 125–140.
25] T.M. Young, D.A. Heeraman, G. Sirin, L.L. Ashbaugh, Resuspension of soil as asource of airborne lead near industrial facilities and highways, Environ. Sci.Technol. 36 (2002) 2482–2490.
26] D. Bannon, J.W. Drexler, G.M. Fent, S.W. Casteel, P.J. Hunter, W.J. Brattin, M.A.Major, Evaluation of small arms range soils for metal contamination and leadbioavailability, Environ. Sci. Technol. 43 (2009) 9071–9076.
27] E. Smith, I. Kempson, A.L. Juhasz, J. Weber, A. Rofe, D. Gancarz, R. Naidu, R.G.McLaren, M. Gräfe, In vivo–in vitro and XANES spectroscopy assessments oflead bioavailability in contaminated peri-urban soils, submitted for publica-tion.
28] R.A. Schoof, M.K. Butcher, C. Sellstone, R.W. Ball, J.R. Fricke, V. Keller, B. Keehn,An assessment of lead absorption from soil affected by smelter emissions, Env-iron. Geochem. Health 17 (1995) 189–199.
29] M.A. Ruby, A. Davis, T.E. Link, R. Schoof, R.L. Chaney, G.B. Freeman, P. Bergstrom,Development of an in vitro screening test to evaluate the in vivo bioaccessibilityof ingested mine-waste lead, Environ. Sci. Technol. 27 (1993) 2870–2877.
30] M.V. Ruby, R. Schoof, W. Brattin, M. Goldade, G. Post, M. Harnois, D.E.Mosby, S.W. Casteel, W. Berti, M. Carpenter, D. Edwards, D. Cragin, W. Chap-pell, Advances in evaluating the oral bioavailability of inorganics in soilfor use in human health risk assessment, Environ. Sci. Technol. 33 (1999)3697–3705.
31] J.L. Schroder, N.T. Basta, S.W. Casteel, T.J. Evans, M.E. Payton, J. Si, Validation ofthe in vitro gastrointestinal (IVG) method to estimate relative bioavailable leadin contaminated soils, J. Environ. Qual. 33 (2004) 513–521.
32] P.E. Rasmussen, D.M. Hughes, In vitro exrtraction methods for determiningbioaccessible metals in residential dust and soil, in: VIth Conference of theInternational Society for Trace Element Research in Humans (ISTERH), Septem-ber 7–12, Quebec City, Quebec, Canada, 2002.
33] P.E. Rasmussen, Can metal concentrations in indoor dust be predicted from soilgeochemistry? Can. J. Anal. Sci. Spectrosc. 49 (2004) 166–174.

dous M
[
[
[
[
[
[
[
[
A.L. Juhasz et al. / Journal of Hazar
34] C.H. Yu, L.-M. Yin, P.J. Lioy, The bioaccessibility of lead (Pb) from vacuumedhouse dust on carpets in urban residences, Risk Anal. 26 (2006) 125–134.
35] M.V. Ruby, A. Davis, R. Schoof, S. Eberle, C.M. Sellstone, Estimation of lead andarsenic bioavailability using a physiologically based extraction test, Environ.Sci. Technol. 30 (1996) 422–430.
36] A.L. Juhasz, J. Weber, E. Smith, R. Naidu, B. Marschner, M. Rees, A. Rofe, T. Kuchel,L. Sansom, Evaluation of SBRC-gastric and SBRC-intestinal methods for the pre-diction of in vivo relative lead bioavailability in contaminated soils, Environ. Sci.
Technol. 43 (2009) 4503–4509.37] W. Stumm, J.J. Morgan, Aquatic Chemistry, Chemical Equilibria and Rates inNatural Waters, John Wiley & Sons, New York, 1996.
38] B. Marschner, P. Welge, A. Hack, J. Wittsiepe, M. Wilhelm, Comparison of soilPb in vitro bioaccessibility and in vivo bioavailability with Pb pools from asequential soil extraction, Environ. Sci. Technol. 40 (2006) 2812–2818.
[
aterials 186 (2011) 1870–1879 1879
39] N. Yamamoto, Y. Takahashi, J. Yoshinaga, A. Tanaka, Y. Shibata, Size distributionof soil particles adhered to children’s hands, Arch. Environ. Contam. Toxicol. 51(2006) 157–163.
40] S.D. Siciliano, K. James, G.Y. Zhang, A.N. Schafer, J.D. Peak, Adhe-sion and enrichment of metals on human hands from contaminatedsoil at an arctic urban brownfield, Environ. Sci. Technol. 43 (2009)6385–6390.
41] USEPA, User’s Guide for the Integrated Exposure Uptake Biokinetic Model for
Lead in Children (IEUBK) Windows® . EPA 9285.7-42, 540-K-01-005, Washing-ton, DC, 2007.42] C. Cornelis, P. Berghmans, M. van Sprungel, J.-C. Van der Auw-era, Use of the IEUBK model for determination of exposure routesin view of site remediation, Hum. Ecol. Risk Assess. 12 (2006)963–982.