impact of rural infrastructure on the livelihood of …ageconsearch.umn.edu/bitstream/246314/2/73....
TRANSCRIPT
Impact of rural infrastructure on the livelihood of
smallholders in agrarian communities in Edo state,
Nigeria
Emokaro, C.O. and Oyoboh, D.E.
Invited paper presented at the 5th International Conference of the African Association of
Agricultural Economists, September 23-26, 2016, Addis Ababa, Ethiopia
Copyright 2016 by [authors]. All rights reserved. Readers may make verbatim copies of this
document for non-commercial purposes by any means, provided that this copyright notice
appears on all such copies.
1
Impact of rural infrastructure on the livelihood of smallholders in agrarian
communities in Edo state, Nigeria
Emokaro, C.O. and *Oyoboh, D.E.
Department of Agricultural Economics and Extension Services, Faculty of Agriculture,
University of Benin, P.M.B. 1154, Benin City, Edo State, NIGERIA
*Corresponding author’s email: [email protected]
ABSTRACT
Smallholders with total farm holdings of less than five hectares constitute about 70% of the
farming population in Nigeria, producing most of the food crops thereby contributing to food
security and poverty reduction. This huge contribution not withstanding they are faced with
the challenges of inadequate agricultural infrastructure, much needed for optimal
productivity. There is therefore a need to improve the general livelihood of these largely
agrarian rural poor. The impact of the Community Driven Development (CDD) approach of
Edo State Government Community and Social Development Project (CSDP) in meeting the
overall development objective of sustainably increasing access of the poor to rural
infrastructure was evaluated in this study. The study was carried out in 44 communities
spread across the three Senatorial Districts of Edo State. A stratified sampling procedure
was employed in selecting the 22 treatment communities and their corresponding
counterfactuals for this study. Fifteen households were selected from each of the 44
communities to give a total sample size of 660 respondents. Descriptive and quantitative
techniques such as frequency tables, means, standard deviation, percentages, comparative
cost ratios and Difference-in-Differences (DD) were employed in analyzing the data
generated. Results of the socioeconomic characteristics of respondents showed that they were
mainly smallholder farmers with mean farm size and annual income of 0.23ha and N
133,500, respectively. Their average age and household size were 45 years and eight persons
respectively. Over 60% of the respondents were men and about 40% of them had formal
education up to secondary school level. Results of the economic analysis indicated that the
cost of all the Micro Projects embarked upon by Edo State CSDP averaged about
N4,867,704.11. The estimated comparative cost ratio showed that the cost of CSDP Micro
Projects were, at the least, about a third of the average alternative cost of similar projects
embarked upon by the State Government, Local Government Areas (LGAs) and the Niger
Delta Development Commission (NDDC). The highest comparative cost ratio of 4.55, was
recorded in the skills acquisition project. The lowest ratio of 1.6 was however recorded in the
town hall (civic center) project. Results of the causality between CSDP Micro Projects (MPs)
and outcomes in the six sectors considered showed that the education sector had a reduction
of 29.72 minutes in the average time taken by students to get to school and 0.69 kilometers in
average distance to school due to Edo State CSDP intervention in the construction and
rehabilitation of schools. In the water sector, a DD of 425 persons fetching water for
domestic purpose was recorded, a 47% reduction in the cost of buying water with 65% of the
community members now having access to portable water as a result of CSDP intervention in
the provision of motorized boreholes. Average distance to water source equally reduced by
5.82 kilometers, while average time spent in fetching water reduced by 10. 56 minutes. The
result also showed a 61% reduction in reported cases of water borne diseases, with 70% of
the respondents opining that there is a change in personal hygiene after the provision of
water facilities by Edo State CSDP. In conclusion, the effectiveness of the CDD process in
improving the lives of the agrarian populace in Edo State has been shown empirically. Effort
should be made by stakeholders in agricultural development to embrace this process and
ensure the sustainability of these gains.

2
Key words: Counterfactual, Difference in Difference, Food Security, Hygiene, Optimal,
Poverty
INTRODUCTION
If agriculture, particularly smallholder agriculture is to provide one of the principal routes out
of poverty for the next generation of rural men and women, and create the sectoral growth
that provides non-farm opportunities for others, it must be an agriculture that is productive,
profitable and sustainable. It needs to be agriculture that helps reduce the vulnerabilities of
poor rural people to risks and shocks. It needs to be an agriculture that can support the
livelihoods of future generations, one that does not deplete, but rather helps to protect or
restore, the natural resource base (IFAD, 2011). Curiously, the inconceivable fact is that
agriculture has remained undeveloped in Sub-Saharan Africa (SSA) despite remaining the
mainstay of our national economies. Ayuk (2014), opined that since a majority of the
population lives in rural areas and depends directly or indirectly on agriculture, it is expected
to play a central role for livelihood, growth and development. The agrarian sector has a
strong rural base; hence, concern for agriculture and rural development become synonymous,
with a common root. The sector plays a dominant role in the food security of the people. It
employs between 60-75% of the labour force in the continent and contributes between 8-45%
to the GDP (World Bank, 2008; Ayuk, 2014).
According to Machethe, et al. (2004), smallholder agriculture is important to employment,
human welfare, and political stability in Sub-Saharan Africa. In addition, smallholder
agriculture can moderate the rural exodus, create growth linkages and enlarge the market for
industrial goods. Smallholder agriculture is also considered to be both a major cause of and
potential solution to poverty and economic growth challenges (Machethe, et al., 2004).
Smallholder farming literally is a type of farming that feeds the farmer’s family only. It is an
agricultural system in which a farm family or community uses what it produces and produces
what it uses. The smallholder does not keep markets in mind when planning production.
Individual farmers are islands in the agricultural inputs and outputs markets or exchange
system. These resource-poor smallholders (Emokaro and Erhabor, 2006) who contribute
more than 90% of agricultural output in Nigeria in particular (FMA&WR, 2008) and Sub-
Saharan Africa in general (Spencer, 2002), must be assisted to rise beyond their current level
of subsistence. One of the ways of doing this is to study their current production effort and
identify gaps that could be bridged for optimum results (Emokaro and Omorebgee, 2011).
In many African countries, food security situation at both national and household level is
poor. Nigeria, like other developing countries, is still facing persistent food crisis in spite of
her vast land area of about 923,768 km2. She cannot produce enough food in adequate
quantity and quality to feed her over 140 million people. The common people especially
those living in the rural areas that lack access to sufficient resources to produce or buy quality
food, are worse hit by the food security phenomenon (Emokaro and Edemanrhia, 2014).
Poverty within Nigeria remains staggeringly high with over 50% and 70% of its general and
rural population respectively living on less than one US dollar per day (World Bank, 2007).
Consequently, effort must be targeted at transforming this important sector so as to foster
national development and poverty alleviation.

3
According to Parson (1966), agricultural development, is a transformation process which
involves structural changes of an economy from a smallholder base to one that is industrial-
urban oriented. The relationship between rural infrastructure and production in the
agricultural sector is high and almost complimentary. Eboh (2013) defined agricultural
development as an integrated approach to food production, provision of physical, social and
institutional infrastructure with an ultimate goal of bringing about quantitative changes which
culminate in improved standard of living of the rural population. Timmer (1998) referred to
agricultural transformation as the transition from low productivity to high productivity
commercial agriculture. Transformation looks for an approach that is characterized by greater
partnership between federal, state and local government, economic entities, private industry
and other community groups. The process of agricultural transformation involves
diversification in the agricultural sector to meet changing domestic and trade demands (Eboh,
2013). Transformation of the Nigerian agricultural sector is therefore a necessary instrument
if the country is going to achieve increase in domestic agricultural productivity.
Agricultural transformation is not only about food but also about the economy. The
dimensions of this transformation are not only economic, but also include formal and
informal institutional changes which are sociological or political in character (Colman and
Nixson, 1994). The process of agricultural transformation involves a greater reliance on input
and output delivery systems and increase in integration of agriculture with other sectors of the
domestic and international economies (Obayelu and Obayelu, 2012). Agricultural
transformation is characterized as a process of sustainable modernizing agriculture and such a
process is often measured by significant improvement in land and labour productivity, greater
market-orientation and production diversification, as well as increased domestic and
international competiveness (Diao, 2010).
Institutional change in general and market development in particular are necessary parts of
transformation. Most economists agree that the quality of institutions can explain differences
in growth and transformation process by shaping incentives to develop new technologies and
innovation (Easterly and Levine, 2003; Rodrik, et al., 2004). Idachaba, et al. (1980) classified
capital intensive infrastructures into three: Rural Social Infrastructure (RST) like health
facilities, education facilities, rural utilities such as water and electricity supply; Rural
Physical Infrastructure (RPI) like transportation, storage processing, soil conservation and
irrigation systems and Rural Institutional Infrastructure (RII) which are institutions
established to give support to the agricultural sectors such as research, credit, marketing and
cooperative institutions. The relevance of the identified infrastructure to agricultural
production cannot be over emphasized. In Nigeria, it is estimated that only about 10% of
rural dwellers and about 40% of urban families have access to electricity that is usually
interrupted and unreliable, with only about 30% of their demand being met (Onohaebi, 2014).
The Federal Government of Nigeria (FGN) and the World Bank (WB) are unanimous on the
desirability of the Community Driven Development (CDD) approach in the overall strategy
for poverty reduction in the country. The Community Social Development Project (CSDP)
emerged in 2008 as a new intervention that was designed to effectively target social and
environmental infrastructure at the community level, as well as improve Local Government
Area (LGA) responsibility to service delivery. The development objective of this project was
4
to sustainably increase access of poor people to improved social and natural resource
infrastructure services (CSDP, 2008). In the light of these developments, the question that
readily comes to mind with respect to governance and farming communities in Edo State is
whether the provision of rural infrastructure has made any impact on the livelihood of
smallholders in the State?
The main objective of this study was thus to evaluate the impact of the CDD based CSDP
intervention on the livelihood of smallholders in the largely agrarian participating
communities and to evaluate the cost effectiveness of such projects in comparison with
alternative interventions in Edo State. The aim is to assess changes in the well-being of
individuals, households or communities attributable to the CSDP Micro Projects. The key
performance indicator would be; increased number of smallholders with access to social
services and access to rural infrastructure.
METHODOLOGY
Study Area: This study was carried out in 44 communities participating in CSDP projects in
Edo State. These communities are spread over the three Senatorial districts of the State,
namely, Edo South, Central and North, with seven, five and six Local Government Areas
respectively.
Sampling Technique/Procedure: A stratified sampling procedure was employed in
selecting the 22 treatment communities and their corresponding counterfactuals for this study.
The treatment communities were selected, based on completed and functional micro-projects
from six sectors, as at July 2013. For effective impact evaluation and comparison, the
following minimum period of time was used; Education (2 years), Water (1 year), Health (1
year), Transport (1 year), Rural Electrification (6 months) and Socio-Economic Activities (6
months).
Fifteen households were randomly selected from each of the 22 selected treatment
communities. In addition, equal number of non-benefiting communities and households were
selected as control for the estimation of counterfactuals per sector. Benefiting and non-
benefiting communities were identified in conjunction with the State Agency. In this study,
maximum of five communities per sector were chosen for both treatment and control. Where
the number of micro-projects in the communities by sector were not up to five, all the
communities that executed the projects were taken (as was the case in Health and Transport
sectors, where only one project was chosen respectively). All the interventions in
socioeconomic sector were regarded as a sector and treated as such. For the estimation of
counterfactual, the control communities selected were close to the treated communities and
they shared similar socioeconomic characteristics. Ultimately, 44 communities and 660
households were selected for both benefitting and non-benefiting communities respectively.
The sampled micro-projects and their respective sector, community and Local Government
Areas are presented in the Table 1.

5
Table 1: Sectoral Distribution of Sampled Micro-Projects per Treatment and
Counterfactual Community respectively
S/N Communities
Treatment
Counterfactual
Micro-Project Sector
1 Ekpedo Lampese School Staff Quarters Education
2 Iyamoh Ogido Secondary School Education
3 Okhokhugbo Igieghudu Sec. Sch. Class Room Education
4 Uhen Ugbuwe Sec. Sch. Renovation Education
5 Ugbogui Utesse School Staff Quarters Education
1 Eyaen I Irhue-nowina Electrification Electrification
2 Obenevbueribo Ehanlen Electrification Electrification
3 Osakwe Emaudo Electrification Electrification
4 Powerline Evbuekhae Electrification Electrification
5 Uselu Nahor Uyinmwendin Electrification Electrification
1 Auchi Ibienefe Lock-up Stores Socio-
Economic
2 Idumonka Egbeta Town Hall Socio-
Economic
3 Igiode Ikao Skill Acquisition
Center
Socio-
Economic
4 Oria Amendokhian Town Hall Socio-
Economic
5 Utagban Azagban Town Hall Socio-
Economic
1 Agbodo Ikpe Water Scheme Water
2 Agbomoba Evbuabogun Water Scheme Water
3 Eguare-Ewu Ogbesse Water Scheme Water
4 Ogwa Ofumwengbe Water Scheme Water
5 Otuo Ivuikwe Water Scheme Water
1 Oduna Okeze Primary Health Center Health
1 Abiala I Abiala II Speed Boat Transport
Source: Computed from Survey Data, 2013.
Data Collection: A combination of qualitative and quantitative research methods were used
in generating the data for this study. Primary data were obtained using, Focus Group
Discussions (FGDs), case studies, key informant interviews and in-depth interview, with the
aid of structured questionnaire sets. Secondary data were obtained from Monitoring and
Evaluation data sets of the State Agency including baseline, written official records, school
and clinic records, brief interview and schedules.
Data Analysis: To establish causality between a program and an outcome, impact evaluation
method that rules out the possibility of any factors other than the program of interest will be

6
used to explain the impact. The impact or causal effect (α) of a program (P) on an outcome of
interest (Y) is given by: ∝= (𝑌|𝑃 = 1) − (𝑌|𝑃 = 0)
That gives the difference between the outcome of with (P=1) and without (P=0) the program.
This approach therefore necessitates the estimation of counterfactual. At any given moment
in time, a community either participated in the program or did not participate. Since the
community cannot be observed simultaneously in two different states, it is called the
counterfactual problem. The counterfactual is an estimate of what the outcome (Y) would
have been for a program participant in the absence of the program (P). The concept of CSDP
requires that Difference-in-Differences (DD) be used for the impact evaluation. DD estimates
the counterfactual for the change in outcome for the treatment group by calculating the
change in outcome for the comparison group. This method takes into account any differences
between the treatment and comparison groups that are constant over time. This impact
evaluation tool was used to elicit the differences in outcomes of the respective State CSDP
interventions.
Descriptive and quantitative techniques such as frequency tables, means, standard deviation,
percentages and ratios, were employed in the analysis of the study data. The comparative cost
ratio (which is the average alternative cost, deflated by the CSDP cost), was used in ascertain
the cost effectiveness of the CSDP micro projects as against alternative projects.
RESULTS AND DISCUSSION
Socioeconomic Characteristics of Respondents
The socioeconomic characteristics of a total of 641 respondents sampled from both the
treatment and control communities were described in this section, as summarized in Table 2,
and discussed under their respective sub-headings.
Sex Categorization of Respondents: The study area was dominated by men (392 as against
249 women). The crucial role played by women in a rural economy cannot be
overemphasized, irrespective of the patrimonial nature of the Nigerian society, as confirmed
by this result. This further strengthens the argument for the mainstreaming of the womenfolk,
so as to avoid lopsidedness in our developmental drive.
Level of Education: Result shown in Table 2 indicates high level of literacy among the
respondents. This is a positive indication that beneficiary communities (from where this
sample was drawn), would understand with little promptings, the rudiments of the CDD
driven CSDP initiative in the developmental drive of their respective communities.
Marital Status: Most of the sampled respondents (495 out of 641 persons) were married.
This could suggest stability and societal cohesion, attributes that can easily translate to
socially responsible behavior, capable of enhancing the identified goals of development.
Other Socio-Economic Characteristics of the respondents: The respondents were mainly
smallholders with a mean farm size of 0.23 and averaged income of N 133,000/annum. They
were still in their active/productive years, with a mean age of 45 years, and average
household size of eight persons.
This annual income value is less than the N 217,872/annum reported by Emokaro and
Edemanrhia (2014). The categorization of respondents as smallholders based on their average

7
farm size however agrees with the findings of Akinwale (2000) and Idowu, et al. (2007), who
regarded cocoa farmers with less than five hectares as smallholders in their respective studies.
These indices confirm the poverty status of the respondents, thereby buttressing the need to
find ways of improving on their income generating power from agricultural activities. Effort
must be made to help reduce the vulnerabilities of these poor rural folks to risks and shocks.
This would help create an agriculture that can support the livelihoods of future generations,
one that does not deplete, but rather helps to protect or restore, the natural resource base
(IFAD, 2011).
Table 2: Summary Statistics of Respondents Socioeconomic Characteristics
Variables Mean Standard
deviation
Variance Dominance analysis
Definition Value
Age of respondents
(years)
45.0 2.8 8.0 % within the age bracket of
26 – 60
66.0
Sex of respondents (1
= male, 0 = female
% of male respondents 61.0
Marital status (1 =
married, 0 =
otherwise)
% of married respondents 77.2
Formal Education
(years)
9.0 1.7 2.9 % of respondents with more
than six years of formal
education
57.0
Household size
(numbers)
8.0 2.0 4.0 % of respondents with more
than seven individuals in
the household
62.0
Experience in primary
occupation (years)
16.0 2.9 8.5 % of respondents with more
than 10 years of experience
77.0
Membership of
association (1= Yes, 0
= No)
% of respondents who were
members of associations
35.4
Engagement in
agricultural activities
(1= Yes, 0 = No)
Farm size (hectares)
0.23 1.6 2.0 % of respondents who are
engaged in agricultural
activities
61.0
Total amount of
income generated per
N133,500:00 3.7 13.7 % of respondents with more
than N240,000:00 annual
26.0

8
year income
Source: Computed from Survey Data, 2013.
Sectoral Analysis of Project Performance
Result of the outcome, output and impact of CPMC Micro Projects on the livelihood of
respondents is analyzed in this section. The outcome indicators for all the community driven
investments in Education, Water, Health, Transport, Electricity and Socioeconomic Sectors
are presented in Tables 3 – 8.
Education: Outcome results in the education sector were positive, based on available indices
(Table 3). The causality between CSDP Micro Projects (MPs) and outcomes showed that the
education sector had a reduction of 29.72 minutes in the average time taken by students to get
to school and 0.69 kilometers in average distance to school due to Edo State CSDP
intervention in the construction and rehabilitation of schools. Measurable improvements were
also recorded in number of students in science classes in Iyamoh community, where a science
laboratory was provided. These outcomes should encourage the State and LGA authorities to
intensity effort in this direction, for the purpose of strengthening agricultural productivity on
a sustainable basis.
Table 3: Outcome Result in the Education Sector
S/N Indicator Definition Unit of
Measure
Treated
Difference in outcomes
(before and after)
Control
Difference in outcomes
(before and after)
Treated
Outcome
Control
Outcome
DD
TC1 TC2 TC3 TC4 TC5 CC1 CC2 CC3 CC4 CC5 Average Average
1 Increase in
the no of
school age
children
enrolled in
schools
Number of
additional
children that
have registered
in the schools
(disaggregated
by Male and
Female)
Number
Male:
Female:
NA
NA
NA
NA
NA
NA
NA
NA
NA
NA
-
-
-
-
-
-
-
-
-
-
-
-
-
-
-
-
2 Average
time taken
to get to
school
Average time
taken to get to
school from
different sections
of the
community.
Minutes
0 15.6 0 0 43.84 - - - - - 29.72 - 29.72
3 Average
distance
taken to get
to school
Average distance
taken to get to
school from
different sections
of the
community.
Km 0 0.61 0 0 0.76 - - - - - 0.685
4 Average
school
attendance
Average no. of
pupils/students
that come to
school
(disaggregated
Number
Male:
Female:
NA
NA
NA
NA
NA
NA
NA
NA
NA
NA
-
-
-
-
-
-
-
-
-
-
-
-
-
-
-
-
9
by male and
female)
5 Students
learning
sciences
No. of students
in science classes
(disaggregated
by male and
female)
Number
(Male):
(Female):
-
-
-
-
46
-
-
-
-
-
-
-
-
-
-
-
-
-
-
-
46
-
-
-
46
-
6 Student's
library
attendance
No. of
students using
the library
(disaggregated
into male and
female)
Number
NA
NA
-
-
-
-
-
-
-
-
-
-
-
-
-
-
-
-
-
-
-
-
-
-
-
-
Source: Computed from Survey Data, 2013.
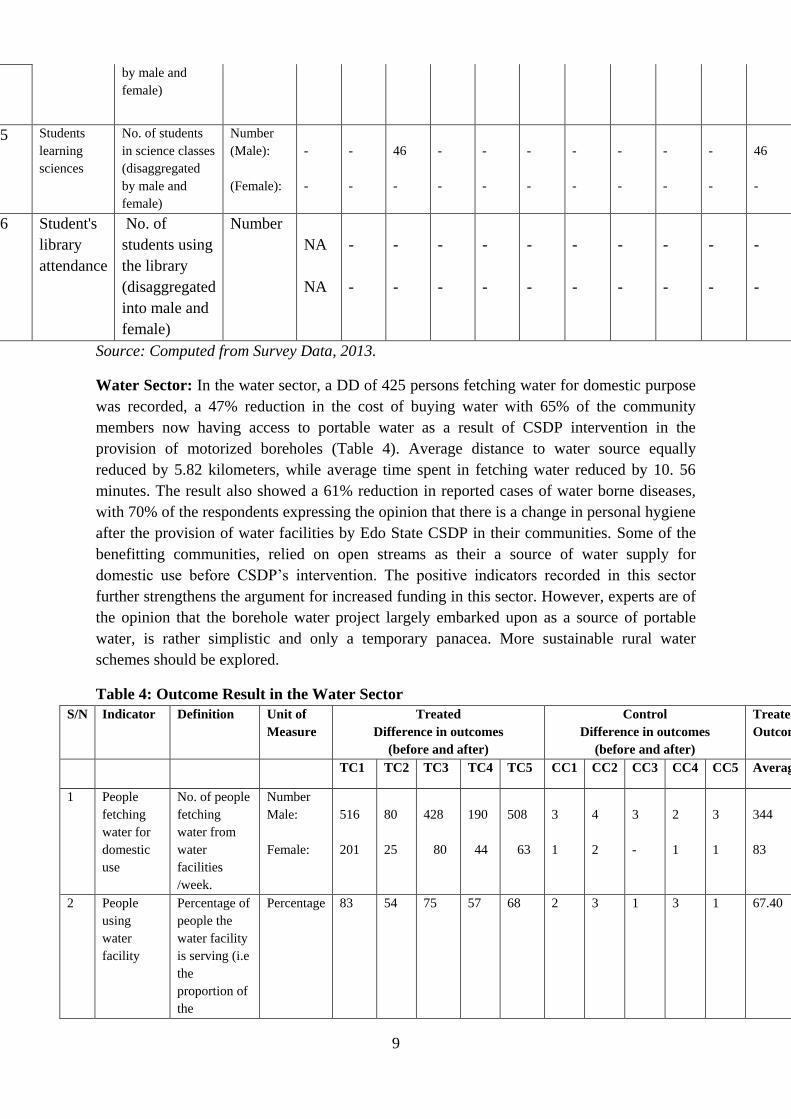
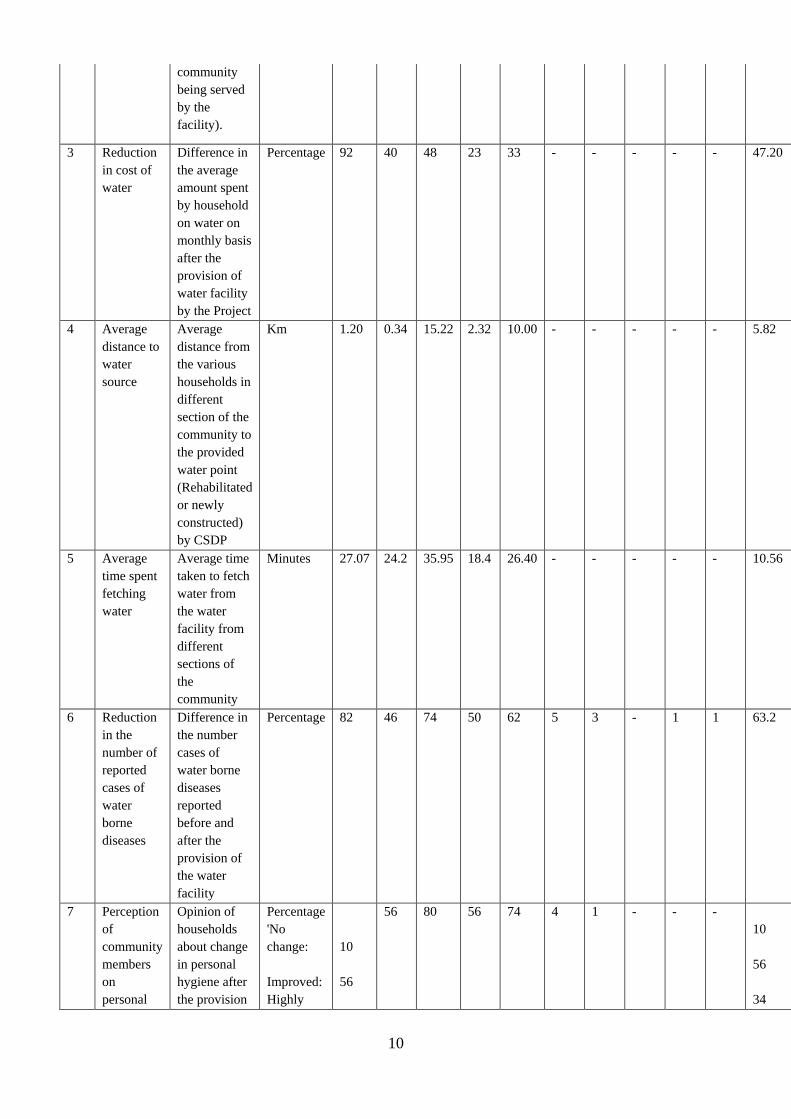
Water Sector: In the water sector, a DD of 425 persons fetching water for domestic purpose
was recorded, a 47% reduction in the cost of buying water with 65% of the community
members now having access to portable water as a result of CSDP intervention in the
provision of motorized boreholes (Table 4). Average distance to water source equally
reduced by 5.82 kilometers, while average time spent in fetching water reduced by 10. 56
minutes. The result also showed a 61% reduction in reported cases of water borne diseases,
with 70% of the respondents expressing the opinion that there is a change in personal hygiene
after the provision of water facilities by Edo State CSDP in their communities. Some of the
benefitting communities, relied on open streams as their a source of water supply for
domestic use before CSDP’s intervention. The positive indicators recorded in this sector
further strengthens the argument for increased funding in this sector. However, experts are of
the opinion that the borehole water project largely embarked upon as a source of portable
water, is rather simplistic and only a temporary panacea. More sustainable rural water
schemes should be explored.
Table 4: Outcome Result in the Water Sector
S/N Indicator Definition Unit of
Measure
Treated
Difference in outcomes
(before and after)
Control
Difference in outcomes
(before and after)
Treated
Outcome
Control
Outcome
DD
TC1 TC2 TC3 TC4 TC5 CC1 CC2 CC3 CC4 CC5 Average Average
1 People
fetching
water for
domestic
use
No. of people
fetching
water from
water
facilities
/week.
Number
Male:
Female:
516
201
80
25
428
80
190
44
508
63
3
1
4
2
3
-
2
1
3
1
344
83
3
1
343
82
2 People
using
water
facility
Percentage of
people the
water facility
is serving (i.e
the
proportion of
the
Percentage 83 54 75 57 68 2 3 1 3 1 67.40 2 65.40
10
community
being served
by the
facility).
3 Reduction
in cost of
water
Difference in
the average
amount spent
by household
on water on
monthly basis
after the
provision of
water facility
by the Project
Percentage 92 40 48 23 33 - - - - - 47.20 - 47.20
4 Average
distance to
water
source
Average
distance from
the various
households in
different
section of the
community to
the provided
water point
(Rehabilitated
or newly
constructed)
by CSDP
Km 1.20 0.34 15.22 2.32 10.00 - - - - - 5.82 - 5.82
5 Average
time spent
fetching
water
Average time
taken to fetch
water from
the water
facility from
different
sections of
the
community
Minutes 27.07 24.2 35.95 18.4 26.40 - - - - - 10.56 - 10.56
6 Reduction
in the
number of
reported
cases of
water
borne
diseases
Difference in
the number
cases of
water borne
diseases
reported
before and
after the
provision of
the water
facility
Percentage 82 46 74 50 62 5 3 - 1 1 63.2 2 61.2
7 Perception
of
community
members
on
personal
Opinion of
households
about change
in personal
hygiene after
the provision
Percentage
'No
change:
Improved:
Highly
10
56
56 80 56 74 4 1 - - -
10
56
34
96
04
-
10
56
34
11
hygiene of water
facility.
improved: 34
Source: Computed from Survey Data, 2013.
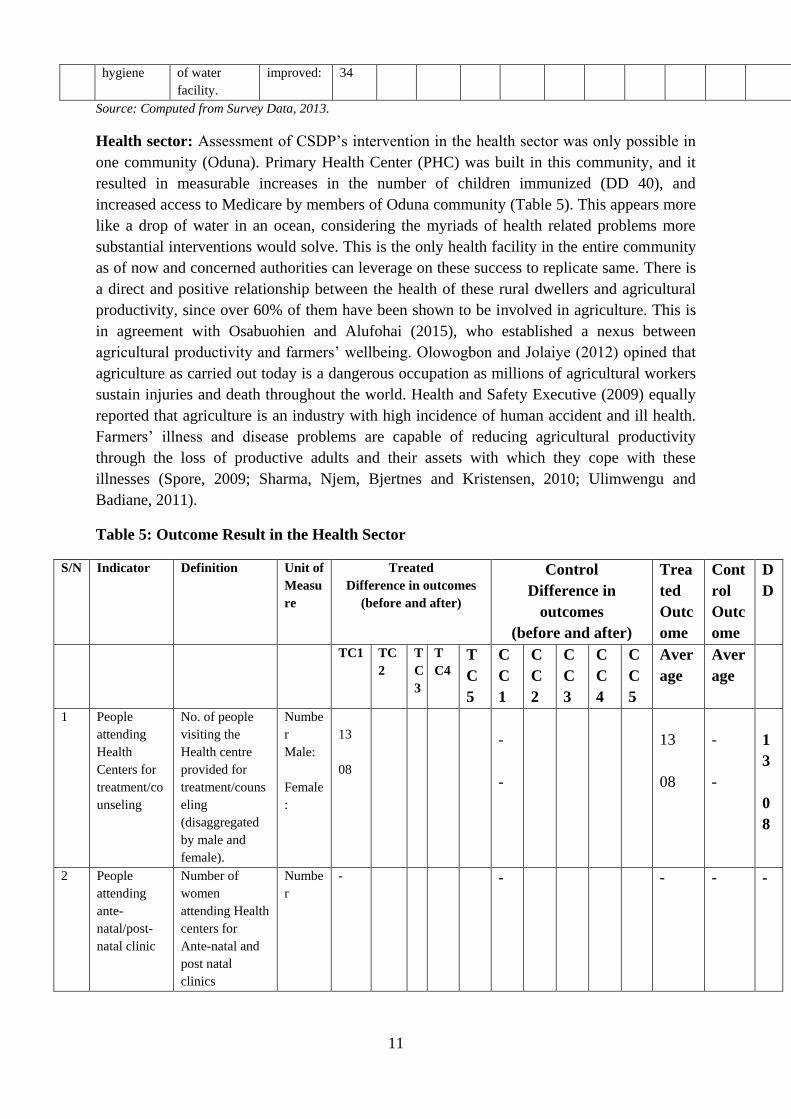
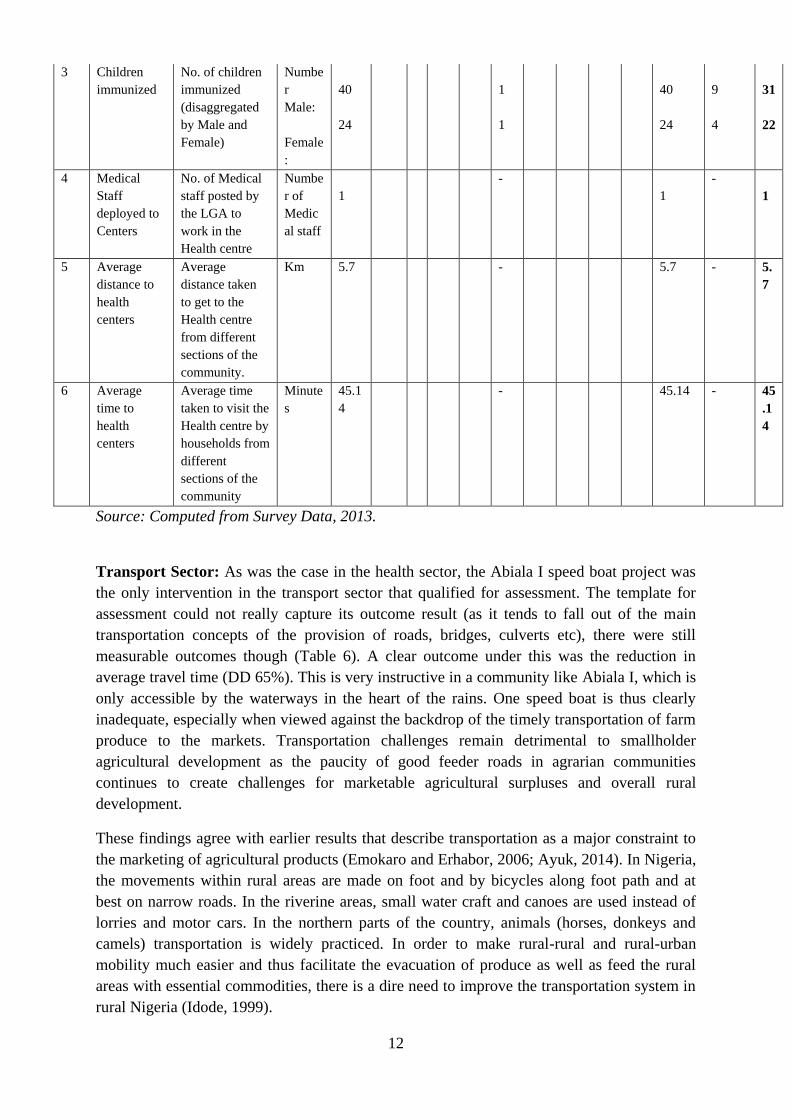
Health sector: Assessment of CSDP’s intervention in the health sector was only possible in
one community (Oduna). Primary Health Center (PHC) was built in this community, and it
resulted in measurable increases in the number of children immunized (DD 40), and
increased access to Medicare by members of Oduna community (Table 5). This appears more
like a drop of water in an ocean, considering the myriads of health related problems more
substantial interventions would solve. This is the only health facility in the entire community
as of now and concerned authorities can leverage on these success to replicate same. There is
a direct and positive relationship between the health of these rural dwellers and agricultural
productivity, since over 60% of them have been shown to be involved in agriculture. This is
in agreement with Osabuohien and Alufohai (2015), who established a nexus between
agricultural productivity and farmers’ wellbeing. Olowogbon and Jolaiye (2012) opined that
agriculture as carried out today is a dangerous occupation as millions of agricultural workers
sustain injuries and death throughout the world. Health and Safety Executive (2009) equally
reported that agriculture is an industry with high incidence of human accident and ill health.
Farmers’ illness and disease problems are capable of reducing agricultural productivity
through the loss of productive adults and their assets with which they cope with these
illnesses (Spore, 2009; Sharma, Njem, Bjertnes and Kristensen, 2010; Ulimwengu and
Badiane, 2011).
Table 5: Outcome Result in the Health Sector
S/N Indicator Definition Unit of
Measu
re
Treated
Difference in outcomes
(before and after)
Control
Difference in
outcomes
(before and after)
Trea
ted
Outc
ome
Cont
rol
Outc
ome
D
D
TC1 TC
2
T
C
3
T
C4
T
C
5
C
C
1
C
C
2
C
C
3
C
C
4
C
C
5
Aver
age
Aver
age
1 People
attending
Health
Centers for
treatment/co
unseling
No. of people
visiting the
Health centre
provided for
treatment/couns
eling
(disaggregated
by male and
female).
Numbe
r
Male:
Female
:
13
08
-
-
13
08
-
-
1
3
0
8
2 People
attending
ante-
natal/post-
natal clinic
Number of
women
attending Health
centers for
Ante-natal and
post natal
clinics
Numbe
r
- - - - -
12
3 Children
immunized
No. of children
immunized
(disaggregated
by Male and
Female)
Numbe
r
Male:
Female
:
40
24
1
1
40
24
9
4
31
22
4 Medical
Staff
deployed to
Centers
No. of Medical
staff posted by
the LGA to
work in the
Health centre
Numbe
r of
Medic
al staff
1
-
1
-
1
5 Average
distance to
health
centers
Average
distance taken
to get to the
Health centre
from different
sections of the
community.
Km 5.7 - 5.7 - 5.
7
6 Average
time to
health
centers
Average time
taken to visit the
Health centre by
households from
different
sections of the
community
Minute
s
45.1
4
- 45.14 - 45
.1
4
Source: Computed from Survey Data, 2013.
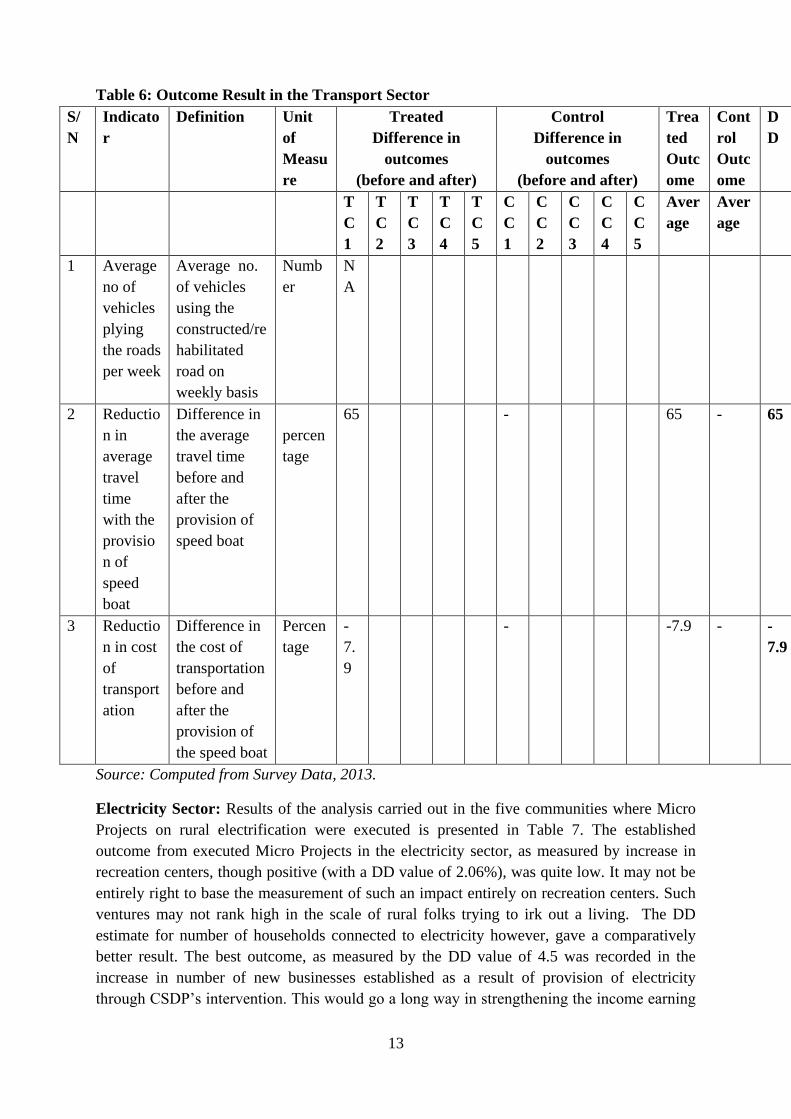
Transport Sector: As was the case in the health sector, the Abiala I speed boat project was
the only intervention in the transport sector that qualified for assessment. The template for
assessment could not really capture its outcome result (as it tends to fall out of the main
transportation concepts of the provision of roads, bridges, culverts etc), there were still
measurable outcomes though (Table 6). A clear outcome under this was the reduction in
average travel time (DD 65%). This is very instructive in a community like Abiala I, which is
only accessible by the waterways in the heart of the rains. One speed boat is thus clearly
inadequate, especially when viewed against the backdrop of the timely transportation of farm
produce to the markets. Transportation challenges remain detrimental to smallholder
agricultural development as the paucity of good feeder roads in agrarian communities
continues to create challenges for marketable agricultural surpluses and overall rural
development.
These findings agree with earlier results that describe transportation as a major constraint to
the marketing of agricultural products (Emokaro and Erhabor, 2006; Ayuk, 2014). In Nigeria,
the movements within rural areas are made on foot and by bicycles along foot path and at
best on narrow roads. In the riverine areas, small water craft and canoes are used instead of
lorries and motor cars. In the northern parts of the country, animals (horses, donkeys and
camels) transportation is widely practiced. In order to make rural-rural and rural-urban
mobility much easier and thus facilitate the evacuation of produce as well as feed the rural
areas with essential commodities, there is a dire need to improve the transportation system in
rural Nigeria (Idode, 1999).
13
Table 6: Outcome Result in the Transport Sector
S/
N
Indicato
r
Definition Unit
of
Measu
re
Treated
Difference in
outcomes
(before and after)
Control
Difference in
outcomes
(before and after)
Trea
ted
Outc
ome
Cont
rol
Outc
ome
D
D
T
C
1
T
C
2
T
C
3
T
C
4
T
C
5
C
C
1
C
C
2
C
C
3
C
C
4
C
C
5
Aver
age
Aver
age
1 Average
no of
vehicles
plying
the roads
per week
Average no.
of vehicles
using the
constructed/re
habilitated
road on
weekly basis
Numb
er
N
A
2 Reductio
n in
average
travel
time
with the
provisio
n of
speed
boat
Difference in
the average
travel time
before and
after the
provision of
speed boat
percen
tage
65 - 65 - 65
3 Reductio
n in cost
of
transport
ation
Difference in
the cost of
transportation
before and
after the
provision of
the speed boat
Percen
tage
-
7.
9
- -7.9 - -
7.9
Source: Computed from Survey Data, 2013.
Electricity Sector: Results of the analysis carried out in the five communities where Micro
Projects on rural electrification were executed is presented in Table 7. The established
outcome from executed Micro Projects in the electricity sector, as measured by increase in
recreation centers, though positive (with a DD value of 2.06%), was quite low. It may not be
entirely right to base the measurement of such an impact entirely on recreation centers. Such
ventures may not rank high in the scale of rural folks trying to irk out a living. The DD
estimate for number of households connected to electricity however, gave a comparatively
better result. The best outcome, as measured by the DD value of 4.5 was recorded in the
increase in number of new businesses established as a result of provision of electricity
through CSDP’s intervention. This would go a long way in strengthening the income earning
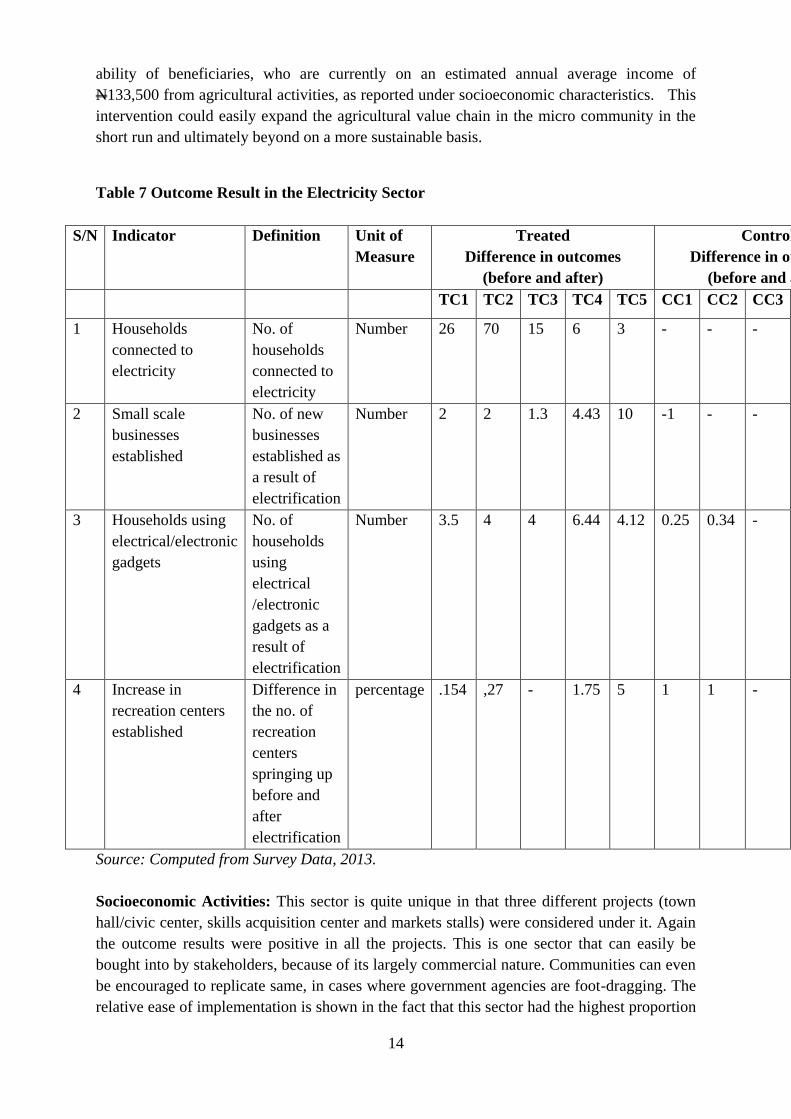
14
ability of beneficiaries, who are currently on an estimated annual average income of
N133,500 from agricultural activities, as reported under socioeconomic characteristics. This
intervention could easily expand the agricultural value chain in the micro community in the
short run and ultimately beyond on a more sustainable basis.
Table 7 Outcome Result in the Electricity Sector
S/N Indicator Definition Unit of
Measure
Treated
Difference in outcomes
(before and after)
Control
Difference in outcomes
(before and after)
Treated
Outcome
Control
Outcome
DD
TC1 TC2 TC3 TC4 TC5 CC1 CC2 CC3 CC4 CC5 Average Average
1 Households
connected to
electricity
No. of
households
connected to
electricity
Number 26 70 15 6 3 - - - - - 24 - 24
2 Small scale
businesses
established
No. of new
businesses
established as
a result of
electrification
Number 2 2 1.3 4.43 10 -1 - - -1 - 3.95 -1 4.95
3 Households using
electrical/electronic
gadgets
No. of
households
using
electrical
/electronic
gadgets as a
result of
electrification
Number 3.5 4 4 6.44 4.12 0.25 0.34 - - - 4.41 0.3 3.11
4 Increase in
recreation centers
established
Difference in
the no. of
recreation
centers
springing up
before and
after
electrification
percentage .154 ,27 - 1.75 5 1 1 - - 1.34 3.17 1.11 2.06
Source: Computed from Survey Data, 2013.
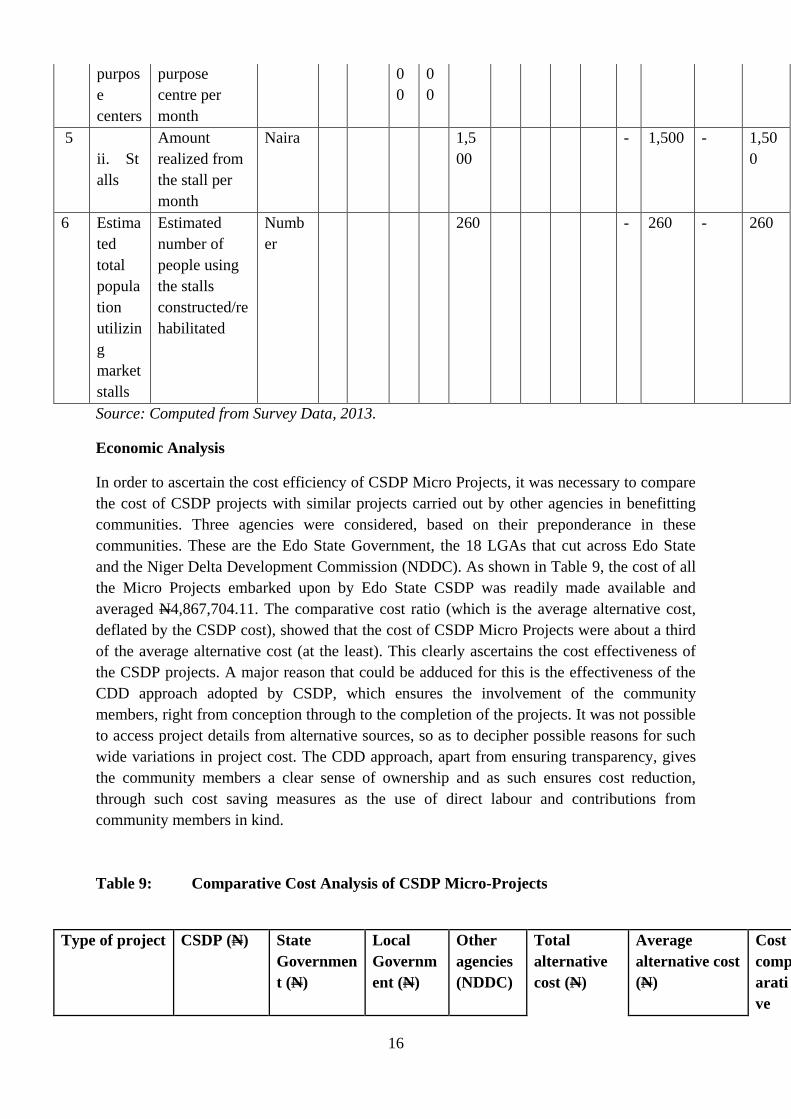
Socioeconomic Activities: This sector is quite unique in that three different projects (town
hall/civic center, skills acquisition center and markets stalls) were considered under it. Again
the outcome results were positive in all the projects. This is one sector that can easily be
bought into by stakeholders, because of its largely commercial nature. Communities can even
be encouraged to replicate same, in cases where government agencies are foot-dragging. The
relative ease of implementation is shown in the fact that this sector had the highest proportion

15
of projects. It also has the potential of diversifying the income stream of respondents who
may have relied mainly on income from agriculture, on a more sustainable basis. This would
ultimately result in long term transformation of the rural economy and beyond. It is in
consonance with the thoughts of Timmer, (2009) on agricultural transformation as a process
based on significant long-term productivity increase leading to increase in people employed
in agriculture and releasing labour to be transformed to other sectors of economy. It equally
agrees with the view of Eboh (2013), that such development would ultimately bring about
quantitative changes which culminate in improved standard of living of the rural population.
Table 8: Outcome Result in the Socioeconomic Sector
S/
N
Indica
tor
Definition Unit
of
Measu
re
Treated
Difference in outcomes
(before and after)
Control
Difference in
outcomes
(before and after)
Treat
ed
Outc
ome
Con
trol
Out
com
e
DD
T
C
1
TC
2
T
C
3
T
C
4
TC
5
C
C
1
C
C
2
C
C
3
C
C4
C
C
5
Aver
age
Ave
rage
1 Person
s
trained
in skill
acquisi
tion
and
utilizin
g skill
The
percentage of
persons
utilizing the
acquired
skills.
Percen
tage
6
2
- 62 - 62
2 Avera
ge
social
activiti
es
carried
out in
the
centre.
No. of social
activities
carried out in
the
constructed/re
habilitated
centre on
monthly basis
Numb
er
5 5 8 2 2 2 6 2 46
3 Reven
ue
genera
ted
from
4
i. Mu
lti-
Amount
realized from
the Multi-
Naira 25,
000
2
5,
0
4
0,
0
30,00
0
- 30,0
00
16
purpos
e
centers
purpose
centre per
month
0
0
0
0
5
ii. St
alls
Amount
realized from
the stall per
month
Naira 1,5
00
- 1,500 - 1,50
0
6 Estima
ted
total
popula
tion
utilizin
g
market
stalls
Estimated
number of
people using
the stalls
constructed/re
habilitated
Numb
er
260 - 260 - 260
Source: Computed from Survey Data, 2013.
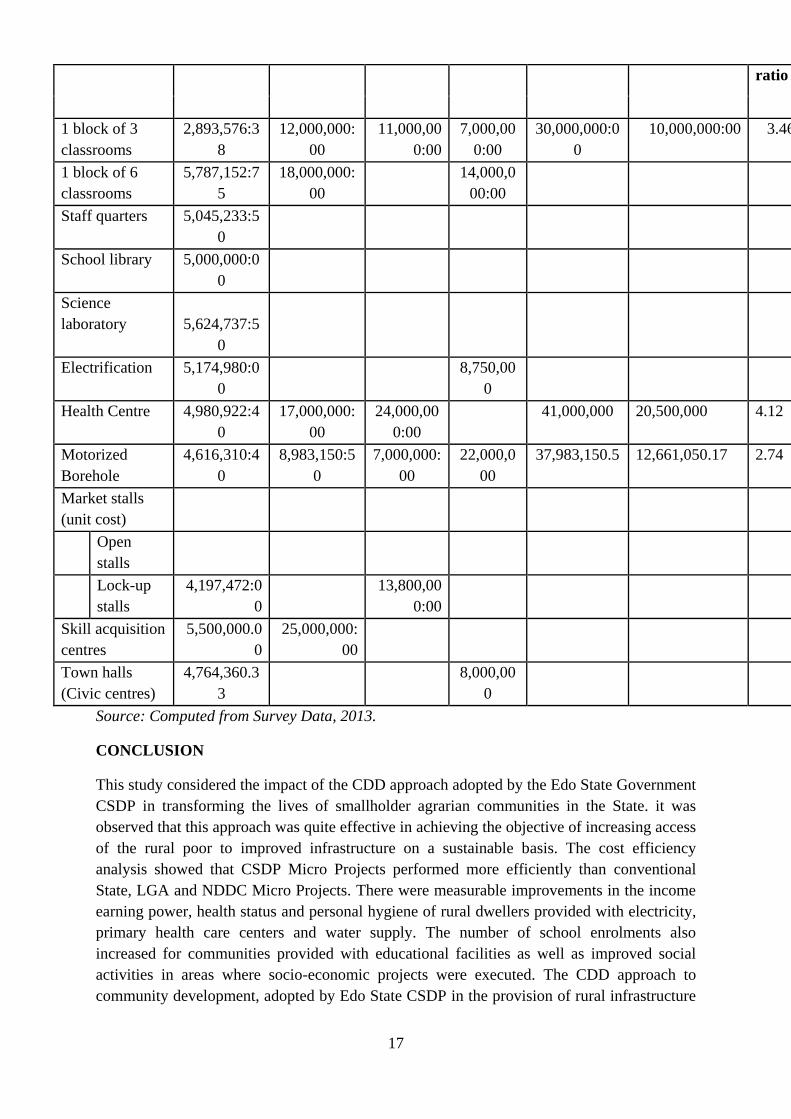
Economic Analysis
In order to ascertain the cost efficiency of CSDP Micro Projects, it was necessary to compare
the cost of CSDP projects with similar projects carried out by other agencies in benefitting
communities. Three agencies were considered, based on their preponderance in these
communities. These are the Edo State Government, the 18 LGAs that cut across Edo State
and the Niger Delta Development Commission (NDDC). As shown in Table 9, the cost of all
the Micro Projects embarked upon by Edo State CSDP was readily made available and
averaged N4,867,704.11. The comparative cost ratio (which is the average alternative cost,
deflated by the CSDP cost), showed that the cost of CSDP Micro Projects were about a third
of the average alternative cost (at the least). This clearly ascertains the cost effectiveness of
the CSDP projects. A major reason that could be adduced for this is the effectiveness of the
CDD approach adopted by CSDP, which ensures the involvement of the community
members, right from conception through to the completion of the projects. It was not possible
to access project details from alternative sources, so as to decipher possible reasons for such
wide variations in project cost. The CDD approach, apart from ensuring transparency, gives
the community members a clear sense of ownership and as such ensures cost reduction,
through such cost saving measures as the use of direct labour and contributions from
community members in kind.
Table 9: Comparative Cost Analysis of CSDP Micro-Projects
Type of project CSDP (N) State
Governmen
t (N)
Local
Governm
ent (N)
Other
agencies
(NDDC)
Total
alternative
cost (N)
Average
alternative cost
(N)
Cost
comp
arati
ve
17
ratio
1 block of 3
classrooms
2,893,576:3
8
12,000,000:
00
11,000,00
0:00
7,000,00
0:00
30,000,000:0
0
10,000,000:00 3.46
1 block of 6
classrooms
5,787,152:7
5
18,000,000:
00
14,000,0
00:00
Staff quarters 5,045,233:5
0
School library 5,000,000:0
0
Science
laboratory
5,624,737:5
0
Electrification 5,174,980:0
0
8,750,00
0
Health Centre 4,980,922:4
0
17,000,000:
00
24,000,00
0:00
41,000,000 20,500,000 4.12
Motorized
Borehole
4,616,310:4
0
8,983,150:5
0
7,000,000:
00
22,000,0
00
37,983,150.5 12,661,050.17 2.74
Market stalls
(unit cost)
Open
stalls
Lock-up
stalls
4,197,472:0
0
13,800,00
0:00
Skill acquisition
centres
5,500,000.0
0
25,000,000:
00
Town halls
(Civic centres)
4,764,360.3
3
8,000,00
0
Source: Computed from Survey Data, 2013.
CONCLUSION
This study considered the impact of the CDD approach adopted by the Edo State Government
CSDP in transforming the lives of smallholder agrarian communities in the State. it was
observed that this approach was quite effective in achieving the objective of increasing access
of the rural poor to improved infrastructure on a sustainable basis. The cost efficiency
analysis showed that CSDP Micro Projects performed more efficiently than conventional
State, LGA and NDDC Micro Projects. There were measurable improvements in the income
earning power, health status and personal hygiene of rural dwellers provided with electricity,
primary health care centers and water supply. The number of school enrolments also
increased for communities provided with educational facilities as well as improved social
activities in areas where socio-economic projects were executed. The CDD approach to
community development, adopted by Edo State CSDP in the provision of rural infrastructure
18
was proven to be quite effective in improving the general well being of the poor. While the
extension of the project is highly advocated, Edo State Government must be encouraged to
buy into this proven process by substantially funding the State Agency, which has been
empowered by law to drive the CDD process in critical areas of development throughout Edo
State.
RECOMMENDATIONS
The following recommendations are made as a way of transforming the lives of smallholder
farmers in the State on a more sustainable basis:
1. Relevant authorities should make it mandatory for LG authorities to be more
transparent with their records, particularly their financial records. This would go a
long way in aiding policy formulation, planning, research and development in rural
communities.
2. The World Bank, as a matter of deliberate policy should publicize the proven
effectiveness of that of the CDD approach to community development so that all
citizens can have the opportunity to buy into the concept and ensure its adoption by
governments.
3. Effort should be geared towards the provision of more specific agricultural
infrastructure in rural communities to increase the productivity of the farmers and
enhanced their improved standard of living. More specifically, rural physical
infrastructure (storage equipment, farm machineries, herbicides and pesticides, fry
and fingerlings, fishing boats and nets) and rural institutional infrastructure (fertilizer
distribution centres, agricultural advisory services, micro credit centres) should be
provided for increased productivity.
REFERENCES
Alimi, T. (2012). Small or large scale agriculture for Nigeria: Issues, challenges and
prospects. An Inaugural Lecture delivered at Obafemi Awolowo University. Ile-Ife, Nigeria.
Pp. 3-4.
Ayuk, E.T. (2014). Agriculture and Development in Sub-Saharan Africa: Prospect for
transforming National Economies. First Public Lecture of the Faculty of Agriculture,
University of Benin, Held at the New Senate Chambers, University of Benin, Nigeria on 24th
April, 2014. 28pp.
Colman,D. and Nixon, F. (1994). Agricultural transformation and economic development
“Economics of change in less developed countries” Harvester Wheatsheaf pp 207-253.
Diao, X. (2010). Economic importance of agriculture for sustainable development and
poverty reduction. Findings from a case study of Ghana. Paper presented at the global forum
on agriculture between 29–30th
November, 2010 on policies for agricultural development,
poverty reduction and food security in Paris.
19
Easterly, B.W. and Levine. (2003): Tropics, germs and crops: How endowments influence
economic development. Journal of Monetary Economics 50 (1): 3---39.
Eboh, E.C.(2013). State of the Nigerian Agricultural Transformation Agenda. Agricultural
Policy Research Network Newsletter. Vol. 4 (1) 3—4.
Emokaro, C.O. and Edemanrhia, I.I. (2014). “An Estimation of Food Security Status
Among Rural Households in Edo State, Nigeria”. Nigerian Society for Experimental Biology
(NISEB) Journal 14(1):22-28.
Emokaro C.O. and Erhabor, P.O. (2006). “Technical Efficiency of Cassava Farmers in Edo
State: A Stochastic Frontier Approach”. Journal of Sustainable Tropical Agricultural
Research. 20, 15-20.
Emokaro, C.O. and Omoregbee, F. E. (2011). Farm income and other determinants of
productivity and profitability among smallholder farmers in Edo State, Nigeria. African
Journal of General Agriculture. 7(1):20-26.
Federal Ministry of Agriculture and Rural Development (2012). Implementation strategy on
the Agricultural Transformation Agenda, Committee Draft Report, Abuja, Nigeria.
FMA&WR (2008). National Programme for Food Security. Federal Ministry of
Agriculture and Water Resources (FMA&WR), Abuja, pp.107.
Health and Safety Executive (2009). Understanding and Influencing Farmers’ Attitudes.
RR700 Research Report. BOMEL Limited, United Kingdom www.hse.gov.uk
Idachaba, F.S., Umubese, A.F. Mabawonku and R.O. Adegboye (1980). Rural infrastructures
in Nigeria. Mimegraph. Department of Agricultural Economics, University of Ibadan. Pp. 2.
Idode,J.B. (1999). Rural Development and Bureaucracy in Nigeria. Longman Publishers,
Lagos. Pp. 1.
International Fund For Agricultural Development (IFAD)(2011). Rural Poverty Report: New
Realities, New Challenges and New Opportunities For Tomorrow’s Generation. Pg 223.
Machethe, C. L., Mollel, N. M., Ayisi, K., Mashatola, M. B., Anim, F. D. K. and Vanasche,
F. (2004). Smallholder Irrigation and Agricultural Development in the Olifants River Basin
of Limpopo Province: Management Transfer, Productivity, Profitability and Food Security
Issues. Report to the Water Research Commission on the project entitled “Sustainable Local
Management of Smallholder Irrigation” University of the North, School of Agriculture and
Environmental Sciences.
Onohaebi, S.O. (2014). Darkness at Sunrise in Nigeria: Illuminating the Dark Sport before
Sunset. Inaugural Lecture Series 146, University of Benin. October 16th
2014, 64 pp.
20
Osabuohien, J.I. and Alufohai, G.O. (2015). Credibility of Pesticide Safety Precaution
Information Sources Among Users of Pesticide in Oilpalm Farms in Delta State, Nigeria.
Benin International Journal of Economics and Extension Services, 4(1):25-36.
Rodrik, D., Subramanian, A. and Trebbi, F.(2004). Institutions Rule: The primacy of
institutions over geography and integration in economic development. Journal of Economic
Growth 9(2): 131—165.
Schultz, T.W. (1964): Transforming Traditional Agriculture. New Haven, C.T. and London,
UK. Yale University Press.
Spencer, D. (2002). The Future of Agriculture in Sub-Saharan Africa and South Asia:
Whither the Small Farm? Sustainable Food Security for all by 2020; Proceedings of an
International Conference, September 4-6, 2001, Bonn Germany. International Food Policy
Research Institute, Washington D.C. 20006-1002, USA. Pp 107-109
Sharma, F.A., Njem, K, Bjertnes, E. and Kristensen, P. (2011). Pesticide Use Opportunities
of Exposure Among Farmers and their Families: Cross-sectional Studies 1998 - 2006.
Environmental Health, 9:63.
Spore (2009). Land Transfer: Consulting Rural Communities, 142: 8-9
Staatz, J.M.(1998). What is Agricultural Transformation? Report of a workshop on
“Structural Transformation in Africa”. Retrieved online at
http://aec.msu.edu/fs2/ag_transformation/Def_Trans.htm.
Timmer,C.P.(1998). “The Agricultural Transformation”. In Chenery, H.B. and T.N.
Srinivasan, T.N. (Eds). Handbook of Development Economics, Amsterdams Elsevier
Science. 25(1): 275-331.
Timmer,C.P.(2009). A World Without Agriculture. The Structural Transformation in
historical perspective.Washington D.C. The American Enterprise Institute for Public Policy
Research.
Ulimwengu, I. and Badiane, O. (2011). Vocational Training and Agricultural Productivity:
Evidence from Rice Production in Vietnam, http://www.tandfonline.com/loi/raee20 Accessed
on 20th February, 2012.
Ukpong,G.E. (1993). Some Strategies for the Development of Nigeria’s Agricultural sectors
in the 1960s. Economic and Financial Review, 31(2):71-85.
World Bank (1998). Human Development Report. World Bank: Washington, D.C.

21
World Bank (2007). World Development Indicators. Green Press Initiative, World Bank,
Washington DC, USA.
World Bank (2008). Agriculture for Development. World Development Report. World Bank,
Washington DC, USA.