impact of microcredits on non-agricultural family ... · impact of microcredits on non-agricultural...
TRANSCRIPT
R4D Working Paper 2017/03
Impact of Microcredits on non-agricultural family production units in Madagascar
Ida Rajaonera
Faly Rakotomanana
This study analyzes the impact of microcredit on non-agricultural family production units in Madagascar. The methodology used consists of combining the Propensity Score Matching and Econometric Analysis. In order to avoid the bias inherent to unobserved characteristics and the over or under-estimation of the impact, the treatment group includes the “old” and former members of Microfinance Institution (MFI) and the control group is composed of “new entrants” in MFIs. Almost of observable characteristics used in the analysis concern the situation before joining MFIs. Overall, the results of the analyses conclude that microcredit has positive impact on family activities in Madagascar. The results showed that microcredit had a positive and significant impact on the turnover and operating budget of the production units. On the other hand, the increases in the level of production, value added and gross operating surplus are not significant. At factors of production level, positive and significant impacts were observed both on the volume of work and on the productivity of labor. On the other hand, there is no significant impact on capital.
This research received financial support from the Swiss Agency for Development and Cooperation and the Swiss National Science Foundation under the Swiss Programme for Research on Global Issues for Development. The project “Employment Effects of Different Development Policy Instruments” is based at the World Trade Institute of the University of Bern, Switzerland.

2
Impact of Microcredits on non-agricultural family production units in Madagascar
Authors: Ida Rajaonera
Faly Rakotomanana
This report is part of a research program focused on Employment effects of different Development Policy Instruments funded by the SNSF (Swiss National Science Foundation) in Switzerland with the University of Bern and the University of Geneva.
3
Acknowledgements
We would like to thank all staff of the research project "R4D Employment Effects of Different Policy Instruments" from the University of Bern, the University of Geneva and the World Trade Institute of Geneva for the genuine and effective collaboration. Our special gratitude as well goes to the Swiss National Science Foundation (SNSF) and the Swiss Agency for Development and Cooperation (SDC), who funded entirely this study from the database collection to analysis and drafting.

4
Table of contents
Acknowledgements ................................................................................................................................. 3
Table of contents ..................................................................................................................................... 4
Abbreviation ............................................................................................................................................ 5
Abstract ................................................................................................................................................... 6
Introduction ............................................................................................................................................. 7
1. Literature review ............................................................................................................................. 8
2. Microfinance in Madagascar ......................................................................................................... 14
3. Non-agricultural family activities in Madagascar .......................................................................... 15
4. Methodology and Database .......................................................................................................... 17
4.1. Database ................................................................................................................................ 17
4.2. Evaluation methods ............................................................................................................... 19
4.3. Model specification and definitions of variables .................................................................. 20
4.3.1. Model specification ....................................................................................................... 20
4.3.2. Variables choice ............................................................................................................ 21
4.3.3. Definitions of variables .................................................................................................. 23
5. Results ........................................................................................................................................... 27
5.1. Descriptive Statistics comparing Treatment group and control group ................................. 27
5.2. Impact Evaluation results using Propensity Score Matching method ................................... 28
5.3. Impact Evaluation results using econometric analysis .......................................................... 31
Conclusion ............................................................................................................................................. 35
References ............................................................................................................................................. 36

5
Abbreviation
MFI : Microfinance Institution
MSMEs: Micro-, small and medium-sized Enterprises
GDP : Gross Domestic Product
SHG : Self Help Group (India)
MGA : Malagasy Ariary (Madagascar’s Currency)

6
Abstract
This study analyzes the impact of microcredit on non-agricultural family production units in Madagascar. The methodology used consists of combining the Propensity Score Matching and Econometric Analysis. In order to avoid the bias inherent to unobserved characteristics and the over or under-estimation of the impact, the treatment group includes the “old” and former members of Microfinance Institution (MFI) and the control group is composed of “new entrants” in MFIs. Almost of observable characteristics used in the analysis concern the situation before joining MFIs. Overall, the results of the analyzes conclude that microcredit has positive impact on family activities in Madagascar. The results showed that microcredit had a positive and significant impact on the turnover and operating budget of the production units. On the other hand, the increases in the level of production, value added and gross operating surplus are not significant. At factors of production level, positive and significant impacts were observed both on the volume of work and on the productivity of labor. On the other hand, there is no significant impact on capital.

7
Introduction
Since 1990s, microfinance has been recognized as an efficient instrument to reduce poverty through self-employment creation and improved economic performance of small-microenterprises. Providing microcredits to the poor enables them to invest in productive assets, in human capital and production unit creation or expansion (Jia X., Xiang C., and Huang J., 2013, Van Rooyen C., Steward R. and De Wet T., 2012, Gubert F. and Roubaud F., 2005). “…repeat borrowers can be accommodated as they expand their enterprises and qualify for larger loans, and many economically active poor people can be helped out of poverty. Industry standards for commercial microfinance began to develop in the 1990s” (Robinson M. S., 2001). In addition to economic impact, microfinance provides social impact such as improved health status, food security, empowerment, social capital and social cohesion (Hashemi S. M., Schuler S. R., and Riley A. P., 1996-1997; Pitt M. M., and Khandker S. R.. 1997; Weber O. and Ahmad A., 2014; Leigh Anderson C. and Locker L., 2002).
In recent years, in contrast to these positive outcomes, some studies and policy makers question the microfinance’s advantages and indicate not only non-significant positive impact on poverty reduction and development, but also negative effects, such as rising poverty ratios or income inequalities by crowding out small-scale entrepreneurs, increasing women stress and child labor (Copestake J. G., 2011; Yaron, 1991; Morduch, 1998).
Particularly, in Madagascar, the outcomes of rare studies on impact of microfinance are very mixed. The most recent study shows that microcredits have no impact on investment and gross income of microenterprises in Madagascar (Voninirina A., 2014). Even the impact evaluation of a MFI named ADEFI conclude a positive impact of microcredits, the results of dynamic analysis are more nuanced. Indeed, the positive impact of the project is clearly observed during economic growth phase, but, during a recession like the political crisis on 2002, the results seem more uncertain (Gubert and Roubaud, 2005). The impact evaluation of an other MFI named CECAM indicates different results according to different groups of households: less vulnerability, improved food security, and a one-time increase in production capacity for poor households, and accumulation of assets in medium and long-term for non-poor households (Bouquet E. and Wampfler B., 2006). According to self-employed workers themselves, access to credit appears only at the sixth position in terms of aid that they wish to obtain for the development of their activities. For them, the priority should be to resolve the disposal of products and the market enlargement (Rakotomanana F., and al., 2013).
The main objective of this study is to assess the impact of microcredits on family production units in Madagascar. It presents originalities on several dimensions. At the analytic level, the
8
study provides results on the impact of microcredits on all aggregates indicating the economic performance of family activities: level of activity (turnover, production, operating budget, Value added, gross operating surplus), investment and factors productivity. In methodological terms, the study is carried out with a very rich database providing information on the relations with microfinance (customers, ex-clients, non-clients, duration of membership, initial characteristics before accession to microfinance), detailed and complete production accounts, detailed information on labor and physical capital, information on demand side (type of customer, competition level).
The study mobilized an impact assessment methodology applied to a cross-sectional database. Creating exclusively the control group with "new entrants" members of a Microfinance Institution (MFI) avoids biases related to differences with the treatment group due to unobservable characteristics. Moreover, the inclusion of ex-clients of MFIs in the treatment group makes it possible to minimize the overestimation or underestimation of the impact due to not considering the negative or positive effects of microcredits on the units which already abandoned for "voluntary" or "involuntary" reasons. To obtain credible results, descriptive results are followed by more efficient techniques: Propensity Score Matching (Rosenbaum and Rubin, 1983) and weighted econometric model with inverse of propensity coefficients (Hirano, Imbens, and Ridder, 2003).
After this introductory part, the study includes other parts devoted to the literature review, the description of microfinance in Madagascar, non-agricultural family activities in Madagascar, the presentation of the methodology and database, and the results of the analyzes. Conclusions are presented at the end of the document.
1.Literature review
For this study, the microfinance is restricted only to the microcredits excluding micro-savings, micro-insurance and cash transfers. Microcredits enable households and micro-entrepreneurs to promote or create Production units, and improve poor well-being. The impact of microfinance on family production units may be manifested in either changes on volume of labor or assets, turnover, production level, value added, gross operating income, investment, or on productivity of production factors. The literature on this area provides very mixed results.
Grimm M. and Paffhausen A. L. (2015) summarize research on employment impacts of different programs including access to finance in micro-, small and medium-sized Enterprises (MSMEs) in the formal as well as informal sector. Access to finance has poorer impact on employment than other interventions such as entrepreneurship training, business

9
development services, wage subsidies, and improvements to the business environment (e.g. registration procedures). According to results drawn from 26 studies dealing with the access to finance, only 20 out of 54 impact estimates show a positive significant impact in employment. Overall, the effects are small, especially for existing small and micro-enterprises. By contrast, 34 out of 54 impact estimates are statistically non-significant and in 2 cases, the impacts are even statistically negative. This review is focused to urban as well as rural non-farm employment (paid, self-employed, unpaid family workers) and firms in low and middle income countries1. The studies use different impact evaluation technics based on an experimental design such as an Randomized Controlled Trial (RCT), as well as on quasi-experimental designs including Propensity-Score Matching, Instrumental variables, Regression discontinuity designs or Difference-in-Difference estimation.
Samer S., Majid I., Rizal S., Muhamad M. R., Sarah-Halim, and Rashid N. (2015) analyze the specific case of Malaysian microfinance for women using a cross-sectional approach with old clients as treatment group and new client (who have not yet received loans) as control group. The multinomial logistic model is used for the impact evaluation. The study shows positive impact of microcredit on household income of women borrowers, especially in rural area, compared to new borrowers. In rural area, the likelihood of the household income of old clients increase by 2.3 as compared to new clients. In urban area, the impact is also statistically significant, but the increase is less important (only by 1.5).
Hiatt S. R. and Woodworth W. P. (2006) use a similar cross-sectional approach to analyze the impact of village banking NGOs in Central America on economic criteria (per capita expenditure) and socioeconomic criteria (Food Security, Health, Housing, Education, Empowerment for women only, and Social Capital for women only). They consider three groups of persons who received loans: old clients (more than one year), new clients (less than a year) and ex-clients (already withdrew). Using a least significant differences comparison of means test, the authors come to the same conclusion that microcredits have positive impact on poverty. In terms of the daily minimum wage, old clients are the least poor (earning $ 1.38 a day), followed by the ex-clients (earning $ 1.18 a day), and finally the new clients the poorest (earning $ 0.94 a day). With econometric analysis, Ferdousi F. (2015) found positive impact of loans on firms’ income in Bangladesh but not on innovation. He shows that access to finance is not the only one obstacle faced by microenterprises for their sustainable development. They lack also business skill, knowledge regarding market and technologies.
1 According to World Bank thresholds using World Bank Atlas method: low income (GNI less than USD 1025 per person and year), lower middle income (GNI between USD 1026 and USD 4035 per person and year), and upper middle income (GNI between USD 4036 and USD 12,475 per person and year).
10
Miled K. B. H. and Rejeb J. B. (2015) adopted “macro” approach based on on cross-sectional data covering 596 microfinance institutions in 40 developing countries for 2011 and supplemented by a two-period (2000-2005 and 2006-2011) panel data of 57 developing countries in 1132 microfinance institutions. Econometric analyses with Ordinary Least Square (OLS), and with Instrument variables are used to estimate the impact of gross loan portfolio on poverty headcount ratio. Overall, microfinance have positive impact on poverty. The econometric results confirm that microfinance loans per capita are significantly and negatively associated with poverty head count ratio and positively and significantly associated with the expenditure of consumption. A country with a higher MFIs’ gross loan portfolio per capita tends to have lower poverty head count ratio and higher expenditure of consumption. By contrast, applying econometric analysis with instruments variables in fixed-effects two-stage least squares to a panel of 71 developing countries over the period 2002–2011, Donou-Adonsoua F., Sylwester K. (2016) found any impact of microfinance on poverty regardless of the measure of poverty employed.
At macro level, but using a static Computable General Equilibrium Approach, Raihan S., Osmanic S.R. and Baqui Khalily M.A. (2017) analyse the impact of microfinance on gross domestic product (GDP) through capital accumulation, productivity improvement and reallocation of capital and labor among sectors. The results show that microfinance has contributed in the range of 8.9% and 11.9% of the GDP of Bangladesh. The estimation is based on the difference between the GDP of the base year 2012 and the counterfactual GDP (simulation in which microfinance did not exist. The contribution is more important in rural GDP between 12.6% to 16.6%.
Instead of focusing on short term impact on income, profits or consumption, Swain R. B. and Varghese A. (2008) evaluated the long term impact of microfinance on asset creation by analyzing the specific case of Self Help Groups (SHGs) in India. The authors use econometric analyses including member dummy variable and the number of months of membership in order to capture the long term effects on asset value. The main finding of the study is that microfinance favors capital or assets accumulation. Indeed, even the assets value of SHG members is actually on average less important than non-members, approximately six years of membership are required to achieve the initial asset value of non-members (assuming constant returns to participation). The same outcome is found by Aivazian V. A. and Santor E. (2008) using panel data in Sri Lanka. The World Bank loan subsidy has positive impact on investment of small firms compared to those without such subsidies.
The results of impact evaluation of a MFI named ADéFi in Antananarivo Madagascar on 2005 conclude with a positive impact of the project in terms of turnover, capital stock and labor productivity (Gubert and Roubaud, 2005). In dynamic terms, the results are more nuanced. While the positive impact of microcredit is clearly observed during economic growth phase, its effect becomes less evident during a recession context. According to the authors, these
11
findings are due to the fact that the MFIs deals with the upper fringe of microenterprises, which are more fragile with their fixed costs.
For Diagne (1998), microfinance interventions tend to stabilize rather than increase incomes and tend to preserve rather than create jobs. In Malawi, according to the results of the 1995 survey, while access to formal credit in the form of microfinance interventions allowed households to reduce their borrowing from family sources, the effect was too low and difference in income is not significant between those with and without access to formal credit. While access to credit allows households to reduce informal borrowing, borrowing in general has had a negative impact on net income of farmers, mainly because loans have enabled farmers to respond to the increase of input prices by borrowing rather than changing their agricultural strategy.
Zeller, and al. (1994) conclude that access to microcredits can not only smooth out disposable income and consumption, but also alleviate household labor and capital constraints. Microfinance contributes to more diversified sources of income. The short-term effects of access to credit can be quantitative and qualitative changes in food consumption. In rural area, Zeller and Sharma (1998) indicate that access to credit increase food expenditure and caloric intake of household. However, the short- and long-term effects of microfinance on nutritional status and child education are not significant.
Pitt and Khandker (1996 and 1997) found positive impacts of microfinance on weekly household consumption. This result is confirmed by Zeller and Sharma (1998), who found that consumer loans are spent mainly on food to improve the health of the family labor. By contrast, for the specific case of Malawi, Diagne (1998) notes that daily caloric intake per capita of households not members of MFIs was higher than that of households members of MFIs.
Zeller and Sharma (1998) shows that microfinance allows farmers to invest in fertilization or agricultural technologies and increases their income. In Malawi, Diagne and Mataya (1997) found that an 10% increase in probability of access to agricultural credits increases by 0.97% and 3.8%, respectively, the amount of sharecropping for tobacco and maize.
Protecting the health and safety of household members, particularly the most vulnerable members of households, such as women and children, can be seen as a positive impact of microfinance (Pallen, 1997).
The impact chains of microcredits on firms’ performance as well as households’ wellbeing are resumed and illustrated in the following figure. The MFI provides mostly different financial services to a client. These services increase immediately the disposable income of the production unit and also household’s disposable income. In short term, these changes improve the economic performance and investment (labor and capital) at firm level and

12
consumption (health and education) at household level. In medium term, these situations lead to improve the human capital and factor productivity on the supply side and the global demand in the demand side. In long term, these changes may conduct improvement of economic and social development at macro as well as in micro level.

13
Figure 1 : Impacts chain of microcredits on firms’’ performance and households’ wellbeing
Input Output Outcome Impact
Microcredits Increase of disposable
income for family production units
Assets accumulation
Increase of cash flow
Factors Productivity Improvement
Competitivity improvment
Formalization of production units
Enterpreunarial spirit improvment
Standard of life improvment
Empowerment and improvment of women status
Development of local economy
Imrpovment of social cohesion
PRO
DUCT
ION
UN
IT
MAC
ROEC
ON
OM
Y Increase of disposable income for households
Investment on human capital
Increase of workers number
Innovations or new products
Increase of production level and disposable
income
Production diversification
Increase of households
consumption
Increase of transfers inter households
Improvement of child education
Improvement of health status of
household’s members
Local market functionning improvment
Increase of global demand
Social capital improvment and producers groups
HOU
SEHO
LD

14
2.Microfinance in Madagascar
Microfinance emerged in Madagascar in the 1990s with the collaboration between Malagasy government and donors (World Bank, European Union, French Development Agency, German Cooperation and Swiss Inter-Cooperation). Since then, sectoral policies on microfinance have been implemented: Technical Assistance Project to Rural Finance (PATFR) until 1997, Microfinance Project (MFP) between 1998-1999, Microfinance Program Management Agency (AGEPMF) between 1999- 2014, National Microfinance Strategy Document (DSNMF) between 2004-2012, National Strategy for Inclusive Finance (SNFI) between 2013-2017 (CNFI, 2014).
The microfinance sector in Madagascar includes three types of institutions: "member-based" or mutualist institutions that collect savings and provide loans to their members; "client-based" or non mutualist institutions which have lending as their main activity; "credit" institutions and NGOs or associations that do not have lending as their main activity.
Microcredits are mainly for the productive sectors (agriculture, manufacturing industry, fishing, livestock), trade, transport and crafts. However, loans for equipment (acquisition of small equipment, mutual leasing, housing, etc.) are beginning to be financed and some loans are granted for social or consumer needs. Overall the duration of credits does not exceed 12 months due to lack of stable financial resources to realize medium-term investment credits. The guarantees required by MFIs vary: blocked savings or joint liability. The nominal interest rates range from between 2% and 4% per month. Savings products are not very diversified: demand deposits and term deposits. Demand deposits, which constitute the major part of savings, are not remunerated. Term deposits are paid between 3% and 6% per year.
In 2015, twenty-five MFIs (MFIs), mutual insurances and credit institutions operate in Madagascar with more than 930 points of service (CNFI, 2014). The household penetration rate is estimated at 29%. A relatively low level compared to the relatively high level of financial awareness reaching 73% of adults. This phenomenon highlights a reluctance of the Malagasy people towards the financial products proposed by the MFIs. Currently, MFIs have 1,400,000 clients and 48% of whom are women. At the end of 2015, outstanding loans are estimated at around 506 billion MGA, with 15% average annual increase. Despite the efforts made by the MFIs, the national coverage rate is still far from expected rate.
Beyond the limited geographical coverage, particularly in rural areas, the main problem is the inability to deliver products adapted to specific demand. Thus, while some types of
15
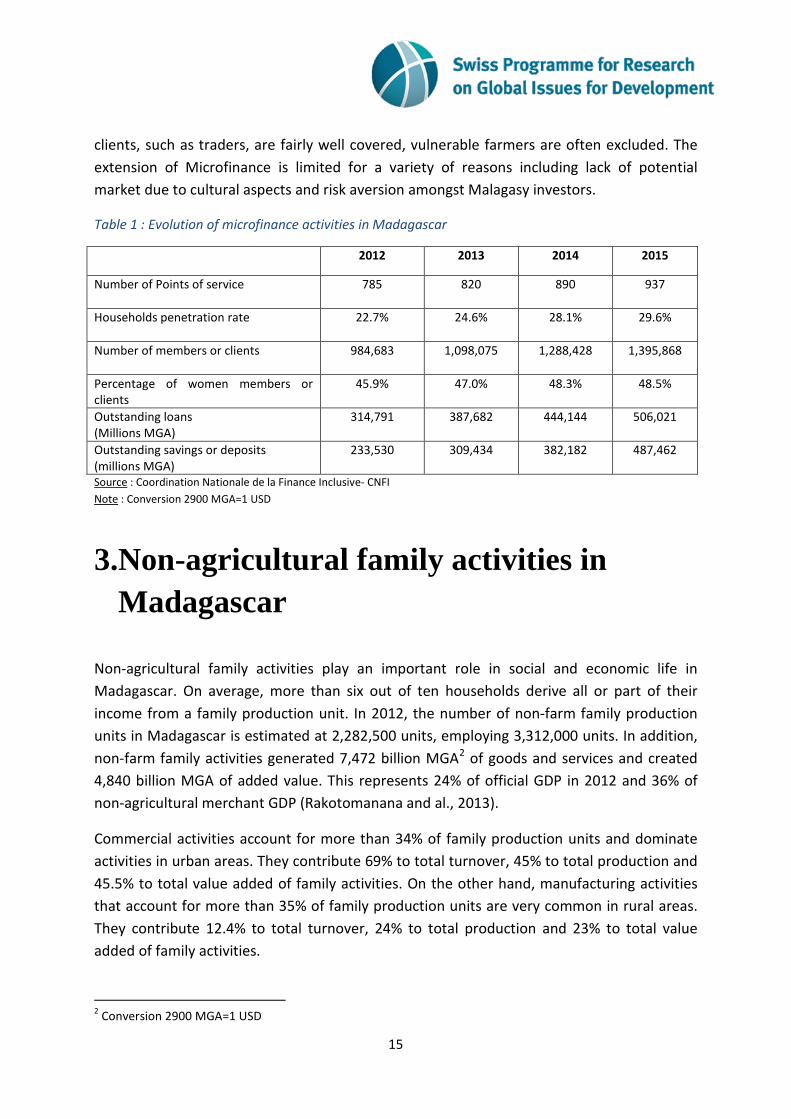
clients, such as traders, are fairly well covered, vulnerable farmers are often excluded. The extension of Microfinance is limited for a variety of reasons including lack of potential market due to cultural aspects and risk aversion amongst Malagasy investors.
Table 1 : Evolution of microfinance activities in Madagascar
2012 2013 2014 2015
Number of Points of service
785 820 890 937
Households penetration rate
22.7% 24.6% 28.1% 29.6%
Number of members or clients
984,683 1,098,075 1,288,428 1,395,868
Percentage of women members or clients
45.9% 47.0% 48.3% 48.5%
Outstanding loans (Millions MGA)
314,791 387,682 444,144 506,021
Outstanding savings or deposits (millions MGA)
233,530 309,434 382,182 487,462
Source : Coordination Nationale de la Finance Inclusive- CNFI Note : Conversion 2900 MGA=1 USD
3.Non-agricultural family activities in Madagascar
Non-agricultural family activities play an important role in social and economic life in Madagascar. On average, more than six out of ten households derive all or part of their income from a family production unit. In 2012, the number of non-farm family production units in Madagascar is estimated at 2,282,500 units, employing 3,312,000 units. In addition, non-farm family activities generated 7,472 billion MGA2 of goods and services and created 4,840 billion MGA of added value. This represents 24% of official GDP in 2012 and 36% of non-agricultural merchant GDP (Rakotomanana and al., 2013).
Commercial activities account for more than 34% of family production units and dominate activities in urban areas. They contribute 69% to total turnover, 45% to total production and 45.5% to total value added of family activities. On the other hand, manufacturing activities that account for more than 35% of family production units are very common in rural areas. They contribute 12.4% to total turnover, 24% to total production and 23% to total value added of family activities.
2 Conversion 2900 MGA=1 USD

16
Almost all of these family production units (99.9%), are classified as informal (either without a statistical number or without a written and official account). Nearly nine out of ten units are totally unknown to the public services: not have a statistical number or a business card, not registered in the Commercial Register or social security and not pay tax. However, these activities appear more as a sector of spontaneous development of household economic activities than as a strategy for bypassing existing legislation.
Family activities are characterized by precarious working conditions. More than eight out of ten units are sheltered in makeshift facilities, depriving them of access to the main public services (water, electricity, telephone).
Family activities are micro-units, with an average size of 1.5 workers per unit. Self-employment is the most widespread form, because seven out of ten units have only one employee. Nearly 52% of jobs in family production units are held by women. Concentrated mainly in self-employed persons (58.1%), family workers (53.1%), they occupy the least paid or most vulnerable positions. Young people (less than 26 years old) represent 28% of the workforce. They represent less than 18% of the heads of production units.
In family activities, investment rate is very low, not exceeding 8%, marking the low assets accumulation in this sector. Excluded from the banking system, individual savings finance the capital for more than 95% of its value. Microfinance are not yet able to take over, and are only marginally involved in financing investment in family activities.
Exclusively oriented towards the internal market, production of family activities are mainly meant to satisfy the household’s needs. More than 70% of demand comes from household final consumption. In this context, family activities have few direct links with the formal sector, and subcontracting is rare. About 58% of the inputs come from the informal private sector itself, and only 29% is supplied by the formal sector. Family activities take place in a highly competitive environment.
According to the declarations of the heads of production units, the difficulties encountered by family activities are primarily the disposal of products, which is mainly constrained on the demand side (“weakness of markets") but also on the supply side ("excess of competition). 57% of family units have marketing problems, 52% suffer from excessive competition, and 36% for both. Therefore, it appears that the deterioration of the macroeconomic environment and the decline in the purchasing power of the population, rather than localized markets’ failure (shortages, inadequate institutional framework, etc.) are the main obstacles to the development of the family activities.
According to the declarations of these producers, the problem of credit access comes only in fifth place. Access to large orders is seen as the most requested aid by more than 53% of small producers. The second area for which more than 43% of units are calling for support is

17
technical assistance for supplies. Access to credit is in sixth priority and is solicited by almost 22% of family producers.
4.Methodology and Database
4.1. Database
The database was taken from a specially designed survey to meet the research objective. The survey was funded by the Swiss National Science Foundation (SNSF) and the Swiss Agency for Development and Cooperation (SDC) within the project "R4D Employment Effects of Different Policy Instruments". Data collection was carried out from October to December 2016. The sample is representative at the national level and by urban-rural residence. The initial sample size is 3040 production units and is distributed throughout the 152 communes in all 22 regions of Madagascar. For a variety of reasons (inaccessibility, refusal to answer, relocation), 137 production units in the initial sample could not be interviewed: a non-response rate of 5.5%. The final sample size is 2904 production units.
Regarding the sample selection process, a two-stage survey design was adopted. At the first stage, the sampling frame consists of the list of the 444 communes where 850 points of service points of all MFIs in Madagascar are located (according to the official siteweb of National Coordination of Inclusive Finance updated on October 2016). The selection of communes is proportional to the number of points of service located in each commune. At the second level, 20 production units (member of MFI or not) per commune, were selected from all non-farm production units located in each commune. Farm production units were excluded from the survey because of their specificity, which require specific and costly survey.
984 production units interviewed are already members of an MFI. Among them are 830 production units classified in the treatment group (482 units have been members for more than one year and 348 units are former members) and the remaining 154 production units are classified in the control group (new entrants on 2016). 2390 production units are located outside the capital of region and 514 are located in the capital of region.

18
Table 2: Sampling of production units by geographical location
Outside the capital of region in the capital of region Total
Treatment group Old Membres of MFIs 402 80 482 Former membres of MFIs 307 41 348 Control group New entrants membres of MFIs 124 30 154 Never membres of MFIs 1557 363 1920 Total 2390 514 2904
Source : R4D-University of Bern-University of Geneva-WTI, Survey on Impact of Microfinance, Madagascar 2016
The database contains a lot of statistical information relating to different themes, including microfinance and labor force in production units. In addition to quantitative information, qualitative information is available in the database such as perception on changes brought by microcredits both on production unit and on household. The following major themes are available in the database:
- Relations with MFI o For members MFI:
Details of the loans obtained (date, loan amount, amount to be repaid, duration of maturity, type of use)
Year of first affiliation Perceptions of changes induced at production unit level and at
household level Knowledge about MFIs
o For former members of MFI: year of withdrawal, reason of withdrawal o For never members of MFI: reason for non-affiliation
- Other Sources of funding o Type (bank, loan sharks family or friend, suppliers) o Details of loans (date, loan amount, amount to be repaid, maturity, type of
use) - Characteristics of the activity:
o branch of activity o type of location o Access Basic services (electricity, water, phone) o Creation (motivation, year, registration)
- Characteristics of Workers o Number of workers (employed, self-employed) o Characteristics of each worker:
Demographics (gender, age, education level, affiliation to the head of the production unit)
19
Economic (status in the activity, apprenticeship, professional experience, hourly volume, remuneration and other benefits)
o Method of determining remuneration o Problems with the workforce o Recruitment policy (objectives, nature of needs, recruitment criteria)
- Characteristics of production o Details for each commodity (nature, quantity, value, main customer) o Monthly seasonality
- Characteristics of expenses or charges o Details of raw materials (nature, quantity, value, main supplier, source of
financing) o Details of resale goods (nature, quantity, value, principal supplier, source of
financing) o Details on other charges:
rent, water, energy (gas, electricity), telephone Transport and maintenance, insurance Taxes and duties
- Characteristics of capital o Details by type of capital (nature, method of acquisition, type of ownership,
source of financing, date of acquisition, value using replacement cost) o Production capacity saturation rate
4.2. Evaluation methods
The fundamental purpose of any impact assessment is to estimate the effect of an intervention in relation to the counterfactual: what would have happened in absence of the intervention. A common technique to achieve this goal is to compare program participants with a similar group of non-participants (or control groups). The difficulty is to find similar groups.
For most microfinance impact assessments, the main obstacle is that the treatment group is self-selected, i.e. the head of the production unit decides himself to be a member of a MFI. If unobservable characteristics such as entrepreneurship spirit or risk appetite are among the factors pushing an self-employed to borrow, any observed difference in outcomes between borrowers and non-borrowers will be biased (Brannen C., 2010).
The "cross-cutting" impact assessment tool attempts to solve this problem by comparing the treatment group composed of "old" borrowers (still members or former members) of a

20
microcredit program with a group of “New entrants” borrowers, who have not yet received loans or who have not yet felt the immediate effects of the loans.
This cross-cutting approach has two main advantages. First, since "old" borrowers and "new entrants" borrowers are self-selected in the program, the selection bias inherent on unobservable characteristics between the treatment group and the control group can be avoided. Indeed, having decided to join an MFI, we can assume that these borrowers have risk appetite or the same entrepreneurial spirit, whether they are in the treatment group or in the control group. Second, the inclusion of "former MFI members" in the treatment group avoids overestimating or underestimating the impact of microcredits (Tedeschi G. A. and Karlan D., 2010). Indeed, there are two categories of former members, those that have had positive impacts of microcredit and those that have had negative impacts. On the one hand, it can be assumed that those who have had positive impacts of microcredits remain in the MFIs and that those who have had negative impacts leave "unintentionally" the MFIs to avoid over-indebtedness and bankruptcy. Excluding these cases from the treatment group (i.e. negative effects), the impact assessment would overestimate the impact of microfinance. On the other hand, it can be assumed that the best performing former clients can also "voluntarily" leave the MFIs because they no longer need loans (positive impact). Excluding these cases from the treatment group would underestimate the impact.
4.3. Model specification and definitions of variables
4.3.1. Model specification
In order to limit the biases related to possible differences between the treatment group and control group in terms of observable characteristics, the impact assessment is carried out according to Propensity Score Matching technique (Rosenbaum and Rubin, 1983; Jalan J. and Ravallion M., 2010; Duvendack M. and Palmer-Jones R., 2014). It consists in assigning to each unit of production a probability of being a member of an MFI (propensity score) according to its observable characteristics using a simple probit model. Then, on the basis of this probability, each unit of the treatment group is matched with one or more units of the control group. The "nearest-five-neighbor" (NN) with replacement option is adopted for matching in order to overcome difference between treatment and control group. This technics of matching with more than one partner ('oversampling') is chosen in order to obtain a reduced variance, resulting from the use of more information to construct the counterfactual for each participant. The aim of the limitation of partners to five is to reduce biais induced by average poorer matches. After the balancing test, the impact of microfinance is obtained by the mean difference of outcome between the matched units of the treatment group and the control group. The T-statistic mean test is used for the statistical significance of difference.

21
Then, the regression analysis is used to explore the impact of microcredits on each outcome variable. To obtain efficient estimators, the regression is weighted by the inverse of the propensity score obtained during the previous step (Hirano, Imbens, and Ridder, 2003). This analysis makes it possible to draw stronger conclusions by measuring the impact of membership on an MFI on outcome variable, while controlling for the characteristics of the production units. The model used in the regression analysis is formulated as follows:
Yi = αi+ βi*Ai + λiXi + µi
where :
- Yi is a outcome variable. - Ai is a dummy variable taking one if the unit is in the treatment group (“old” member
or former member of an MFI) and zero if the unit is in the control group ("new entrant" member of an MFI)
- βi is the parameter of interest since it measures the impact of access to microfinance on the result variable
- Xi is a vector of independent variables indicating the observable characteristics of the production unit i.
- λi is the vector of the parameters associated with the vector Xi.
It is assumed that belonging to an MFI is not correlated with the unobservable omitted variables that are captured in the error term μ. For taking account of possible heteroskedasticity, estimates are conduct with "robust" standard errors option.
4.3.2. Variables choice
The financial services delivered by MFI may have impact on family production units in different channels depending on type of credit use: hiring workers, vocational training, local construction or rehabilitation, infrastructure or communication, equipment purchases, raw material purchasing, technologies and marketing. Thus, for a more complete analysis and taking account all these aspects, ten outcome variables grouped in three main groups are retained as dependent variable:
- Quantities of production factors: On supply side, microfinance reduces financial constraints and allows entrepreneurs to improve production level by increasing in short-run quantity of production factors (capital and labor) or reallocating production factors (more capital and less labor or inversely). Microfinance used in demand side

22
by prospecting for new clients, advertising and marketing improve in medium term the production level and increase demand of production factors. Quantity of labor is captured by number of workers or number of hours actually worked. Quantity of capital is captured by value of physical capital.
- Factors’ productivity: Microfinance may be used to increase factors’ productivity and efficiency of firms by improving human capital (hiring more educated workers, vocational training, health), social capital and quality of equipment.
- Firm’s performance : Microfinance may have positive impact on firm’s performance by increasing the production level (large orders) or minimizing cost (bulk purchasing and raw material storage). Firm’s performance are captured by turnover, value added, operating budget and Gross Surplus of Exploitation.
For the explanatory variables, they are grouped as follows:
o Relation to Microfinance: Treatment group: This variable captures the impact of microfinance
on firm’s activity. It is assumed that being in treatment group increase all outcome variables.
o Economic characteristics of the production unit:
Branch of activity: Firm’s performance, demand of factors and factors productivity depend on branch of activity due to price structure, cost’s structure, nature of products, concurrence level. Primary activities may be assumed to be less perfomant, to use much more labor, less capital and less efficient production factors than other activities. By contrast, it is assumed that transport have highest physical capital, trade have highest turnover and hotel and restaurant highest value added and Gross surplus of Exploitation.
Production factors before being member of MFI: Initial situation of firm before it became member of MFI may have impact on its final situation even without MFI due to return to scale. It is assumed that the bigger the firm (in term of labor and capital) before being member of MFI, the more efficient and bigger it is later (with MFI or not).
Production capacity saturation level: The efficiency of firm depends on its production capacity level. The more a firm’ production capacity is saturated, the more important its constraints for development are

23
Patent payment: This variable indicates the degree of formality of the production unit. It is assumed that the more a firm has high formality level, the more efficient and big it is.
Household as main-customer: the outlet problem and demand constraints are most important obstacle of development according to the entrepreneurs. Due to the decrease of Malagasy households’ purchasing power, it is assumed that the more a firm has customers other than households (export, formal sector), the more efficient it is.
o Characteristics of the head of production unit
Demographic characteristics of head of production unit may have impact on its performance. It is assumed that if the head of production unit is female or older person, it is less efficient due to the low physical ability
Human capital and social capital of the head of production unit have positive impact on its performance. Human capital is captured by educational level, type of apprenticeship and professional experiences before being member of MFIs. Social capital is captured by Producers group membership
o Geographical location
The geographical location determines the economic opportunities in term of market. It is assumed that firm located in capital of region is more efficient than those outside the capital region.
4.3.3. Definitions of variables
Based on information available in the database, variables used in the analyses are defined as follow:
Dependent variables:
- Quantities of production factors: o Number of workers mobilized in the production unit: Includes all workers
contributing to the production process regardless of status (self-employed, employed, family help, apprentice), regularity (permanent, temporary), payment (Paid or unpaid)
o Number of hours actually worked: sum of the hours actually worked (normal hours and overtime) by all workers mobilized during the production process

24
o Physical capital: different types of capital used (even not owned) during the production process: land and premises, machinery and equipment, office furniture and equipment, professional vehicles, tools and others. They are all valued using replacement cost
- Quality of factors of production
o Labor productivity: measured by the ratio between production and the number of workers
o Capital productivity: measured by the ratio of output to the total amount of capital
- Economic performance
o Turnover: valued by the sum of all revenues from sales of goods and services produced, values of products stored, self-produced or self-consumed, all valued at market prices
o Operating budget includes all production costs (purchase for resale, purchase of raw materials, payroll, taxes and dividends, energy, transport, insurance, maintenance, consumables and small tools, interest and social contributions
o Production is turnover minus purchase for resale o Value added is the Production minus the Intermediate Consumption o Gross surplus of Exploitation is the value added minus the remunerations of
factors: payroll, taxes and dividend
All dependent variables are in log form.
Explanatory variables:
o Microcredits: Treatment group: Dummy variable indicating that the production unit
is “old” or former members. The reference is the control group: “new entrants” members of MFIs (affiliation less than one year).
o Economic characteristics of the production unit:
Branch of activity: Dummy variables indicating whether the unit of production operates in "industry" or in "trade" or "hotel and restaurant" or "transport" or "household services ". The reference is the "primary" branch (coal or forestry), or extractive industry or other services
Size before MFIs: number of workers before the unit became member of MFIs

25
Capital before MFIs: the value of the capital that was acquired before the unit became member of MFIs
Production capacity saturation level: Dummy variable indicating whether the production unit can produce more without hiring or acquiring new capital
Patent payment: Dummy variable indicating whether the production unit pays patent
Household main-customer: Dummy variable indicating whether the unit of production has households as main customer. The reference is the units those main customers are either other production units or public sector or export
o Characteristics of the head of production unit
Head female: Dummy variable indicating that the head of the production unit is a woman
Age head before MFIs: Age of head of production unit before the unit became member of MFIs
Educational level of head: Dummy variables indicating that the head of the production unit has completed primary, secondary or university education. The reference is that the head of the production unit is uneducated
Type of apprenticeship of head: Dummy variable indicating whether the head of the production unit has undergone vocational training in specialized establishments or in a big company
Professional experiences of head before MFIs: number of years before the unit became member of MFIs
Belonging to Producers’ group: Dummy variable indicating whether the production unit is member of a producers group or association
o Geographical location
Capital region: Dummy variable indicating whether the production unit is located in the capital of the region
The descriptive statistics of variables are resumed in the following table:

26
Table 3: Descriptive statistics of variables
Variables mean Sd min Max N
Number of workers (persons) 2.0 1.32 1 20 984
Number of hours actually worked (hours/month) 528.7 757.19 1 12,560 984
Capital Assets (1000 MGA) 5,292.8 30,323.57 40 860,010 984
Productivity of labor (1000 MGA/person) 2,157.6 8,509.05 30 221,880 984
Productivity of capital (1000 MGA/capital) 27.1 130.55 10 1781.9 984
Monthly Turnover (1000 MGA) 3,890.3 10,797.01 18 221,880 984
operating budget (1000 MGA) 2,626.1 7,529.87 8 120,620 984
Monthly Production (1000 MGA) 1,963.2 5,515.79 10 107,930 984
Monthly Added Value (1000 MGA) 1,264.1 4,418.02 5 101,260 984
Monthly Gross Operating Surplus (1000 MGA) 1,244.1 4,413.34 5 101,260 984
Trade (%) 0.489 0.500 0 1 984
Industry (%) 0.146 0.353 0 1 984
Hotel Restaurant (%) 0.25 0.433 0 1 984
Transport (%) 0.038 0.192 0 1 984
Services for households (%) 0.024 0.154 0 1 984
Number of workers before MFIs (persons) 1.732 1.008 1 10 984
Capital before MFIs (1000 MGA) 2,523.7 8,725.2 20 86,000 984
Production capacity saturation level (%) 0.475 0.499 0 1 984
Patent payment (%) 0.416 0.493 0 1 984
Households main customer (%) 0.870 0.335 0 1 984
Head female (%) 0.528 0.499 0 1 984
Age before MFIs (years) 38.2 10.8 15 78 984
Primary school (%) 0.241 0.428 0 1 984
Secondary school (%) 0.680 0.466 0 1 984
University (%) 0.061 0.241 0 1 984
Vocational training (%) 0.096 0.295 0 1 984
Profesional experiences before MFIs (years) 5.6 8.157 0 15 984
Member of producers group (%) 0.029 0.169 0 1 984
Capital of region (%) 0.153 0.360 0 1 984
Source : R4D-University of Bern-University of Geneva-WTI, Survey on Impact of Microfinance, Madagascar 2016 Note : Conversion 2900 MGA=1 USD

27
5.Results 5.1. Descriptive Statistics comparing Treatment group and control group
Overall, the treatment group and control group are quite similar. The observed differences are either relatively low or statistically non-significant except for two criteria.
Women heads of production units are much more frequent in the control group than in the treatment group. In the control group, six out of ten units are managed by a woman, while they represent only 51% in the treatment group. The difference is statistically significant.
In terms of human capital, the treatment group and the control group are not significantly different. The average number of years of study of the head of the production unit is 8.5 years. Similarly, the professional experiences of the head of production unit before being member of MFIs are different (6.6 years for control group and 5.7 years for treatment group), but the difference is statistically non-significant. Regarding the mode of apprenticeship in the trade, if more than 10% of heads of production units in the treatment group have learned their trade either in a technical training establishment or a big company, the proportion is reduced by half in the control group. Although difference exists between the two groups, it is statistically non-significant.
Regarding characteristics of the activities, treatment group and control group level are quite similar: in terms of capital before being member of MFIs, Production capacity saturation level, adhesion to producers association or branches of activity. The difference of average number of workers before being member of MFI is small, even it is statistically significant: 1.9 persons for the control group and 1.7 persons for the treatment group. By contrast, in terms of the main customer, the two groups are significantly different. Indeed, if more than 88% of the production units in the treatment group sell their products mainly to households, the proportion is 82% for the treatment group.

28
Table 2 : Characteristics of production units in Treatment group and Control group
Variables Control group
Treatment Group T-Statistic
Trade (%) 51.3 48.6 0.6257 Industry (%) 10.4* 15.4* -1.6226 Hotel Restaurant (%) 31.8** 23.7** 2.1276 Transport (%) 1.3* 4.3* -1.7974 Services for households (%) 1.3 2.7 -0.9989 Number of workers before MFIs (persons) 1.9** 1.7** 2.5429 Capital before MFIs (1000 MGA) 2,328 2,560 -0.3028 Production capacity saturation level (%) 44.8 48.1 -0.7451 Patent payment (%) 38.3 42.3 -0.9195 Member of producers group (%) 2.6 3.0 -0.2794 Households main customer (%) 82.5* 88.0* -1.8643 Head female (%) 61.7** 51.2** 2.3935 Age before MFIs (years) 38.3 38.3 0.0158 Number of Years of education (years) 8.5 8.4 0.2550 Primary school (%) 19.5 25.1 -1.4851 Secondary school (%) 72.1 67.3 1.1562 University (%) 5.8 6.3 -0.1989 Vocational training (%) 5.8* 10.4* -1.7433 Profesional experiences before MFIs (years) 6.6 5.5 1.6219 Capital of region (%) 19.5 14.6 1.5502
Source : R4D-University of Bern-University of Geneva-WTI, Survey on Impact of Microfinance, Madagascar 2016 Note: *** significant at 0.01 level, ** significant at 0.05 level, * significant at 0.1 level. The control group is considered as valid, if the characteristics of its production units are not significantly different from those of the treatment group. For continuous variables, T-statistic tests are used to evaluate whether the mean values of the two groups are statistically different from each other. For categorical variables, the percentages are compared between the treatment and control group using a proportional test. The results of the T-statistic tests, as well as the proportion test values, are presented in the last column. The two values can be interpreted in the same way. Conversion 2900 MGA=1 USD
5.2. Impact Evaluation results using Propensity Score Matching method
Despite the similarity of the treatment group and the control group discussed earlier, some significant differences were observed for a few variables such as the proportion of female leaders and the number of workers before being member of the MFI. In order to correct these imbalances, the Propensity Score Matching method with the nearest-five neighbor option has been applied. Imbalances have disappeared in matched data. The observed differences are both very low and statistically non-significant.

29
Table 3 : « Balancing tests » after Propensity Score Matching method
Variables Control group
Treatment group % biais T-statistic
Trade (%) 49.1 46.7 4.7 0.93 Industry (%) 15.4 18.1 -8 -1.41 Hotel Restaurant (%) 24.6 25.3 -1.4 -0.29 Transport (%) 2.9 1.9 6.2 1.31 Services for households (%) 2.6 2.2 2.7 0.5 Number of workers before MFIs (persons) 1.7 1.7 2.8 0.63 Capital before MFIs (1000 MGA) 2,453.1 2,401.3 0.6 0.11 Production capacity saturation level (%) 47.8 49.4 -3.1 -0.61 Patent payment (%) 42.3 41.6 1.4 0.28 Member of producers group (%) 2.9 2.4 3.4 0.69 Households main customer (%) 87.9 87.3 1.8 0.38 Head female (%) 52.8 54.8 -4.1 -0.8 Age before MFIs (years) 38.3 38.6 -2.6 -0.5 Number of Years of education (years) 8.5 8.4 0.9 0.19 Primary school (%) 24.6 24.5 0.2 0.05 Secondary school (%) 67.9 68.9 -2.1 -0.4 University (%) 6.2 5.5 2.6 0.54 Vocational training (%) 9.5 10.1 -2.1 -0.39 Profesional experiences before MFIs (years) 5.5 6.0 -5.8 -1.21 Capital of region (%) 15.0 16.0 -2.7 -0.56
Source : R4D-University of Bern-University of Geneva-WTI, Survey on Impact of Microfinance, Madagascar 2016 Note : Conversion 2900 MGA=1 USD
The analysis of matched data highlights the positive impacts of microcredit on family activities. However, the results vary according to the aggregate considered.
Microcredit has a positive impact on the production scale of family production units. Indeed, the average monthly turnover is 61% higher in the treatment group than in the control group. Similarly, the operating budget of the units in the treatment group is on average 71% higher than that of the control group. This shows the extensive growth provided by microcredit on family activities. However, when considering other aggregates such as level of production (turnover minus resale), value added and Gross Operating Surplus, positive differences are still observed in favor of the treatment group but are no longer statistically significant. These results can be explained by demand constraints due to lack of customers and the low purchasing power of households that are the main consumers for most of family production units.
Regarding production factors, microcredit has positive and significant impacts on the volume of work. The impacts are much greater in terms of the number of hours actually worked than

30
in terms of the number of workers: 43% increase for the first indicator and 21% for the second indicator. These results show the importance of the labor factor in small family activities. On the other hand, microcredits do not have significant impacts on the value of physical capital used in family production units. Low capital intensity characterizes family activities. The smaller impacts of microcredit on the number of workers and on capital can be explained by a low level of saturation in the production capacity of family production units confirming once again the demand constraints experienced by this sector.
Microcredits improve the technical efficiency of family production units. The apparent productivity of labor is 64% higher in the treatment group than in the control group. On the other hand, the impact on productivity of capital is also positive but not significant.
Table 4 : Microcredits Impacts on different production aggregates of family activities using Propensity Score Matching
Outcome Data Control group
Treatment Group T-statistic
Number of workers Unmatched 2.1 1.9 1.17 (persons) Matched 2.1*** 1.7*** 2.7 Number of hours actually worked Unmatched 546.4 469.9 1.12 (hours per month) Matched 550.1*** 383.3*** 2.59 Capital Assets Unmatched 5,756.5 4,018.4 0.63 (1000 MGA) Matched 4,437.1 3,580.5 0.61 Productivity of labor Unmatched 2,310.5 1,503.6 1.05 (1000 MGA per worker) Matched 2,342.3** 1,429.7** 2.31 Productivity of capital Unmatched 27.8 24.2 0.31 (1000 MGA per capital unit) Matched 28.4 20.3 0.81 Monthly Turnover Unmatched 4,109.4 3,085.0 1.05 (1000 MGA) Matched 4,166.3** 2,579.7** 2.05 operating budget Unmatched 2,789.9 1,995.8 1.17 (1000 MGA) Matched 2,844.1** 1,670.7** 2.57 Monthly Production Unmatched 2,042.6 1,743.4 0.6 (1000 MGA) Matched 2,047.6 1,465.8 0.93 Monthly Added Value Unmatched 1,319.4 1,089.2 0.58 (1000 MGA) Matched 1,322.3 908.9 1.03 Monthly Gross Operating Surplus Unmatched 1,298.8 1,073.6 0.56 (1000 MGA) Matched 1,301.5 894.8 1.02
Source : R4D-University of Bern-University of Geneva-WTI, Survey on Impact of Microfinance, Madagascar 2016 Notes : *** significant at 0.01 level, ** significant at 0.05 level, * significant at 0.1 level. The operating budget includes all production costs (purchase for resale, purchase of raw materials, payroll, taxes and dividends, energy, transport, insurance, maintenance, consumables and small tools, interest and social contributions. Production is Turnover minus purchase for resale. The value added is the Production minus the Intermediate Consumption The gross surplus of Exploitation is the value added minus the remunerations of factors: payroll, taxes and dividend. The productivity of labor is the ratio between production to the number of workers. The productivity of capital is the ratio between production and physical capital. Conversion 2900 MGA=1 USD

31
5.3. Impact Evaluation results using econometric analysis
In order to obtain more efficient estimates of the impacts of microcredit on the activities of family production units and to assess its importance in relation to the other determining factors, an econometric analysis is carried out with simple OLS models weighted with the inverse of the propensity coefficients obtained during the previous step (Hirano, Imbens, and Ridder, 2003). The same result variables and explanatory variables used for Propensity Score Matching are used in the econometric models.
The results mentioned above are confirmed by econometric analyzes. At activity scale level, microcredits have positive and significant impacts on turnover and the operating budget. On the other hand, in terms of production level, the impact is not significant. Other exogenous factors with no direct links to microcredit have an impact on the level of production. On the one hand, the level of capital before joining the MFI, payment of patent, membership of producers groups or associations and establishment in capital of region have significant positive impacts not only on turnover and operating budget but also on the level of production, added value of family activities. On the other hand, the fact of having households as main customer acts negatively on the scale of activity. The identification of these factors shows that access to microcredit is only a necessary but not sufficient condition to increase the level of production of family production units. Access to services (including financial services) and basic infrastructure characterizing the urban environment, the expansion of the market for family production units, their better integration into the formal economic system and their regrouping are indispensable conditions to promote these activities.
At factors of production level, micro-credits significantly increase the volume of work either in terms of the number of workers or in terms of the number of hours actually worked. Positive trends due to the number of workers and duration of activity before joining the MFI are also observed. The management of a production unit by a woman has a negative and significant impact on the number of workers mobilized. The impact of microcredits on physical capital is positive but not significant. The level of capital before joining the MFI is the only factor that triggers the positive dynamics of capital in family production units. These results confirm once again the importance of the dynamics of job creation in these family activities and seem to justify the idea that microcredits are more effective in improving the performances of the production units already in activity than to launch new activities created.

32
The positive impacts of microcredit on the technical efficiency of family production units are confirmed by econometric analyzes. Indeed, microcredit significantly improves the productivity of labor. The level of development (number of workers, level of capital, payment of patent) reached before joining the MFI constitutes the determining factors of labor productivity. Regarding assets, microcredit has no significant impact on its productivity. On the other hand, payment of patent has a positive impact. These results highlight the need for further support, particularly in financial management, to limit "waste" and optimize the use of new cash flow or financial capital.

33
Table 5 : Microcredits Impacts on different production aggregates of family activities using econometric analysis: OLS models weighted with propensity score
Outcome variables
Number of workers
(log)
Number of hours
worked (log)
Capital-Assets (log)
Productivity of labor (log)
Productivity of capital
(log) Turnover
(log) Operating
budget (log) Production
(log) Added
Value (log)
Gross Operating
Surplus (log)
Traitement group (dummy) 0.15*** 0.36*** -0.07 0.20 0.15 0.35** 0.23* 0.39*** 0.37** 0.37**
(8.52) (4.12) (-0.48) (1.48) (0.83) (2.54) (1.66) (2.80) (2.37) (2.34)
Trade (dummy) -0.04 0.09 -1.31*** 1.28*** 2.34*** 1.26*** 2.09*** 0.18 0.33 0.30
(-0.73) (0.31) (-3.39) (5.05) (5.75) (5.02) (7.42) (0.58) (1.07) (0.98)
Industry (dummy) -0.02 -0.07 0.14 0.14 0.13 0.13 0.73** 0.17 -0.22 -0.22
(-0.40) (-0.25) (0.33) (0.40) (0.29) (0.38) (2.11) (0.46) (-0.53) (-0.52)
Hotel Restaurant (dummy) 0.08 0.35 -0.83** 1.10*** 1.85*** 1.21*** 2.13*** 1.06*** 0.54* 0.55*
(1.44) (1.21) (-2.10) (4.25) (4.58) (4.66) (7.49) (3.38) (1.65) (1.69)
Transport (dummy) -0.03 -0.12 1.30*** 1.29*** -0.15 1.28*** 1.07*** 1.56*** 1.50*** 1.51***
(-0.53) (-0.32) (2.94) (3.33) (-0.25) (3.34) (3.23) (3.61) (3.22) (3.27)
Services for households (dummy) -0.12* -0.62 -0.08 -0.59 -0.42 -0.71* -0.59 -0.72* -0.72* -0.71*
(-1.92) (-1.64) (-0.16) (-1.53) (-0.71) (-1.84) (-1.20) (-1.75) (-1.83) (-1.79)
Number of workers before MFIs (persons) 0.39*** 0.37*** 0.28*** -0.12** 0.04 0.27*** 0.20*** 0.33*** 0.31*** 0.32***
(22.78) (9.47) (3.20) (-2.21) (0.43) (4.63) (2.92) (5.06) (4.54) (4.53)
Capital before MFIs (1000 MGA) 0.00 0.00** 0.00*** 0.00** -0.00*** 0.00*** 0.00*** 0.00** 0.00** 0.00**
(1.18) (2.33) (7.35) (2.51) (-6.05) (2.76) (2.76) (2.05) (2.50) (2.47)
Production capacity saturation level (dum.) 0.01 -0.01 0.41*** 0.18 -0.28 0.20 0.06 0.28** 0.40*** 0.39**
(0.77) (-0.06) (2.83) (1.36) (-1.62) (1.48) (0.41) (1.98) (2.59) (2.50)
Patent payment (dummy) 0.08*** 0.33*** 1.20*** 0.89*** -0.19 0.98*** 1.40*** 0.71*** 0.72*** 0.70***
(4.04) (4.02) (7.71) (6.32) (-1.12) (6.98) (8.89) (4.92) (4.88) (4.65)
Households main customer (dummy) -0.02 0.01 0.07 -0.78*** -0.66*** -0.79*** -0.94*** -0.67*** -0.70*** -0.71***
(-0.63) (0.07) (0.32) (-4.66) (-2.65) (-4.75) (-4.97) (-4.28) (-4.10) (-4.10)
Head female (dummy) -0.11*** -0.08 0.22 -0.02 -0.23 -0.14 0.06 -0.06 -0.11 -0.11

34
Outcome variables
Number of workers
(log)
Number of hours
worked (log)
Capital-Assets (log)
Productivity of labor (log)
Productivity of capital
(log) Turnover
(log) Operating
budget (log) Production
(log) Added
Value (log)
Gross Operating
Surplus (log)
(-5.37) (-0.80) (1.35) (-0.15) (-1.13) (-0.95) (0.38) (-0.41) (-0.71) (-0.71)
Age before MFIs (years) -0.00 0.00 0.01* -0.00 -0.02 -0.00 -0.00 -0.00 0.00 0.00
(-0.34) (0.84) (1.67) (-0.15) (-1.57) (-0.16) (-0.57) (-0.23) (0.14) (0.03)
Primary school (dummy) -0.01 -0.04 0.51 -0.02 -0.68 -0.03 -0.34 -0.03 0.09 0.08
(-0.11) (-0.14) (0.80) (-0.07) (-0.87) (-0.09) (-0.86) (-0.07) (0.24) (0.21)
Secondary school (dummy) 0.07 -0.00 0.81 0.28 -0.63 0.35 0.15 0.25 0.48 0.46
(1.19) (-0.01) (1.28) (0.90) (-0.81) (1.05) (0.39) (0.72) (1.54) (1.48)
University (dummy) 0.06 0.30 1.50** 0.44 -1.06 0.50 0.35 0.31 0.48 0.47
(0.83) (1.04) (2.15) (1.21) (-1.27) (1.35) (0.86) (0.78) (1.22) (1.21)
Vocational training (dummy) 0.00 0.02 -0.15 0.03 0.11 0.04 -0.09 0.25 0.15 0.13
(0.08) (0.13) (-0.68) (0.12) (0.36) (0.16) (-0.30) (0.86) (0.52) (0.43)
Profesional experiences before MFIs (years) -0.00 0.01* -0.02*** 0.01 0.04*** 0.01 0.00 0.02** 0.02** 0.02**
(-0.11) (1.96) (-2.75) (1.47) (3.66) (1.37) (0.18) (2.26) (2.03) (2.09)
Member of producers group (dummy) 0.03 0.21 -0.65* 0.36 0.84 0.39 -0.10 0.47 0.41 0.45
(0.57) (0.90) (-1.91) (0.75) (1.19) (0.82) (-0.33) (0.92) (0.70) (0.76)
Capital of région (dummy) 0.03 0.14* 0.47*** 0.49** 0.01 0.52*** 0.56** 0.56*** 0.52*** 0.52***
(0.94) (1.71) (2.72) (2.52) (0.03) (2.73) (2.45) (2.93) (2.81) (2.71)
Intercept -0.26*** 4.40*** 4.26*** 5.55*** 1.10 5.27*** 4.31*** 4.98*** 4.32*** 4.35***
(-2.98) (11.02) (5.34) (11.58) (1.17) (10.64) (7.79) (9.38) (8.30) (8.21)
Pseudo R2_a 0.72 0.28 0.40 0.28 0.31 0.36 0.37 0.32 0.29 0.28
N 979 979 979 979 979 979 979 979 979 979 Source : R4D-University of Bern-University of Geneva-WTI, Survey on Impact of Microfinance, Madagascar 2016 Notes: *** significant at 0.01 level, ** significant at 0.05 level, * significant at 0.1 level; T-stat in brackets; five out of 984observations are excluded in the regression because of outliers

35
Conclusion
This study attempted to analyze the impact of microcredits on non-agricultural family activities in Madagascar. The results showed that microcredit had a positive and significant impact on the turnover and operating budget of the production units. On the other hand, the increases in the level of production, value added and gross operating surplus are not significant. At factors of production level, positive and significant impacts were observed both on the volume of work and on the productivity of labor. On the other hand, there is no significant impact on capital.
There are many implications of these results for economic policy. Microcredits are needed to promote non-agricultural family activities in Madagascar. But they are largely inadequate to meet the needs of family activities. More fluid access to credit only partially solves problems that are mainly macroeconomic. It is time and indispensable to surpass the mutual ignorance between the State and the Formal Sector on the one hand and family activities and the Informal Sector on the other. On the side of the State and the formal sector in general, it is essential to act on the demand side by creating an environment favorable to the enlargement of the market of family production units by giving them opportunities to access the national and international value chains. On the supply side, producers' access to services (including financial services) and basic infrastructure should be facilitated. As far as family production units are concerned, it is in their interest to seize these opportunities by regularizing their situation vis-à-vis the Administration, respecting production standards and working in an association. All of this is aimed at responding to large orders by increasing production capacity, minimizing production costs by making group purchases, improving social capital by encouraging exchanges of experience between members of the group.

36
References
Aivazian V. A. and Santor E., 2008, Financial constraints and investment: assessing the impact of a World Bank credit program on small and medium enterprises in Sri Lanka, Canadian Journal of Economics 41 (2)
Bouquet E. and Wampfler B., 2006, Enjeux et impacts de la microfinance rurale à Madagascar: Etude d’impact du réseau des Caisses d’épargne et de crédit mutuel de Madagascar (CECAM) (2003-2007), CIRAD-FOFIFA, Madagascar
Brannen C., 2010, An Impact Study of the Village Savings and Loan Association (VSLA) Program in Zanzibar, Tanzania, The Honors College, Wesleyan University
CNFI, 2014, Stratégie Nationale de la Finance Inclusive SNFI 2013 – 2017, CNFI, Ministère des Finances et du Budget, Madagascar
Copestake J. G., 2011, Microfinance Impact and Innovation Conference 2010: Heralding a new era of microfinance innovation and research?, Enterprise Development and Microfinance Vol. 22 No. 1, doi: 10.3362/1755-1986.2011.004, ISSN: 1755-1978
Diagne, A. 1998, Impact of access to credit on income and food security in Malawi, FCND Discussion Paper No. 46. Washington, D.C., USA: International Food Policy Research Institute (IFPRI).
Donou-Adonsoua F., Sylwester K., 2016, Growth effect of banks and microfinance: Evidence from developing countries, Elsevier, The Quarterly Review of Economics and Finance
Duvendack M. and Palmer-Jones R., 2014, High Noon for Microfinance Impact Evaluations: Re-investigating the Evidence from Bangladesh, The Journal of Development Studies 48 (12), pp. 1864-1880, http://dx.doi.org/10.1080/00220388.2011.646989
Ferdousi F., 2015, Impact of microfinance on sustainable entrepreneurship development, Development Studies Research, 2:1, pp. 51-63, http://dx.doi.org/10.1080/21665095.2015.1058718, Routledge
Grimm M. and Paffhausen A. L., 2015, Do interventions targeted at micro-entrepreneurs and small and medium-sized firms create jobs? A systematic review of the evidence for low and middle income countries, Labour Economics 32, pp. 67–85
Gubert F. and Roubaud F., 2005, Analyser l’impact d’un projet de microfinance : l’exemple d’ADéFI à Madagascar, Projet MADIO, INSTAT-DIAL/IRD-Agence Française de Développement

37
Hashemi S. M., Schuler S. R., and Riley A. P., 1996, Rural credit programs and women's empowerment in Bangladesh, World Development 24 (4), pp. 635-653
Hiatt S. R. and Woodworth W. P., 2006, Alleviating poverty through microfinance: Village banking outcomes in Central America, The Social Science Journal 43, pp. 471–477
Hirano K., Imbens G. W. and Ridder G. , 2003, Efficient estimation of average treatment effects using the estimated propensity score, Econometrica, Vol. 71, No. 4, pp. 1161-1189
Jalan J. and Ravallion M., 2010, Estimating the Benefit Incidence of an Antipoverty Program by Propensity-Score Matching, Journal of Business and Economic Statistics 21 (1), pp. 19-30, http://www.jstor.org/stable/1392347
Jia X., Xiang C., Huang J., 2013, Microfinance, self-employment, and entrepreneurs in less developed areas of rural China, China Economic Review 27, pp. 94–103
Leigh Anderson C. and Locker L., 2002, Microcredit, Social Capital and Common Pool Resources, 2002, World Development Vol. 30, No. 1, pp. 95–105
Miled K. B. H. and Rejeb J. B., 2015, Microfinance and Poverty Reduction: A Review and Synthesis of Empirical Evidence, Procedia - Social and Behavioral Sciences 195, pp. 705-712
Morduch J., 1998, Does microfinance really help the poor? Unobserved heterogeneity and average impacts of credit in Bangladesh. Cambridge, MA, USA: Harvard University, Department of Economics and HIID
Pallen D. 1997. Environmental source book for micro-finance institutions. Hull, Quebec, Canada: Canadian Inter national Development Agency (CIDA), Asia Branch,
Pitt M. M., and Khandker S. R.. 1997. The impact of group-based credit programs on poor households in Bangladesh: Does the gender of participants matter? Journal of Political Economy
Pitt M., and S. R. Khandker. 1996. Household and intrahousehold impact of the Grameen Bank and similar targeted credit programs in Bangladesh. World Bank Discussion Papers No. 320. Washington, D.C., USA: World Bank.
Raihan S., Osmanic S.R. and Baqui Khalily M.A., 2017, The macro impact of microfinance in Bangladesh: A CGE analysis, Economic Modeling 62, pp. 1–15, http://dx.doi.org/10.1016/j.worlddev.2014.05.012
Rakotomanana F., and al., 2013, Le Secteur Informel à Madagascar en 2012 : Poids économique et social importants en déconnexion avec le système formel. UNDP, ILO, IRD/DIAL, INSTAT, Madagascar
Robinson M. S., 2001, The Microfinance Revolution, Sustainable Finance for the Poor, Worldbank, Open Society Institute, Washington

38
Rosenbaum P. R. and Rubin D. B., 1983, The Central Role of the Propensity Score in Observational Studies for Causal Effects, Biometrika 70 (1), pp. 41-55
Samer S., Majid I., Rizal S., Muhamad M. R., Sarah-Halim, and Rashid N., 2015, The Impact of Microfinance on Poverty Reduction: Empirical Evidence from Malaysian Perspective, Procedia-Social and Behavioral Sciences 195, pp. 721 – 728
Schuler S. R., Hashemi S. M., and Riley A. P., 1997, The influence of women's changing roles and status in Bangladesh's fertility transition: Evidence from a study of credit programs and contraceptive use, World Development 25 (4), pp. 563-575.
Swain R. B. and Varghese A., 2008, Does Self Help Group Participation Lead to Asset Creation?, Uppsala University, Department of Economics, Sweden, Working paper 2008:5, ISSN 1653-6975
Tedeschi G. A. and Karlan D., 2010, Cross Sectional Impact Analysis: Bias from Dropouts, Financial Access Initiative-Yale University
Van Rooyen C., Steward R. and De Wet T., 2012, The Impact of Microfinance in Sub-Saharan Africa: A Systematic Review of the Evidence, World Development 40 (11), pp. 2249–2262, http://dx.doi.org/10.1016/j.worlddev.2012.03.012
Voninirina A., 2014, Impact de la microfinance sur l’économie rurale à Madagascar, CREAM, Madagascar
Weber O. and Ahmad A., 2014, Empowerment through Microfinance: The Relation between Loan Cycle and Level of Empowerment, World Development 62, pp. 75–87
Yaron J., 1991, Successful rural finance institutions, World Bank Discussion Paper, Washington, D.C., USA
Zeller M., and M. Sharma, 1998, Rural finance and poverty alleviation. Washington, D.C., USA: International Food Policy Research Institute (IFPRI)
Zeller M., Lapenu C, Minten B., Ralison E., Randrianaivo D., and Randrianarisoa C., 1998, Rural development in Madagascar: an empirical investigation of the critical triangle of environmental sustainability, economic growt and poverty alleviation. Washington, D.C., USA and Antananarivo, Madagascar: International Food Policy Research Institute (IFPRI) and Ministry of Scientific Research.
Zeller M., Diagne A., and Mataya Ch., 1997, Market access by smallholder farmers in Malawi: Implications for technology adoption, agricultural productivity, and crop income, FCND Discussion Paper No. 35. Washington, D.C., USA: International Food Policy Research Institute (IFPRI).
Zeller M., Braun J. von, Johm K., and Putz D., 1994, Sources and terms of credit of the rural poor in The Gambia, IFPRI, African Review of Money, Finance and Banking.