impact of laryngopharyngeal reflux on subjective and ... · pdf fileoriginal research article...
TRANSCRIPT

ORIGINAL RESEARCH ARTICLE Open Access
Impact of laryngopharyngeal reflux onsubjective and objective voice assessments:a prospective studyJérôme R. Lechien1,2,3*, Kathy Huet2, Mohamad Khalife3, Anne-Françoise Fourneau3, Véronique Delvaux2,Myriam Piccaluga2, Bernard Harmegnies2† and Sven Saussez1,3†
Abstract
Background: Laryngopharyngeal reflux is a prevalent, not well-understood disease affecting a high proportion ofpatients who seek laryngology consultation. The objective of this prospective case series is to explore the subjectiveand objective voice modifications in Laryngopharyngeal reflux (LPR), especially the usefulness of acousticparameters as treatment outcomes, and to better understand the pathophysiological mechanisms underlying thedevelopment of voice disorder.
Methods: Forty-one patients with a reflux finding score (RFS) > 7 and a reflux symptom index (RSI) > 13 wereenrolled and treated with pantoprazole 20 mg twice daily for three months. RSI, RFS, Voice Handicap Index (VHI),and Grade, Roughness, Breathiness, Asthenia, Strain and Instability (GRBASI) were assessed at baseline and afterthree months post-therapy. Acoustic parameters were measured by selecting the most stable interval of the vowel/a/. A study of correlations between acoustic measurements and laryngoscopic signs was conducted in patientswith roughness. Statistical analysis was performed using Statistical Package for the Social Sciences (SPSS).
Results: Significant improvement in RSI, RFS, VHI, jitter, percent jitter, relative average perturbation (RAP),shimmer, percent shimmer, and amplitude perturbation quotient (APQ) was found at 3 months of treatment(p < .05). A correlation analysis revealed significant correlations between the grade of dysphonia, breathiness,asthenia, instability and jitter, percent jitter, RAP, shimmer, percent shimmer and APQ. In dividing our cohortinto two groups of patients according to the presence of roughness, shimmer, percent shimmer and APQsignificantly improved in patients with roughness, but no positive correlation was found between acousticparameters and laryngoscopic signs.
Conclusion: Acoustic parameters can help to better understand voice disorders in LPR and can be used astreatment outcomes in patients with roughness.
Keywords: Laryngopharyngeal reflux, Reflux laryngitis, Voice, Subjective and objective assessment
* Correspondence: [email protected]†Equal contributors1Laboratory of Anatomy and Cell Biology, Faculty of Medicine, UMONSResearch Institute for Health Sciences and Technology, University of Mons(UMons), Avenue du Champ de mars, 6, B7000 Mons, Belgium2Laboratory of Phonetics, Faculty of Psychology, Research Institute forLanguage Sciences and Technology, University of Mons (UMons), Mons,BelgiumFull list of author information is available at the end of the article
© The Author(s). 2016 Open Access This article is distributed under the terms of the Creative Commons Attribution 4.0International License (http://creativecommons.org/licenses/by/4.0/), which permits unrestricted use, distribution, andreproduction in any medium, provided you give appropriate credit to the original author(s) and the source, provide a link tothe Creative Commons license, and indicate if changes were made. The Creative Commons Public Domain Dedication waiver(http://creativecommons.org/publicdomain/zero/1.0/) applies to the data made available in this article, unless otherwise stated.
Lechien et al. Journal of Otolaryngology - Head and Neck Surgery (2016) 45:59 DOI 10.1186/s40463-016-0171-1
BackgroundLaryngopharyngeal reflux (LPR) is the back flow ofgastric contents into the laryngopharynx where itcomes in contact with the tissues of the upper aerodi-gestive tract [1]. It concerns 4 to 10 % of patients whoseek Ear Nose Throat (ENT) consultation and 1 % ofpatients in primary care practice [2–4]. The mostcommon symptoms reported are globus sensation(88 %), throat clearing (82 %), and voice disorders suchas hoarseness (79 %) [5, 6]. Heartburn accounts forless than 40 % of cases, whereas esophagitis concernsonly 25 % of LPR patients [7, 8]. The major etiologicfactor for hoarseness of more than 3 months durationis LPR, with a prevalence of 55 to 79 % in hoarse pa-tients [9–11]. In comparison with healthy subjects,LPR patients often reported abnormal subjective voicecharacteristics such as musculoskeletal tension, hardglottal attack, glottal fry, vocal forcing, forcing sensa-tions, clamping, vocal fatigue, prolonged voice warm-up time, and restricted tone placement [12–14]. LPRsigns include posterior commissure hypertrophy(89 %), vocal fold edema (79 %), hyperemia (79 %), anddiffuse laryngeal edema (76 %)5. This clinical entityconsiderably affects patients’ quality of life by reducingthe speaker’s communicative effectiveness [2, 15].Specifically, LPR is related to 50 to 78 % of the popula-tion with voice complaints and 91 % of voice disordersin the elderly [16–18]. Based on these voice disorders,many authors have used acoustic parameters as out-comes of medical treatment efficacy in LPR patients orin LPR patients with hoarseness, but results are mixedand controversial among studies [19–21]. Undoubt-edly, some observe improvements of some acousticparameters values [20, 21], and others refute theseresults [22, 23]. These varied results do not help theunderstanding of the pathophysiological mechanismsunderlying hoarseness in LPR patients. Specifically,some authors suggested that vocal fold edema may bethe main sign responsible for irregular vocal foldvibration leading to hoarseness [13], whereas othersuspected mechanisms include dryness, keratosis,thickening of the epithelium, ulcerative lesions andalterations of the Reinke space [24].LPR disease has been the subject of several case-
control studies, which have concluded that a signifi-cantly lower voice quality (subjective and objectiveassessments) in LPR patients compared to controls [25].The aim of this study is i) to explore the subjective
and objective voice evolutions in LPR disease (LPRD),ii) to assess the usefulness of acoustic parameters astreatment outcomes in the general and rough LPRpopulations, and iii) to better understand the patho-physiological mechanisms underlying the developmentof voice disorder.
MethodsForty-one adult outpatients who visited the ENT out-patient department of the Epicura Hospital (Belgium)with LPR-related symptoms (hoarseness, throat clearing,cough, globus pharyngeus, dysphagia, throat pain, excessthroat mucus or postnasal drip, heartburn, etc.) sinceminimum 3 months were studied prospectively from Sep-tember 2013 to March 2015. LPR diagnosis was per-formed by French versions of reflux symptom index (RSI)and reflux finding score (RFS), both initially developed byBelafsky et al. [26]. Indeed, even if the utilization of pHmetry remains controversial, these authors have dem-onstrated that these thresholds (RSI > 13 and RFS > 7)were highly correlated with pathological pH monitoring(pH < 4) [26]. To be eligible as LPR patients in ourstudy, patients must have presented an RSI score > 13and an RFS score > 7. A physician (who did not knowthe results of the RSI) assessed the RFS score in a blindmanner at baseline and after treatment. Patients wereexcluded if they met the following criteria: vocal over-use, neurological disease affecting voice, psychiatricillness, upper respiratory tract infections within the lastmonth, an antacid treatment already started (i.e.,proton pump inhibitor(s) (PPI(s)), gastroprokinetic, orantihistamine), previous history of cervical surgery orradiotherapy, laryngeal trauma, vocal cord paralysis/paresis, benign vocal fold lesions, pharyngolaryngealmalignancy, seasonal allergies, PPI hypersensitivity,untreated thyroid disease, prior antireflux surgery, orchemical exposure causing laryngitis. Moreover, activesmokers, alcoholics and pregnant and lactating womenwere also excluded.The study protocol was approved by the local ethical
committee of the Epicura Hospital (n° A2014/001). Afterobtaining informed consent from each patient, they weretreated with diet and lifestyle measures and twice-dailyproton pump inhibitors (20 mg pantoprazole). Patientsdid not receive vocal hygiene teaching and they had notconsulted a speech therapist. Both the patient and thephysician have evaluated the respect of the diet advicesafter the treatment period using a scale ranging from 0(recommendations not respected) to 10 (recommenda-tions fully respected). At baseline and after 3 months oftreatment, subjects completed questionnaires (RSI andvoice handicap index (VHI)) and underwent videolaryn-gostroboscopy (RFS; StrobeLED - CLL-S1, Olympus Cor-poration, Hamburg, Germany) and voice recording by thesame practitioner (JL). Among the perceptual voice itemsassessed by Grade, Roughness, Breathiness, Asthenia,Strain, Instability (GRBASI) score, roughness is often themost prevalent perceptual voice characteristic in LPRpatients (without vocal abuse, etc.) [25]. At baseline, themain clinician (JL) performed a subjective evaluation ofthe perceptual roughness of the patients using GRBASI
Lechien et al. Journal of Otolaryngology - Head and Neck Surgery (2016) 45:59 Page 2 of 9
scale to classify the patients into two groups following theseverity of the perceptual roughness: “patients withoutroughness” (absence or mild grade) and “patients withroughness” (moderate or severe grade). Moreover, anexperienced physician performed the blinded assessmentof the patient perceptual voice quality (with GRBASI) onthe basis of the recordings. The physician did not knowthe time of the recording (pre and post-therapy). In regardto the voice analysis, subjects were instructed to producethe vowel /a/ three times, at modal phonation, for a timecorresponding to the maximum phonation time tooptimize the research of the most stable interval. Voiceassessments were conducted in a sound-treated roomwith a high-quality microphone (Sony PCM-D50; NewYork, NY, USA) placed at a distance of 30 cm from thepatient’s mouth. We treated the speech signal usingMDVP® software (KayPentax®, Paragon Drive Montvale,NJ, USA) to measure Jitter percent (Jitt), Relative AveragePerturbation (RAP), Pitch Perturbation Quotient (PPQ),Fundamental frequency variation (vF0), Shimmer percent(Shim), Amplitude Perturbation Quotient (APQ), Peak-to-Peak Amplitude Variation (vAm), and Noise HarmonicRatio (NHR). Even if some acoustic parameters may becorrelated, we made the choice to keep all parameters toevaluate their sensitivity in the assessment of the treat-ment effectiveness. The measurement of acoustic valuesat an interval of 1 s was considered the most stable byshowing the lowest jitt, shim and NHR values. These mea-sures were performed in the entire cohort and in patientswith moderate and severe roughness following the phys-ician assessment (GRBASI) and following the patient (RSI,first item and VHI total score > 20). An experienced phys-ician performed a second assessment of GRBASI in ablind manner for the correlation study. A correlationstudy between the respect of treatment, the subcategoriesof RSI and RFS, blinded GRBASI items and acousticparameters was conducted.Statistical analysis was performed using the Statistical
Package for the Social Sciences for Windows (SPSSversion 22.0; IBM Corp. Armonk, NY). Changes in RSI,RFS, VHI, GRBASI scores were calculated using theWilcoxon signed-rank test. The effect of treatment onacoustic parameters was also calculated using Wilcoxonsigned-rank test, whereas correlations between dietrespect, GRBASI, RSI, RFS and acoustic parameters werecalculated using Pearson’s correlation test. A level ofsignificance of .05 was adopted.
ResultsSubject characteristicsFrom the 54 patients identified as candidates, 41 com-pleted the study. There were 18 men (44 %) and 23women (56 %). The mean age of subjects was 50 years(50 in the female subgroup (24–72), and 51 in the male
subgroup (19–86)). The average body mass index of theparticipants was 26.64 kg/m2. There were no adversereactions to the treatment. All patients respected theintake of PPIs. A lot of potential candidates were notrecruited because they already were on PPI(s). The mostcommon primary complaints concerned cough (N = 8,19.51 %), globus sensation (N = 7, 17.07 %), odynophagia(N = 7, 17.07 %), and dysphonia (N = 6, 14.63 %). Othersymptoms were found in less than 10 % of patients.When we focused on the complaints exhibited by RSI,throat clearing (N = 38, 92.68 %), dysphonia (N = 37,90.24 %), mucous sensation/postnasal drip (N = 34,82.93 %), and chest pain/heartburn/stomach disorder(s)(N = 33, 80.49 %) were the most prevalent symptoms.
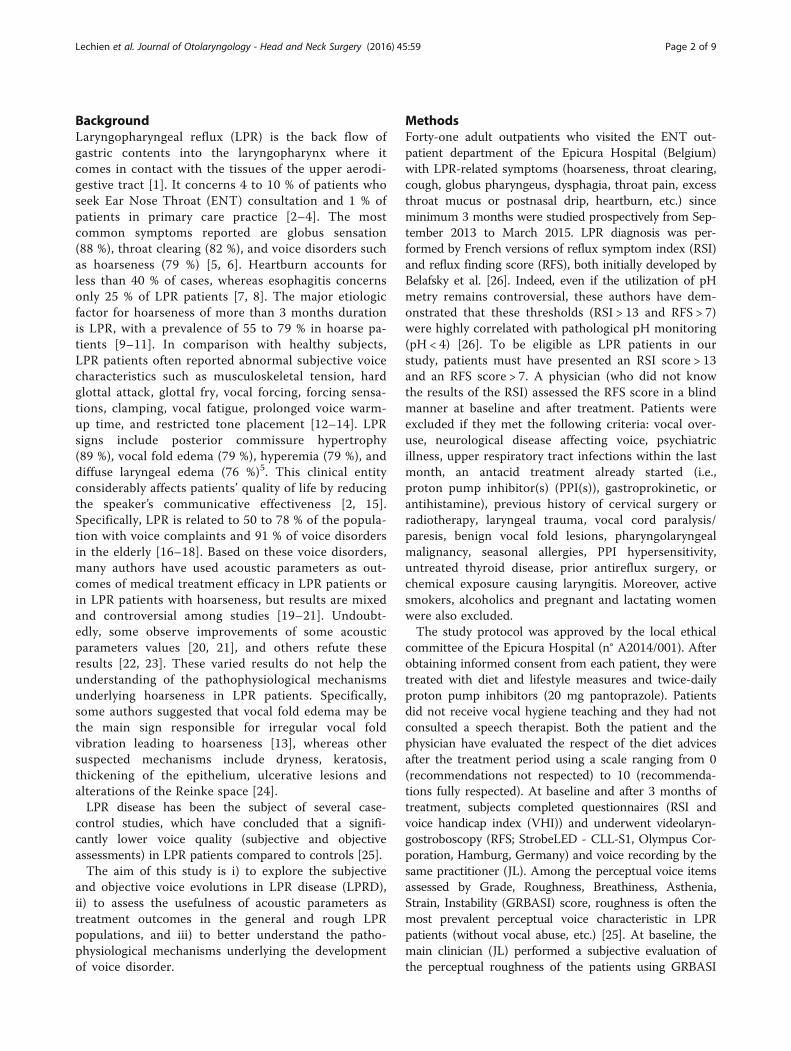
Clinical and subjective voice assessment evolutionIn the first part of our study, we subjectively assessedthe voice of our patients suffering from LPR before andafter a three month treatment of pantoprazole (20 mgtwice a day). Our subjective analysis comprised the RSI,RFS, VHI and GRBASI scores. The mean RSI for thepretreatment group was 22.98 ± 7.05, which was signifi-cantly higher than the mean RSI for the posttreatmentgroup (8.02 ± 5.18) (Table 1). The mean value of RFSwas 10.73 ± 2.24 in the pretreatment group and de-creased significantly (4.61 ± 3.20) in the posttreatmentgroup. Therefore, the clinical assessments demonstratedan important improvement characterized by a significantdecrease in both RSI (p < 0.001) and RFS (p < 0.001) after12 weeks of treatment (Table 1). Some clinical picturesof signs of LPR disease are available before and aftertreatment in Fig. 1.
Table 1 Pre- and posttreatment clinical and subjective voiceassessments in LPR patients
Scales pretreatment posttreatment Z p-value*
RSI 22.98 ± 7.06 8.02 ± 5.18 −5.52 < 0.001
RFS 10.73 ± 2.24 4.61 ± 3.20 −5.44 < 0.001
VHI 18.07 ± 12.98 9.10 ± 8.93 −4.38 < 0.001
VHIe 3.54 ± 4.06 1.63 ± 2.90 −3.67 < 0.001
VHIp 9.58 ± 6.85 5.34 ± 5.13 −3.86 < 0.001
VHIf 4.90 ± 4.65 5.34 ± 5.13 −4.08 < 0.001
Blinded
Grade 0.83 ± 0.67 0.80 ± 0.56 −0.23 0.819
Roughness 0.88 ± 0.71 0.76 ± 0.58 −1.04 0.297
Breathing 0.61 ± 0.74 0.56 ± 0.59 −0.43 0.670
Asthenia 0.44 ± 0.74 0.39 ± 0.67 −0.29 0.768
Strain 0.93 ± 0.76 0.98 ± 0.69 −0.36 0.721
Instability 0.98 ± 0.79 0.90 ± 0.77 −0.54 0.590
*Wilcoxon matched-pairs signed-ranks test (values and; VHIf Voice HandicapIndex Functional, VHIe Voice Handicap Index Emotional, VHIp Voice HandicapIndex Physic, VHI Voice Handicap Index
Lechien et al. Journal of Otolaryngology - Head and Neck Surgery (2016) 45:59 Page 3 of 9

The mean VHI scoring assessed in the pretreatmentgroup was 18.07 ± 12.98 and decreased significantly to9.10 ± 8.93 after three months of treatment (p < 0.001). Allsubcategories scores (VHI, VHI emotional, VHI physic,VHI functional) decreased significantly after 3 months oftreatment. According to Wilcoxon matched-pairs signed-ranks test, the perceptual voice quality of patients signifi-cantly improved in each GRBASI item after 3 months oftherapy (Table 1). The blinded assessment of GRBASI didnot reveal significant change after treatment.
Acoustic parametersThe acoustic parameters in LPR patients before and aftertreatment are described in Table 2. Except PPQ, allvalues of the acoustic parameters measuring the short-term perturbation of the fundamental frequency i.e. Jitt,and RAP showed a significant improvement after treat-ment. PFR, the acoustic parameter measuring acousticdisturbance of F0 did not significantly improve after
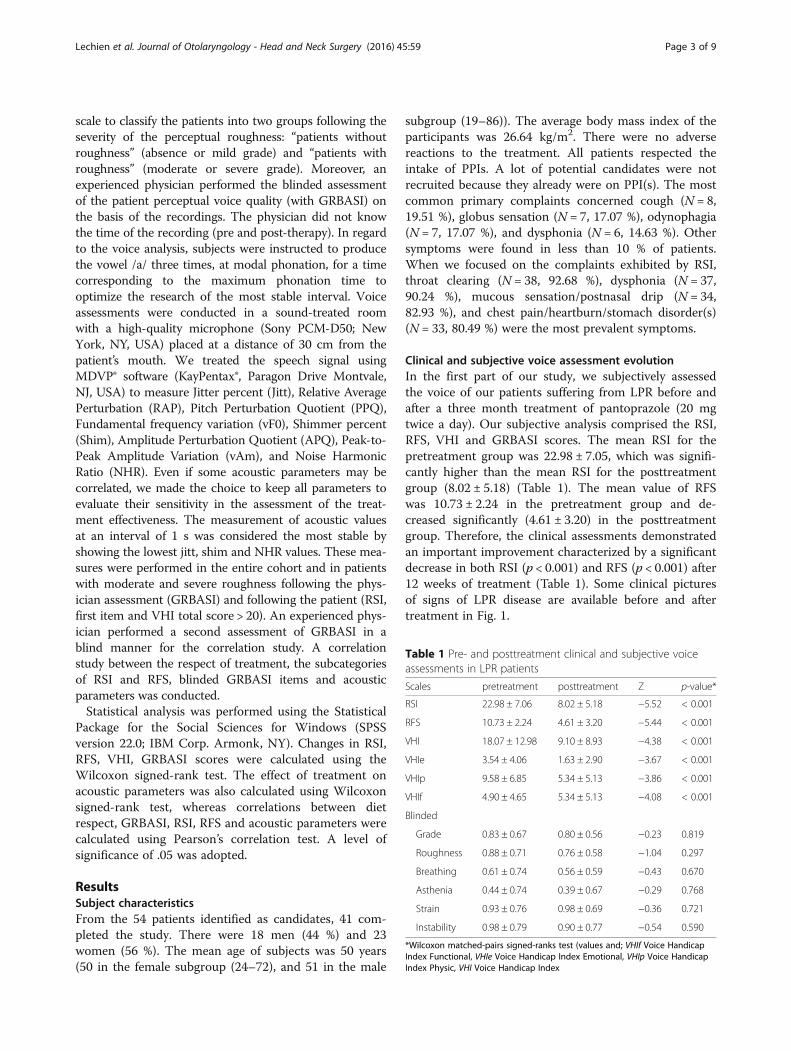
treatment. In regard to the acoustic parameters measur-ing the short-term perturbation of the intensity, Shimand APQ showed a significant improvement after treat-ment (Table 2). A study of correlations between RFS andRSI did not report a relevant correlation. In contrast, thepotential correlations between GRBASI assessment andacoustic measurement revealed different significantcorrelations between the grade of dysphonia, breathi-ness, asthenia, instability and all relevant acoustic pa-rameters (Table 3). The perception of strain was alsosignificantly correlated only with Shim and APQ. Theacoustic parameters of patients’ with/without roughnessbefore and after treatment are described in Tables 4 and5. All acoustic parameters did not improve after threemonths of treatment in the group of patients withoutroughness. In patients with roughness, Shim and APQsignificantly improved after treatment (Table 5). Similaranalyses were conducted in patients divided according tothe presence of a pathological VHI score (VHI > 20) or
Fig. 1 laryngological signs before and after treatment. The videostroboscopy at baseline (a) showed laryngeal and inter-arytenoid redness,posterior commissure hypertrophy, vocal folds irritation and pharyngolaryngeal edema suggesting laryngopharyngeal reflux disease. These signsimproved after treatment (b)
Table 2 Pre- and posttreatment acoustic parameter assessment in LPR patients (mean ± inter-quartile values)
Acoustic Parameters ULNR♯ pretreatment posttreatment Z p-value*
STD 2.04 3.16 ± 2.38 2.59 ± 1.76 −1.34 0.180
vF0 1.10 1.92 ± 1.05 1.59 ± 0.92 −1.19 0.236
Jitt 0.61 1.42 ± 1.10 1.12 ± 1.10 −2.08 0.038
RAP 0.36 0.84 ± 0.65 0.67 ± 0.55 −2.01 0.044
PPQ 0.35 0.84 ± 0.66 0.68 ± 0.52 −1.94 0.053
PFR 2.17 3.10 ± 2.00 2.66 ± 1.00 −1.72 0.084
Shim 2.26 5.14 ± 2.90 4.12 ± 2.30 −2.73 0.006
APQ 1.69 4.35 ± 2.20 3.31 ± 1.82 −3.00 0.003
vAm 9.23 13.75 ± 9.60 13.30 ± 6.58 −0.84 0.403
NHR 0.12 0.14 ± 0.40 0.13 ± 0.03 −0.33 0.741
*Wilcoxon matched-pairs signed-ranks test. ULNR: Upper Limit of N Range, ♯ = based on the MDVP® norms
Lechien et al. Journal of Otolaryngology - Head and Neck Surgery (2016) 45:59 Page 4 of 9
the presence of voice disorder (RSI, first item), but fewsignificant differences were found between the groups.In regard to potential correlations between the laryngo-scopic signs (RFS), clinical symptoms (RSI) and acousticparameters in rough patients, we did not find significantcorrelations between the main laryngoscopic signs, clin-ical symptoms and acoustic parameters. According tothe Pearson correlation test, we found significant correl-ation between the respect of diet advices and the im-provement of RSI score (z = -.420; p = .006).
DiscussionLaryngopharyngeal reflux is a common disease that hasbeen known as leading to chronic laryngitis and dyspho-nia. During the past two decades, a few studies have inves-tigated the pathophysiological mechanisms underlying thedevelopment of LPR signs and symptoms, diagnosis,medical and surgical treatments. Although poorly and in-accurately documented and frequently observed by practi-tioners, voice disorders seem to be prevalent and may bedisabling for patients. Thus, several case-control studieswere conducted demonstrating significant differences in
LPR patients concerning subjective (dysphonia and VHI)and objective (aerodynamic and acoustic) voice assess-ments in comparison with healthy subjects [25]. Given thelimitations of the pH monitoring, Belafsky et al. developedRSI and RFS for both the diagnosis and follow-up of LPRsigns and symptoms [16, 26]. These two scales are readilyadministered, highly reproducible, and exhibit excellentconstruct- and criterion-based validity [27]. We found thatRSI and RFS improved significantly after 12 weeks of PPIsand diet behavioral changes. These findings are in accord-ance with previous studies that observed the decrease inRSI and RFS after PPI and diet treatment [20, 28–30].Moreover, we observed a significant correlation betweenthe respect of the diet advices and the improvement of theRSI score. This interesting finding strengthens the in-volvement of the respect of the diet in the enhancementof the clinical complaints. In contrast, we did not observesignificant improvement of laryngoscopic signs, suspectinga kind of potential suggestion’s effect of the respect of theregimen on the symptoms improvement. We did not usepH metry given the many limitations. Firstly, it is wellknown that intermittent reflux may not occur during the
Table 3 Coefficient of correlation (coefficient and p-value) between voice subjective assessment (blinded GRBASI) and acousticparameters
G p-value R p-value B p-value A p-value S p-value I p-value
Jitt 0.463 0.002 0.184 0.249 0.548 <0.001 0.505 0.001 0.295 0.061 0.430 0.005
RAP 0.454 0.003 0.190 0.234 0.530 <0.001 0.498 0.001 0.276 0.081 0.419 0.007
Shim 0.500 0.001 0.130 0.416 0.522 <0.001 0.397 0.010 0.417 0.007 0.365 0.019
APQ 0.494 0.001 0.159 0.320 0.463 0.002 0.405 0.009 0.438 0.004 0.401 0.009
The statistical analysis was provided using Pearson's correlation test; Grade (G), Roughness (R), Breathiness (B), Asthenia (A), Strain (S), Instability (I), Jitter percent(Jitt), Relative Average Perturbation (RAP), Shimmer percent (Shim), and Amplitude Perturbation Quotient (APQ)
Table 4 Pre- and posttreatment acoustic parametersassessment in LPR patient groups (patients with roughness vs.patients without roughness; mean and inter-quartile values)
Patients without roughness (n = 26)
A. Parameters ULNR♯ pretreatment posttreatment Z p-value*
STD 2.04 2.70 ± 1.60 2.49 ± 2.47 −0.85 0.395
vF0 1.10 1.69 ± 1.17 1.50 ± 1.18 −0.90 0.367
Jitt 0.61 1.34 ± 1.43 1.19 ± 1.37 −1.46 0.144
RAP 0.36 0.79 ± 0.71 0.71 ± 0.75 −1.26 0.209
PPQ 0.35 0.79 ± 0.65 0.71 ± 0.64 −1.33 0.182
PFR 2.17 2.77 ± 1.50 2.62 ± 1.00 −0.92 0.358
Shim 2.26 4.61 ± 1.92 4.17 ± 2.96 −1.05 0.292
APQ 1.69 3.81 ± 1.53 3.24 ± 2.88 −1.90 0.058
vAm 9.23 12.60 ± 11.93 13.56 ± 9.50 −0.16 0.869
NHR 0.12 0.13 ± 0.04 0.13 ± 0.03 −0.63 0.525
*Wilcoxon matched-pairs signed-ranks test; Acoustic parameters (A. parameters),Jitter percent (Jitt), Relative Average Perturbation (RAP), Pitch PerturbationQuotient (PPQ), Fundamental frequency variation (vF0), Shimmer percent(Shim), Amplitude Perturbation Quotient (APQ), Peak-to-Peak AmplitudeVariation (vAm), and Noise Harmonic Ratio (NHR). ULNR: Upper Limit of NRange, ♯ = based on the MDVP norms
Table 5 Pre- and posttreatment acoustic parametersassessment in LPR patient groups (patients with roughness vs.patients without roughness; mean and inter-quartile values)
Patients with roughness (n = 15)
A. Parameters ULNR♯ pretreatment posttreatment Z p-value*
STD 2.04 3.94 ± 2.14 2.76 ± 1.48 −1.14 0.258
vF0 1.10 2.32 ± 1.13 1.74 ± 0.88 −0.97 0.334
Jitt 0.61 1.60 ± 1.17 1.02 ± 0.75 −1.36 0.173
RAP 0.36 0.92 ± 0.67 0.59 ± 0.50 −1.59 0.112
PPQ 0.35 0.91 ± 0.72 0.61 ± 0.40 −1.36 0.173
PFR 2.17 3.67 ± 2.00 2.73 ± 1.00 −1.48 0.358
Shim 2.26 6.06 ± 4.23 4.03 ± 2.78 −2.78 0.005
APQ 1.69 5.27 ± 3.85 3.44 ± 2.17 −2.33 0.020
vAm 9.23 15.73 ± 8.62 12.84 ± 4.14 −1.02 0.307
NHR 0.12 0.14 ± 0.04 0.13 ± 0.04 −1.25 0.211
*Wilcoxon matched-pairs signed-ranks test; Acoustic parameters (A. parameters),Jitter percent (Jitt), Relative Average Perturbation (RAP), Pitch PerturbationQuotient (PPQ), Fundamental frequency variation (vF0), Shimmer percent(Shim), Amplitude Perturbation Quotient (APQ), Peak-to-Peak AmplitudeVariation (vAm), and Noise Harmonic Ratio (NHR). ULNR: Upper Limit of NRange, ♯ = based on the MDVP norms
Lechien et al. Journal of Otolaryngology - Head and Neck Surgery (2016) 45:59 Page 5 of 9

test period. Thus, 3 episodes per week can be sufficient togenerate LPR disease [31, 32]. These intermittent refluxepisodes often lead to false negatives. Moreover, otherfalse negatives or false positives may be secondary to theprobe placement, movement or irritation [32]. Secondly,the normal values for the test could not be definitelyestablished given the difficulty of carrying out this test in alarge number of normal volunteers. Indeed, it seems thatthere would on average of 1.8 episodes per 24 h in healthypopulation [33] while another study reported LPRepisodes in 52 % healthy subjects with a cut-off set to 2episodes per day [34]. Other limitations (i.e., patient resist-ance, interpretation difficulties, patients rejection, cost,and equipment availability) limit the utilization of the pHmetry and it is for these reasons that we decided to madethe diagnosis using clinical scales. Among the LPR symp-toms, many patients report voice disorders notably de-scribed through the VHI scale in LPRD [13]. In our study,we used the VHI scale to describe voice complaints and toindicate treatment efficiency. We found that total andsubcategories of VHI scores significantly improved aftertreatment, confirming that VHI is an interesting tool toassess voice disorders in LPRD. These results corroboratethose of Sereg-Bahar et al., which showed an improve-ment in VHI after 8 weeks of omeprazole therapy anddietary advice [35]. Siupsinkiene et al. also reported theinterest to use VHI as an outcome of the efficacy of thePPI treatment in LPR patients [36]. At the exception ofthe study of Park et al., the perceptual voice qualityassessments conducted in LPR studies were not blinded[13, 37–39]. The study of Park et al. showed a signifi-cant improvement of all GRBAS items after 3 monthsof treatment. These authors defined the significant im-provement by the enhancement of ≥ 1 item(s) of thescale, which does not coincide with our statisticalapproach, limiting our literature comparison [39]. Thelow scores and the lack of significant improvement ofthe values of the GRBASI items could be related to amajority of mild and moderate LPR patient profilescomposing our cohort. Thus, this hypothesis couldhighlight the interest for the acoustic measurements toassess the treatment efficiency. Indeed, it important toconsider that subtle voice changes may be even moredifficult to detect by the usual subjective assessment bythe clinician or the patient him/herself. Therefore,many studies use various acoustic parameters to studythe pathophysiology or to measure the effectiveness oftreatment. In our study, many acoustic parameters (i.e.,Jita, Jitt, RAP, Shim, ShdB, and APQ) improved aftertreatment in the entire cohort. In their prospectivestudy, Jin et al. selected the most stable interval withthe lowest jitter value [20]. They found significantchanges in Jitt, Shim, and HNR at 3 months post-therapy. These findings were corroborated in our study
only in regard to Jitt and Shim. Another study investi-gating the therapeutic benefit of lansoprazole or omep-razole plus speech therapy for 8 weeks provided nosignificant improvement in any of the acoustic charac-teristics studied (i.e., Jitt and Shim) [23]. Additionally,our results reported that acoustic parameters could beused primarily in rough patients. Indeed, after dividingour cohort into two patient groups according to thepresence of roughness (assessed by the clinician), weobserved a significant improvement in Shim, ShdB andAPQ only in patients with roughness, and we had 3more acoustic parameters in the total cohort. Theacoustic parameters measuring the short-term perturb-ation of the fundamental frequency did not improveprobably because of the reduction of statistical powerdue to the lower number of patients in this group.Shaw et al. showed that all rough patients with sus-pected LPR at baseline had significant changes in Jittand Shim [19], whereas Hamdan found no significantmodification in any of the acoustic parameter valuesstudied (RAP, Shim, and NHR) after a short period of4 weeks of PPI treatment [22]. The study by Shaw et al.reported that the utilization of acoustic measures is im-portant, especially in rough LPR patients, but is less im-portant in LPR patients without roughness [19]. Ourresults corroborate the fact that the voice quality(hoarseness, and especially roughness) perceived by thephysician may suggest the utilization of acoustic param-eters, such as an indicator of the healing of mucosal le-sions and the treatment efficacy. Nevertheless, ourresults should be cautiously compared with the litera-ture given the myriad of methods used to calculate theacoustic parameters. Indeed, the results of the acousticmeasurements depend on the software used (and thealgorithms underlying the calculation of acoustic mea-sures), the type of vowel recorded, the duration of theanalyzed segment, and the method of choice of theselected interval [25, 40]. Thus, the choice of the moststable interval of the vocal signal varies among studies.In our study, we adopted an objective method to selectthe most stable 1 s interval by selecting the portionwith the lower values of jitter, shimmer, and NHR thatrepresents an advantage of this study [41].To better understand the pathophysiological mecha-
nisms underlying the development of hoarseness, weconducted a correlation study in rough patients, whichdid not show a significant correlation between clinicalsymptoms (RSI), laryngoscopic signs (RFS) and acousticmeasurements. These results stand in contrast to thestudy by Jin et al., which showed a significant positivecorrelation between Jitt and RSI [20]. Other previousstudies did not report a correlation between signs andsymptoms in LPR patients [42]. However, we foundsignificant correlations between the grade of dysphonia,
Lechien et al. Journal of Otolaryngology - Head and Neck Surgery (2016) 45:59 Page 6 of 9

breathiness, asthenia, instability and the values of Jitt,RAP, Shim, and APQ. Some trials reported similar find-ings in other vocal diseases [43], but to the best of ourknowledge, no LPR study has previously noted possiblecorrelations between the values of acoustic parametersand GRBASI score. Strangely, we did not found the clas-sical correlations between hoarseness or roughness andacoustic parameter as found in other diseases. A plaus-ible explanation can be found by the representation ofthe GRBASI components by the experienced physicianwho heard a rough and breath voice that he considered,first and foremost, as breath voice. Similar findings havealready been described [44]. Concerning the lack of cor-relation between signs and symptoms, several hypoth-eses can be identified. Firstly, our clinical experiencemakes us believe that patients develop their complaintsin various ways. Some patients somatize more thanothers for the same complaint leading to differences inthe final value of RSI. Secondly, we also observed in ourclinical practice that some LPR signs causing clinicalsymptoms are not described in the RFS scale, such ashypertrophy of the lingual tonsils and vocal fold kera-tosis [45]. Regarding the development of roughness,some studies proposed that the most possible negativefactors altering the periodicity of the vibration cycle andglottic closure would be slight edema of the vibratorymargin of the vocal cords, which is caused by potentiallynoxious materials including gastric acid, pepsin and pan-creatic enzyme irritation [13]. Other authors proposedthat dryness (sticky laryngeal mucus), keratosis of thevibratory margin of the vocal folds, thickening of theepithelium, ulcerative lesions, granulomas and modifica-tions of the Reinke space would form the basis of thealteration of the vibratory function of the vocal folds,especially in mild or moderate LPR patients [46]. Manyof these conditions altering the mechanical and vibrationcharacteristics of the vocal folds are not described inRFS and may lead to the development of roughness. Inthis study, we did not find a significant correlation be-tween vocal fold edema, diffuse laryngeal edema, poster-ior commissure hypertrophy and subjective or objectivevoice assessments. Our cohort included a majority of pa-tients with mild to moderate LPRD without severe signsof LPR (i.e., polypoid or/and severe vocal fold edemaand/or granulomas) that could also explain our results.Finally, it is important to consider that genetic differ-ences between individuals, particularly at the histologicaland biomolecular composition of the vocal folds, whichmay generate different local reactions to acid irritationcharacterized by various responses. Further histologicalstudies are interesting to explore tissue modifications inLPR disease to precise some mechanisms. The mainweakness of this study concerns the absence of acontrolled group just treated by diet and behavioral
changes. Indeed, to date, no study was interested to theimpact of the diet vs the impact of the PPI(s) in theresolution of the voice problems in LPRD. Finally, themultiple statistical testings of this study were performedwithout a Bonferoni correction that may lead to an over-stated significance.
ConclusionOur report highlights that changes in diet combinedwith pantoprazole twice daily neutralize the acidityresponsible for the inflammation of the upper aerodiges-tive tract leading to an improvement of laryngeal symp-toms, signs, perceptual voice disorders, and severalacoustic parameters measuring the short-term perturb-ation of the fundamental frequency and the intensity,especially in rough patients. Thus, our correlation analy-zis showed that the hoarseness (especially roughness) ofthe suspected LPR patients could be due to complexpathophysiological mechanisms and not simply to edemaof the vocal folds such as reported previously [25]. In anobvious way, the healing of the vocal folds reported insuspected LPR patients could influence the voice, so thatacoustic parameters would correlate with microscopicchanges not always described in the RFS scale. Thesefindings support the utilization of acoustic parameters(using an objective method to determine the most stabletime interval) in the follow-up of LPR patients withhoarseness and to better understand vocal disorder devel-opment. Further randomized controlled trials with largercohorts and objective acoustic methodological approachesare needed to confirm the role of each acoustic parameterin the follow-up of LPRD. Dryness and keratosis of thevocal folds could be systematically researched in ourlaryngological examination and also correlated to objectiveparameters.
AbbreviationsA: Asthenia; APQ: Amplitude perturbation quotient; B: Breathing; ENT: Earnose and throat; G: Grade; I: Instability; Jitt: Jitter percent;LPR: Laryngopharyngeal reflux; LPRD: Laryngopharyngeal reflux disease;NHR: Noise harmonic ratio; PPI: Proton pump inhibitors; PPQ: Pitchperturbation quotient; R: Roughness; RAP: Relative average perturbation;RFS: Reflux finding socre; RSI: Reflux symptom index; S: Strain; Shim: Shimmerpercent; vAm: Peak-to-peak amplitude variation; vF0: Fundamental frequencyvariation; VHI: Voice handicap index
AcknowledgementsAmerican Journal Expert for the proofreading of the article.
FundingThis research has been subsidized by the ARC N°AUWB-2012-12/17-UMONSconvention from Communauté Française de Belgique.
Availability of data and materialsThe data are available at the phonetics lab of University of Mons, Belgium.
Authors’ contributionsJRL: Acquisition of the data, redaction of the paper, analysis, interpretation ofdata for the work, accountability for all aspects of the work. SS: Chief of theENT department, reviewed and corrected the paper. Study design,
Lechien et al. Journal of Otolaryngology - Head and Neck Surgery (2016) 45:59 Page 7 of 9

interpretation of data, final approval, accountability for all aspects of thework. KH: Data analyzis, drafting, study design, interpretation of data for thework. AFF: study design and the recruitment of patients, drafting, dataanalyzis. MP: Provided to the correlation analyzis, data analyzis & studydesign. BH: Chief of the Voice department, reviewed and corrected thepaper. Interpretation of data, final analysis, Final approval, accountability forall aspects of the work. VD: Data analyzis, drafting, interpretation of data forthe work. MK: study design and the recruitment of patients, drafting, finalapproval. All authors read and approved the final manuscript.
Competing interestsThe authors declare that they have no competing interests.
Consent for publicationPatients have given their consent for the inclusion in the study.
Author details1Laboratory of Anatomy and Cell Biology, Faculty of Medicine, UMONSResearch Institute for Health Sciences and Technology, University of Mons(UMons), Avenue du Champ de mars, 6, B7000 Mons, Belgium. 2Laboratoryof Phonetics, Faculty of Psychology, Research Institute for Language Sciencesand Technology, University of Mons (UMons), Mons, Belgium. 3Departmentof Otorhinolaryngology and Head and Neck Surgery, RHMS Baudour,EpiCURA Hospital, Baudour, Belgium.
Received: 19 July 2016 Accepted: 26 October 2016
References1. Koufman JA, Aviv JE, Casiano RR, Shaw GY. Laryngopharyngeal reflux:
position statement of the committee on speech, voice, and swallowingdisorders of the American Academy of Otolaryngology-Head and NeckSurgery. Otolaryngol Head Neck Surg. 2002;127(1):32–5.
2. Rees LE, Pazmany L, Gutowska-Owsiak D, et al. The mucosal immuneresponse to laryngopharyngeal reflux. Am J Respir Crit Care Med. 2008;177(11):1187–93.
3. Sen P, Georgalas C, Bhattacharyya AK. A systematic review of the role ofproton pump inhibitors for symptoms of laryngopharyngeal reflux. ClinOtolaryngol. 2006;31(1):20–4.
4. Koufman JA. The otolaryngologic manifestations of gastroesophageal refluxdisease (GERD): a clinical investigation of 225 patients using ambulatory 24-hour pH monitoring and an experimental investigation of the role of acidand pepsin in the development of laryngeal injury. Laryngoscope. 1991;101(4 Pt 2 Suppl 53):1–78.
5. Lee YS, Choi SH, Son YI, Park YH, Kim SY, Nam SY. Prospective, observationalstudy using rabeprazole in 455 patients with laryngopharyngeal refluxdisease. Eur Arch Otorhinolaryngol. 2011;268(6):863–9.
6. Book DT, Rhee JS, Toohill RJ, Smith TL. Perspectives in laryngopharyngealreflux: an international survey. Laryngoscope. 2002;112(8 Pt 1):1399–406.
7. Koufman J, Sataloff RT, Toohill R. Laryngopharyngeal reflux: consensusconference report. J Voice. 1996;10(3):215–6.
8. Koufman JA. Laryngopharyngeal reflux is different from classicgastroesophageal reflux disease. Ear Nose Throat J. 2002;81(9 Suppl 2):7–9.
9. Katz PO. Ambulatory esophageal and hypopharyngeal pH monitoring inpatients with hoarseness. Am J Gastroenterol. 1990;85(1):38–40.
10. Koufman JA, Amin MR, Panetti M. Prevalence of reflux in 113 consecutivepatients with laryngeal and voice disorders. Otolaryngol Head Neck Surg.2000;123(4):385–8.
11. Ozturk O, Oz F, Karakullukcu B, Oghan F, Guclu E, Ada M. Hoarseness andlaryngopharyngeal reflux: a cause and effect relationship or coincidence?Eur Arch Otorhinolaryngol. 2006;263(10):935–9.
12. Toohill RJ, Kuhn JC. Role of refluxed acid in pathogenesis of laryngealdisorders. Am J Med. 1997;103(5A):100S–6S.
13. Pribuisiene R, Uloza V, Kupcinskas L, Jonaitis L. Perceptual and acousticcharacteristics of voice changes in reflux laryngitis patients. J Voice. 2006;20(1):128–36.
14. Yana M, Renard MC, Stroebel V. The place of speech therapy in thedysfunctional dysphonias with gastro-esophageal reflux. Rev Laryngol OtolRhinol (Bord). 2001;122(5):323–30.
15. Printza A, Kyrgidis A, Oikonomidou E, Triaridis S. Assessinglaryngopharyngeal reflux symptoms with the Reflux Symptom Index:
validation and prevalence in the Greek population. Otolaryngol Head NeckSurg. 2011;145(6):974–80.
16. Belafsky PC, Postma GN, Koufman JA. Validity and reliability of the refluxsymptom index (RSI). J Voice. 2002;16(2):274–7.
17. Hopkins C, Yousaf U, Pedersen M. Acid reflux treatment for hoarseness.Cochrane Database Syst Rev. 2006;25(1):CD005054.
18. Gregory ND, Chandran S, Lurie D, Sataloff RT. Voice disorders in the elderly.J Voice. 2012;26(2):254–8.
19. Shaw GY, Searl JP. Laryngeal manifestations of gastroesophageal reflux beforeand after treatment with omeprazole. South Med J. 1997;90(11):1115–22.
20. Jin BJ, Lee YS, Jeong SW, Jeong JH, Lee SH, Tae K. Change of acousticparameters before and after treatment in laryngopharyngeal reflux patients.Laryngoscope. 2008;118(5):938–41.
21. Ogut F, Ersin S, Engin EZ, et al. The effect of laparoscopic Nissenfundoplication on laryngeal findings and voice quality. Surg Endosc. 2007;21(4):549–54.
22. Hamdan AL, Sharara AI, Younes A, Fuleihan N. Effect of aggressive therapyon laryngeal symptoms and voice characteristics in patients withgastroesophageal reflux. Acta Otolaryngol. 2001;121(7):868–72.
23. Selby JC, Gilbert HR, Lerman JW. Perceptual and acoustic evaluation ofindividuals with laryngopharyngeal reflux pre- and post-treatment. J Voice.2003;17(4):557–70.
24. Garcia I, Krishna P, Rosen CA. Severe laryngeal hyperkeratosis secondarytolaryngopharyngeal reflux. Ear Nose Throat J. 2006;85(7):417.
25. Lechien JR, Finck C, Costa de Araujo P, Huet K, Delvaux V, Piccaluga M,Harmegnies B, Saussez S. Voice outcomes of laryngopharyngeal refluxtreatment: a systematic review of 1483 patients. Eur Arch Otorhinolaryngol.2016; 23. [Epub ahead of print]
26. Belafsky PC, Postma GN, Koufman JA. The validity and reliability of the refluxfinding score (RFS). Laryngoscope. 2001;111(8):1313–7.
27. Park KH, Choi SM, Kwon SU, Yoon SW, Kim SU. Diagnosis oflaryngopharyngeal reflux among globus patients. Otolaryngol Head NeckSurg. 2006;134(1):81–5.
28. Chun BJ, Lee DS. The effect of itopride combined with lansoprazole inpatients with laryngopharyngeal reflux disease. Eur Arch Otorhinolaryngol.2013;270(4):1385–90.
29. Masaany M, Marina MB, Sharifa Ezat WP, Sani A. Empirical treatment withpantoprazole as a diagnostic tool for symptomatic adult laryngopharyngealreflux. J Laryngol Otol. 2011;125(5):502–8.
30. Naiboglu B, Durmus R, Tek A, Toros SZ, Egeli E. Do the laryngopharyngealsymptoms and signs ameliorate by empiric treatment in patients withsuspected laryngopharyngeal reflux? Auris Nasus Larynx. 2011;38(5):622–7.
31. Lechien JR, Khalife M, Delvaux V, Huet K, Piccaluga M, Costa de AraujoP, Harmegnies B, Saussez S. Pathophysiology, assessment and treatmentof laryngopharyngeal reflux. Rev Laryngol Otol Rhinol (Bord). 2014;135(4-5):163–70.
32. Sataloff RT, Hawkshaw MJ, Gupta R. Laryngopharyngeal reflux and voicedisorders: an overview on disease mechanisms, treatments, and researchadvances. Discov Med. 2010;10(52):213–24.
33. Smit CF, Tan J, Devriese PP, Mathus-Vliegen LM, Brandsen M,Schouwenburg PF. Ambulatory pH measurements at the upper esophagealsphincter. Laryngoscope. 1998;108(2):299–302.
34. Vincent Jr DA, Garrett JD, Radionoff SL, Reussner LA, Stasney CR. Theproximal probe in esophageal pH monitoring: development of a normativedatabase. J Voice. 2000;14(2):247–54.
35. Sereg-Bahar M, Jerin A, Jansa R, Stabuc B, Hocevar-Boltezar I. Pepsin andbile acids in saliva in patients with laryngopharyngeal reflux - a prospectivecomparative study. Clin Otolaryngol. 2015;40(3):234–9.
36. Siupsinskiene N, Adamonis K, Toohill RJ. Quality of life in laryngopharyngealreflux patients. Laryngoscope. 2007;117(3):480–4.
37. Ross JA, Noordzji JP, Woo P. Voice disorders in patients with suspectedlaryngo-pharyngeal reflux disease. J Voice. 1998;12(1):84–8.
38. Vashani K, Murugesh M, Hattiangadi G, et al. Effectiveness of voice therapyin reflux-related voice disorders. Dis Esophagus. 2010;23(1):27–32.
39. Park JO, Shim MR, Hwang YS, et al. Combination of voice therapy andantireflux therapy rapidly recovers voice-related symptoms inlaryngopharyngeal reflux patients. Otolaryngol Head Neck Surg. 2012;146(1):92–7.
40. Lechien JR, Delvaux V, Huet K, Khalife M, Fourneau AF, Piccaluga M,Harmegnies B, Saussez S. Phonetic Approaches of Laryngopharyngeal RefluxDisease: A Prospective Study. J Voice; 2016. doi: 10.1016/j.jvoice.2016.02.020.
Lechien et al. Journal of Otolaryngology - Head and Neck Surgery (2016) 45:59 Page 8 of 9
41. Maryn Y, Roy N, De Bodt M, Van Cauwenberge P, Corthals P. Acousticmeasurement of overall voice quality: a meta-analysis. J Acoust Soc Am.2009;126(5):2619–34.
42. Vardar R, Varis A, Bayrakci B, Akyildiz S, Kirazli T, Bor S. Relationship betweenhistory, laryngoscopy and esophagogastroduodenoscopy for diagnosis oflaryngopharyngeal reflux in patients with typical GERD. Eur ArchOtorhinolaryngol. 2012;269(1):187–91.
43. Vaz Freitas S, Melo Pestana P, Almeida V, Ferreira A. Integrating voiceevaluation: correlation between acoustic and audio-perceptual measures.J Voice. 2015;29(3):390. e1-7.
44. Schoentgen J, Fraj S, Lucero JC. Testing the reliability of Grade, Roughnessand Breathiness scores by means of synthetic speech stimuli. LogopedPhoniatr Vocol. 2015;40(1):5–13.
45. Mamede RC, De Mello-Filho FV, Vigário LC, Dantas RO. Effect ofgastroesophageal reflux on hypertrophy of the base of the tongue.Otolaryngol Head Neck Surg. 2000;122(4):607–10.
46. Corvo MA, Eckley CA, Rizzo LV, Sardinha LR, Rodriguez TN, Bussoloti FI.Salivary transforming growth factor alpha in patients with Sjögren'ssyndrome and reflux laryngitis. Braz J Otorhinolaryngol. 2014;80(6):462–9.
• We accept pre-submission inquiries
• Our selector tool helps you to find the most relevant journal
• We provide round the clock customer support
• Convenient online submission
• Thorough peer review
• Inclusion in PubMed and all major indexing services
• Maximum visibility for your research
Submit your manuscript atwww.biomedcentral.com/submit
Submit your next manuscript to BioMed Central and we will help you at every step:
Lechien et al. Journal of Otolaryngology - Head and Neck Surgery (2016) 45:59 Page 9 of 9