impact of intraseasonal variations to the spatial distribution_rev28feb
TRANSCRIPT

Impact of Intraseasonal Variations to the Spatial Distribution of Coastal Heavy Rainbands Intensity During HARIMAU IOP 2011 in the West Sumatera Ardhi Adhary Arbain, Yekti Galihselowati Agency for the Assessment and Application of Technology (BPPT), Indonesia
Shuichi Mori Japan Agency for Marine-earth Science and Technology (JAMSTEC), Japan
Workshop on MCCOE Radar Meteorology/Climatology in Indonesia Jakarta, February 28, 2013

OUTLINE Background The Characteristic of Indonesian Maritime Continent
Coastal Heavy Rainbands (CHeRs) Overview and Previous Studies
Motivations and Objectives Datasets Results
Regional Variability (Satellite) Local Variability (Radar)
Summary and Discussion Conclusion

BACKGROUND
TRMM Website
Diurnal Variation
Warm Water Warm Water
Air-Sea Interaction
Pacific Ocean Maritime Continent
Air-Sea Interaction “mini El Niño” Air-Land-Sea Interaction
Diurnal Cycle
Latent heating Latent heating Solar heating
Rainfall “Sprinkler”
Annual Rainfall (TRMM 3B43), 1998-2011
Intraseasonal Variations (MJO, Kelvin Wave, Equatorial Rossby Wave etc.)
Indonesian Maritime Continent (IMC) : The longest coastlines The most active convective clouds Affected by Diurnal, Intraseasonal,
Seasonal and Interannual variations The largest rainfall
What is the characteristic of Indonesian Maritime Continent (IMC) ?
(Mori et al., 2004)
Convection/circulation anomalies in the tropics can influence all over the world !
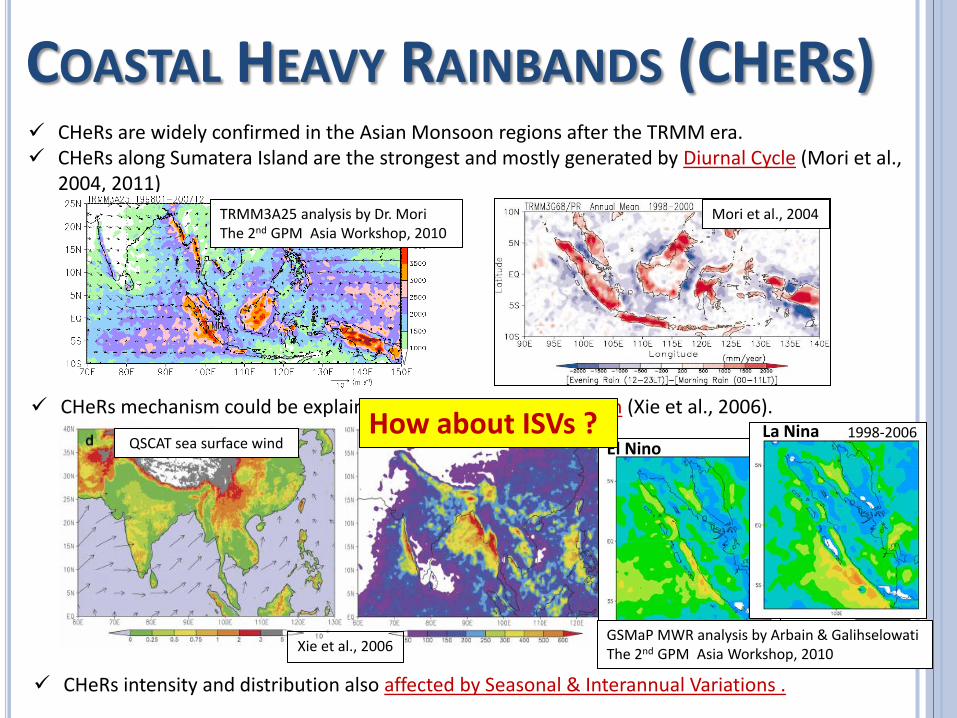
COASTAL HEAVY RAINBANDS (CHERS) CHeRs are widely confirmed in the Asian Monsoon regions after the TRMM era. CHeRs along Sumatera Island are the strongest and mostly generated by Diurnal Cycle (Mori et al.,
2004, 2011) Mori et al., 2004 TRMM3A25 analysis by Dr. Mori
The 2nd GPM Asia Workshop, 2010
CHeRs mechanism could be explained by wind-terrain interaction (Xie et al., 2006).
Xie et al., 2006
CHeRs intensity and distribution also affected by Seasonal & Interannual Variations .
QSCAT sea surface wind La Nina
El Nino
GSMaP MWR analysis by Arbain & Galihselowati The 2nd GPM Asia Workshop, 2010
1998-2006 How about ISVs ?
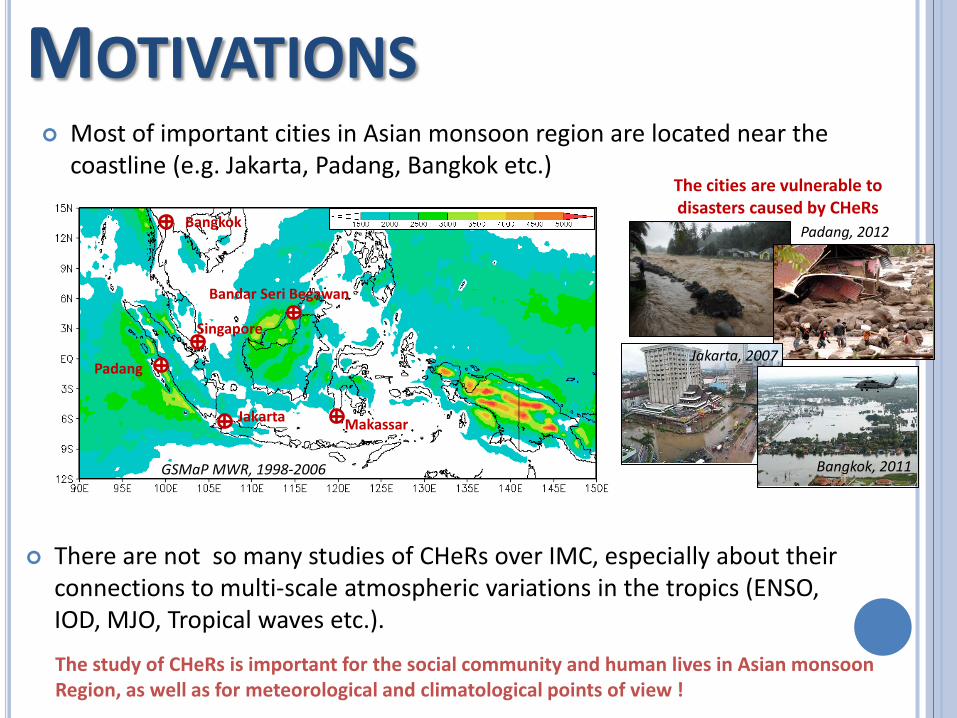
MOTIVATIONS Most of important cities in Asian monsoon region are located near the
coastline (e.g. Jakarta, Padang, Bangkok etc.)
There are not so many studies of CHeRs over IMC, especially about their connections to multi-scale atmospheric variations in the tropics (ENSO, IOD, MJO, Tropical waves etc.).
Jakarta
Padang
Bandar Seri Begawan
Singapore
Bangkok
Makassar
The cities are vulnerable to disasters caused by CHeRs
Padang, 2012
Jakarta, 2007
Bangkok, 2011 GSMaP MWR, 1998-2006
The study of CHeRs is important for the social community and human lives in Asian monsoon Region, as well as for meteorological and climatological points of view !

OBJECTIVES To understand the dynamics and diurnal variability of CHeRs related to
Intraseasonal Variations (ISVs) in the Sumatera Region, especially over Padang and surrounding area, during HARIMAU IOP (Intensive Observation Period) 2011.
+ + MIA
PUTUS
SIPORA
SUMATERA ISLAND
MIA - XDR
MPR
RAWINSONDE
HARIMAU IOP 2011 West Sumatera, December 1 – 31, 2011
AWS
Hydrometeorological ARray for Intraseasonal variation Monsoon AUto-monitoring (HARIMAU)
TABING

DATASETS 1. REGIONAL SCALE DATA Hourly Global Rainfall Map in Near-Real-Time (GSMaP NRT) products,
with 0.1° x 0.1° spatial resolution (November 2011 – January 2012), provided by JAXA, Japan
NCEP Reanalysis Ver.1 daily wind datasets, T62 Gaussian grid (November 2011 – January 2012), provided by NOAA, USA.
Wheeler and Hendon Real-time Multivariate MJO Index (October – December 2011), provided by BOM, Australia.
2. LOCAL SCALE DATA Padang X-band Doppler Radar (MIA-XDR) datasets, with 500m x 500m
spatial resolution, 10-minutes updated (November 2011 – January 2012)
Rawinsonde and other in-situ observations (AWS, ARG etc.) in the period of November 2011 – January 2012

RESULTS
1. REGIONAL VARIABILITY (GSMaP) 2. LOCAL VARIABILITY (Radar)
Data sets :
GSMaP NRT, 0.1° x 0.1° res, hourly NCEP Reanalysis Ver.1 Surface Wind, daily

ISVS DURING HARIMAU IOP 2011 (GSMAP NRT, 5N-5S AVERAGE, 30 NOV 2011 – 1 JAN 2012)
MJO
1 M
JO 2
BREAK PHASE
HARI
MAU
IOP
2011
MIA-XDR
MJO1 December 1st – 10th 2011 BREAK PHASE December 11th – 19th 2011 MJO2 December 20th – 31st 2011
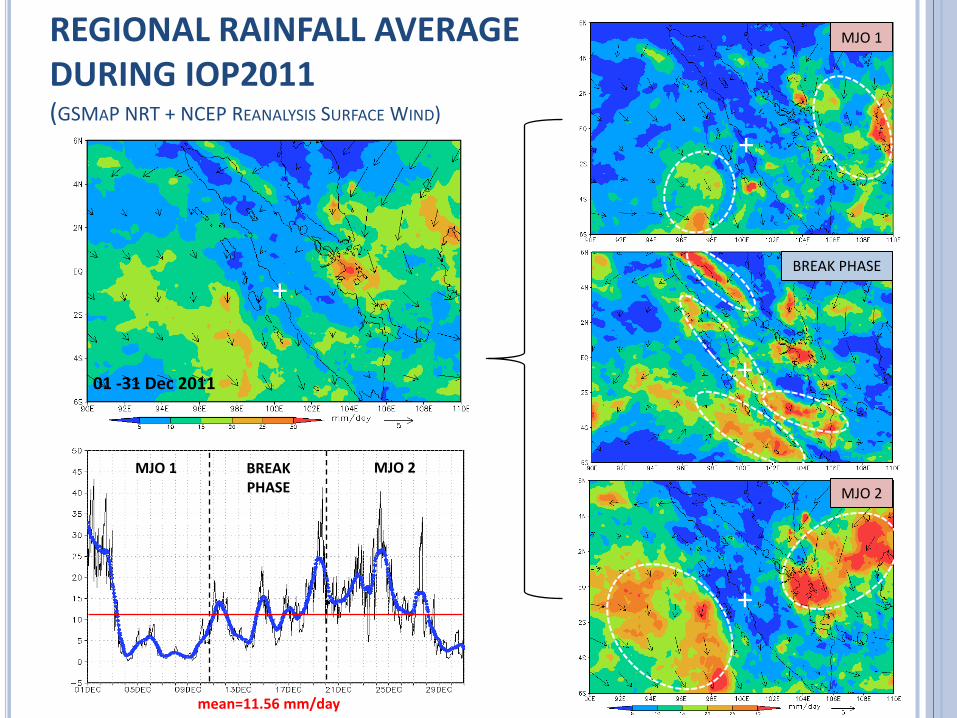
REGIONAL RAINFALL AVERAGE DURING IOP2011 (GSMAP NRT + NCEP REANALYSIS SURFACE WIND)
MJO 1
BREAK PHASE
MJO 2
01 -31 Dec 2011
MJO 1 BREAK PHASE
MJO 2
mean=11.56 mm/day
+
+
+
+

MJO 1
BREAK PHASE
MJO 2
[Evening Rain (12-23LT) – Morning Rain (00-11LT)]
Morning Maxima
Evening Maxima
REGIONAL DIURNAL SIGNAL DURING IOP2011 (GSMAP NRT )
01 -31 Dec 2011
+
+
+
+
RESULTS
1. REGIONAL VARIABILITY (GSMaP) 2. LOCAL VARIABILITY (Radar)
Data sets :
X-band Doppler Radar, 500m x 500m res, 10 minutes Rawinsonde and Insitu observations (AWS, ARG etc.), 1 minutes

ECHO EVOLUTION AND DISTRIBUTION (DECEMBER 1 – 31, 2011)
MIA- XDR, CAPPI 2km
Sumatera Island Sumatera Island Sumatera Island Sumatera Island
Sumatera Island Sumatera Island Sumatera Island Sumatera Island

DIURNAL AND PERIODIC VARIATION
MIA-XDR AREA AVERAGE OF REFLECTIVITY (DECEMBER 1 – 31, 2011)
LAND SEA
SUMATERA ISLAND
+
SEA REGION LAND REGION
MJO 1 MJO 1 MJO 2 MJO 2 BREAK PHASE BREAK PHASE

DIURNAL VARIATION AND PROPAGATION
MJO 1
MJO 2 BREAK PHASE
LAND SEA LAND SEA LAND SEA LAND SEA
LAND SEA
SUMATERA ISLAND
+

AVERAGED DIURNAL VARIATION AND PROPAGATION
MJO 1 MJO 2 BREAK PHASE
MJO 1 BREAK PHASE MJO 2
LAND SEA LAND SEA LAND SEA
MO
RNIN
G EVEN
ING
MO
RNIN
G EVEN
ING
MO
RNIN
G EVEN
ING
Strong W Moderate NW
Weak SW, S
Moderate W, SW
Strong W, NW
Weak SW, S

SUMMARY AND DISCUSSIONS MJO Periods Break Phase
Rainfall Distribution Mostly occurred over the sea region than over the island
More prominent over the coastal and inland region
Diurnal Variation
Maximum signal over the sea region
Maximum signal near the coastline
Diurnal cycle near the coastline is suppressed
Diurnal cycle near the coastline is prominent
MJO 1 BREAK PHASE MJO 2

SUMMARY AND DISCUSSIONS Did tropical waves with shorter period than MJO also played important
role to the dynamics of DC during IOP 2011 ?
Tropical waves during IOP2011 :
MJO 1
MJO 2
BREAK PHASE
MJO, Kelvin Wave
Eq. Rossby Wave
MJO, Kelvin, Eq. Rossby Wave
Tropical wave analysis by Carl Schreck NOAA's National Climatic Data Center

THANK YOU FOR YOUR ATTENTION
ご清聴ありがとう

SUPPLEMENTAL RESULTS
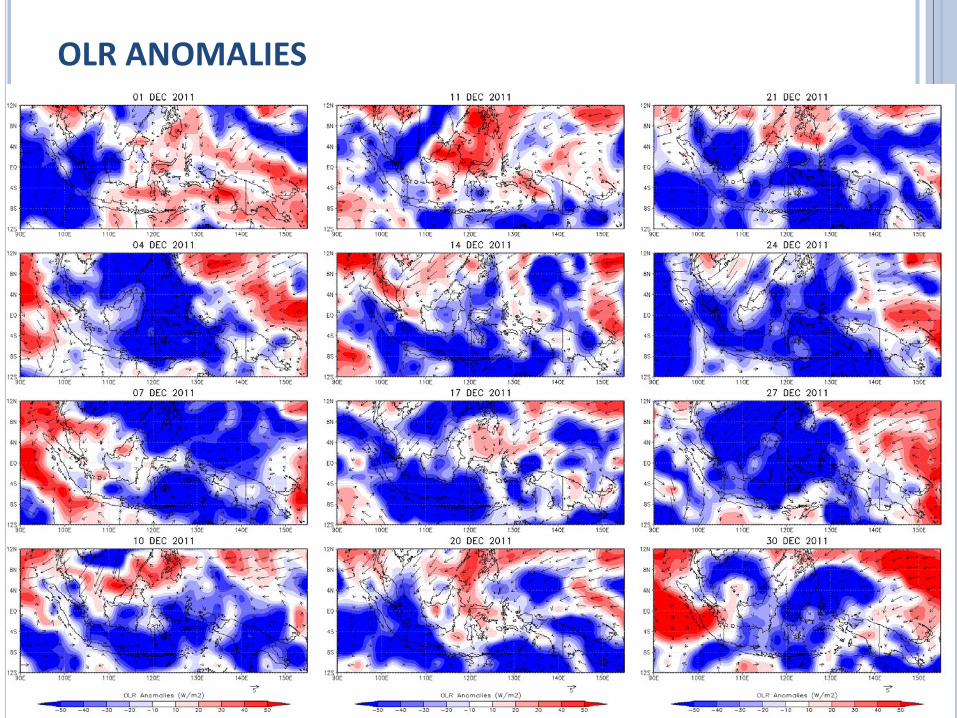
OLR ANOMALIES

Near surface wind variations with the MJO passages (by Dr. Hamada)
MJO 1 WEAK MJO MJO 2

ECHO DISTRIBUTION AND EVOLUTION (XDR, 1 – 31 DEC 2011)

ECHO DISTRIBUTION AND EVOLUTION (XDR, MJO 1, 1 – 10 DEC 2011)
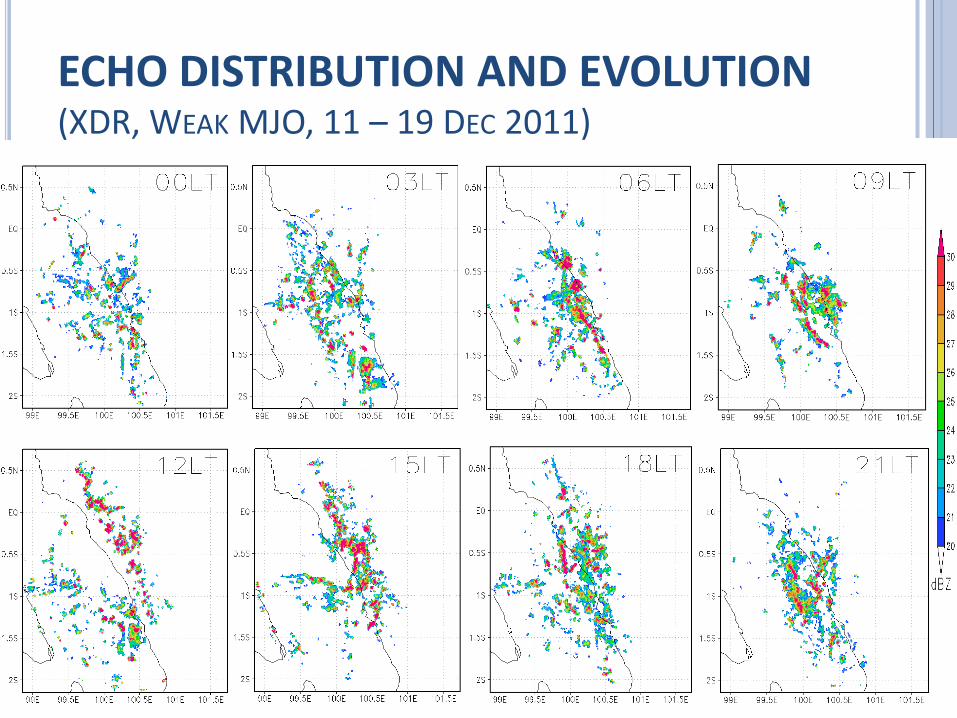
ECHO DISTRIBUTION AND EVOLUTION (XDR, WEAK MJO, 11 – 19 DEC 2011)

ECHO DISTRIBUTION AND EVOLUTION (XDR, MJO 2, 20 – 31 DEC 2011)

DIURNAL CYCLE OF RAINFALL (MIA-XDR, 30MIN-RUNNING MEAN OF AREA RAINFALL AVERAGE, SEA REGION)
MJO 1 [01-10 DEC]
MJO 2 [20-31DEC] Weak MJO [11-19DEC]
All Period [01-31DEC]

DIURNAL CYCLE OF RAINFALL (MIA-XDR, 30MIN-RUNNING MEAN OF AREA RAINFALL AVERAGE, LAND REGION)
MJO 1 [01-10DEC]
MJO 2 [20-31DEC] Weak MJO [11-19DEC]
All Period [01-31DEC]
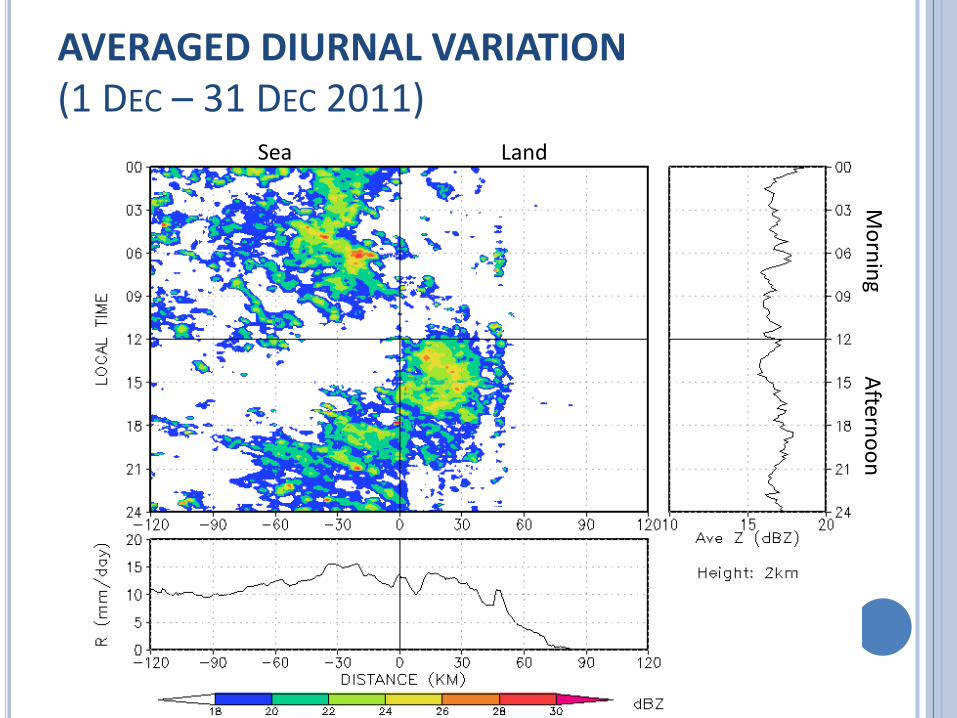
AVERAGED DIURNAL VARIATION (1 DEC – 31 DEC 2011)
Sea
Morning
Land
Afternoon

AVERAGED DIURNAL VARIATION (MJO 1, 1 – 10 DEC 2011)
Sea
Morning
Land
Afternoon
DC is supressed By MJO ?
Maximum rainfall over coastline
Maximum rainfall in the morning

AVERAGED DIURNAL VARIATION (WEAK MJO, 11 DEC – 19 DEC 2011)
Sea
Morning
Land
Afternoon
DC is prominent
Maximum rainfall offshore
Maximum rainfall at midnight

AVERAGED DIURNAL VARIATION (MJO 2, 20 DEC – 31 DEC 2011)
Sea
Morning
Land
Afternoon DC is supressed By MJO ?
Eastward PPD in the late evening ?
Orographic rain In the afternoon ?
Maximum rainfall near mountains
Maximum rainfall in the late evening

VERTICAL PROFILE OF REFLECTIVITY (MJO 1, 1 – 10 DEC 2011)

VERTICAL PROFILE OF REFLECTIVITY (WEAK MJO, 11 – 19 DEC 2011)

VERTICAL PROFILE OF REFLECTIVITY (MJO 2, 20 – 31 DEC 2011)

VERTICAL PROFILE OF REFLECTIVITY (MJO 1, 1 – 10 DEC 2011)

VERTICAL PROFILE OF REFLECTIVITY (MJO 1, 1 – 10 DEC 2011)

VERTICAL PROFILE OF REFLECTIVITY (WEAK MJO, 11 – 19 DEC 2011)
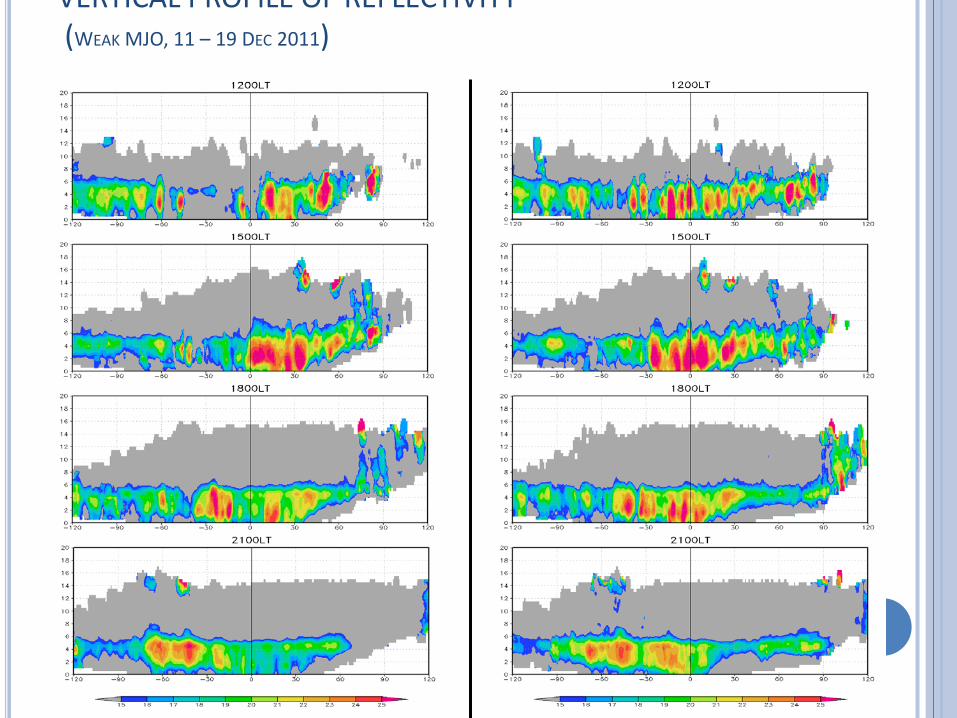
VERTICAL PROFILE OF REFLECTIVITY (WEAK MJO, 11 – 19 DEC 2011)

VERTICAL PROFILE OF REFLECTIVITY (MJO 2, 20 – 31 DEC 2011)

VERTICAL PROFILE OF REFLECTIVITY (MJO 2, 20 – 31 DEC 2011)

WH MJO INDEX (1 OCT – 31 DEC 2011)
22 21_ RMMRMMAmplitudeMJO +=
Amplitude ≥ 1 Strong MJO Period Amplitude < 1 Weak MJO Period
Active MJO (Phase 4) during IOP 2011 : 1 – 5 Dec & 20 – 24 Dec (10 days)
Weak MJO during IOP 2011 : 11 – 19 Dec (9 days)
Wheeler and Hendon, 2004 CAWCR/Bureau of Meteorology
Inactive MJO (Phase 5) during IOP 2011 : 6 – 10 Dec & 25 – 31 Dec (12 days)
Active (In Phase) Inactive (Out of Phase)
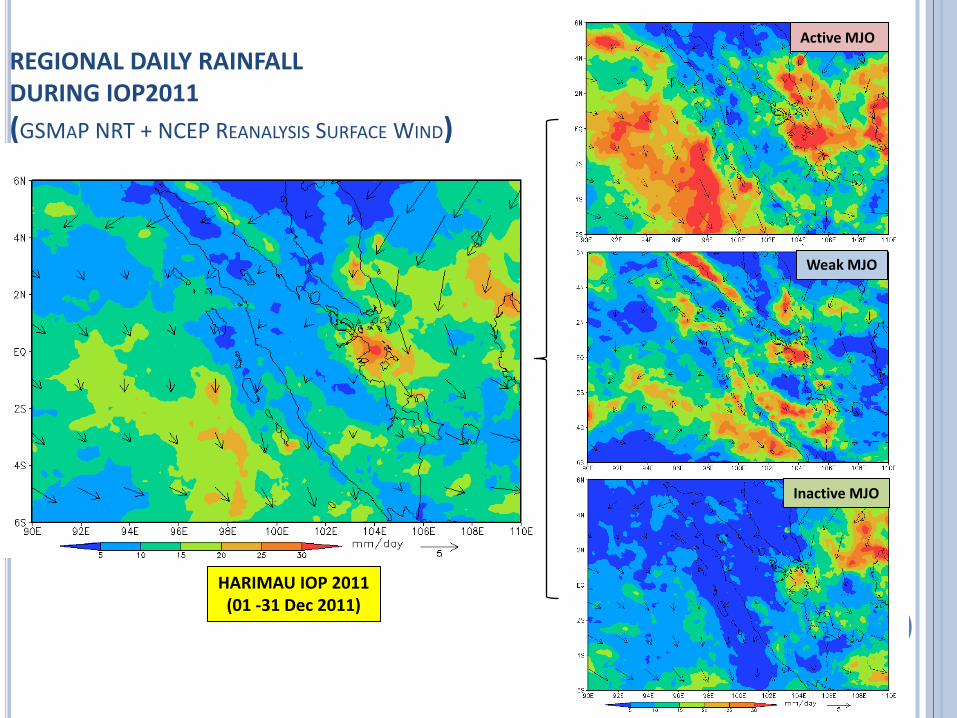
REGIONAL DAILY RAINFALL DURING IOP2011 (GSMAP NRT + NCEP REANALYSIS SURFACE WIND)
Active MJO
Weak MJO
Inactive MJO
HARIMAU IOP 2011 (01 -31 Dec 2011)

REGIONAL AREA AVERAGE OF DAILY RAINFALL DURING IOP2011 (GSMAP NRT + NCEP REANALYSIS SURFACE WIND)
ACT
Weak MJO
Inactive MJO
HARIMAU IOP 2011 (01 -31 Dec 2011)
mm
/day
mean=11.56 mm/day
Active MJO
WEAK INACT ACT INACT

REGIONAL DIURNAL SIGNAL DURING IOP2011 (GSMAP NRT)
HARIMAU IOP 2011 (01 -31 Dec 2011)
[Evening Rain (12-23LT) – Morning Rain (00-11LT)]
Morning Maxima
Afternoon Maxima
Weak MJO
Inactive MJO
Active MJO

REGIONAL DAILY RAINFALL STANDARD DEVIATION DURING IOP2011 (GSMAP NRT + NCEP REANALYSIS SURFACE WIND)
Active MJO , 01-10 Dec
Weak MJO, 11-19 Dec
Active MJO, 20-31 Dec
HARIMAU IOP 2011 (01 -31 Dec 2011)

ECHO COVERAGE (NO DBZ THRESHOLD)
LAND
SEA
MJO 1 Weak MJO 2

REFLECTIVITY AVERAGE (NO DBZ THRESHOLD)
LAND
SEA
MJO 1 Weak MJO 2

REFLECTIVITY AVERAGE (1 DEC – 10 DEC)

REFLECTIVITY AVERAGE (11 DEC – 20 DEC)

REFLECTIVITY AVERAGE (21 DEC – 30 DEC)

Wind Rose Plot of Muara Putus Station 1 – 31 December 2011

Wind Rose Plot of Tabing Station 1 – 31 December 2011

WIND ROSE PLOT MUARA PUTUS STATION 1 – 31 Dec 2011, 06 – 17 LT (Daytime)

WIND ROSE PLOT MUARA PUTUS STATION 1 – 31 Dec 2011, 18 – 05 LT (Nighttime)

WIND ROSE PLOT TABING STATION 1 – 31 Dec 2011, 06 – 17 LT (Daytime)

WIND ROSE PLOT TABING STATION 1 – 31 Dec 2011, 18 – 05 LT (Nighttime)

Windrose Plot of Tabing Station
27 Nov – 2 Dec 3 Dec – 10 Dec

Windrose Plot of Tabing Station
11 Dec – 26 Dec 27 Dec – 30 Dec