temporal and spatial variations of rainfall erosivity of...
TRANSCRIPT

Temporal and spatial variations of rainfall erosivity of Lianshui basin in red soil region, South China
School of Water Resources and Ecological Engineering, Nanchang Institute of Technology, No.289, Tianxiang Road, Nanchang 330099, PR China
Belgrade, Serbia
2016.8.24
YANG Wenli
3RD WASWAC 2016

Outline
• Introduction
• Materials and methods
• Results and analysis
• Discussion and conclusion
3RD WASWAC 2016

1.Introduction
• Characteristics of the red soil region
• A significant decreasing trend was observed on annual sediment load ,while the runoff from Ganjiang river maintained steady.
• R-factor analysis will help to understand the process of soil erosion within the watershed.
• The distribution of rainfall and R within the year were analyzed based on the monthly rainfall data and the temporal and spatial trends of R value were studied
3RD WASWAC 2016

2. Materials and methods

2.1Study area: Lianshui basin
Location :
• It is located in the upstream of Ganjiang River, northeast of Xingguo County, Jiangxi Province, china , is a tributary of Ganjiang River ,basin area 579 km2.
• The outlet is located in the southwestern tip of Dongcun hydrology station.
3RD WASWAC 2016
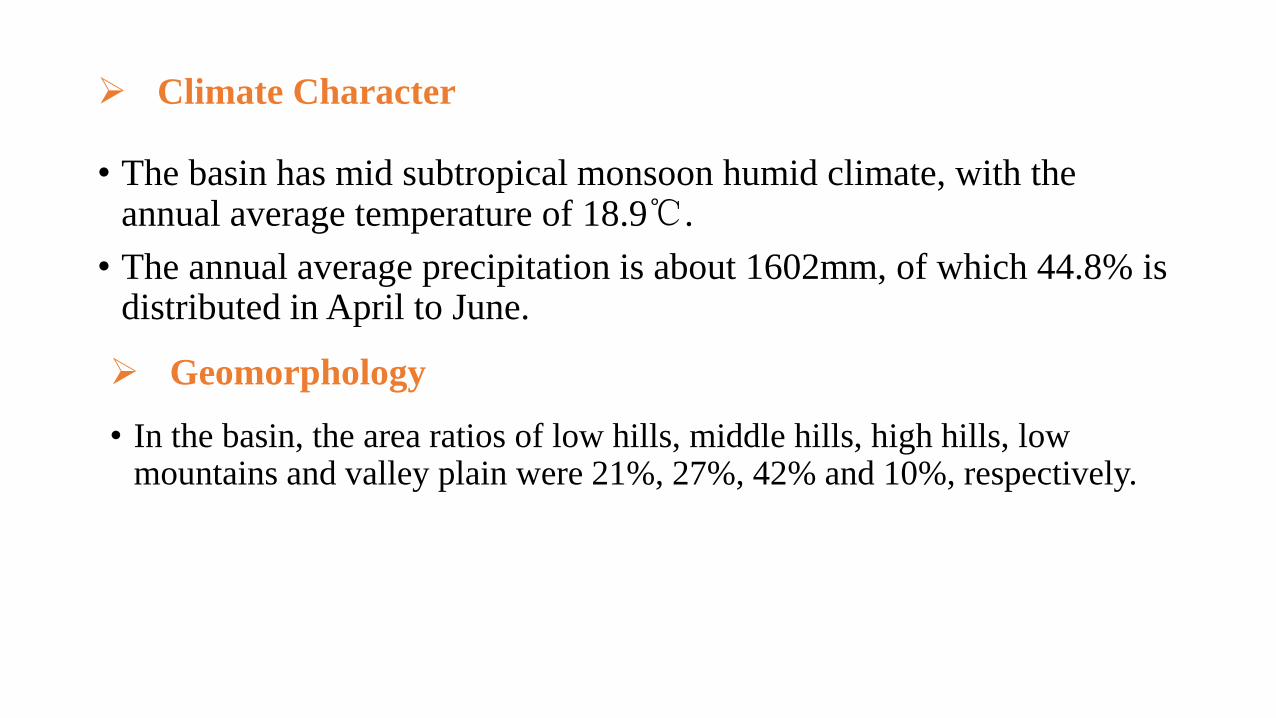
Climate Character
• The basin has mid subtropical monsoon humid climate, with the annual average temperature of 18.9℃.
• The annual average precipitation is about 1602mm, of which 44.8% is distributed in April to June.
Geomorphology
• In the basin, the area ratios of low hills, middle hills, high hills, low mountains and valley plain were 21%, 27%, 42% and 10%, respectively.

• The main vegetation types are evergreen broad leaved forest and coniferous forest.
Vegetation
• The soil types are mainly paddy soil and brown red soil, with red soil and limestone soil distributed in some regions.
Soil
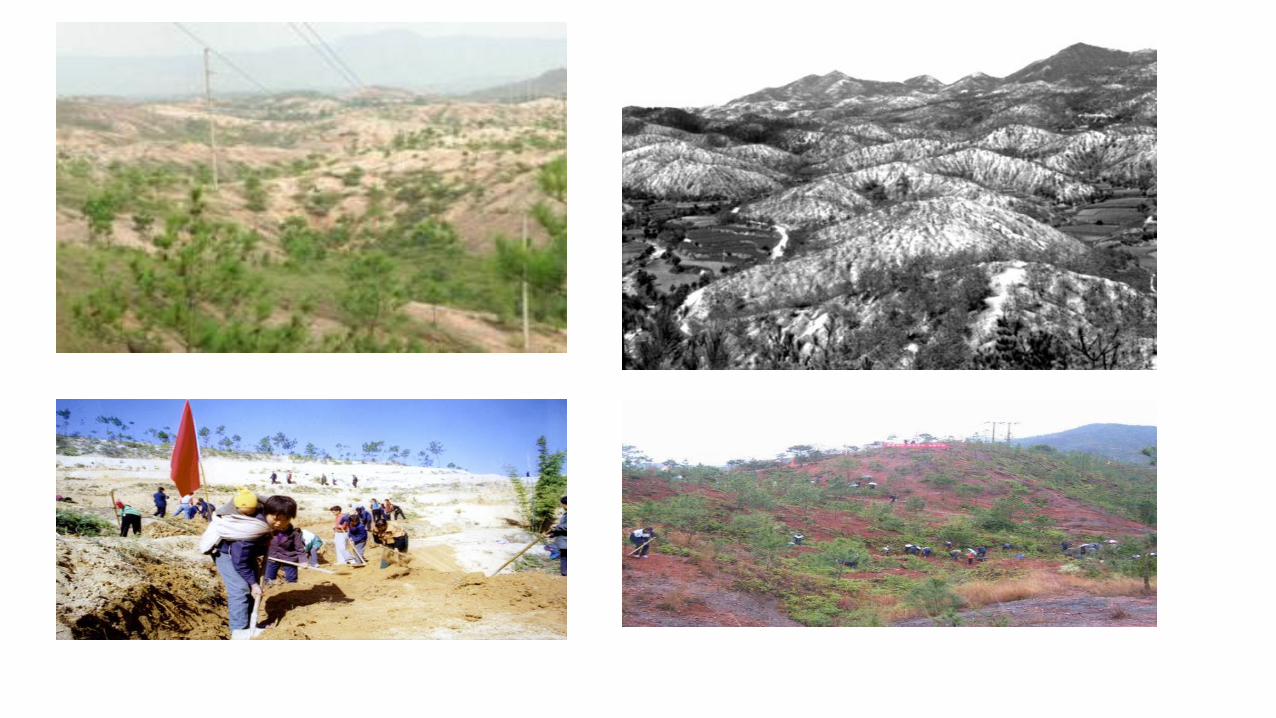
• It is one of the first batch of comprehensive management of small watershed in south China.
• From 1983 to 2015, large-scale management in small basin was conducted .
• To date, the water and soil loss situation has been significantly controlled in Lianshui basin.
Soil and water conservation


2.2 Rainfall data
Tab. 1 The rainfall data of 4 precipitation stations in Lianshui basin (mm)
Rainfall station Jan. Feb. Mar. Apr. May Jun. Jul. Aug. Sep. Oct. Nov. Dec.
Dongcun 65.70 85.63 138.97 177.47 237.32 285.36 142.76 168.69 83.65 79.41 70.13 37.83
Gulonggang 62.91 83.11 146.33 184.60 226.18 288.33 143.53 140.11 61.44 75.83 73.84 40.93
Xingjiang 56.50 73.58 145.27 175.81 234.21 265.52 136.77 111.80 55.06 74.72 70.83 34.51
Xinglian 60.61 88.25 137.99 194.31 223.71 324.23 145.37 138.51 82.01 73.06 67.23 38.21
This study is based on ten years (from 2000 to 2009) monthly rainfall data from four
precipitation stations of Lianshui basin (Table 1).

2.3 Calculation of R-factor
12
1i
1.6295
iyear 0.0125PR
where Ryear is the annual R (MJ·mm·(hm2·h·a)-1), Pi represents the
average monthly rainfall from January to December (mm).

2.4 Coefficient of variation(Cv)
• where Ri is the annual R (MJ·mm·(hm2·h·a)-1), represents the mean annual R

2.5 Trend coefficients
where the ix is the R value of the i year; x is the mean value of the
sample; t is the mean value of the natural sequence; n is the length of the
R value sequence, which is the number of time series; xtr is the trend
coefficient.

3. Results and analysis

3.1Distribution characteristics of R
0
50
100
150
200
250
300
350
0
200
400
600
800
1000
1200
1400
1600
1800
2000
1 2 3 4 5 6 7 8 9 10 11 12
Rai
nfa
ll(m
m)
Rai
nfa
ll er
osi
vit
y
MJ·
mm
/(h
m2·h
·a)
Month
Rainfall erosivity Rainfall

0
500
1000
1500
2000
2500
0
2000
4000
6000
8000
10000
12000
2000 2001 2002 2003 2004 2005 2006 2007 2008 2009
Rai
nfa
ll(m
m)
Rai
nfa
ll E
rosi
vit
y
MJ·
mm
/(h
m2·h
·a)
Year
Rainfall erosivity Rainfall
3.2 Inter-annual distribution characteristics of R

0
2000
4000
6000
8000
10000
12000
14000
2000 2001 2002 2003 2004 2005 2006 2007 2008 2009
Ra
infa
ll e
rosi
vity
MJ·
mm
/(hm
2·h
·a)
Year
Dongcun
Gulonggang
Xinglian
Xingjiang

StationName
Annual R [MJ·mm·(hm2·h·a)-1]
CV r
Mean Max (2002) Min (2003)
Dongcun 5600.46 9029.72 2857.08 0.32 -0.0002
Gulonggang 5439.43 10610.87 2422.93 0.41 -0.2580
Xingjiang 5087.95 10377.07 2364.39 0.47 -0.3392
Xinglian 5831.41 12184.14 1904.12 0.48 -0.0218
Mean value 5489.81 10550.45 2353.61 0.42 -0.1548
Descriptive statistics of annual R-factor at the sites in Lianshui basin

3.3 Spatial variation characteristics of R value
Fig.5 Spatial distribution of rainfall contour Fig.6 Spatial distribution of R contour

4.Discussion and conclusion
• The distribution of rainfall and R was consistent, shown as a single peak, and R value was mainly concentrated in April to June, accounting for about 56.8% of the entire year. R value peaked in June, accounting for about 24.78% of the annual R value.
• There was no significant difference among the R values across stations.
• It showed that R values increased from the northeast to the southwest of the basin
• the R value was generally decreased(2000-2009)

Thank you for your attention !
Yang wen li
School of Water Resources and Ecological Engineering
Nanchang Institute of Technology
E-mail:[email protected]
Website:http://www.swcc.online

Red soil region
• The red soil region is located in the tropical and subtropical zones south of the Yangtze river valley ,covers a total area of 1.18 million square kilometers, about 12.3% of total land territory of china.
• The main types of soil erosion in this region are water erosion and erosion caused by human activities .
• annual precipitation is very high ,which is 1.9-2.8 times higher than the national mean value, furthermore ,70% of that precipitation occurs as rain storms from April to September
• The rainfall erosion force in this region is three times higher than that in any other regions of china .

Observed streamflow and sediment discharge during 1956-2009 in the Gangjiang river basin
Streamflow Sediment discharge

• The calculation of R value can be divided into two categories, the classical method based on EI30 and the simple calculation model
• In Lianshui basin, Tiangang et al. compared plenty of models, i.e. the monthly rainfall model of Zhou (Zhou et al. 1995), the daily rainfall model of Zhang (Zhang et al. 2002), the monthly rainfall model of Wu (Wu et al. 1994), modified daily rainfall model of Shi (Shi et al. 2006), the monthly rainfall model of (Wischmeier W H, Smith D D 1958) and CREAMS model (Knisel W G. CREAMS 1980), showing that the monthly rainfall model of Wu had a higher effective coefficient and a lower relative deviation and therefore was relatively ideal (Tian et al. 2010).
• In this study, monthly rainfall model of Wu was thus used to calculate the rainfall erosion force.