impact of intra-european trade agreements, … we appreciate cathy song’s help in establishing the...
TRANSCRIPT

WP/07/126
Impact of Intra-European Trade Agreements, 1990–2005: Policy Implications for
the Western Balkans and Ukraine
Johannes Herderschee and Zhaogang Qiao


© 2007 International Monetary Fund WP/07/126
IMF Working Paper
__European Department
Impact of Intra-European Trade Agreements, 1990-2005: Policy Implications for the Western Balkans and Ukraine
Prepared by Johannes Herderschee and Zhaogang Qiao1
Authorized for distribution by Emmanuel van der Mensbrugghe
May 2007
Abstract
This Working Paper should not be reported as representing the views of the IMF. The views expressed in this Working Paper are those of the author(s) and do not necessarily represent those of the IMF or IMF policy. Working Papers describe research in progress by the author(s) and are published to elicit comments and to further debate.
The paper provides quantitative estimates of the impact of the European trade agreements on trade flows. It applies both static and dynamic panel estimation techniques. The results are useful to policymakers because new intra-European trade agreements are being negotiated. In the absence of a further expansion of the European Union, estimates of alternative policies may help to clarify the policy debate. The paper also illustrates that the performance of individual countries under the trade agreements can be explained in terms of their macroeconomic environment. The conclusions are likely to be relevant to the western Balkan countries and Ukraine. JEL Classification Numbers: F13, F15 Keywords: Trade Agreements, Gravity Model, Bilateral Trade, Customs Union, Currency Union. Author’s E-Mail Address: [email protected] and [email protected] 1 We appreciate Cathy Song’s help in establishing the database for this project. We are grateful for to Professor Stephen R. Bond for suggestions. We thank Paul Brenton (World Bank), Luc Everaert (IMF), Alex Klemm (IMF), Will Martin (World Bank) and Yi Wu (IMF) for their detailed comments. Participants at an IMF Southeastern Europe Workshop and reviewers from the Policy Development and Review Department and the Research Departments provided useful comments. Meredith Griggs (World Bank) and Thomas Walter (IMF) provided helpful editorial suggestions. Faiza Mohamed helpfully compiled the document into working paper format. All remaining errors are, of course, ours.
2 Contents Page
I. Introduction ............................................................................................................................4 II. Intra-European Trade Development and Policies .................................................................6 III. Econometric Specification and Results ...............................................................................9 A. Static Model and Results.........................................................................................10
B. Robustness and Dynamic Model.............................................................................14 C. Estimates of the Impact of the Trade Agreements over Time.................................16
D. Impact of the Trade Agreements on Individual Countries......................................20 E. Impact of the Trade Agreements on Individual Countries over Time.....................21 IV Determinants of Country Performance...............................................................................24 A. Definition and Estimates of a Price Competitiveness Indicator .............................25 B. Price Level and Competitiveness ............................................................................26 V. Policy Implications .............................................................................................................27 A. Implications for Western Balkans...........................................................................27 B. Implications for Ukraine .........................................................................................28 C. General Applicable Implications.............................................................................28 VI. Concluding Remarks .........................................................................................................29 References................................................................................................................................40 Tables 1. EU Import Duties Applied Under Selected Preference Regime Categories, 1999........8 2. Robustness: A Comparison of Static and Dynamic Models........................................12 3. Impact of EU Agreements on Individual Central and Eastern European Countries....21 4. Selected Countries: Price Competitiveness and Trade Performance, 1996–2005.......26 Figures 1. Share of 10 Central and Eastern European New Member States in External Trade of EU-15, 1990–2005...............................................................................................6 2. Selected Countries: Simple Average Tariff, 1997–2003 and 2005 ...............................6 3. Europe Agreement and Customs Union: Impact on Bilateral Trade ...........................19 4. EU New Member States: Impact of Europe Agreements on Individual Countries .....22 5. Selected Countries in Southeast Europe: Impact of Trade Agreements Countries .....23 6. Selected Countries: Relative Prices and Relative Income of Individual CEE
Countries Compared to Average for EU-25, 1995–2005 ......................................26 Appendices I. Trade Agreements........................................................................................................30 II. Unit Root Test and Selected Static Model Results ......................................................34

3
ACRONYMS
AIC Akaika information criterion
CEE countries Central and Eastern European countries comprise the 10 new member states on the continent, the western Balkan countries, Moldova and Ukraine.
CMAE Council for Mutual Economic Assistance
EEA European Economic Area
EFTA European Free Trade Association
Europe Agreements Agreements between EU and selected CEE countries (Appendix I).
EU European Union
CEFTA Central European Free Trade Area (Appendix I)
FTA Free trade agreement
GDP Gross domestic product
GSP Generalized System of Preferences
GMM Generalized method of moments
IMF International Monetary Fund
IV Instrumental variable
MFN Most-favored nation
NAFTA North American Free Trade Agreement
OPT Outward-processing trade
REER Real effective exchange rate
SAA Stabilization and Association Agreement.
WBTP Western Balkan Trade Preferences ─ unilateral EU trade preferences to imports from the western Balkan countries
Western Balkans Albania, Bosnia and Herzegovina, Croatia, Macedonia (Former Yugoslav Republic of), Montenegro, and Serbia
WTO World Trade Organization

4
I. INTRODUCTION
1. Since the European Union (EU) expanded in the early twenty-first century, trade policy toward nonmember European countries has been in a state of flux. During 2004-07, 10 Central and Eastern European (CEE) countries acceded to the EU and adopted the common external tariff, as well as all EU external trade agreements.2 In the wake of these changes, trade policies in the region are being reconsidered. The Central European Free Trade Agreement (CEFTA) was modified on December 19, 2006, allowing it to take in western Balkan countries that had previously been excluded. Further afield, the EU and Ukraine are considering adopting a preferential trade agreement.
2. Trade agreements deserve attention because they contributed significantly to intra-European trade and smoothed the transition to EU membership. During the 1990s, the EU entered with selected CEE countries into Europe Agreements that included, inter alia, bilateral trade preferences. These agreements were viewed as a stepping stone to EU accession. Parallel to these agreements, the EU concluded a customs union with Turkey in 1996. In some respects, the trade policy aspects of this customs union went beyond the Europe Agreements. There is ample evidence that trade relations with the EU were important for economic developments in CEE countries and Turkey. But there is less clarity about how much individual countries’ trade performance benefited from these agreements or, in the case of Turkey, the customs union.
3. This paper focuses on the impact of EU-instigated trade agreements on bilateral trade flows, abstracting from the wider impact of these agreements. We quantify which agreements affected trade and when, as well as why, some countries performed better than others. Our focus has important limitations, however. We do not evaluate the contribution of the trade agreements to economic development, which is a more complicated question. Indeed, in the countries with relatively high tariffs, the trade agreements are likely to have diverted trade from the most efficient supplier to less competitive ones, hence reducing economic efficiency.
4. Our analysis shows that the impact of trade agreements varied by country and over time. A gravity model is used to estimate the impact of these agreements on bilateral trade flows. The model is specified as a panel of bilateral trade flows over a 16-year period providing over 70,000 observations. The annual impact of each agreement on bilateral trade is estimated in terms of the increase in trade between the countries with the trade agreements. Following common practice, the trade agreements had lengthy phase-in periods, providing economic 2 The 10 CEE countries are Bulgaria, the Czech Republic, Estonia, Hungary, Latvia, Lithuania, Malta, Poland, Romania, the Slovak Republic, and Slovenia. CEE countries are these countries as well as the Western Balkan countries (Albania, Bosnia, Croatia, Macedonia (Former Yugoslav Republic of), Montenegro, and Serbia). All bilateral trade agreements used in the analysis are listed in Appendix I.

5
agents time to adjust. Our estimates confirm the importance of these phase-in periods, as the trade agreements became more effective over time. Furthermore, taking price competitiveness of CEE countries and Turkey as example, we demonstrate that macroeconomic policy and the environment determine whether these countries were able to take advantage of the market-opening provisions of a trade agreement.
5. Although the Europe Agreements’ impact on bilateral trade increased over time, its impact on exports to the EU remained smaller than that of a customs union. Some three to four years after their entry into force, the Europe Agreements contributed significantly to bilateral trade between the EU and each of the CEE countries. While trade in both directions increased, EU exports to CEE rose much more quickly than CEE exports to the EU. A comparison with the impact of the EU-Turkey customs union suggests that a customs union had a stronger and more symmetric impact on both exports and imports. However, the Europe Agreements had a significantly stronger effect on trade than the trade preferences for the western Balkan countries. This is also true for the CEFTA. More restrictive rules of origin in the western Balkan countries’ trade preferences may explain its weak impact. Our study provides detailed quantitative estimates for arguments made in other studies (e.g., Brenton and Manchin, 2003; and Emerson, 2005).
6. The results of our analysis are important for trade negotiators. A customs union is superior to a “spaghetti bowl” of free trade agreements, particularly if strict rules of origin apply. We estimate that trade between the EU and the western Balkan countries will significantly benefit from the latter countries’ accession to CEFTA. However, they would benefit even more if they joined a customs union with the EU. Negotiators of free trade agreements may also note that the benefits of these agreements are skewed toward the country with the lower import tariffs and the more competitive price level, or implicitly, its exchange rate. This is important for the western Balkan countries, as well as for Ukraine.
7. The paper begins by surveying the evolution of trade policies and performance in Section II. Section III presents the gravity model and the estimates of the impact of the various trading arrangements. Different specifications are used, allowing us to identify the impact by country and over time. Section IV confirms that price competitiveness is a key determinant of countries’ ability to fully take advantage of the trade agreement provisions. The policy implications for countries that may wish to reconsider their preferential trade agreement with the EU, such as, for example, the western Balkans and Ukraine, are then discussed in Section V. Section VI offers concluding remarks.

6
II. INTRA-EUROPEAN TRADE DEVELOPMENTS AND POLICIES
8. Since the early 1990s, the share of the CEE New Member States in EU-15 imports has increased rapidly (Figure 1). During the same period (1990-2005), these 10 countries increased their share of world trade from under 1 percent to over 3 percent. On average, trade (exports plus imports) in those countries reached almost 100 percent of GDP in 2005, with much larger shares in smaller countries and smaller shares in larger countries.
9. Developments in the western Balkan countries and Ukraine were not as felicitous. The trade-to-GDP ratio and the contribution to world trade are similar to those in the New Member States but have fluctuated more over time. Poor integration with the EU appears to be a major factor in this modest trade performance. The share of exports to the expanded EU (27 countries) in total exports has declined since 2002. During these years, the EU exports gained market share only in Ukraine from a small base (30 percent of total imports).
10. Trade preferences have provided an important stimulus to intra-European trade. Trade policies have been significantly liberalized since 1990, when the Uruguay Round negotiations were implemented. However, tariffs and nontariff barriers remain important, both for the EU and for countries in the CEE region. (Figure 2). The continued prevalence of trade barriers suggests that selectively suspending or removing these barriers is important. We come back to granting of preferences by removing trade tariff and non-tariff barriers later in the paper when we explain the impact of the trade agreements.
0
2
4
6
8
10
12
14
16
1990 1991 1992 1993 1994 1995 1996 1997 1998 1999 2000 2001 2002 2003 2004 2005
imports exports
Figure 1: Share of 10 Central and Eastern European New Member States in External Trade of EU-15, 1990-2005 (percent)
Source: IMF Direction of Trade Statistics.
0
5
10
15
20
25
Albania
1/
Bosnia
& Herz
egovin
a 2/
Bulgari
a 1/
Croatia
1/
Cyprus
1/
Czech R
epubli
c 1/
Estonia
1/
Hungar
y 3/
Latvia
1/
Lithuan
ia 1/
Poland
3/
Romani
a 3/
Slovak
Republi
c 1/
Sloveni
a 1/
Turkey
3/
Ukraine
2/
Yugosl
avia (
Serbia-
Mont) 2
/
1997 2003 2006
Figure 2. Selected Countries: Simple Average Tariff, 1997, 2003 and 2005 (Percent)
Source: IMF, Trade Policy Division.Notes: 1/ WTO accession since 1990; 2/ WTO nonmember; 3/ WTO member prior to 1990.
EU average, 2005

7
11. The EU applies a variety of trade preferences to CEE countries, either as part of a trade agreement or unilaterally (Appendix I). These preferences vary in terms of, (a) the margin of preference for qualifying imports (Table 1) and (b) the rules of origin that determine which imports qualify for the margin of preference. A key aspect of rules of origin is whether “diagonal cumulation” is accepted, that is, whether inputs originating from countries in the zone of cumulation can be counted toward satisfying the rule of the exported product. The main EU trade agreements are listed below:
• Since 1991, the EU and selected CEE countries have negotiated Europe Agreements.3 Over time, these agreements granted duty-free access for all nonagricultural products. However, the EU exports received a higher margin of preference because most CEE countries apply wider tariffs than the EU. On the other hand, the phase-in periods specified in these agreements was longer for the CEE countries than for the EU (Michalek, 2005). Until 1997, the rules of origin were based on bilateral cumulation. Since then, pan-European rules of origin allow goods from all EU, EFTA, and CEFTA countries and Turkey to qualify as satisfying the rules of origin.
• Some trading partners went further and agreed to apply the EU external tariff, hence entering into a customs union with the EU. The EU customs union with Andorra and San Marino covers all products, while its customs union with Malta (1971 up to EU accession) and Turkey (since 1996) applies only to nonagricultural products. If a customs union is combined with a revenue-sharing formula, no rules of origin apply. Without a revenue-sharing formula, nonrestrictive rules of origin apply.
• The EU has negotiated Stabilization and Association Agreements (SAAs) with Croatia (2001) and Macedonia (2001). These agreements provide market access similar to that of the Europe Agreements.
• The EU and the European Free Trade Association (EFTA) member countries (excluding Switzerland) formed the European Economic Area (EEA) in 1994 when they deepened their integration by covering a range of behind-the-border issues, such as competition policy, and by ruling out the use of contingent protection. Imports from EFTA participate in the pan-European rules of origin introduced in 1997.
• The EU has entered into bilateral trade agreements with many countries (Appendix Table I.2). The trade preferences specified in these agreements are not as generous as the
3 In December 1991, Czechoslovakia, Hungary, and Poland signed the first Europe Agreements. Following their “velvet divorce,” both the Czech and Slovak Republics applied these agreements in 1993. Other countries negotiated similar agreements: Romania in 1993, Bulgaria in 1994, the Baltic countries in 1995, Slovenia in 1997, Macedonia (Former Yugoslav Republic) in 2001 and Croatia in 2001 (Appendix I).

8
Europe Agreements, and the rules of origin are more restrictive; cumulation is bilateral because only imports from the EU and the trading partner qualify.
12. In parallel to these agreements, the EU also applied the following unilateral trade preferences to imports from other countries:
• In 2000 the EU introduced the Western Balkan Trade Preferences (WBTPs) for the successor states of the former Socialist Federal Republic of Yugoslavia (excluding Slovenia) and Albania. These preferences were less generous than the Europe Agreements, and the rules of origin were more restrictive: only inputs from the EU and the exporting country qualified toward satisfying the rules or origin.
• The EU grants unilateral trade preferences under its Generalized System of Preferences (GSP), selected former colonies under its Lomé and Cotonu Agreements, and preference to imports from the least developed countries under the Everything-but-Arms (EBA) initiative. Although the margin of preferences of these initiatives is generous, they are subject to restrictive rules of origin. We did not include them into our analysis because these preference did not affect the main results that are the focus of this paper.
• Like most other countries, the EU allows for “outward processing,” which exempts import duties to the extent that the imports consist of EU-produced components. These preferences are not trading-partner specific and, hence, are also excluded from our analysis.
Table 1. EU Import Duties Applied Under Selected Preference Regime Categories, 1999 (percent)
MFN- bound tariffs
MFN- applied tariffs
GSP+MFN
FTA+MFN
LDC+MFN
Lomé+GSP+MFN
Lomé+LDCs+MFN
All products 7.0 6.9 4.9 3.5 1.9 1.9 1.8 Agricultural products 17.4 17.3 15.7 16.7 10.3 10.3 9.5 Nonagricultural products 4.6 4.5 2.3 0.5 0.0 0.0 0.0 Sources: WTO (2001); and Messerlin (2001). Notes: MFN denotes most-favored-nation tariff; GSP denotes Generalized System of Preferences; FTA (Free Trade Agreement); Lomé refers to tariffs applied to imports from selected African, Caribbean and Pacific Island Economies; and LDC refers to less developed countries.

9
13. The CEE countries also negotiated a range of trade agreements with non-EU countries (Appendix A):4
• Regionally, since 1994 trade has been liberalized under the Central European Free Trade Agreement (CEFTA) and the Baltic Free Trade Agreement. These agreements expanded the benefits of the Europe Agreements and liberalized the rules of origin. Originally, CEFTA was a steppingstone to EU accession, but, in 2006, it was modified to offer membership to all western Balkan countries, as well as Moldova.5 A transitional period, ending December 31, 2010, allows for a gradual phase-in of the CEFTA provisions. When it enters into force, the amended CEFTA will replace all bilateral trade agreements among the signatories.
• During the 1990s, the CEE countries also negotiated a range of bilateral agreements; common partners were the EFTA countries, Israel, and Turkey, with a more complicated mosaic of agreements in the western Balkans (Appendix I).
III. ECONOMETRIC SPECIFICATION AND RESULTS
14. The objective of this study is to estimate the impact of the various trade agreements on trade flows. A traditional gravity model is used to analyze (a) the relative importance of the various trade policy agreements, (b) the impact of these agreements over time, (c) the impact of these agreements on the performance of individual countries, and (d) their impact on bilateral trade flows in individual countries over time. The model uses data from internationally available sources.6 Following Subramanian and Wei (2003) where they analyze the impact of import tariffs on imports, we focus on the impact of alternative trade policies on imports and, hence, use imports as the dependent variable.
15. The study focuses on the impact of the trade agreements on bilateral trade flows, not on estimates of potential trade or trade diversion. Gravity models have also been used to estimate potential trade and, hence, the deviation of actual trade from potential (Bussière,
4 Officially, many countries in the region simultaneously granted GSP preferences to selected imports while their exports received GSP preferences in other countries. We excluded all GSP preferences from our analysis.
5 The amended CEFTA is to enter into force on May 1, 2007, provided that all parties have deposited their instruments of ratification and acceptance of approval with the Depositary by March 31, 2007 (Agreement on Amendment of and Accession to the Central European Free Trade Agreement, Article IV(2).
6 Trade, GDP, and population data are available from the IMF’s Direction of Trade and World Economic Outlook databases. Distance variables are published on the internet by CEPII (www.cepii.fr). The various trade agreements and their classification in the econometric analysis are listed in Appendix I.

10
Fidrmuc, and Schnatz, 2005; European Commission, 2006; and Söderling, 2005). However, we do not deal with this aspect because these models do not provide new insights about which policies are required to realize the estimated potential. Our aim is to identify trade policy options that will boost European integration. We realize that, compared with full trade liberalization in the transition countries, most of the trade agreements may involve trade diversion, especially as recent studies show that most regional trade arrangements are trade diverting, including the EU and the North American Free Trade Agreement (NAFTA) (Dee and Gali, 2005).7 Still, the EU trade agreements are likely to be worthwhile since they ease the political constraints on further trade liberalization.
A. Static Model and Results
16. A gravity model is used to test the impact of trade agreements. We first specify it in a static setting (“the static model”) and use panel regressions to estimate the impact of trade agreements by exploring the information in the readily available macroeconomic panel data. We obtain precise and largely unbiased results (controlling for time-invariant heterogeneity and testing the endogeneity problem) (Baldwin and Taglioni, 2006). Panel regressions also allow the estimation of the trade agreements’ effects over time, and across country pairs. In the next section, we further explore the information in panel data where we test for robustness using a dynamic model.
17. The basic static model of our paper is specified below: ijtY are the imports from
country i to country j at time t; ijtD is a set of trade arrangement dummies; and ijtX is a set of covariate controls, including the multiple of GDPs of partners, distance, common language, and common border. The theoretical foundation of this model is the constant elasticity of substitution and goods that are differentiated by country of origin (Anderson and van Wincoop, 2003). ijtu is the error term, with ijε capturing the country-pair effect, tμ capturing the time effect,
and ijtν assumed to be standard normal distributed with no serial correlations. We specified both fixed-effects and random-effects models. In the fixed-effect panel regression, the time-invariant control variables are dropped due to the perfect collinearity of these controls and the country-pair dummies ijε , with their effects captured by ijε . Our Haussman specification test results reject random effect models, so we only report fixed effects model results in Table 2. More specifically, since the year-fixed effect captures the macroeconomic environment changes or economic shocks over time, as standard practice we favor the two-way, rather than the one-way,
7 However, others found little evidence that NAFTA had a trade-diverting impact (Krueger, 1999).

11
fixed effects model. Thus in our paper we only focus on the two-way fixed effects analysis, unless otherwise noted.8
0 1 21 1
ln( )K L
k lijt ijt ijt ijt
k l
ijt ij t ijt
Y D X u
u
β β β
ε μ ν= =
= + × + × +
= + +
∑ ∑
1kijtD = if with a trade arrangement between i and j at time t
0= if no trade arrangement.
18. We test for possible endogenity between trade and GDP. Trade and GDP are possibly endogenous as trade contributes to GDP. That is, in the above equation, GDP in ijtX is
correlated with ijtu and thus the estimated 1β and 2β are both biased. By using lagged GDP as an instrument variable (IV), we are able to control for the possible endogenity between trade and GDP.9 Our IV estimation results, as reported in the second column of table 2, are similar to the other estimate, and we interpret this as confirmation that endogenity is not a major concern.
8 For reference of our random effect model results, as well as one-way fixed effect model results, and Haussman specification tests statistics, please refer to Appendix Table II.2.
9 We did both a F-test and an AIC test and both of them indicate that GDP multiple is an AR(2) process. For details, see Appendix Table II.1, note 1. Therefore we use the first two lags of GDP multiple as IVs. This also allows us to do an overidentification test to test the weakness of our IVs in the first stage.
12
Two-way fixed effectsInstrumental variable two-way fixed effects
Dynamic Model Difference GMM
Dynamic Model System GMM
EU and Europe Agreement countriesImports into EU 0.30 0.23 0.06 0.44
[9.24]** [3.42]** [1.30] [9.25]**Imports into Central and Eastern Europe 0.58 0.47 0.14 0.59
[17.18]** [7.11]** [3.52]** [12.26]**EU and customs union
Imports into EU 0.76 0.74 0.07 0.45[10.58]** [5.65]** [0.67] [7.52]**
Imports into customs agreement country 0.68 0.62 0.12 0.62[11.05]** [4.77]** [2.39]* [9.49]**
EU and Stability and Association AgreementImports into EU 0.07 0.09 0.15 0.15
[0.94] [0.76] [1.51] [1.70]Imports into SAA country 0.16 0.20 0.18 0.37
[2.75}** [1.41] [2.51]* [4.70]**EU and Western Balkan Trade Preferences
Imports into EU 0.14 -0.35 0.05 -0.09[1.19] [0.32] [0.40] [-0.95]
Imports into Western Balkan 0.48 0.36 0.10 0.36[5.93]** [3.33]** [1.08] [4.74]**
CEFTA 0.39 0.38 0.08 0.49[9.79]** [3.67]** [2.37]* [7.01]**
Bilateral agreements 0.20 0.15 0.06 0.51[5.79]** [2.69]** [1.35] [9.79]**
EU and EFTAEU imports from EFTA member 0.45 0.43 0.10 0.47
[9.60]** [3.97]** [1.82] [7.04]**EFTA imports from EU member 0.55 0.52 0.08 0.48
[13.32]** [4.35]** [1.51] [6.52]**
EU membership 0.70 0.64 0.15 0.55[20.99]** [11.14]** [3.92]** [9.39]**
Euro adoption 0.15 0.16 0.09 0.10[9.78]** [2.51]* [3.46]** [2.98]**
GDPO*GDPP 0.60 0.68 0.19 0.46[28.86]** [20.98]** [6.06]** [11.54]**
Lagged (GDPO*GDPP) no no 0.03 -0.11- - [1.09] [-3.13]**
Import lagged 1 no no 0.21 0.54- - [8.22]** [37.40]**
Import lagged 2 no no 0.01 0.15- - [1.02] [12.22]**
Controls for other trade agreements 1/ yes yes yes yesCountry fixed effect yes yes yes yesYear fixed effect yes yes yes yes
No. of Obervations 71960 71860 56333 63328No. of Groups 6080 6080 5452 5747R 2 0.65
Source: Authors' estimates.
Note: Robust t-statistics in brackets; * significant at 5%; ** significant at 1%.1/ Other controls include a trade embargo variable a variable for trade among former CMEA countries and a variable for EU trade with Lome/Cotonou countries. These results are not reported as they are not the focus of the paper.
Table 2. Robustness: A Comparison of Static and Dynamic Models
Static models Dynamic models

13
19. Our results are consistent with our expectations. We find that the different trade agreements generally affected bilateral trade positively, but the intensity varied by agreement.10
• The Europe Agreements are estimated to contribute 23-30 percent to CEE-countries exports to the EU and 47-58 percent to EU exports to the CEE countries (Table 4, static model, column 1-2). The larger impact on EU exports is expected since (a) it is easier for EU firms to satisfy the rules of origin and (b) the EU receives a larger margin of preference in CEE countries than what it grants on its imports. This result may also reflect the commitments to finance projects with grants that are typically exempt from CEE-countries’ import duties (Goorman, 2005).
• The impact of a customs union is larger than that of the Europe Agreements, and importantly, the benefits of such agreement are symmetrical: because both the EU and its partner have the same tariff level, they grant each other the same margin of preference.
• The results do not show a strong impact of the SAAs and the Western Balkan Trade Preferences on bilateral trade. These agreements do not appear to have influenced trade from the partner country to the EU, although there is some evidence of larger EU exports to the partner countries, especially for the WBTPs countries. The lack of EU imports from SAA and WBTP countries may be attributed to the restrictive rules of origin. The significant contribution of the SAA and WBTP countries to EU exports may be related to the grant-financed assistance from the EU to these partner countries.
• CEFTA contributes to regional integration almost as much as the Europe Agreements. This is to be expected. The provisions of both agreements are similar, and the rules of origin allow for cumulation.
• Bilateral agreements also contribute to trade but less so than CEFTA, possibly because of more restrictive rules of origin in some of the agreements.
10 Including an independent variable for GDP per capita would have improved the estimates for EU membership and euro adoption. However, these results may be spurious, as a Pedroni (1999) cointegration test suggests that GDP per capita and GDP may not be cointegrated with trade flows. Hence, we decided to exclude the GDP per capita variable as it has only a minor impact on the estimates for the trade agreements, on which we focus.

14
• Unlike earlier estimates, our study shows that bilateral trade between the EU and EFTA has benefited from trade policy arrangements. By contrast, earlier estimates of Frankel and Wei (1995) did not find a significant impact of EFTA on bilateral trade. 11 This result may be due to the deeper integration that took effect when the EEA was established in 1994.
• The impact of EU membership and euro adoption is in the same range as found by other studies.12 Table 4, columns 1–2 suggest that EU membership contributes some 64–70 percent to bilateral trade among member countries, and euro adoption is estimated to have contributed an additional 15–16 percent.
B. Robustness and Dynamic Model
20. We check for robustness by using a dynamic specification of the same model. In the static model discussed above, we assume that the previous year’s trade is not contributing to the current trade between trading partners, that is, there is no serial correlation in vijt (a static model). This is a rigid assumption, since it is very likely that bilateral trade is a dynamic process in which the current trade level has some degree of dependence on the previous level: yijt= β * yijt-1+eijt. We suspect that the static model estimation is misspecified.
21. We specify a dynamic model by assuming that the error term,ijtν , in the static
model specified above is an AR(2) process, that is, 1 1 2 2ijt ijt ijt ijtν τ ν τ ν η− −= + + .13 Now, Xijt is defined slightly different from the static specification: it includes both strictly exogenous variables and predetermined variables because of the introduction of the dynamic feature. Unlike the fixed effects panel regression approach ─ where we eliminate the fixed effects by taking the difference between the dependent variable and its average ─ we use the difference of the dependent variable and its lag in the above equation to eliminate the fixed-country-pair effect. Based on this approach, Arellano and Bond (1991) developed a “difference generalized method of moments” (DGMM) to estimate the coefficients in the above equation. The DGMM uses all lagged dependent variables and predetermined variables as instruments.
11 “… a country joining the EC would have experienced an increase in trade with other members of about 50 percent by 1990. No such effect was observed for EFTA.” (Frankel and Wei, 1995, p. 219).
12 A large literature estimates the impact of a currency union on bilateral trade. Rose (2000) initially estimated the impact to be above 100 percent. Subsequently, however, Rose and van Wincoop (2001) published much lower estimates. Baldwin and Taglioni (2006) estimate the impact of EU membership as 25 percent and the impact of a common currency at 34 percent, which they consider on the high side. Faruqee (2004) estimates the impact of euro adoption to be on average 7-8 percent.
13 We did both a F-test and an AIC test and both of them indicate that ( )ijtY
is an AR(2) process. For details, see Appendix Table II.1, note 1.
15
22. The DGMM is an econometrically appropriate estimate assuming that the level variables are not a random walk process (as discussed below). However, the results cannot be directly compared with other estimates in Table 2 due to the estimation technique used in DGMM. Our trade agreements are 0/1 dummies, which equal 1 after trade agreements came into effect, and equal zero otherwise. When applying the DGMM and taking differences over years, the differenced dummies will be zero except for the year during which the trade agreements entered into force. So the reported trade agreement effects in Table 2 are actually the initial effect during the year that the trade agreement entered into force (these results are comparable to the cohort method results presented in Section C below; by comparing the findings, we will confirm that the trade agreement effects estimated in the static model are robust).
23. While the results of the above method are useful for our analysis, the DGMM has drawbacks. In this method, if the dependent variables are close to a random walk, the lagged variables are poor instruments for the differenced dependent variable. Provided the level variables follow a random walk process, the differenced variables cannot be explained or predicted. Bilateral trade and GDP, both of which are instrumented by their own lags, are arguably both subject to a random walk (Faruqee, 2004). So, in Appendix Table II.1, we present the unit root tests to address this issue. The partial findings of unit roots confirm that the issue should be addressed by using a different econometric method.
24. We use a system GMM estimator to address the problem of weak instruments and the indirect comparability of the DGMM and static results (Table 2). Arellano and Bover (1995) outlined a modified version of the DGMM estimator which was further developed in Blundell and Bond (1998). The estimator is commonly called system GMM estimator. The system GMM estimates an equation system by bringing back the original equation into the differenced equation, and thus uses the lagged difference variables as instruments for level variables in order to increase efficiency.
25. Compared with the results of the static model in results, the system GMM estimation suggest a very similar impact of the trade agreements on trade flows (Table 2). While the estimates of o pGDP GDP× are quite different from the results of the static model, the estimated impact of the trade agreements are similar and the estimated impact of a customs union on trade flows continues to be larger than a free trade agreement. The system GMM estimates demonstrate that, although the estimate of o pGDP GDP× can be serious biased, our static model estimates of the trade agreement effects may not be biased. We explain this by
16
arguing that trade agreement dummies are not correlated with lagged years’ trade bilateral levels, while o pGDP GDP× is highly correlated with lagged trade. 14
26. The dynamic model also provides information on the long-term impact of the trade agreements. This impact can be approximated by the estimated coefficient divided by, unity minus the estimated impact of the lagged imports.15 The system GMM estimator results show the impact of the lagged imports to be 0.69, thus suggesting that the long-term impact of the listed agreements would be three times as large as the reported coefficient. While this appears to be a very large effect of the trade agreements, it does illustrate the importance of trade policy.
C. Estimates of the Impact of the Trade Agreements over Time
27. This section elaborates our static model to capture the over-time impact of the trade agreements by interacting the time and trade agreement dummies (illustrated in the equation below). This is a less restrictive method than the dynamic model to estimate the dynamic features of the trade agreements, since it does impose a linear relationship between the trade agreements and time. The estimated coefficients on the interaction terms will capture the impact of the trade agreement over time. The large number of observations provides sufficient
variation to allow us to do this. We call these interaction terms,1
( )T
mijt
tD T
=
×∑ , over-time-
agreement dummies, where T represents a set of time dummies. We use two different methods to define T, referred as the calendar-year method and the cohort method respectively.
14 To illustrate that the trade agreement effects are not serious biased in our static model, let us specify the following equation: 1 1 2 2Y b X b X e= + + , where 1X is the vector of o pGDP GDP× and 2X is the matrix of
trade agreement dummies and we assume 1( ) 0E X e ≠ and 2( ) 0E X e = . An ordinary least squares (OLS)
estimation of 1b is biased by ' 1 '2 2 2( )X MX X Me− , but the estimate of 2b is unbiased because '
1( ) 0E X e = , where ' 1 '
1 1 1 1( ( ) )M I X X X X−= − .
15 In order to keep the illustration simple, let us take the AR(1) process. The dynamic AR(1) model is specified as follows: 0 1 1 2 3ijt ijt ijt ijt ijtY Y D X uβ β β β−= + + + + . If we plug in the lagged period
1 0 1 2 2 1 3 1 1ijt ijt ijt ijt ijtY Y D X uβ β β β− − − − −= + + + + and keep doing so until period Y0 when an initial value was assigned, and if we assume Dijt=Dijt-1, the estimated long-term effect will be equal to
2 31 1 1 2 2 1(1 ...) (1 )β β β β β β+ + + + × = − .
17
0 1 2 31 1
ln( ) ( )T K L
m k lijt ijt ijt ijt ijt
t k m l
ijt ij t ijt
Y D T D X u
u
β β β β
ε μ ν= ≠ =
= + × × + × + × +
= + +
∑ ∑ ∑
28. The calendar-year method is simple to apply but has its drawbacks. It interacts the trade agreement dummies with calendar-year dummies directly (T is the same as tμ in this case), that is, it treats trade under an agreement the same way irrespective of how long an agreement has been in place. Since trade agreements have been effective at different years between different countries and their impacts on trade are assumed to increase over time, a direct interaction of trade agreements with calendar years will mix some effect of the trade agreements and thus mis-estimate their impacts. For this reason we only discuss the cohort method estimates.
29. The cohort method estimates the impact of the trade agreements depending on how long they have been in place.16 The idea behind this method is consistent with the observation that these agreements have substantial phase-in periods and their impacts become fully effective only gradually. Assuming that these phase-in periods were similar across countries, we can estimate the impact of the Europe Agreements depending on the number of years that the agreements have been in place. In order to apply this idea to our regression analysis, we define trade agreement cohort dummies. These cohort dummies are trade-agreement specific, that is, no matter what calendar year it is, a cohort dummy is equal to 1 if a trade agreement has been in effect for a certain number of years; otherwise, it is zero. As with the first method, we interact trade agreement dummies and cohort dummies to generate time-specific trade agreement dummies, in order to estimate the agreements’ impacts over time. The results of this approach are presented in Figure 3. The agreement that has been in force the longest is the Europe Agreement with Romania, as the older Europe Agreements with the Czech Republic, Hungary, Poland, and the Slovak Republic (the Visegrad countries) were superseded when these countries joined the EU.
30. The method shows that the impact of all trade agreements, except WBTPs, is positive and increasing over time from the first year onward. The cohort method allows us to estimate the average initial impact of this type of agreement on all countries that were party to them. The result shows that these agreements made, on average, a positive contribution to
16 We thank Professor Stephan R. Bond for suggesting this approach.
18
bilateral trade from the beginning, gradually increasing over time.17 The main conclusions are as following.
• The impact of the Europe Agreements increased gradually over time. The impact of the agreements seems to have stabilized when they were in effect for 10-12 years, doubling EU exports to the region and contributing 80 percent to imports. Following the accession to the EU of 10 new member states in 2004, the sample changes somewhat, and the agreements appear to have a larger impact on trade of the remaining countries with a Europe Agreement.
• The impact of a Customs Union appears to be more volatile over time, possibly because only two countries in our sample had a customs agreement with the EU. Our results were likely to have been influenced by Turkey, which was the largest country and experienced volatile trade relations during 1998-2002 (Kaminski and Ng, 2006).
• The impact of the Western Balkan Trade Preferences (WBTPs) declined over time, in contrast to the impact of the other two. The results reported for the WBTPs suggest that these agreements had an impact on exports to the EU in 2001, but not thereafter. These results suggest that the WBTPs are not very promising, however we do not have a sufficiently long period to conclude the dynamics of their impact. Meanwhile these agreements contributed to EU exports to the region during all years (Appendix III for detailed reporting of the estimates). These trade patterns may have been the result of the impact of foreign aid or remittances from the EU countries.
• A customs union appears to have had a stronger impact on trading-partner exports to the EU than the Europe Agreements. This result is consistent with the observation that, while the rules of origin are an important obstacle for exports to the EU, they are less so for EU exports.
17 Also, recalling the impact estimated in the DGMM (6 percent impact on CEE countries’ imports to EU and 14 percent on EU imports to CEE countries) we can say the finding in our cohort method is a good approximation of reality, especially considering that the estimated impact using the DGMM underestimates as a result of the weak instruments.

19
Figure 3. Europe Agreement and Customs Union: Impact on Bilateral Trade in Year After the Agreement Entered into Force
(Percent difference from situation in absence of a trade agreements)
Source: Authors' estimates as reported in Annex III.
Note: Customs union observations are limited to 10 years, which covers the complete period of the EU-Turkey Agreement.
0
20
40
60
80
100
120
140
160
1 2 3 4 5 6 7 8 9 10 11 12 13
Imports to EUImports to CEE countries
Figure 3a. Europe Agreements
0
20
40
60
80
100
120
140
160
1 2 3 4 5 6 7 8 9 10 11 12 13
Imports to EUImports to trading partner
Figure 3b. Customs Union 1/
Figure 3c. Western Balkan Trade Agreements
0
10
20
30
40
50
60
70
1 2 3 4 5 6 7 8 9 10 11 12 13
Imports to EU
Imports to Western Balkan countries

20
D. Impact of the Trade Agreements on Individual Countries
31. The empirical framework can also be used to estimate the impact of the trade agreement on the performance of individual countries. We follow the method applied by Adam, Kosma, and McHugh (2003) and Faruqee (2004) and relax the assumption that the agreements have a common impact on all the countries that sign on to them. We create interactive county and agreement dummies (for example, Poland*Europe Agreement). This variable is used to isolate the impact of the Europe Agreement on Polish trade. In parallel, the aggregate Europe Agreement dummy is redefined to exclude the country for which we estimate the individual effect. The estimation is repeated for each country with an Europe Agreement, in order to identify the impact of the agreement on its individual trade performance. The results are reported in Table 3.
32. The estimates for the individual countries show that, while EU exports reacted more strongly than its imports in all countries, the results varied by country (Table 3). EU exports to Romania did particularly well, possibly as a result of Romania’s high MFN tariffs (Figure 2). However, EU exports also did well in some of its trading partners with low MFN tariffs, such as the Baltic countries and Albania, since these economies achieved very high trade-to-GDP ratios and hence traded more than expected with the EU. The result that EU exports to Macedonia responded negative to the Stabilization and Association Agreement is surprising but may be due to country specific circumstances during 2001-05.
33. The impact on partner country exports to the EU was strongest in Bosnia, Poland, Romania, and Turkey. Bosnia’s strong performance could be related to the fact that, as its living standards suggest, its GDP is in fact much higher than officially reported in its statistics (Petrova, 2006). That is, the estimated effect catches up the effect from this mismeasured GDP. The poor performance of Albania’s exports on EU markets may be due to country-specific factors, such as the recovery from the financial sector disturbances during the late 1990s.

21
E. Impact of the Trade Agreements on Individual Countries over Time
34. The large number of observations allows us to estimate the trade agreements’ over-time impact on the trade performance of individual countries. We create interaction dummies to estimate the impact of a trade agreement during a particular year for a particular country (for example, Poland*1998*Europe Agreement). In parallel, we create a new dummy for the Europe Agreement countries that excludes Poland during that year. This procedure is done for each country for each year that the agreements were in force. We present the results of this procedure for the New Member States and the western Balkan countries in Figures 4 and 5.
Europe Agreement/Customs Union/Western Balkan AgreementImports to each member country Imports to EU
Europe Agreements and Stability and Association AgreementsBulgaria 0.38 0.26
[4.47]** [3.28]**
Czech Republic 0.40 0.30[5.69]** [4.14]**
Croatia 0.35 0.17[4.90]** [2.28]*
Estonia 0.79 0.57[9.74]** [5.23]**
Hungary 0.58 0.48[7.59]** [6.38]**
Latvia 0.74 0.31[6.62]** [2.83]**
Lithuania 0.66 0.28[6.43]** [2.90]**
Macedonia (FYROM) -0.32 -0.06[3.64]** [0.49]
Poland 0.60 1.42[6.56]** [2.28]*
Romania 1.14 0.77[11.60]** [10.31]**
Slovak Republic 0.38 0.31[5.11]** [3.61]**
Slovenia 0.33 0.23[7.68]** [4.98]**
Customs union:Turkey 0.75 0.87
[9.05]** [12.20]**Western Balkan Trade Preferences:
Albania (2001-05) 0.73 -0.79[4.79]** [5.20]**
Bosnia (2001-05) 0.40 1.25[3.61]** [6.72]**
Serbia and Montenegro (2001-04) 0.11 -0.08[0.90] [0.47]
Source: Authors' estimates. Note: Robust t-statistics in brackets; * significant at 5%; ** significant at 1%.
Table 3. Impact of EU Agreements on Individual Central and Eastern European Countries

22
Figure 4. EU New Member States: Impact of Europe Agreements on Individual Countries (Percent difference from situation in absence of a trade agreements)
Source: Authors' estimates, as reported in Annex III.
-250
-200
-150
-100
-50
0
50
100
150
1992 1995 1998 2001 2004
Average EuropeAgreementsCzech Republic
Hungary
Poland
Slovak Republic
Imports into CEE
-250
-200
-150
-100
-50
0
50
100
150
1992 1995 1998 2001 2004
Average EuropeAgreementsCzech Republic
Hungary
Poland
Slovak Republic
Imports into the EU
-60
-10
40
90
140
190
1992 1995 1998 2001 2004
Average EuropeAgreementsEstonia
Latvia
Lithuania
Slovenia
-60
-10
40
90
140
190
1992
1994
1996
1998
2000
2002
2004
Average EuropeAgreementsEstonia
Latvia
Lithuania
Slovenia

23
Figure 5. Selected Countries in Southeast Europe: Impact of Trade Agreements on Individual Countries (Percent difference from situation in absence of a trade agreements)
Imports to Partner country Imports to European Union
Source: Authors' estimates as reported in Annex III.
-40
10
60
110
160
210
1992 1995 1998 2001 2004
Average Europe AgreementsBulgariaRomaniaCroatiaTurkey (customs union)
-90
-40
10
60
110
160
210
1992 1995 1998 2001 2004
Average Europe Agreements
Bulgaria
RomaniaCroatia
Turkey (customs union)
-60
-40
-20
0
20
40
60
80
100
120
1992 1995 1998 2001 2004
Average WesternBalkan AgreementAlbania
Bosnia
Macedonia
Serbia and Montenegro
-150
-100
-50
0
50
100
150
200
1992 1995 1998 2001 2004
Average WesternBalkan AgreementAlbania
Bosnia
Macedonia
Serbia andMontenegro

24
35. Over time, individual country estimates show the same upward trend as the estimates for the average impact for the Europe Agreements and the Customs union. Across country the estimates were very different though. Hungary, Estonia, Romania, Turkey and Bosnia exports to the EU did particularly well. EU export to Hungary, the three Baltic countries, Romania and Albania did better than average. Clearly some countries performed better than others at a certain point of time.
36. Political developments in both the EU and in CEE countries influenced trade performance under the trade agreements. The “velvet divorce” of the Czech and Slovak Republics in 1993 shows up as an outlier for the performance of the Czech Republic (Figure 4). Similarly, political developments in Serbia and Montenegro in 2004 and 2005 was reflected in their trade statistics and hence the estimated impact of the trade agreements. More generally, the expansion of the EU in 2004 influenced the impact of the EU agreements in 2004 and 2005.
37. EU exports to CEE countries did not perform better in countries with high tariffs and are to be explored further. EU exports did well in Romania, a country with high MFN tariffs, but performed below average in Poland which also had high MFN tariffs. Furthermore, EU exports performed well in Estonia and Latvia, countries with very low MFN tariffs (Figure 2). To us it was a surprise not finding a relationship between EU exports and MFN tariffs across individual countries. Hence, aimed at explaining the country differences, we do further quantitative analyses through exploring the country performance information reported in Figures 4 and 5.
IV. DETERMINANTS OF COUNTRY PERFORMANCE
38. Why is the impact of a trade agreement so different across countries (see Figures 4 and 5)? In an ideal world, a single trade agreement would have the same impact on different countries, controlling all the other factors. Then how should we interpret the different impacts in our results? In this section, we explain the differences by putting them in context of a certain country’s macroeconomic and policy environment.
39. We elaborate our explanation of the countries’ performance by illustrating it econometrically.18 In our fixed effects model 0 1 1 2 3 ;ijt ijt ijt ijt ij t ijtY Y D Xβ β β β ε μ ν−= + + + + + +
where, ijε captures any country-specific effects that do not vary over time, such as the exchange
rate regime. tμ captures any specific time effects that do not vary across countries, such as a worldwide economic recession. However, some other effects, such as specific shock to a country, are reflected in ijtν . Suppose those factors or shocks are positively/negatively
18 Faruqee (2004) investigates the impact of structural policies on the competitiveness of euro member countries.

25
correlated with a certain country’s trade preference, which is a shock too, then the estimated coefficients will be larger or smaller between countries as they capture other factor effects. This means that when a trade preferences comes into effect, the real impact depends on the interaction between the trade preference and that country’s status quo economic policies and environment. We defined an indicator that measures the status quo based on data that are readily available from the Eurostat website.
A. Definition and Estimation of a Price Competitiveness Indicator
40. The competitiveness indicator is defined as the deviation of the CEE countries’ price level from its equilibrium level. By defining the price level in comparison to the average price level of all countries in the region, we implicitly take account of exchange rate movements. The data for this approach are available on line on the Eurostat website for most of the countries in the region. We estimate the equilibrium price level (labeled Ln (Pi,t) below) in a panel regression as a function of per capita GDP, as well as fixed-country and fixed-year effects:19
Ln (Pi,t) = Ln (Yi,t/Li,t) + ei,t .
41. Our results allow us to assess the price competitiveness of CEE and western Balkan countries over time. Figure 6 presents the price level of each country, in logs and compared with the EU-25 average (y-axis) as well as the relative per capita GDP (also in logs and compared with the EU-25 average). Figure 6 places the country name at its most recent observation (2005).20
19 The price competitiveness measure we generated follows Summers and Heston (1991) as discussed in Froot and Rogoff (1995). This measure has certain advantages compared to the real effective exchange rate (REER) measure commonly used in the literature . It is comparable to the REER in that it compares developments in price levels in the CEE countries to the average price level in the EU-25. However, it goes a step further and takes account of developments in per capita income over time by comparing per capita GDP to the average per capita GDP in the EU-25. .
20The following country codes are used: BGR, Bulgaria; EST, Estonia; HRV, Croatia; HUN, Hungary; LVA, Latvia; MK, Former Yugoslav Republic of Macedonia; POL, Poland; ROM, Romania; SVN, Slovenia; SVK, Slovakia; and TUR, Turkey.
BGR
HRV
CZEEST HUN
LVA
LTU
POL
ROM
SVK
TUR
2.83.03.23.43.63.84.04.2
3.0 3.2 3.4 3.6 3.8 4.0 4.2 4.4
Figure 6. Selected Countries: Relative Prices and Relative Income of Individual CEE Countries Compared to Average for EU-25, 1995-2005
Ln Pit
Ln(Yit/Lit )
Sources: Eurostat data; and authors' estimates
Number of observations : 117Number of groups: 12R2 0.67
Ln Pit = 2.831 + 0.264 *Ln(Yit/Lit ), controlled for country and time (7.51)** (2.62)**
SVN

26
B. Price Level and Competitiveness
42. The performance of CEE and western Balkan countries on the EU market is estimated as a function of their deviation from the equilibrium price level. We estimate the relationship below, where TAit is the estimated impact of a trade agreement on each country over time, compared with the situation in absence of a trade agreement (TAit is a certain point estimate in country i at time t, as reported in Figure 4 and 5). This is the information that we present in Figures 4 and 5 above; of these, we use only the statistically significant observations as reported in Appendix III. We expect that this performance is a function of the price competitiveness of exports on the EU market. Variable EPLit is the difference between the estimated price level and the price level, that we would expect given the country’s per capita GDP at purchasing power parity:
TAit = β1 + β2 PLit + ε .
43. Our results suggest that the trade-agreements-driven export performance of the CEE countries depends on the price competitiveness in the source country. Higher prices in the source country have a negative impact on EU imports from that country (Table 4). In principle, this effect should be symmetric; higher prices discourage exports and encourage imports. But we did not find such symmetry in our results. Higher prices affect exports to the EU but have no immediate impact on imports from the EU.
44. The results illustrate that macroeconomic policies are key determinants of bilateral trade performance driven by trade agreements. However, the failure to find a relationship on the import side also indicates how limited it is to use only price competitiveness indicators, a simple measure, to explain trade flows.21
21 The asymmetric result may be explained by the fact that CEE exports to the EU have a significant EU content while EU exports to CEE countries have a modest CEE content. This may be illustrated by the correlation between the coefficients of CEE imports to the EU and EU imports to the CEE countries: A regression of the estimated CEE export performance under the agreement on the import performance with fixed and time effects has an estimated coefficient of 0.287 with t-statistic of 3.17 and R2 of 0.76.
Table 4. Selected countries: Price Competitiveness and Trade Performance, 1996-2005
Imports to EUImports to EU partner
country EPLit -0.685 0.15 (-2.47)* -0.57 Country fixed effects yes yes Year fixed effects yes yes No. of observations 76 101 No. of groups 12 12 R2 within 0.76 0.70 Source: Authors' estimates Notes: Countries with a significant trade performance under the trade agreement as listed in Appendix III are included. with Robust t-statistics in brackets; * significant at 5 percent level.

27
V. POLICY IMPLICATIONS
45. Which of our results are relevant for EU trade policies toward western Balkan countries and Ukraine? We limit ourselves to commenting on explicit policies affecting these countries, restraining ourselves from commenting on the EU’s policies vis-à-vis other countries. Clearly, EU policies with respect to non-European countries would also have an impact on the non-EU countries in Europe. However, we expect these policies to be reformed under a broader WTO agreement, which is beyond the scope of this study.
A. Implications for Western Balkans
46. The trade preferences for the western Balkans have been replaced by an extended CEFTA. Our analysis of the WBTP showed that its impact became weaker over time. Our estimates suggest that CEFTA will increase bilateral trade by 38-49 percent. This indicates that, compared to the WBTP, the extended CEFTA will facilitate integration of western Balkan countries with the EU and each other. Hence we welcome this policy change.
47. Our analysis, however, also indicates that a customs union of the EU and the western Balkan countries would contribute more to trade than a patchwork of free trade agreements. The literature is unambiguous that a customs union imposes fewer costs on traders than a free trade area, where private parties are required to comply with cumbersome rules of origin. Our analysis confirms that a customs union with the EU would greatly benefit the exports from western Balkan countries to the EU. This result is particularly important if there is no prospect for EU membership in the short to medium term. As in the case of Turkey, such a customs union could exclude agricultural trade. However, an agreement that would also include agricultural products would have even greater impacts.
48. In the case of the western Balkans, the disadvantages of a customs union appear to be manageable. The share of the EU in total trade of the western Balkans is already in the range of 70-90 percent in all countries, except Macedonia. Hence, trade diversion is less of a concern. A customs union will require the adoption of the EU tariffs, which are low for most nonagricultural products. In the region, Croatia and possibly Montenegro have tariffs that are on average slightly lower than the EU; hence, in all other countries the adoption of a customs union would actually lower the simple average tariff.22
49. An EU-western Balkan customs union could set the stage for further cooperation during the period before membership. A customs union does not require, but is likely to lead to, deeper cooperation, initially in customs administration but over time also in trade in services, 22 Since 2005, Montenegro and Serbia became separate countries. Montenegro’s simple average tariff appears to be below the EU average.

28
foreign direct investment, and movement of people. In principle, this cooperation could also be realized without a customs union, but it is likely to be easier with tariff level conversion and closer alignment of customs administrations.
B. Implications for Ukraine
50. An EU-Ukraine customs union is unlikely to be appropriate in the short to medium term. The EU’s share in Ukraine’s external trade is about one-third, less than half the EU share in the trade of western Balkan countries. Hence, a customs union could lead to significant trade diversion. In this context, a bilateral free trade agreement might be more appropriate, particularly if combined with significant trade liberalization of goods and services in Ukraine.
51. If Ukraine concludes a free trade agreement with the EU, specifying the rules of origin will be important. CEFTA ─ with its more liberal rules of origin ─ was expanded to the western Balkans and Moldova, but it continues to exclude Ukraine. Hence, a bilateral trade agreement has to specify both market access and the rules of origin. Access to the pan-European rules of origin would benefit Ukrainian exports substantially.
52. Bilateral trade is likely to contribute more to EU exports than to Ukraine exports to the EU. Trade preferences have a stronger impact on EU exports than on imports, because it is generally easier for EU firms to satisfy the relevant rules of origin than for suppliers who have a smaller domestic market. To compensate for this, a bilateral EU-Ukraine trade agreement could include shorter phase-in periods for Ukrainian exports to the EU, while EU preferential access to Ukraine increases over time.
53. EU assistance ─ likely as part of a bilateral trade agreement ─ will benefit both Ukraine and EU exporting companies. EU assistance to Ukraine will be subject to the European rules of origin, that is, it will be required to have a minimum European content. Furthermore, grant-financed imports receive duty-free treatment in many countries (Goorman, 2005). Hence even if Ukraine reduces its import duties only gradually, EU exports are likely to grow rapidly thanks to the duty-free grant-financed exports. However, competition from grant-financed imports is likely to be a temporary phenomenon that does not require a specific policy response, provided the grants contribute to investment and growth.
C. General Applicable Implications
54. Appropriate macroeconomic policies, as measured by price competitiveness, will remain crucial for reaping the benefits of any trade agreement. Price competitiveness is a function of per capita GDP at purchasing power parity. Our analysis suggests that countries with overvalued exchange rates have difficulty competing in the EU market, notwithstanding the beneficial impact of the bilateral or regional free trade agreements. Competitive price levels require structural policies, notably competition policies and low barriers to entry and exit, a discussion beyond the scope of this paper. Countries negotiating free trade agreements with the

29
EU, should note that their exports will require a competitive price level to be able to take advantage of such an agreement.
VI. CONCLUDING REMARKS
55. A simple gravity model has allowed us to draw important conclusions. Using the model we have estimated the impact of alternative trade policy arrangements. The strength of our approach is that it provides us with many observations to estimate the impact of various trade arrangements. Its weakness is that it does not estimate how much the trade agreements contribute to trade creation as opposed to trade diversion from other ── more efficient ── sources. The model, therefore, does not allow us to estimate the welfare impact of these trade agreements.
56. Bilateral and regional trade agreements are second best to trade liberalization. Preferential trade agreements are not a substitute for unilateral trade liberalization. In the absence of a customs union, countries remain free to lower their tariffs below the rates applied in their preferential trade partners. In Europe, tariffs in some of the Baltic countries, as well as Malta, were below the EU tariff until the time of EU accession. However, the fact that only 3 out of 12 countries that joined the EU in 2004-07 had tariffs below the EU tariffs illustrates the political difficulty in unilateral trade liberalization. Without a customs union, most European countries adopted higher tariffs. Furthermore, the lack of a customs union forced importers and exporters to satisfy the rules of origin.
57. Bilateral and regional trade agreements are likely to remain important. Progress in the Doha round would be welcome and could make many of the preferential trading arrangements superfluous. However, the political obstacles to such progress remain strong. Various studies have highlighted the possibility that preferential trade agreements are sabotaging the prospect for progress toward multilateral trade liberalization and that the cost of negotiating and implementation risk diverting policy makers’ attention from the multilateral agenda. However, preferential trading arrangements may also pave the way for multilateral trade negotiations. They increase competition and soften the impact of the remaining tariffs that can be removed only through multilateral trade negotiations.

30
-
Euro
pean
Uni
on (E
U),
Janu
ary
1, 2
006
Euro
pean
Uni
on N
ew
Mem
ber S
tate
s sin
ce
1996
(N
MS)
Euro
pean
Fre
e Tr
ade
Are
a (E
FTA
)Eu
rope
an c
ount
ries t
hat
prev
ious
ly b
elon
ged
to o
r w
ere
asso
ciat
ed w
ith t
he
Cou
ncil
for M
utua
l Ec
onom
ic A
ssis
tanc
e (C
MEA
)
Com
mon
wea
lth o
f In
depe
nden
t Sta
tes
(CIS
)
Cou
ntry
Mem
bers
hip
perio
dA
ustri
a (s
ince
199
5)B
ulga
ria (2
007)
Icel
and
Alb
ania
Plan
ned
for 2
007
Cou
ntrie
s tha
t pre
viou
sly
wer
e pa
rt of
the
Sov
iet
Uni
on
Aze
rbaj
ian
Bel
gium
Cyp
rus (
2004
)N
orw
ayB
osni
a an
d H
erze
govi
naPl
anne
d fo
r 200
7C
ount
ries t
hat p
revi
ousl
y w
ere
part
of t
he F
orm
er
Fede
ral S
ocia
list R
epub
lic
of Y
ugos
lavi
a
Arm
enia
Den
mar
kC
zech
Rep
ublic
(200
4)Sw
itzer
land
Bul
garia
1998
July
- 20
06A
lban
ia 1
/B
elar
us
Finl
and
(sin
ce 1
995)
Finl
and
(unt
il 19
94)
Cro
atia
2003
- 20
06B
ulga
riaG
eorg
iaFr
ance
Hun
gary
(200
4)Sw
eden
(unt
il 19
94)
Cze
ch R
epub
lic19
93 -
2003
Cze
ch R
epub
licM
oldo
va
Ger
man
yLa
tvia
(200
4)A
ustri
a (u
ntil
1994
)H
unga
ry19
93 -
2003
Ger
man
y (in
clud
ing
form
er D
DR
)K
azak
hsta
n
Gre
ece
Lith
uani
a (2
004)
Liec
hten
stei
nM
oldo
vaPl
anne
d fo
r 200
7H
unga
ryK
yrky
z R
epub
licIr
elan
dM
alta
(200
4)M
aced
onia
(F
YR
OM
)20
06 -
Ong
oing
Pola
ndR
ussi
an F
eder
atio
n
Italy
Pola
nd (2
004)
Mon
tene
gro
Plan
ned
for 2
007
Rom
ania
Ukr
aine
Luxe
mbo
urg
Rom
ania
(200
7)Po
land
1993
- 20
03Sl
ovak
Rep
ublic
Uzb
ekis
tan
Net
herla
nds
Slov
ak R
epub
lic
(200
4)R
oman
ia19
97-o
ngoi
ngTa
jikis
tan
Portu
gal
Slov
enia
(200
4)Se
rbia
Pl
anne
d fo
r 200
7Tu
rkm
enis
tan
Spai
nSl
ovak
Rep
ublic
1993
- 20
03Sw
eden
(sin
ce 1
995)
Slov
enia
1996
- 20
03U
nite
d K
ingd
omU
nite
d N
atio
ns
Mis
sion
in K
osov
o (U
NM
IK)
Plan
ned
for 2
007
Sour
ce: W
TO, v
ario
us y
ears
and
cou
ntrie
s, Tr
ade
Polic
y Re
view
s, a
nd D
arth
mou
th o
n lin
e da
taba
se a
t, h
ttp://
mba
.tuck
.dar
tmou
th.e
du/c
ib/re
sear
ch/tr
ade_
agre
emen
ts.h
tml.
1/ A
lban
ia le
ft th
e C
MEA
in 1
961
and
the
econ
omet
ric a
naly
sis t
reat
s it a
s if i
t was
nev
er a
mem
ber.
Cen
tral E
urop
ean
Free
Tra
de A
rea(
CEF
TA)
(Est
ablis
hed
Dec
embe
r 199
2)
App
endi
x T
able
I.1.
Sel
ecte
d T
rade
Agr
eem
ents
: Lis
t of M
embe
r C
ount
ries
, 199
0–20
06
31
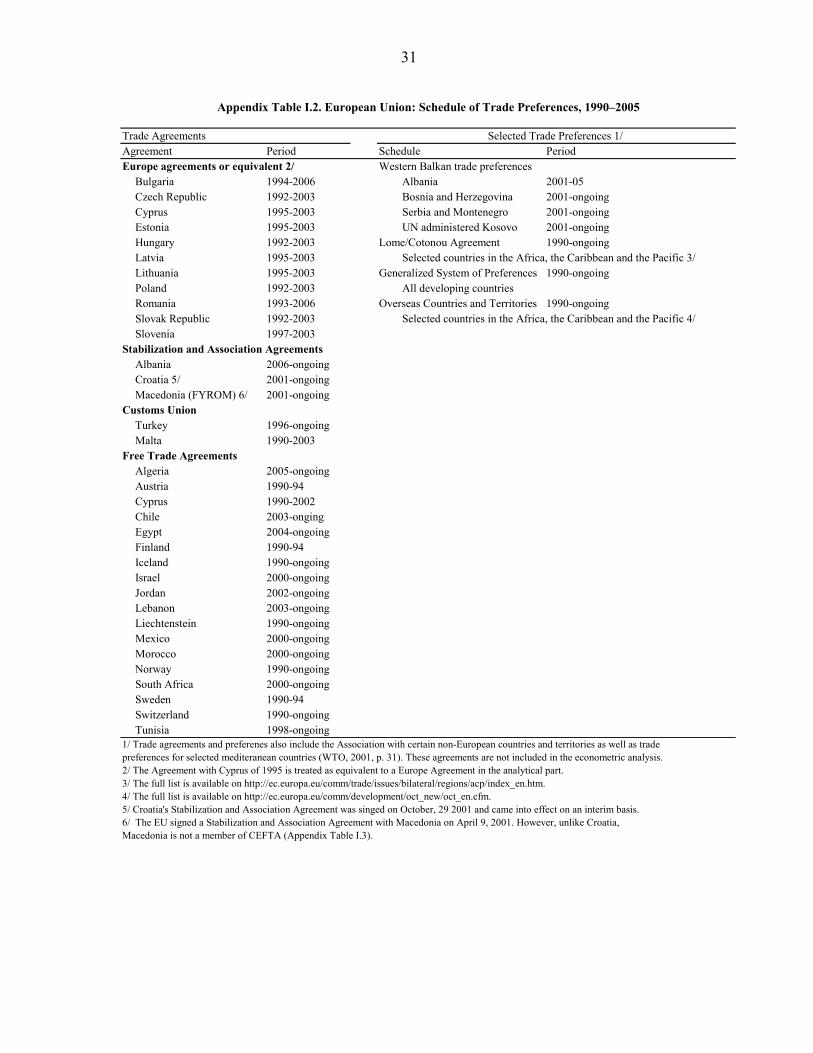
Agreement Period Schedule PeriodEurope agreements or equivalent 2/ Western Balkan trade preferences
Bulgaria 1994-2006 Albania 2001-05Czech Republic 1992-2003 Bosnia and Herzegovina 2001-ongoingCyprus 1995-2003 Serbia and Montenegro 2001-ongoingEstonia 1995-2003 UN administered Kosovo 2001-ongoingHungary 1992-2003 Lome/Cotonou Agreement 1990-ongoingLatvia 1995-2003 Selected countries in the Africa, the Caribbean and the Pacific 3/Lithuania 1995-2003 Generalized System of Preferences 1990-ongoingPoland 1992-2003 All developing countriesRomania 1993-2006 Overseas Countries and Territories 1990-ongoingSlovak Republic 1992-2003 Selected countries in the Africa, the Caribbean and the Pacific 4/Slovenia 1997-2003
Stabilization and Association AgreementsAlbania 2006-ongoingCroatia 5/ 2001-ongoingMacedonia (FYROM) 6/ 2001-ongoing
Customs UnionTurkey 1996-ongoingMalta 1990-2003
Free Trade AgreementsAlgeria 2005-ongoingAustria 1990-94Cyprus 1990-2002Chile 2003-ongingEgypt 2004-ongoingFinland 1990-94Iceland 1990-ongoingIsrael 2000-ongoingJordan 2002-ongoingLebanon 2003-ongoingLiechtenstein 1990-ongoingMexico 2000-ongoingMorocco 2000-ongoingNorway 1990-ongoingSouth Africa 2000-ongoingSweden 1990-94Switzerland 1990-ongoingTunisia 1998-ongoing
1/ Trade agreements and preferenes also include the Association with certain non-European countries and territories as well as tradepreferences for selected mediteranean countries (WTO, 2001, p. 31). These agreements are not included in the econometric analysis.2/ The Agreement with Cyprus of 1995 is treated as equivalent to a Europe Agreement in the analytical part. 3/ The full list is available on http://ec.europa.eu/comm/trade/issues/bilateral/regions/acp/index_en.htm.4/ The full list is available on http://ec.europa.eu/comm/development/oct_new/oct_en.cfm.5/ Croatia's Stabilization and Association Agreement was singed on October, 29 2001 and came into effect on an interim basis. 6/ The EU signed a Stabilization and Association Agreement with Macedonia on April 9, 2001. However, unlike Croatia,Macedonia is not a member of CEFTA (Appendix Table I.3).
Trade Agreements Selected Trade Preferences 1/
Appendix Table I.2. European Union: Schedule of Trade Preferences, 1990–2005

32
Bul
garia
Cro
atia
Cze
ch R
epub
licEs
toni
aH
unga
ryLa
tvia
Li
thua
nia
Pola
ndR
oman
iaSl
ovak
Rep
ublic
Slov
enia
Ukr
aine
Tu
rkey
Reg
iona
l and
uni
late
ral a
gree
men
ts20
03 -
2006
Euro
pe A
gree
men
t2/19
9420
0119
92-2
003
1995
-200
319
92-2
003
1995
-200
319
95-2
003
1992
-200
319
9319
92-2
003
1997
-200
3EU
Cus
tom
s Uni
on19
96 Ja
nuar
yEU
acc
essi
on 3/
2007
2004
2004
2004
2004
2004
2004
2004
2004
May
FTA
with
EFT
A c
ount
ries
1993
2001
1992
1996
1994
1996
1996
1994
1993
1992
1995
July
1993
Janu
ary
Bal
tic F
ree
Trad
e A
gree
men
tEs
toni
a19
9419
94La
tvia
1994
1994
Lith
uani
a19
9419
94C
EFTA
1999
2003
1993
1993
1993
1997
1993
1996
Bul
garia
2003
1999
1999
1999
1999
1999
1999
Cro
atia
2003
2003
2003
2003
2003
2003
2003
Cze
ch R
epub
lic19
9920
0319
9319
9319
9719
9319
96H
unga
ry19
9920
0319
9319
9319
9719
9319
96Po
land
1999
2003
1993
1993
1997
1993
1996
Rom
ania
1999
2003
1997
1997
1997
1997
1997
Slov
ak R
epub
lic19
9920
0319
9319
9319
9319
9719
96Sl
oven
ia19
9920
0319
9619
9619
9619
9719
96C
omm
onw
ealth
of I
ndep
ende
nt S
tate
s19
94B
ilate
ral a
gree
men
ts a
nd C
EFTA
Alb
ania
2003
2003
2004
Arm
enia
1997
Bos
nia
2001
2005
2002
Bul
garia
2002
1996
2002
1997
2003
2002
1999
1999
(4)
1999
(4)
1999
(4)
1999
Cro
atia
2002
2002
2001
2003
(4)
2003
(4)
2002
1998
Cze
ch R
epub
lic19
9620
0219
9619
93 (4
)19
9619
9719
93 (4
)19
97 (4
)19
9319
96 (4
)19
98Es
toni
a20
0219
9619
9819
94 (5
)19
94 (5
)19
9919
9619
9719
9619
98Fa
roe
Isla
nds 6
/19
9819
99G
eorg
ia19
96H
unga
ry19
9720
0119
93 (4
)19
9820
0020
0019
93 (4
)19
97 (4
)19
93 (4
)19
96 (4
)19
98Is
rael
2002
1996
1998
1999
2001
1997
1997
Kyr
kyz
Rep
ublic
1998
Latv
ia20
0319
9619
94 (5
)20
0019
94 (5
)19
94 (5
)19
9919
9719
9719
96Li
thua
nia
2002
1997
1994
(5)
2000
1994
(5)
1997
1997
1997
1998
Mac
edon
ia20
0019
9720
0420
0220
00M
oldo
va19
9620
0419
95Po
land
1999
2003
(4)
1993
(4)
1999
1993
(4)
1999
1997
1997
(4)
1993
(4)
1996
(4)
1996
Rom
ania
1999
(4)
2003
(4)
1997
1997
(4)
1997
(4)
1997
(4)
1997
(4)
1998
Serb
ia a
nd M
onte
negr
o20
0320
0420
04Sl
ovak
Rep
lubl
ic19
99 (4
)20
0219
9319
9619
93 (4
)19
9719
9719
93 (4
)19
97 (4
)19
96 (4
)19
98Sl
oven
ia19
99 (4
)19
9819
96 (4
)19
9719
96 (4
)19
9719
9719
96 (4
)19
97 (4
)20
00So
uth
Afr
ica
2003
Ukr
aine
1996
Turk
ey19
9920
0219
9819
9819
9819
9619
9819
9619
9819
9820
00
Sour
ce: W
TO, v
ario
us y
ears
,, Tr
ade
Polic
y Re
view
s, a
nd D
arth
mou
th d
atab
ase
avai
labl
e at
, ht
tp://
mba
.tuck
.dar
tmou
th.e
du/c
ib/re
sear
ch/tr
ade_
agre
emen
ts.h
tml.
Not
e: A
gree
men
ts e
nter
ing
into
forc
e du
ring
Nov
embe
r-D
ecem
ber a
re li
sted
as e
ffect
ive
durin
g th
e fo
llow
ing
year
.
1/ A
gree
men
ts th
at o
ffici
ally
ent
red
into
forc
e in
Oct
ober
or l
ater
of a
ny y
ear a
re in
the
econ
omet
ric a
naly
sis a
ssum
ed to
hav
e be
com
e ef
fect
ive
durin
g th
e fo
llow
ing
year
.2/
Incl
udin
g in
terim
impl
emen
tatio
n.3/
Upo
n ac
cess
ion
to th
e EU
, all
bila
tera
l and
regi
onal
agr
eem
ents
wer
e su
pers
eded
by
the
EU e
xter
nal a
gree
men
ts.
4/ U
pon
acce
ssio
n to
CEF
TA.
5/ U
pon
entry
into
forc
e of
the
Bal
tic F
ree
Trad
e A
gree
men
t.6/
Not
incl
uded
in th
e re
gres
sion
s due
to a
lack
of d
ata.
App
endi
x T
able
I.3.
Reg
iona
l and
Bila
tera
l Tra
de A
gree
men
ts o
f Sel
ecte
d E
urop
ean
Cou
ntri
es (Y
ear
they
ent
ered
into
forc
e) 1
990–
2005
1/

33
Alb
ania
Bos
nia
Her
zego
vina
Mac
edon
iaSe
rbia
and
Mon
tene
gro
Mol
dova
Stan
dard
Exce
ptio
ns
Reg
iona
l and
uni
late
ral a
gree
men
tsEF
TA19
90-o
ngoi
ngEF
TA-E
U A
gree
men
t19
90-o
ngoi
ngW
este
rn B
alka
n Tr
ade
Pref
eren
ces
2001
2001
2001
2001
Com
mon
wea
lth o
f Ind
epen
dent
Sta
tes
1990
-ong
oing
Trad
e em
barg
o w
ith a
ll tra
ding
par
tner
s19
99-2
000
Bila
tera
l agr
eem
ents
and
CEF
TAA
lban
ia20
0520
0220
0420
05A
rmen
ia19
96B
osni
a20
0520
02B
ulga
ria20
0320
0319
9619
93-2
006
Chi
le20
04C
roat
ia20
0320
0120
0419
92C
zech
Rep
ublic
1992
-200
3Es
toni
a19
96-2
003
Faro
e Is
land
s 2/
1993
Switz
erla
nd 1
995
Geo
rgia
Hun
gary
1994
-200
3Ic
elan
d20
01Is
rael
1993
Jord
an20
02K
yrky
z R
epub
lic19
97K
osov
o (U
NM
IK) 2
/20
03La
tvia
1996
-200
3Li
thua
nia
1996
-200
3M
aced
onia
2002
2002
2001
Mex
ico
01/0
1/01
Mol
dova
2005
Mor
occo
2000
Pale
stin
e19
99Po
land
1994
-200
3R
oman
ia20
0419
9519
93-2
006
Serb
ia a
nd M
onte
negr
o20
04Si
ngap
ore
2003
Slov
ak R
eplu
blic
1992
-200
3Sl
oven
ia20
0219
95-2
003
Sout
h A
fric
aU
krai
neTu
rkey
2003
1993
Icel
and
1992
1/ A
gree
men
ts in
ital
ics b
ecam
e ef
fect
ive
durin
g N
ovem
ber -
Dec
embe
r of t
he p
revi
ous y
ear.
2/ N
ot in
clud
ed in
the
quan
titiv
e an
alys
is d
ue to
a la
ck o
f dat
a.
Sour
ce: W
TO, v
ario
us y
ears
,, Tr
ade
Polic
y Re
view
s, a
nd D
arth
mou
th d
atab
ase
avai
labl
e at
, ht
tp://
mba
.tuck
.dar
tmou
th.e
du/c
ib/re
sear
ch/tr
ade_
agre
emen
ts.h
tml.
Wes
tern
Bal
kans
(ex
clud
ing
Cro
atia
)EF
TA
App
endi
x T
able
I.4.
Sel
ecte
d E
urop
ean
Cou
ntri
es:
Reg
iona
l and
Bila
tera
l Tra
de A
gree
men
ts, 1
990–
2005

34
APPENDIX II: UNIT ROOT TEST AND SELECTED STATIC MODEL RESULTS
1. Prior to testing for unit roots, we aggregate data. The unit root test cannot be done on the complete disaggregate data set because the cross-section dimension has over 100 observations and contains gaps for years during which trading partners did not trade. By contrast, the time dimension is only 16 years. A panel unit root test had advantages over a time-series unit root test because the panel data provide sufficient data for efficient and robust test results. But if the number of cross-sector observations is too large and time dimension is too small, there will be too much “noise information.” By aggregating the data in a sensible way, the number of cross-sector observations can be dramatically reduced, so that we can obtain a sufficiently smooth time-series cross-section. Furthermore, as we have only 16 years of data, the variation in a single country's series is too small to be applicable for a unit root test. By aggregating our data, we exploit the panel characteristics and generate a sufficiently large time dimension in series.
2. We conduct a unit root test for EU-CEE trade flows over the 1990–2005 period. We selected these trade flows because the impact of the European trade agreements on these trade flows is the main focus of our paper and data are available for all years. The test is applied to the imports from the EU to the CEE-8 countries during the period 1990–2005. Furthermore, we exclude Belgium and Luxemburg from the sample of EU-15 countries so that our total number of observations is 13 for a period of 16 years.
Appendix Table II.1. Results of Unit Root Tests on Trade and GDP LLC IPS Hadri Pesaran Ln(import) Without time trend -8.327** -4.367** 23.900** -1.596* With time trend -8.518** -3.819** - - Ln(GDP*GDP) Without time trend -3.696** -1.974** 24.994** -1.419* With time trend -9.626** -3.483** - - Ln(import)/Ln(GDP*GDP) -7.655** -3.048** 19.861** -2.587** -9.951** -3.664** - -
Source: Author's estimates. Note 1: We do an AR(2) process unit root test, using two methods. First, the lag length of the autocorrelation process is chosen by a F-test. We started with testing down from a lag length of four in our dynamic panel regression. If the highest-order lag is insignificant in our regression results, then we reduce the order by one and we end up with AR(2). The second method is the Akaika information criterion (AIC) method, where the minimized AIC is achieved at AR(2) too. Hence, results of both tests are consistent. Note 2: The reported Hadri test assumes homoscedastic disturbances across units. Hadri also carries out test results with different assumptions for the error term, and they also reject stationarity for both trade and GDP. * indicates rejecting the null hypothesis at 5 percent significant level; ** indicates a 1 percent level.
35
3. We interpret the result reported in Appendix Table II.1 as follows. If the tested theta (ө) in the equation below is not equal to zero, the yit is not a nonstationary process. All the test statistics in the above table, are distributed as standard normal distribution N(0,1). The Levin, Lin and Chu test and the Im, Pesaran & Shin test universally rejected the H0 hypothesis which is there is a unit root in Yit (ln(import), ln(GDPi*GDPj). Both of them have large t-statistics. But these results should be interpreted with caution because both tests recommend a panel with T>=25 and T<=250 in order to fit to the asymptotic statistic distribution well; otherwise, we may draw the wrong inference. Also, they both crucially depend on the cross-sectional independence assumption. Given the above limitations, we rely more on our test results from the next two tests, both of which support a nonstationary hypothesis. Note that the null hypothesis of the Hadri (2000) test is that the yit is a stationary process and thus a large t-value means a rejection of stationary and indicates non-stationarity (unit roots); the null hypothesis of the Pesaran (2003) test is a nonstationary process, and thus a small t-value means acceptance of the null hypothesis and is thus an indication of nonstationarity. Our findings partially support unit roots on the log imports and log GDP multiples. Three of the four unit root tests in the last panel of Appendix Table II.1 reject non-stationary on Ln(import)/Ln(GDP*GDP), the Hadri test being the exception. Hence, the balance of the evidence suggests that imports and GDP are cointegrated.
11
iP
it it iL it L mi mt itL
y y y dθ ρ α ε− −=
Δ = + Δ + +∑ 1, 2,3m =
where mtd are specified as { }1td empty= , { }2 1td = , and { }3 1,td t= to model with or without the constant, and with or without time-trend effects23.
23 For a detailed equation specification, please refer to Baltagi (2005).

36
Model 1 Model 2 Model 3 Static Model
One-way random effects One-way fixed effectsOne-way random effects
with year dummies Two-way fixed effects
EU and Europe Agreement countriesImports into EU 0.22 0.34 0.31 0.30
[7.64]** [10.76]** [10.06]** [9.24]**Imports into Central and Eastern Europe 0.54 0.62 0.60 0.58
[19.00]** [19.06]** [20.10]** [17.18]**EU and customs union
Imports into EU 0.63 0.77 0.80 0.76[10.58]** [10.91]** [12.88]** [10.58]**
Imports into customs agreement country 0.64 0.69 0.81 0.68[10.09]** [11.31]** [13.08]** [11.05]**
EU and Stability and Association Agreement (SAA)Imports into EU -0.11 0.05 0.05 0.07
[1.55] [0.71] [0.67] [0.94]Imports into SAA country -0.13 0.12 0.19 0.16
[2.22]* [2.09]* [3.45]** [2.75}**EU and Western Balkan
Imports into EU -0.34 0.11 -0.12 0.14[3.02]** [1.00] [1.06] [1.19]
Imports into Western Balkan 0.15 0.46 0.36 0.48[1.89] [5.67]** [4.94]** [5.93]**
CEFTA Both countries member of CEFTA 0.32 0.43 0.36 0.39
[8.99]** [11.25]** [9.36]** [9.79]**Both countries with bilateral agreement 0.10 0.23 0.20 0.20
[2.82]** [6.72]** [5.78]** [5.79]**EU and EFTA
EU imports from EFTA member 0.33 0.42 0.46 0.45[7.28]** [8.96]** [10.98]** [9.60]**
EFTA imports from EU member 0.40 0.51 0.51 0.55[9.94]** [12.62]** [13.62]** [13.32]**
EU membership 0.38 0.67 0.71 0.70[13.47]** [20.49]** [23.22]** [20.99]**
Euro adoption 0.04 0.10 0.23 0.15[2.54]* [7..99]** [14.19]** [9.78]**
GDPO*GDPP 0.819 0.526 1.004 0.60[28.86]**
Lagged import no-
Controls for other trade agreements yes yes yes yesCountry fixed effect yes yes yes yesYear fixed effect no no yes yes
No. of Obervations 71,860 71,960 71,860 71,960No. of Groups 6,072 6,080 6,072 6,080R 2 0.70 0.65 0.72 0.65
Hausman tests statistics 2,717 1,594
Source: Authors' estimates. Note: Robust t-statistics in brackets; * significant at 5%; ** significant at 1%
Appendix Table II.2. Random effect models and Haussman Test Results

37
App
endi
x T
able
III.1
. Im
pact
of E
urop
ean
Tra
de A
gree
men
ts o
n B
ilate
ral T
rade
, 199
0–20
06 (p
erce
nt c
ontr
ibut
ion
to g
row
th)
1992
1993
1994
1995
1996
1997
1998
1999
2000
2001
2002
2003
2004
2005
EU a
nd E
urop
e A
gree
men
t cou
ntrie
sIm
ports
into
EU
-0.2
73-0
.381
-0.0
710.
090.
096
0.03
50.
112
0.28
40.
424
0.52
10.
546
0.55
70.
613
0.59
7[2
.40]
*[4
.48]
**[1
.35]
[1.9
6]*
[2.1
5]*
[0.7
8][2
.14]
*[5
.89]
**[8
.55]
**[1
0.02
]**
[10.
91]*
*[1
0.80
]**
[8.1
3]**
[6.9
1]**
Impo
rts in
to C
entra
l and
Eas
tern
Eur
ope
-0.2
65-0
.032
0.12
80.
244
0.34
10.
401
0.51
50.
612
0.66
20.
726
0.77
80.
767
0.94
21.
019
[2.2
3]*
[0.4
1][1
.95]
[5.2
2]**
[7.6
3]**
[9.4
9]**
[12.
66]*
*[1
4.84
]**
[15.
52]*
*[1
6.93
]**
[17.
59]*
*[1
6.55
]**
[11.
01]*
*[1
2.59
]**
EU a
nd c
usto
ms u
nion
1/
Impo
rts in
to E
U0.
236
0.38
0.44
20.
668
0.56
40.
809
0.83
0.60
11.
152
1.22
5[2
.39]
**[3
.40]
**[3
.68]
**[6
.53]
**[5
.30]
**[7
.65]
**[7
.89]
**[4
.30]
**[8
.93]
**[8
.49]
**Im
ports
into
cus
tom
s agr
eem
ent c
ount
ry0.
532
0.56
30.
607
0.58
60.
658
0.73
40.
591
0.60
90.
90.
764
[8.8
7]**
[9.2
7]**
[8.5
8]**
[7.9
9]**
[8.4
1]**
[8.0
2]**
[9.4
9]**
[9.2
7]**
[8.2
8]**
[3.7
0]**
EU a
nd W
este
rn B
alka
nIm
ports
into
EU
0.29
90.
108
0.20
20.
144
0.01
5[1
.85]
[0.6
5][1
.08]
[0.8
4][0
.08]
Impo
rts in
to W
este
rn B
alka
n0.
564
0.66
0.53
60.
423
0.36
6[4
.27]
**[6
.28]
**[5
.74]
**[3
.80]
**[2
.54]
**
1/
Cov
erin
g th
e pe
riod
that
the
EU h
ad c
usto
ms u
nion
agr
eem
ents
with
bot
h M
alta
and
Tur
key.
Sour
ce: A
utho
rs' e
stim
ate's
.
App
endi
x T
able
III.2
. Im
pact
of E
urop
ean
Tra
de A
gree
men
ts o
n B
late
ral T
rade
, Coh
ort A
naly
sis
(per
cent
con
trib
utio
n to
gro
wth
) 1/
12
34
56
78
910
1112
13EU
and
Eur
ope
Agr
eem
ent c
ount
ries (
earli
est s
tarti
ng a
t yea
r 199
2)Im
ports
into
EU
0.10
60.
089
0.08
30.
136
0.21
50.
306
0.40
90.
518
0.60
20.
771
0.77
30.
843
0.93
3[2
.26]
*[1
.89]
[1.9
6]*
[2.7
0]**
[4.9
0]**
[6.5
0]**
[8.0
7]**
[10.
04]*
*[1
1.13
]**
[13.
02]*
*[1
4.03
]**
[15.
70]*
*[6
.95]
**Im
ports
into
Cen
tral a
nd E
aste
rn E
urop
e0.
327
0.34
40.
396
0.47
40.
531
0.6
0.69
40.
811
0.85
0.97
31.
056
1.04
11.
381
[6.6
1]**
[7.5
6]**
[9.5
5]**
[11.
69]*
*[1
3.44
]**
[15.
15]*
*[1
7.26
]**
[19.
09]*
*[1
8.60
]**
[17.
66]*
*[1
8.41
]**
[18.
26]*
*[1
3.18
]**
EU a
nd c
usto
ms u
nion
2/
Impo
rts in
to E
U0.
389
0.39
70.
551
0.78
50.
702
0.87
90.
642
0.73
40.
922
1.05
1[3
.43]
**[4
.50]
**[5
.79]
**[4
.68]
**[7
.95]
**[7
.34]
**[5
.80]
**[5
.97]
**[7
.07]
**[8
.39]
**Im
ports
into
cus
tom
s agr
eem
ent c
ount
ry0.
557
0.60
10.
636
0.74
40.
812
0.63
90.
625
0.63
50.
811
0.66
7[8
.69]
**[8
.32]
**[8
.91]
**[1
0.10
]**
[11.
10]*
*[1
0.14
]**
[9.7
3]**
[9.7
0]**
[9.2
3]**
[4.6
0]**
Sour
ce: A
utho
rs' e
stim
ates
.
1/
We
didn
't do
the
Coh
ort r
egre
ssio
n fo
r Wes
tern
Bal
kan
sinc
e al
l the
Wes
tern
Bal
kan
coun
tries
has
the
WB
TP st
arte
d at
the
sam
e ye
ar 2
001.
2/
Cov
erin
g th
e pe
riod
that
the
EU h
ad c
usto
ms u
nion
agr
eem
ents
with
bot
h M
alta
and
Tur
key.
Yea
r afte
r agr
eem
ent t
ook
effe
ct

38
Appendix Table III.3. Selected Trade Agreements and Countries: Trade Policy Performance of Imports into EU Trading Partners
1992 1993 1994 1995 1996 1997 1998 1999 2000 2001 2002 2003 2004 2005
Average -0.265 -0.032 0.128 0.244 0.341 0.401 0.515 0.612 0.662 0.726 0.778 0.767 0.942 1.019
[2.23]* [0.41] [1.95] [5.22]** [7.63]** [9.49]** [12.66]** [14.84]** [15.52]** [16.93]** [17.59]** [16.55]** [11.01]** [12.59]**Bulgaria 0.347 -0.114 -0.11 -0.245 -0.018 0.288 0.33 0.456 0.441 0.461 0.576 0.674
[2.42]* [0.91] [1.05] [2.32]* [0.20] [2.50]* [2.47]* [4.07]** [3.84]** [3.68]** [5.66]** [6.08]**Czech Republic -0.176 -0.145 0.164 0.357 0.22 0.364 0.561 0.685 0.725 0.7 0.662 0.737 0.797
[0.98] [0.88] [1.32] [3.19]** [1.83] [3.48]** [5.42]** [6.48]** [6.91]** [6.41]** [5.77]** [8.06]** [7.85]**Estonia 0.533 0.714 0.929 0.905 0.856 0.946 1.173 1.199 1.204 1.088 1.082
[4.67]** [6.36]** [8.38]** [7.40]** [7.10]** [8.15]** [9.29]** [9.81]** [9.32]** [7.99]** [8.63]**Hungary 0.004 0.225 0.436 0.551 0.425 0.658 0.843 1.063 1.126 1.052 1.036 1.007 1.071 1.144
[0.02] [1.49] [3.69]** [5.43]** [4.18]** [6.45]** [8.19]** [9.67]** [9.30]** [9.22]** [9.42]** [8.87]** [10.24]** [9.36]**Latvia 0.449 0.66 0.799 1.036 0.94 1.062 1.092 1.198 1.202 1.083 1.305
[2.73]** [4.43]** [5.42]** [7.35]** [6.13]** [7.02]** [7.31]** [7.69]** [7.70]** [7.80]** [9.41]**Lituania 0.44 0.558 0.731 0.69 0.725 0.653 0.769 0.921 0.963 0.876 0.828
[2.13]* [2.89]** [4.52]** [4.76]** [4.97]** [4.26]** [4.89]** [6.12]** [5.60]** [5.29]** [6.48]**Poland 0.061 0.407 0.459 0.564 0.702 0.811 0.895 1.022 0.963 0.945 1.019 1.048 1.137 1.136
[0.30] [2.08]* [2.82]** [4.66]** [5.83]** [6.80]** [7.12]** [7.95]** [7.35]** [7.23]** [7.47]** [7.58]** [9.91]** [8.69]**Romania 0.489 0.408 0.65 0.733 0.712 0.902 0.995 1.121 1.229 1.301 1.396 1.339 1.409
[3.04]** [2.87]** [5.45]** [5.93]** [6.04]** [7.57]** [8.70]** [9.13]** [10.16]** [9.93]** [9.62]** [9.09]** [10.52]**Slovak Republic -0.354 -0.222 -0.03 0.129 0.321 0.416 0.448 0.552 0.662 0.798 0.652 0.636 0.79
[1.74] [1.44] [0.20] [1.92] [2.66]** [3.50]** [3.51]** [4.26]** [4.70]** [5.38]** [4.88]** [5.44]** [5.83]**Slovenia 0 0.03 0.12 0.269 0.291 0.29 0.344 0.306 0.41 0.497
0 [0.47] [2.00]* [3.98]** [4.68]** [4.46]** [4.27]** [4.45]** [4.07]** [3.42]**Customs Union
Average 0.532 0.563 0.607 0.586 0.658 0.734 0.591 0.609 0.9 0.764[8.87]** [9.27]** [8.58]** [7.99]** [8.41]** [8.02]** [9.49]** [9.27]** [8.28]** [3.70]**
Turkey 0.522 0.644 0.588 0.72 0.836 0.616 0.689 0.766 0.925 0.789[7.93]** [9.79]** [9.03]** [7.72]** [8.64]** [8.69]** [9.03]** [10.78]** [8.29]** [3.73]**
Stabilization and Association AgreementsAverage 0.097 0.132 0.178 0.17 0.188
[1.33] [1.84] [2.13]* [1.63] [1.99]*Croatia 0.227 0.362 0.479 0.301 0.383
[3.48]** [4.49]** [4.95]** [0.195] [3.22]**Macedonia (FYROM) -0.329 -0.381 -0.395 -0.256 -0.29
[2.63]** [3.79]** [3.77]** [1.92] [2.11]*Western Balkan Trade Policy
Average 0.564 0.66 0.536 0.423 0.366[4.27]** [6.28]** [5.74]** [3.80]** [2.54]**
Albania 0.854 0.997 0.72 0.568 0.677[2.76]** [4.68]** [4.29]** [2.53]* [2.23]*
Bosnia 0.345 0.434 0.412 0.225 0.582[2.39]* [3.03]** [2.57]* [1.31] [3.60]**
Serbia and Montenegro 0.288 0.342 0.27 0.364 -0.406[2.06]* [2.62]** [2.27]* [2.58]** [2.13]*
Source: Authors' estimates.
Note: For countries that later joined the EU, we use the estimates of the effect of EU.

39
Appendix Table III.4. Selected Trade Agreements and Countries: Trade Policy Performance of Imports into EU
1992 1993 1994 1995 1996 1997 1998 1999 2000 2001 2002 2003 2004 2005Europe Agreements
Average -0.273 -0.381 -0.071 0.09 0.096 0.035 0.112 0.284 0.424 0.521 0.546 0.557 0.613 0.597[2.40]* [4.48]** [1.35] [1.96]* [2.15]* [0.78] [2.14]* [5.89]** [8.55]** [10.02]** [10.91]** [10.80]** [8.13]** [6.91]**
Bulgaria 0.146 0.262 0.19 0.192 0.106 0.084 0.116 0.236 0.369 0.264 0.303 0.341[1.08] [2.00]* [1.71] [1.65] [1.08] [0.62] [0.83] [2.05]* [2.93]** [2.06]* [2.90]** [3.03]**
Czech -0.32 -1.89 -0.154 -0.179 -0.073 0.143 0.369 0.529 0.648 0.631 0.641 0.446 0.545[2.23]* [1.55] [1.41] [1.62] [0.78] [1.43] [3.47]** [4.88]** [5.26]** [5.49]** [6.07]** [5.03]** [4.94]**
Estonia 0.369 0.333 0.351 0.636 0.729 0.911 0.94 1.122 1.135 0.966 0.773[2.44]* [1.98]* [1.88] [3.83]** [5.05]** [4.98]** [5.10]** [6.18]** [5.87]** [6.79]** [4.86]**
Hungary -0.16 -0.224 -0.022 0.19 0.303 0.452 0.759 0.906 1.014 1.024 0.948 0.926 0.749 0.892[0.96] [1.56] [0.18] [1.77] [3.03]** [4.33]** [5.53]** [6.00]** [7.44]** [8.34]** [9.41]** [9.41]** [7.00]** [9.26]**
Latvia 0.108 0.236 0.159 0.024 0.268 0.335 0.631 0.546 0.449 0.553 0.572[0.62] [1.45] [0.87] [0.09] [1.59] [1.77] [3.06]** [2.83]** [2.78]** [3.47]** [3.32]**
Lituania 0.219 0.284 -0.049 -0.217 0.071 0.438 0.502 0.557 0.551 0.474 0.585[1.39] [1.85] [0.36] [0.98] [0.39] [2.57]* [3.36]** [3.38]** [3.83]** [4.31]** [4.36]**
Poland -0.54 0.017 0.082 0.054 -0.009 -0.044 0.026 0.154 0.325 0.373 0.49 0.594 0.654 0.691[0.37] [0.11] [0.71] [0.67 [0.10] [0.43] [0.30] [1.80] [3.04]** [3.35]** [3.88]** [4.80]** [5.44]** [6.01]**
Romania -0.121 0.221 0.349 0.388 0.36 0.447 0.548 0.754 0.923 0.949 1.018 1.018 0.962[0.00] [2.84]** [3.69]** [4.79]** [2.97]** [3.51]** [3.85]** [6.53]** [7.12]** [7.94]** [9.36]** [10.01]** [7.26]**
Slovak Republic -0.682 -0.131 0.045 0.069 -0.015 0.092 0.34 0.436 0.682 0.62 0.75 0.502 0.531[2.25]* [1.08] [0.36] [0.49] [0.12] [0.68] [2.72]** [3.61]** [4.75]** [4.71]** [5.37]** [5.12]** [4.92]**
Slovenia -0.081 -0.039 0.17 0.234 0.258 0.364 0.359 0.371 0.471[0.68] [0.43] [1.98]* [3.88]** [4.01]** [4.93]** [5.06]** [4.52]** [4.74]**
Customs UnionAverage 0.236 0.38 0.442 0.668 0.564 0.809 0.83 0.601 1.152 1.225
[2.39]** [3.40]** [3.68]** [6.53]** [5.30]** [7.65]** [7.89]** [4.30]** [8.93]** [8.49]**Turkey 0.228 0.342 0.428 0.657 0.593 0.926 0.95 0.99 1.18 1.253
[3.89]** [6.83]** [8.44]** [12.45]** [12.07]** [15.23]** [16.57]** [14.12]** [9.10]** [8.62]**Stabilitzation and Association Agreements
Average 0.126 -0.045 -0.032 0.013 0.196[1.17] [0.43] [0.24] [0.11] [1.64]
Croatia 0.196 0.015 0.054 0.208 0.272[1.97]* [0.14] [0.45] [1.54] [2.40]*
Macedonia (FYROM) 0.039 -0.123 -0.134 -0.205 0.1[0.20] [0.68] [0.57] [1.02] [0.47]
Western Balkan Trade PolicyAverage 0.299 0.108 0.202 0.144 0.015
[1.85] [0.65] [1.08] [0.84] [0.08]Albania -0.687 -0.645 -0.938 -0.903 -0.74
[3.08]** [3.21]** [3.31]** [2.88]** [2.44]*Bosnia 1.53 1.12 1.376 1.162 1.233
[5.97]** [3.68]** [6.15]** [5.43]** [3.64]**Serbia and Montenegro 0.013 -0.115 0.225 0.214 -0.476
[0.08] [0.47] [0.88] [1.05] [2.19]*
Source: authors' estimates.
Note: for countries later joined EU, we use the estimates of the effect of EU.
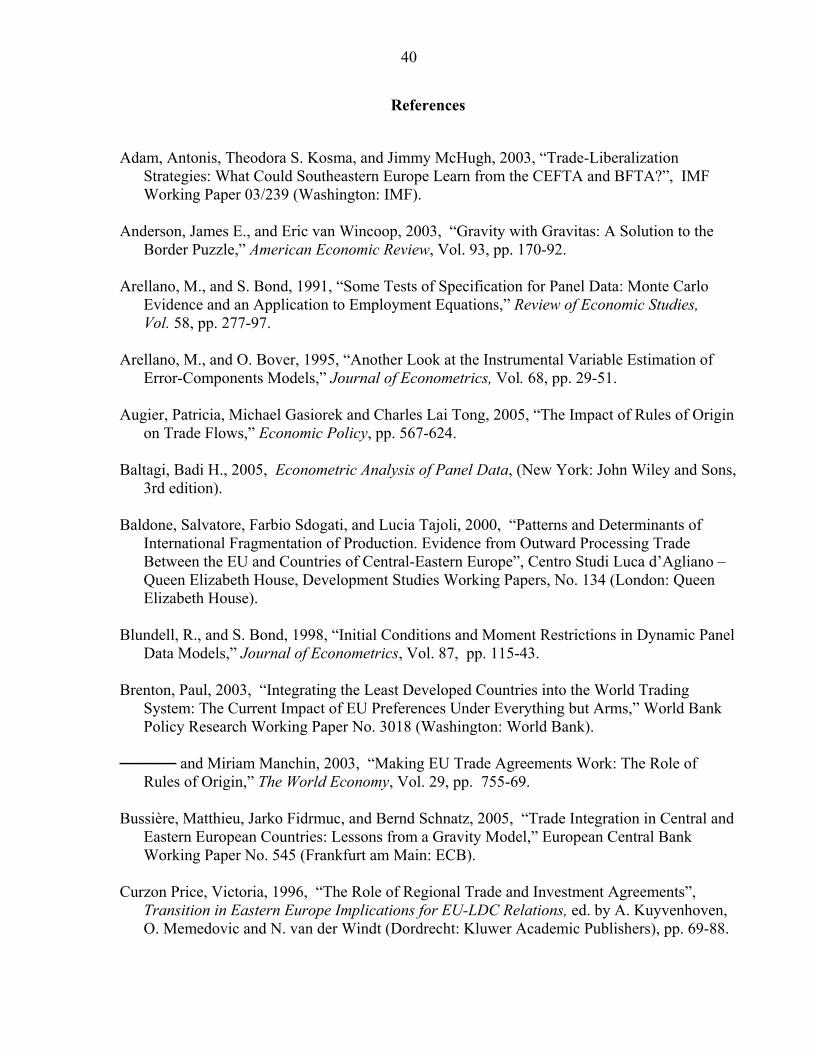
40
References
Adam, Antonis, Theodora S. Kosma, and Jimmy McHugh, 2003, “Trade-Liberalization
Strategies: What Could Southeastern Europe Learn from the CEFTA and BFTA?”, IMF Working Paper 03/239 (Washington: IMF).
Anderson, James E., and Eric van Wincoop, 2003, “Gravity with Gravitas: A Solution to the
Border Puzzle,” American Economic Review, Vol. 93, pp. 170-92. Arellano, M., and S. Bond, 1991, “Some Tests of Specification for Panel Data: Monte Carlo
Evidence and an Application to Employment Equations,” Review of Economic Studies, Vol. 58, pp. 277-97.
Arellano, M., and O. Bover, 1995, “Another Look at the Instrumental Variable Estimation of
Error-Components Models,” Journal of Econometrics, Vol. 68, pp. 29-51. Augier, Patricia, Michael Gasiorek and Charles Lai Tong, 2005, “The Impact of Rules of Origin
on Trade Flows,” Economic Policy, pp. 567-624. Baltagi, Badi H., 2005, Econometric Analysis of Panel Data, (New York: John Wiley and Sons,
3rd edition). Baldone, Salvatore, Farbio Sdogati, and Lucia Tajoli, 2000, “Patterns and Determinants of
International Fragmentation of Production. Evidence from Outward Processing Trade Between the EU and Countries of Central-Eastern Europe”, Centro Studi Luca d’Agliano – Queen Elizabeth House, Development Studies Working Papers, No. 134 (London: Queen Elizabeth House).
Blundell, R., and S. Bond, 1998, “Initial Conditions and Moment Restrictions in Dynamic Panel
Data Models,” Journal of Econometrics, Vol. 87, pp. 115-43. Brenton, Paul, 2003, “Integrating the Least Developed Countries into the World Trading
System: The Current Impact of EU Preferences Under Everything but Arms,” World Bank Policy Research Working Paper No. 3018 (Washington: World Bank).
───── and Miriam Manchin, 2003, “Making EU Trade Agreements Work: The Role of
Rules of Origin,” The World Economy, Vol. 29, pp. 755-69. Bussière, Matthieu, Jarko Fidrmuc, and Bernd Schnatz, 2005, “Trade Integration in Central and
Eastern European Countries: Lessons from a Gravity Model,” European Central Bank Working Paper No. 545 (Frankfurt am Main: ECB).
Curzon Price, Victoria, 1996, “The Role of Regional Trade and Investment Agreements”,
Transition in Eastern Europe Implications for EU-LDC Relations, ed. by A. Kuyvenhoven, O. Memedovic and N. van der Windt (Dordrecht: Kluwer Academic Publishers), pp. 69-88.

41
Baldwin, Richard and Daria Taglioni, 2006, “Gravity for Dummies and Dummies for Gravity Equations,” presented at IMF seminar Washington, August 24.
Dee, Philippa, and Jyothi Gali, 2005, “The Trade and Investment Effects of Preferential
Trading Arrangements”, International Trade in East Asia, ed. by Takatoshi Ito and Andrew K. Rose, (Chicago and London: University of Chicago Press), pp 133-70.
Emerson, Michael, 2005, “An Interim Plan for South-East Europe: Customs Union with the EU
and a Regional Schengen for the Free Movement of People,” CEPS Policy Brief No. 85 (Brussels: CEPS).
Estevadeordal, Antoni, and Kati Suominen, 2006, “Mapping and Measuring Rules of Origin
Around the World,” The Origin of Goods Rules of Origin in Regional Trade Agreements, ed. by Olivier Cadot, Antoni Estevadeordal, Akiko Suwa-Eisenmann and Thierry Verdier (Oxford: Oxford University Press), pp. 69-113.
European Commission, 2006, “The Western Balkans in Transition,” European Economy
Enlargement Paper No. 30, (Brussels: Directorate-General for Economic and Financial Affairs, European Commission) available at http://ec.europa.eu/economy_finance/index_en.htm.
Faruqee, Hamid, 2004, Measuring the Trade Effects of EMU, IMF Working Paper 04/154
(Washington: IMF). Flam, Harry, 2005, “Economic Effects of Turkey’s Membership on the European Union”,
Turkey Economic Reform & Accession to the European Union, ed. by Bernard Hoekman and Sübidey Togan, (Washington: World Bank and CEPR), pp. 341-52.
Frankel, Jeffrey A., and Shang-Jin Wei, 1995, “European Integration and the Regionalization
of World Trade and Currencies: The Economics and the Politics,” Monetary and Fiscal Policy in an Integrated Europe, ed. by Barry Eichengreen, Jeffry Frieden and Jürgen von Hagen, (Berlin: Springer), pp. 202-32.
Froot, Kenneth, and Kenneth Rogoff, 1995, “Perspectives on PPP and Long-run Real Exchange
Rates”, Handbook of International Economics, ed. By G. Grossman and K. Rogoff, (Amsterdam: Elsevier Science), pp. 1647-1688.
General Agreement on Tariffs and Trade, 1991, Trade Policy Review Hungary, Volume 1
(Geneva: GATT). ────, 1993, Trade Policy Review Poland, Vol. 1 (Geneva: GATT). Goorman, Adrien, 2005, “Duty relief and exemption control,” Customs Modernization
Handbook, ed. by Luc de Wulf and José Sokol, (Washington: World Bank), pp. 215-41.

42
Hadri, Kaddour, 2000, “Testing for Stationarity in Heterogeneous Panel Data,” Econometrics Journal, Vol. 3, pp.148-61.
Im, K.S., M.H. Pesaran and Y. Shin, 2004, “Testing for Unit Roots in Heterogeneous Panels,”
Journal of Econometrics, Vol. 115, pp. 53-74. IMF (various years), Balance of Payment Statistics (Washington, IMF). Kaminski, Bartlomiej and Francis Ng, 2006, “Turkey’s Evolving Trade Integration into Pan-
European Markets,” World Bank Policy Research Working Paper No. 3908 (Washington: World Bank).
Kernohan, David, 2006, “Reverse Balkanisation? Trade Integration in South-East Europe”
Centre for European Policy Studies, CEPS Working Document No. 249 (Brussels: CEPS). Krueger, Anne O, 1999, “Trade Creation and Trade Diversion Under NAFTA”, National
Bureau of Economic Research, Working Paper No. 7429 (Cambridge, MA: NBER). Levin, A., C.F. Lin, and C.J. Chu, 2002, “Unit Root Tests in Panel Data: Asymptotic and Finite-
Sample Properties,” Journal of Econometrics, Vol. 108, pp. 1-24. Maurel, Mathilde, and Guillaume Cheikbossian, 1997, “The New Geography of the East
European Trade,” Centre for Economic Policy Research, Discussion Paper No. 1580 (London: CEPR).
Messerlin, Patric, 2001, Measuring the Costs of Protection in Europe (Washington: Institute
for International Economics ). Michalek, D. 2005, “Poland: Stability of Trade Policy and Its Determinants,” Can Regional
Integration Arrangements Enforce Trade Discipline? The Story of EU Enlargement, ed. by Z. Drabek (Houndmills: Palgrave MacMillan), pp. 157-92. .
Naumann, E., 2006. “Comparing EU Free Trade Agreements – Rules of Origin”, ECDPM
InBrief 6I (Maastricht : ECDPM), available at http://www.ecdpm.org/inbrief6i Pedroni, Peter, 1999, “Critical Values for Cointegration Tests in Heterogeneous Panels with
Multiple Regressors,“ Oxford Bulletin of Economics and Statistics, Special Issue, pp. 653-70.
Pesaran, H., 2003, “A Simple Panel Unit Root Test in the Presence of Cross Section
Dependence”, Cambridge Working Papers in Economics No. 0346, (Cambridge: University of Cambridge).
Petrova, Iva, 2006, “Non-Observed Activity in Bosnia and Herzegovina,” Bosnia and
Herzegovina IMF Country Report No. 05/160 (Washington: IMF), pp. 50-62.
43
Roodman, D., 2006, “How to Do xtabond2: An Introduction to Difference and System GMM in Stata,” Center for Global Development, Working Paper 103 (Washington: Center for Global Development).
Rose, Andrew K, 2000, “Currency Unions Their Dramatic Effect on International Trade,”
Economic Policy, Vol. 30, pp 8-45. ────, and E. van Wincoop, 2001, “National Money as Barrier to Trade: The Real Case for
Monetary Union,” American Economic Review, Vol. 91, pp. 386-90. Söderling, Ludvig, 2005, “Is the Middle East and North Africa region achieving its trade
potential?,” IMF Working Paper 05/90 (Washington: IMF). Subramanian, Arvind and Shang-Jin Wei, 2003, “The WTO Promotes Trade, Strongly but
Unevenly,” IMF Working Paper 03/185 (Washington: IMF). Summers, R., and A. Heston, 1991, “The Penn World Table (Mark 5): An Expanded Set of
International Comparisons, 1950-88,” Quarterly Journal of Economics, Vol. 106, pp. 327-368.
Stability Pact for South Eastern Europe, 2006, “Boosting Trade and Investment in SEE Trade
Liberalization – the Regional Approach,” Trade Working Group, Summary Progress Report, December 2005-May 2006 (Brussels: Stability Pact for South East Europe).
World Trade Organization, 1998, Trade Policy Review European Union 1997 (Geneva: WTO). ────, 2003, Trade Policy Review Bulgaria 2003, (Geneva: WTO). ────, 2005, Trade Policy Review Romania 2005, (Geneva: WTO). ────, 1995 and 2001, Trade Policy Review Slovak Republic 1995 and 2001, (Geneva: WTO).