impact of airline market consolidation towards air traffic ... · impact of airline market...
TRANSCRIPT
UNIVERSITY OF SOUTH FLORIDA
IMPACT OF AIRLINE MARKET CONSOLIDATION TOWARDS AIR TRAFFIC IN
FLORIDA TTE 5620 | TERM PROJECT
MENON, NIKHIL
5/2/2014

1 INTRODUCTION
The US domestic airline passenger market has undergone tremendous amount of change since
the deregulation of 1978. Airlines have repeatedly merged to exploit and scale network
economies of scale. As of now, the latest merger to have hit the ground running is the merger
between American Airlines and US Airways, the merger of which, when successful will create
the biggest airline in the US.
There has been a massive spurt in airline market consolidation over the last decade. According to
Perry Flint (Air Transport World), “The US airline industry has always wanted to consolidate. It
tends to happen in bunches, until Washington becomes concerned and tries to block it.” The
airline market consolidation phenomenon is known to be a mixed blessing with the majority of
the upper hand at the hands of the airline companies and the consumers (airline passengers) on
the other side of the debate.
1.1 MOTIVATIONS FOR CONSOLIDATION The motivations for consolidation are often complex and manifold. Some of them are as under:
i. Airlines consolidate for maintaining cost efficiency. It is also a way in which they
extend the foothold on the market.
ii. It is usual for airlines to enter into agreements with other airlines that operate on
different markets from themselves. In doing so, they have a complimentary effect than
that of a competitive one. This leads to network expansion.
iii. A third reason why some airlines consolidate is to improve their brand image or quality
of service. These kinds of steps can usually lure rival airlines from entering into
codeshare agreements.
1.2 EFFECTS OF CONSOLIDATION Some effects of consolidations are as follows:
i. Airline mergers and/ or consolidation usually lead to lesser competing entities for a
particular market. This leads to lesser options for the customer and in such a situation,
he/ she is forced to pay a higher price for using the service.
ii. Consolidation in one end can cause a possible coordinated behaviour among the
remaining network airlines, which shall also lead to higher fares, higher fees and
limited services.
iii. Smaller markets are usually the most affected due to consolidation. It is usual to
observe a scenario where the merging airlines are both dominating that small region
and a merger leads to severe reduction in the number of flights.
1.3 RESEARCH OBJECTIVE The objective of this term paper shall be to analyze the impact of airline mergers and market
consolidation towards air traffic in Florida airports. In saying so, the term paper shall aim to
address the overall airline mergers and acquisition scenario over the last decade in the United
States. As a second stage to the paper, there shall be an attempt to assess the impact of these
mergers and acquisitions on the market – both at an overall airport level as well as at an airline
route level.

1.4 CASE STUDY & DATA SOURCE The case studies adopted for the course of this term paper are the 4 major airports in the state of
Florida. They are:
i. Miami International Airport (MIA)
ii. Orlando International Airport (MCO)
iii. Fort Lauderdale Hollywood International Airport (FLL)
iv. Tampa International Airport (TPA)
The data sources that have been referre3d to for the completion of this term paper are mainly
two:
i. Bureau of Transportation Statistics (BTS) – T100 database (accessible at:
http://www.transtats.bts.gov/DL_SelectFields.asp?Table_ID=258)
ii. Bureau of Transportation Statistics (BTS) – Airline Passengers & Traffic Data
(accessible at:
http://www.rita.dot.gov/bts/data_and_statistics/by_mode/airline_and_airports/airline_pas
sengers.html)
2 AIRLINE MERGERS AND ACQUISITIONS
Table 1 below lists all the mergers and acquisitions that have taken place in the United States
since year 2005.
TABLE 1 – LIST OF AIRLINE MERGERS
As can be seen from Table 1, a lot of mergers took place in the last 10 years, starting from year
2005. Some of the biggest legacy carrier mergers that took place in this period were the Delta –
Northwest merger of 2008 and the United – Continental merger of 2010. Both these mergers
produced airlines which were at that point, the biggest airlines in the United States. Several low
cost carriers (LCCs) merged along the same time though their effects were far lesser than that
observed with the legacy carriers.
For the purpose of this term paper, the two mergers that are going to be focused in detail are the
Air Tran – Southwest merger of 2010 and the recently announced US Airways – American
Airlines merger of 2013.
3 METHODOLOGY
The methodology adopted for the course of this term paper can be divided into the following
stages:
i. The impact of airline market consolidation will be assessed at two levels – individual
airport level in terms of the passenger and load factors; and the individual airline route
level in terms of the total passengers.
a. The main objective of this exercise shall be to see whether airline mergers have
led to highly concentrated markets at the airport or the airline route level.
ii. The evidence for market power shall be established by the Herfindahl Hirschman Index
(HHI), which will be calculated at the overall airport and route levels.
3.1 HERFINDAHL HIRSCHMAN INDEX (HHI) The Herfindahl Hirschman Index (HHI) is a commonly used tool to analyze competition by
measuring market competition. It is a tool that is not only used in the airline industry, but also
used in a variety of other fields such s marketing, business and operations research.
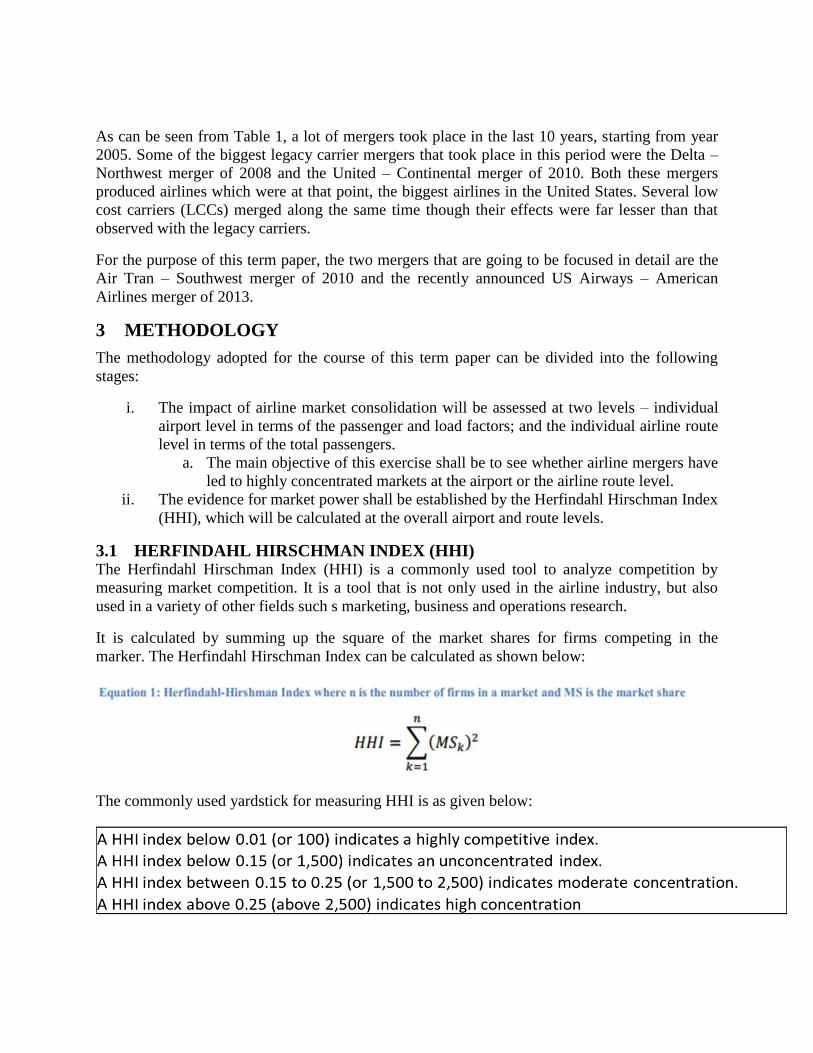
It is calculated by summing up the square of the market shares for firms competing in the
marker. The Herfindahl Hirschman Index can be calculated as shown below:
The commonly used yardstick for measuring HHI is as given below:

3.2 AIRPORT LEVEL CONCENTRATION For the analysis at the airport level, several assumptions are made for the course of this term
paper. The assumptions have been taken in order to simplify the analysis procedures in the wake
of time limitations. They are as under:
i. Airlines Analyzed: Delta, American Airlines, United Airlines, Air Tran, Southwest, US
Airways.
ii. All the other airlines, not listed in the (i) have been categorized as being in the ‘others’
category for the purpose of analysis.
iii. The first year of the AirTran – Southwest merger announcement (2010) has been taken as
the first year of the combined market share.
iv. In order to assess the impact of the proposed US Airways – American Airlines merger for
year 2013, year 2011 has been taken as the first year of the combined market share. This
has been done in order to check for the impact, as data for year 2013 is still not fully
available.
The results of the analysis conducted are as shown in the next section. Some of the results have
been shown in the next section
3.3 AIRLINE ROUTE LEVEL CONCENTRATION For the analysis at the airport level, several assumptions are made for the course of this term
paper. The assumptions have been taken in order to simplify the analysis procedures in the wake
of time limitations. They are as under:
i. Airlines Analyzed: Delta, American Airlines, United Airlines, Air Tran, Southwest, US
Airways.
ii. The first year of the AirTran – Southwest merger announcement (2010) has been taken as
the first year of the combined market share.
iii. In order to assess the impact of the proposed US Airways – American Airlines merger for
year 2013, year 2011 has been taken as the first year of the combined market share. This
has been done in order to check for the impact, as data for year 2013 is still not fully
available.
Analyzing at the airline route level, there are two possible scenarios concerning market
concentration:
i. Two airlines serving a market merge, with no other competing airlines. This leads to a
monopoly on that particular route by the merging airlines.
ii. Two airlines serving a market merge, with the existence of other competitors.
Depending on the market concentration of the merging entities, this scenario could lead
to possible market concentration effects.
The results of the analysis conducted are as shown in the next section. Some of the results have
been shown in the next section while the rest of the routes analyzed have been presented in the
appendix.

4 RESULTS
4.1 AIRPORT LEVEL CONCENTRATION At the airport level, the analysis was done in order to calculate the HHI of the airlines studied for
the purpose of this term paper. In order to do this, the market shares of each airline have been
estimated from year 2003 to 2012. The market shares have been converted into corresponding
HHI values. Once that is done, the airport level HHI is calculated for each year. Once the first set
of HHIs are generated, new HHI values with the combined market share (accounting for the
mergers) are generated. The airport level HHIs are then calculated and then the difference in HHI
is analyzed.
TABLE 2 – AIRPORT LEVEL HHI – MIA
From the first table, it can be seen that MIA has a very high HHI index. This is primarily due to
the fact that 75% of all flight operations from MIA are by American Airlines (~ 75%). A HHI
index in the excess of 6000 is an indicator of high concentration (HHI > 2500). As can be seen
from the second table, the difference in HHI [D(HHI)] at MIA is almost negligible with the
AirTran – Southwest merger, but this becomes more and more relevant with the proposed
American – US Airways merger. A difference in HHI of more than 200 is considered to be
significant.

TABLE 3 - AIRPORT LEVEL HHI – MCO
As can be seen for MCO, the change in HHI is in the range of 650, which is a significant change
that can be observed with the proposed mergers.
TABLE 4 - AIRPORT LEVEL HHI – FLL

FLL indicates concentration even before the mergers are proposed, but the proposed mergers are
set to increase the HHIs beyond the significant thresholds by only a very low margin.
TABLE 5 - AIRPORT LEVEL HHI – TPA
TPA shows a significant variation in HHI post-merger. A value of close to 750 after both the
mergers is deemed significant.
It can be noted from these analyses that pre – merger airport level HHI shows moderate
competition (1500 < HHI < 2500) in 2/4 airports. These airports are Tampa (TPA) and Orlando
(MCO). In the other two airports, Miami (MIA) and Fort Lauderdale (FLL), there is the
existence of high concentration based on the HHI values (HHI > 2500).
At the overall airport level, it can be concluded that the airline market consolidation will lead to
some newly concentrated markets. (TPA & MCO).
4.2 AIRLINE ROUTE LEVEL CONCENTRATION At the airline route level, the analysis was done in order to calculate the HHI of the routes
studied for the purpose of this term paper. In order to do this, the market shares of each airline
have been estimated from 2011 (year for analysis). The market shares have been converted into
corresponding HHI values. Once that is done, the airport level HHI is calculated for the same
year. Once the first set of HHIs are generated, new HHI values with the combined market share
(accounting for the mergers) are generated. The airport level HHIs are then calculated and then
the difference in HHI is analyzed.
For the airline route level analysis, the scenarios (discussed earlier) are presented as below:
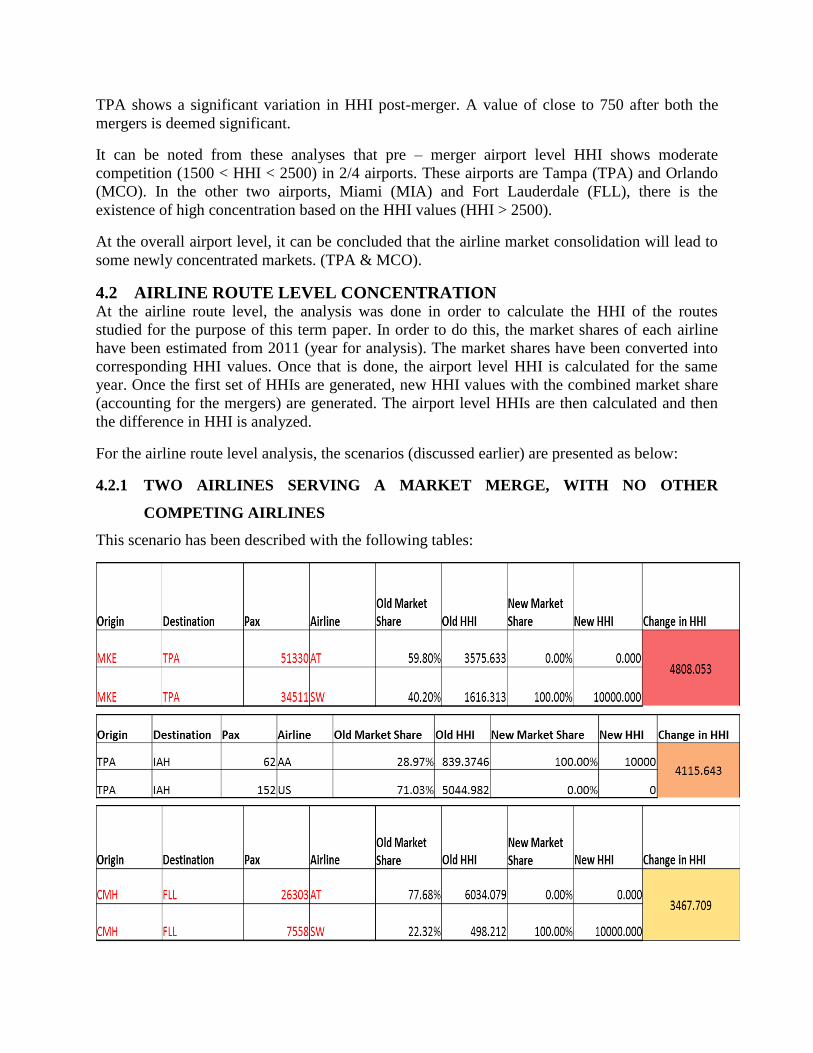
4.2.1 TWO AIRLINES SERVING A MARKET MERGE, WITH NO OTHER
COMPETING AIRLINES
This scenario has been described with the following tables:
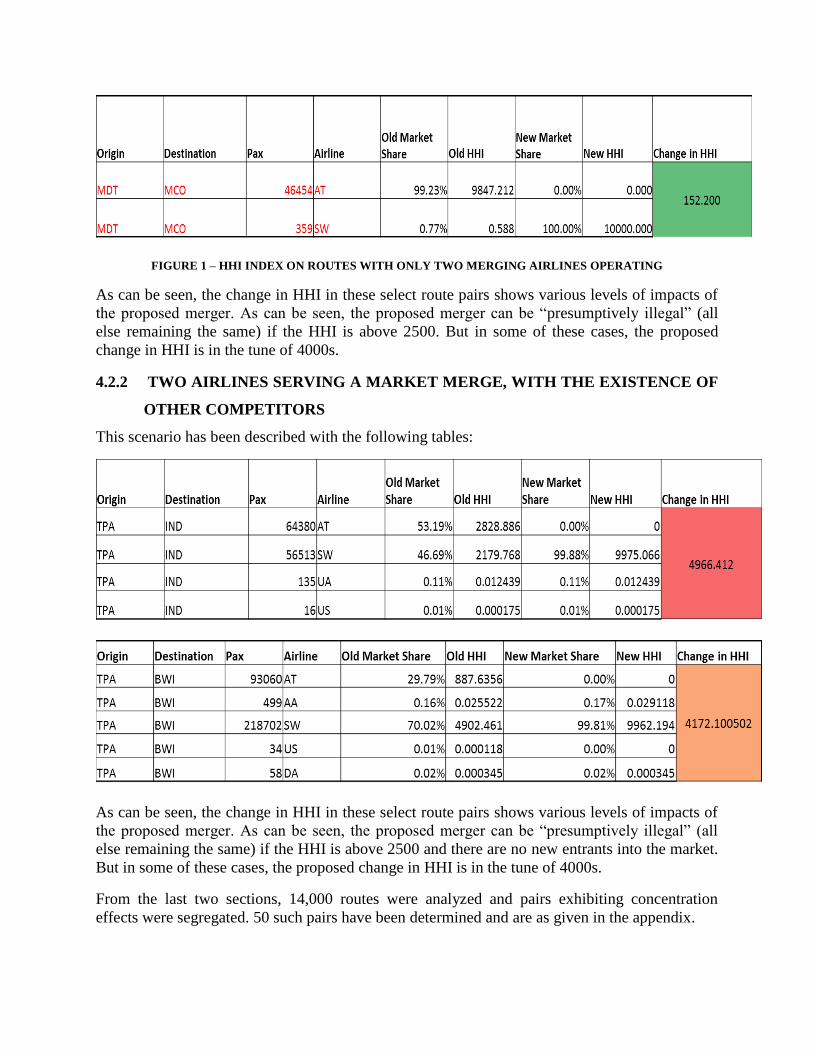
FIGURE 1 – HHI INDEX ON ROUTES WITH ONLY TWO MERGING AIRLINES OPERATING
As can be seen, the change in HHI in these select route pairs shows various levels of impacts of
the proposed merger. As can be seen, the proposed merger can be “presumptively illegal” (all
else remaining the same) if the HHI is above 2500. But in some of these cases, the proposed
change in HHI is in the tune of 4000s.
4.2.2 TWO AIRLINES SERVING A MARKET MERGE, WITH THE EXISTENCE OF
OTHER COMPETITORS
This scenario has been described with the following tables:
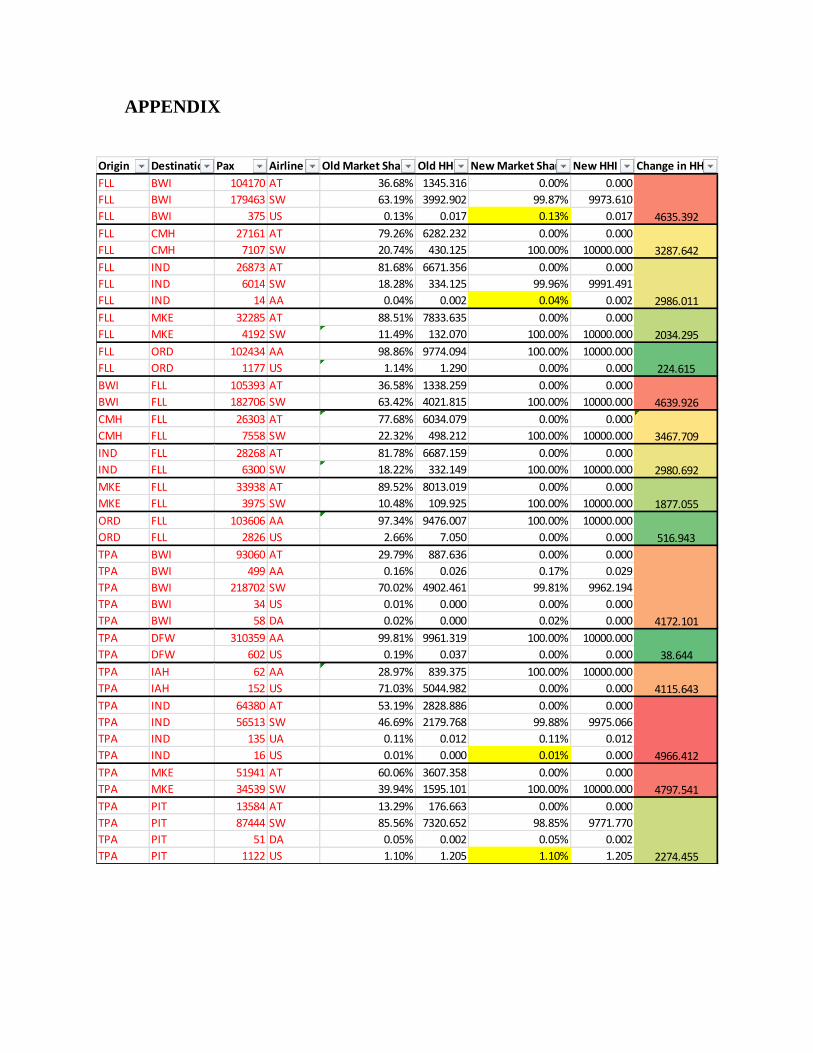
As can be seen, the change in HHI in these select route pairs shows various levels of impacts of
the proposed merger. As can be seen, the proposed merger can be “presumptively illegal” (all
else remaining the same) if the HHI is above 2500 and there are no new entrants into the market.
But in some of these cases, the proposed change in HHI is in the tune of 4000s.
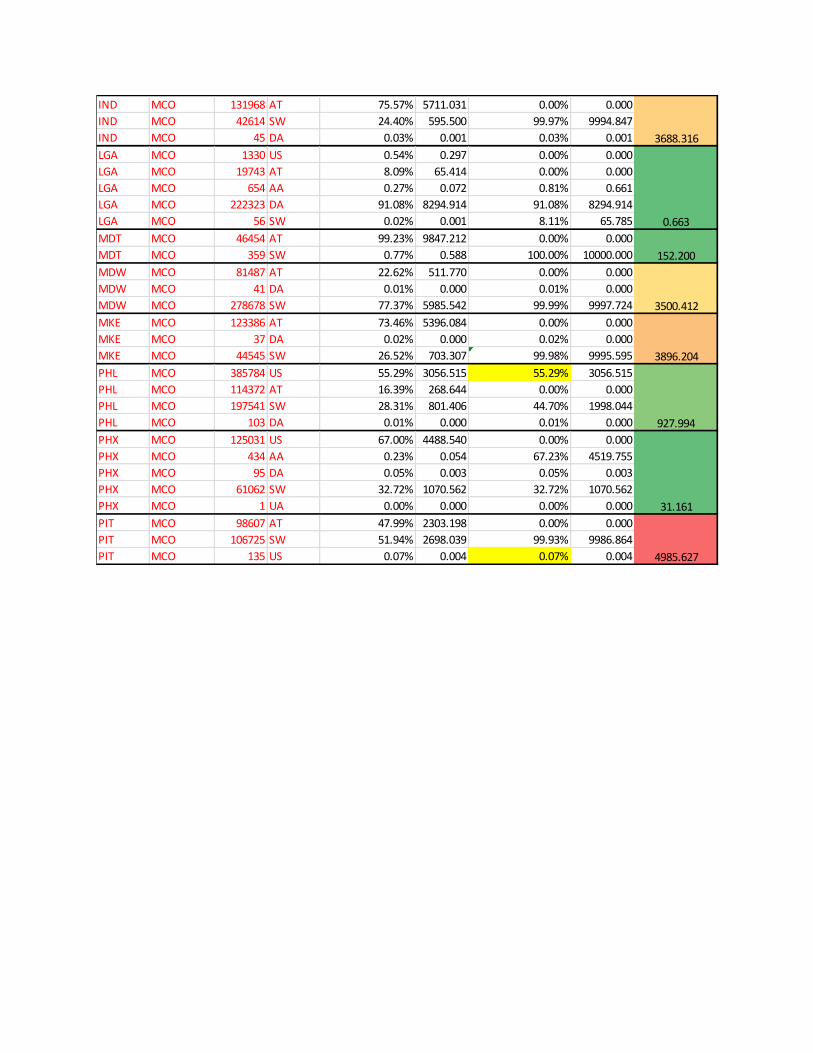
From the last two sections, 14,000 routes were analyzed and pairs exhibiting concentration
effects were segregated. 50 such pairs have been determined and are as given in the appendix.

FIGURE 2 - HHI INDEX ON ROUTES WITH MORE THAN THE TWO MERGING AIRLINES OPERATING
5 CONCLUSION
The main objective of assessing the market concentration at the airport and airline route level has
been done and the following conclusions can be summarized:
i. At the overall airport level, it can be concluded that the airline market consolidation will
lead to some newly concentrated markets. (TPA & MCO).
ii. 50 routes of 14,000 (0.357 %) routes were found to have concentration effects as a
consequence of the market consolidation.
iii. Out of these 50 routes, 29 (58%) have a HHI > 2500 which means that across these
routes, the merger is “presumptively illegal”.
iv. Airline mergers, if they increase, market concentration levels experienced by the
passengers, should be discouraged by the Department of Justice (DoJ).
6 FUTURE WORK
As part of the future work on this regard, there is a lot that could be done to enrich the research.
i. The analysis of post – merger HHI across years (with the 2012 data) to ascertain the
change in market concentration patterns (if any).
ii. Expansion from the four major airports in Florida to the rest of the airports in the state as
well. As has been discussed earlier, smaller airports have higher chances of concentration
post – merger.
iii. Expansion from single airport pair levels to city levels, encompassing all airports around
a city instead of analyzing flows from that particular airport.

7 REFERENCES
1. Schabas, M (2014). Have Airline Mergers in the United States Reduced Domestic Market
Concentration? Transportation Research Board 2014. Washington DC.
2. US Airways – American Airlines Complaint http://www.scribd.com/doc/159988211/US-
Airways-American-Airlines-Complaint
3. HHI Analysis – an Indicator of Monopoly or Fragmented Industry
http://www.danielihliu.com/blog/2012/04/03/79/
4. Bilotkach, V. Multimarket Contact and Intensity of Competition: Evidence from an Airline
Merger. Review of Industrial Organisation, 2011.
5. The Points Guy (2013). Past and Future Airline Mergers: A Brief History and
Predictions http://thepointsguy.com/2013/02/past-and-future-airline-mergers-a-brief-
history-and-predictions/
6. Airlines for America. US Airlines Mergers and Acquisitions
http://www.airlines.org/Pages/U.S.-Airline-Mergers-and-Acquisitions.aspx
7. Brumbaugh Wealth Management. Big Birds: The Potential Effects of Airline
Consolidation http://www.brumbaughwealth.com/HOT-TOPIC-Airline-
Consolidation.c4784.htm
8. Huschelrath, K., and K. Muller. Market Power, Efficiencies, and Entry - Evidence from an
Airline Merger. Undated.
APPENDIX
Origin Destination Pax Airline Old Market Share Old HHI New Market Share New HHI Change in HHI
FLL BWI 104170 AT 36.68% 1345.316 0.00% 0.000
FLL BWI 179463 SW 63.19% 3992.902 99.87% 9973.610
FLL BWI 375 US 0.13% 0.017 0.13% 0.017
FLL CMH 27161 AT 79.26% 6282.232 0.00% 0.000
FLL CMH 7107 SW 20.74% 430.125 100.00% 10000.000
FLL IND 26873 AT 81.68% 6671.356 0.00% 0.000
FLL IND 6014 SW 18.28% 334.125 99.96% 9991.491
FLL IND 14 AA 0.04% 0.002 0.04% 0.002
FLL MKE 32285 AT 88.51% 7833.635 0.00% 0.000
FLL MKE 4192 SW 11.49% 132.070 100.00% 10000.000
FLL ORD 102434 AA 98.86% 9774.094 100.00% 10000.000
FLL ORD 1177 US 1.14% 1.290 0.00% 0.000
BWI FLL 105393 AT 36.58% 1338.259 0.00% 0.000
BWI FLL 182706 SW 63.42% 4021.815 100.00% 10000.000
CMH FLL 26303 AT 77.68% 6034.079 0.00% 0.000
CMH FLL 7558 SW 22.32% 498.212 100.00% 10000.000
IND FLL 28268 AT 81.78% 6687.159 0.00% 0.000
IND FLL 6300 SW 18.22% 332.149 100.00% 10000.000
MKE FLL 33938 AT 89.52% 8013.019 0.00% 0.000
MKE FLL 3975 SW 10.48% 109.925 100.00% 10000.000
ORD FLL 103606 AA 97.34% 9476.007 100.00% 10000.000
ORD FLL 2826 US 2.66% 7.050 0.00% 0.000
TPA BWI 93060 AT 29.79% 887.636 0.00% 0.000
TPA BWI 499 AA 0.16% 0.026 0.17% 0.029
TPA BWI 218702 SW 70.02% 4902.461 99.81% 9962.194
TPA BWI 34 US 0.01% 0.000 0.00% 0.000
TPA BWI 58 DA 0.02% 0.000 0.02% 0.000
TPA DFW 310359 AA 99.81% 9961.319 100.00% 10000.000
TPA DFW 602 US 0.19% 0.037 0.00% 0.000
TPA IAH 62 AA 28.97% 839.375 100.00% 10000.000
TPA IAH 152 US 71.03% 5044.982 0.00% 0.000
TPA IND 64380 AT 53.19% 2828.886 0.00% 0.000
TPA IND 56513 SW 46.69% 2179.768 99.88% 9975.066
TPA IND 135 UA 0.11% 0.012 0.11% 0.012
TPA IND 16 US 0.01% 0.000 0.01% 0.000
TPA MKE 51941 AT 60.06% 3607.358 0.00% 0.000
TPA MKE 34539 SW 39.94% 1595.101 100.00% 10000.000
TPA PIT 13584 AT 13.29% 176.663 0.00% 0.000
TPA PIT 87444 SW 85.56% 7320.652 98.85% 9771.770
TPA PIT 51 DA 0.05% 0.002 0.05% 0.002
TPA PIT 1122 US 1.10% 1.205 1.10% 1.205
4639.926
4635.392
3287.642
2986.011
2034.295
224.615
3467.709
2980.692
1877.055
516.943
4172.101
38.644
4115.643
4966.412
4797.541
2274.455

BWI TPA 210988 SW 69.01% 4763.047 99.85% 9969.994
BWI TPA 94267 AT 30.84% 950.799 0.00% 0.000
BWI TPA 103 DA 0.03% 0.001 0.03% 0.001
BWI TPA 356 US 0.12% 0.014 0.12% 0.014
DFW TPA 302921 AA 99.94% 9987.929 100.00% 10000.000
DFW TPA 183 US 0.06% 0.004 0.00% 0.000
IND TPA 56246 SW 46.51% 2163.006 99.89% 9979.009
IND TPA 64565 AT 53.39% 2850.157 0.00% 0.000
IND TPA 127 US 0.11% 0.011 0.11% 0.011
MKE TPA 51330 AT 59.80% 3575.633 0.00% 0.000
MKE TPA 34511 SW 40.20% 1616.313 100.00% 10000.000
PIT TPA 90066 SW 86.23% 7435.409 99.17% 9835.056
PIT TPA 13519 AT 12.94% 167.522 0.00% 0.000
PIT TPA 18 UA 0.02% 0.000 0.02% 0.000
PIT TPA 847 US 0.81% 0.658 0.81% 0.658
MIA PHL 122056 US 49.44% 2444.552 0.00% 0.000
MIA PHL 124686 AA 50.51% 2551.035 99.95% 9990.038
MIA PHL 123 DA 0.05% 0.002 0.05% 0.002
PHL MIA 125911 US 50.82% 2582.334 0.00% 0.000
PHL MIA 121519 AA 49.04% 2405.323 99.86% 9972.172
PHL MIA 345 DA 0.14% 0.019 0.14% 0.019
MCO BOS 48536 AT 34.27% 1174.205 0.00% 0.000
MCO BOS 740 AA 0.52% 0.273 0.53% 0.277
MCO BOS 90718 DA 64.05% 4102.068 64.05% 4102.068
MCO BOS 1642 SW 1.16% 1.344 35.43% 1254.997
MCO BOS 6 US 0.00% 0.000 0.00% 0.000
MCO BUF 35877 AT 23.25% 540.616 0.00% 0.000
MCO BUF 116173 SW 75.29% 5668.489 98.54% 9710.235
MCO BUF 2242 US 1.45% 2.111 1.45% 2.111
MCO BUF 10 UA 0.01% 0.000 0.01% 0.000
MCO BWI 169800 AT 36.46% 1329.639 0.00% 0.000
MCO BWI 295485 SW 63.45% 4026.515 99.92% 9983.815
MCO BWI 6 UA 0.00% 0.000 0.00% 0.000
MCO BWI 371 US 0.08% 0.006 0.08% 0.006
MCO CMH 109426 SW 74.30% 5520.258 100.00% 10000.000
MCO CMH 37853 AT 25.70% 660.570 0.00% 0.000
MCO DTW 4304 SW 0.89% 0.785 15.45% 238.753
MCO DTW 70750 AT 14.57% 212.155 0.00% 0.000
MCO DTW 410681 DA 84.55% 7148.426 84.55% 7148.426
MCO IND 130632 AT 76.26% 5816.144 0.00% 0.000
MCO IND 40570 SW 23.68% 560.978 99.95% 9989.728
MCO IND 88 DA 0.05% 0.003 0.05% 0.003
MCO LGA 19054 AT 8.35% 69.781 0.00% 0.000
MCO LGA 489 SW 0.21% 0.046 8.57% 73.409
MCO LGA 545 AA 0.24% 0.057 1.15% 1.315
MCO LGA 205937 DA 90.29% 8151.423 90.29% 8151.423
MCO LGA 2071 US 0.91% 0.824 0.00% 0.000
MCO MDT 44494 AT 99.20% 9840.562 0.00% 0.000
MCO MDT 359 SW 0.80% 0.641 100.00% 10000.000
12.068
4256.149
4.016
4965.846
4808.053
2232.125
4994.451
4984.515
79.452
3501.130
4627.661
3819.172
25.812
3612.606
158.797

MCO MDW 281461 SW 77.13% 5948.374 100.00% 10000.000
MCO MDW 83477 AT 22.87% 523.233 0.00% 0.000
MCO MKE 11577 AT 19.72% 388.930 0.00% 0.000
MCO MKE 47126 SW 80.28% 6444.668 100.00% 10000.000
MCO PHL 115803 AT 16.51% 272.653 0.00% 0.000
MCO PHL 200235 SW 28.55% 815.176 45.06% 2030.719
MCO PHL 385070 US 54.91% 3014.745 54.91% 3014.745
MCO PHL 209 DA 0.03% 0.001 0.03% 0.001
MCO PHX 169 DA 0.09% 0.009 0.09% 0.009
MCO PHX 176 AA 0.10% 0.009 66.91% 4476.467
MCO PHX 59824 SW 32.65% 1065.699 32.65% 1065.699
MCO PHX 653 UA 0.36% 0.127 0.36% 0.127
MCO PHX 122434 US 66.81% 4463.625 0.00% 0.000
MCO PIT 97931 AT 47.98% 2302.260 0.00% 0.000
MCO PIT 105273 SW 51.58% 2660.406 99.56% 9912.393
MCO PIT 896 US 0.44% 0.193 0.44% 0.193
MCO SAN 285 AA 3.90% 15.171 44.03% 1939.032
MCO SAN 4005 SW 54.74% 2995.980 54.74% 2995.980
MCO SAN 90 UA 1.23% 1.513 1.23% 1.513
MCO SAN 2937 US 40.14% 1611.172 0.00% 0.000
BOS MCO 9 US 0.01% 0.000 0.00% 0.000
BOS MCO 50563 AT 35.33% 1247.988 0.00% 0.000
BOS MCO 1109 AA 0.77% 0.600 0.78% 0.610
BOS MCO 90144 DA 62.98% 3966.600 62.98% 3966.600
BOS MCO 1304 SW 0.91% 0.830 36.24% 1313.188
BUF MCO 122991 SW 77.73% 6041.303 99.94% 9988.881
BUF MCO 35158 AT 22.22% 493.665 0.00% 0.000
BUF MCO 12 US 0.01% 0.000 0.01% 0.000
BUF MCO 76 UA 0.05% 0.002 0.05% 0.002
BWI MCO 169 US 0.04% 0.001 0.04% 0.001
BWI MCO 168071 AT 35.52% 1261.990 0.00% 0.000
BWI MCO 304873 SW 64.44% 4152.486 99.96% 9992.857
CMH MCO 37398 AT 24.64% 607.350 0.00% 0.000
CMH MCO 114335 SW 75.34% 5676.766 99.99% 9997.760
CMH MCO 17 UA 0.01% 0.000 0.01% 0.000
DTW MCO 70181 AT 14.43% 208.328 0.00% 0.000
DTW MCO 411753 DA 84.68% 7171.023 84.68% 7171.023
DTW MCO 4288 SW 0.88% 0.778 15.32% 234.563
DTW MCO 13 UA 0.00% 0.000 0.00% 0.000 25.457
3528.392
3166.402
942.890
12.833
4949.726
312.689
64.380
3453.913
4578.382
3713.643
IND MCO 131968 AT 75.57% 5711.031 0.00% 0.000
IND MCO 42614 SW 24.40% 595.500 99.97% 9994.847
IND MCO 45 DA 0.03% 0.001 0.03% 0.001
LGA MCO 1330 US 0.54% 0.297 0.00% 0.000
LGA MCO 19743 AT 8.09% 65.414 0.00% 0.000
LGA MCO 654 AA 0.27% 0.072 0.81% 0.661
LGA MCO 222323 DA 91.08% 8294.914 91.08% 8294.914
LGA MCO 56 SW 0.02% 0.001 8.11% 65.785
MDT MCO 46454 AT 99.23% 9847.212 0.00% 0.000
MDT MCO 359 SW 0.77% 0.588 100.00% 10000.000
MDW MCO 81487 AT 22.62% 511.770 0.00% 0.000
MDW MCO 41 DA 0.01% 0.000 0.01% 0.000
MDW MCO 278678 SW 77.37% 5985.542 99.99% 9997.724
MKE MCO 123386 AT 73.46% 5396.084 0.00% 0.000
MKE MCO 37 DA 0.02% 0.000 0.02% 0.000
MKE MCO 44545 SW 26.52% 703.307 99.98% 9995.595
PHL MCO 385784 US 55.29% 3056.515 55.29% 3056.515
PHL MCO 114372 AT 16.39% 268.644 0.00% 0.000
PHL MCO 197541 SW 28.31% 801.406 44.70% 1998.044
PHL MCO 103 DA 0.01% 0.000 0.01% 0.000
PHX MCO 125031 US 67.00% 4488.540 0.00% 0.000
PHX MCO 434 AA 0.23% 0.054 67.23% 4519.755
PHX MCO 95 DA 0.05% 0.003 0.05% 0.003
PHX MCO 61062 SW 32.72% 1070.562 32.72% 1070.562
PHX MCO 1 UA 0.00% 0.000 0.00% 0.000
PIT MCO 98607 AT 47.99% 2303.198 0.00% 0.000
PIT MCO 106725 SW 51.94% 2698.039 99.93% 9986.864
PIT MCO 135 US 0.07% 0.004 0.07% 0.004
31.161
4985.627
3688.316
0.663
152.200
3500.412
3896.204
927.994