an attempt to measure the traffic impact of airline alliances · journal of air transportation vol....
TRANSCRIPT

Journal of Air Transportation Vol. 10, No. 3 -2005
AN ATTEMPT TO MEASURE THE TRAFFIC IMPACT OF AIRLINE ALLIANCES
Kostas Iatrou
Hellenic Aviation Society Athens, Greece
Nikolaos Skourias
Beta Securities S.A. Athens, Greece
ABSTRACT This paper analyzes the effects of airline alliances on the allied partners’ output by comparing the traffic change observed between the pre- and the post-alliance period. First, a simple methodology based on traffic passenger modelling is developed, and then an empirical analysis is conducted using time series from four global strategic alliances (Wings, Star Alliance, oneworld and SkyTeam) and 124 alliance routes. The analysis concludes that, all other things being equal, strategic alliances do lead to a 9.4%, on average, improvement in passenger volume.
INTRODUCTION
In the last years, strategic alliances have become extremely popular among airlines since major and smaller carriers have increasingly sought to extend their service network through alliance schemes in order to build global network and, therefore, to attract more passengers. It seems that strategic alliances enable the carriers involved to expand, without investing new resources, the reach of their network and services to many parts of the world where it may be not be economical for stand-alone carriers to operate on their own and/or where they are not authorized to operate because of regulatory constraints.
_____________________________________________________________________________ Kostas Iatrou holds an MBA from ESLSCA Business School, Paris and a PhD from Cranfield University, UK. His main area of study is airline alliances and passenger traffic. He is the secretary general of the Hellenic Aviation Society. Nikolaos Skourias holds an MBA and a PhD in Economics from University Aix Marseille III. He is currently employed as Chief Economist at Beta Securities S.A. in Greece.
https://ntrs.nasa.gov/search.jsp?R=20060028038 2018-07-15T03:08:12+00:00Z

74 Journal of Air Transportation
This paper examines the effects of airline alliances on the allied partners’ output by comparing the traffic change observed on alliance routes between the pre- and the post-alliance period. It focuses exclusively on a quantitative analysis of the impact of alliances on passenger traffic, trying not only to determine whether there is indeed any impact on traffic as a result of alliances but also to quantify it. In this sense, its seeks to confirm the results of previous empirical and theoretical studies, whose findings indicate that alliances do lead to a significant increase in passenger traffic.
A two-step approach is used. In the first step, a specific methodology of determining and measuring the impact of alliances is developed. This methodology is mainly inspired by that used by Iatrou (2004) and Bissessur (1996). It is based on a passenger traffic model which relates passenger traffic to a limited set of exogenous variables: (a) the per capita gross domestic product (GDP) expressed in real terms as an index of income/economic activity and (b) a capacity index (available seats), Herfindahl-Hirschman Index (HHI) and fares. The second step consists first of the econometric estimation of the above regression model using time series data, and then of the isolation and quantification of the alliance impact. This latter is derived from the comparison of the traffic variation induced by non-alliance factors (real GDP) with the observed traffic variation during the post-alliance period.
The work contains significant innovative elements both in relation to the time period examined and to the sample of routes-airlines studied. Not only does the evaluation study extend to the 1990s covering the period 1982-2001 so as to include even the most recent years, but it also covers 124 alliance routes served by the four global strategic alliances actually in force at the time of the study (Wings, Star Alliance, oneworld and SkyTeam). Furthermore, it does not concentrate exclusively on North Atlantic flights, on hub-hub routes, nor on major airlines, as most previous studies on traffic have done. At the same time, a more innovative and functional definition of the alliance date formation is proposed in order to correctly assess the alliance impact on passenger traffic.
LITERATURE REVIEW
The available empirical studies that have attempted to identify and evaluate the potential impact of alliances on traffic volume (and load factor) are quite limited in scope and most of them have been carried out recently. In their majority, they conclude that there is indeed a positive impact as far as alliance routes and complementary alliances are concerned, confirming the theoretical predictions of previous works (Brueckner, 2001; Oum, Park & Zhang, 2000; Park, 1997; Park & Zhang, 1998).

Iatrou and Skourias 75
A brief overview of previous empirical works is presented below giving emphasis to their qualitative conclusions.
Improvement in connecting services and flight frequencies, which can generate increased traffic without having to expand networks, are among the major benefits airline alliances can bring to passengers. More particularly, Youssef and Hansen (1994) found in the particular case of the Swissair/SAS alliance a rise both in quantity and quality of Swissair/SAS connecting services, with the change in quantity of services being derived from an increase in the number of flights between the two carriers hubs, while the improved quality was brought about by both flight increases and better coordination under the alliance. In a search that attempts to measure the effect of alliances on passengers’ schedule delay of three transatlantic alliances (KLM/Northwest Airlines, Lufthansa/United Airlines and Delta Air Lines/Swissair/Sabena), Oum, Park and Zhang (2000) suggest that complementary alliances (where partners have non-overlapping routes) enable partners to offer higher flight frequency to those passengers who fly beyond non-stop city-pair routes, as well as to the majority of connecting passengers. Parallel alliance partners (where partners have overlapping routes) are also expected to increase flight frequencies.
While there is some evidence of increases in flight frequencies and market share resulting from alliance agreements, this does not automatically mean that there are more users, that is, more passengers. However, these rather limited in scope studies tend to conclude that alliances do impact positively on passenger traffic especially as far as complementary alliance routes are concerned.
Gellman Research Associates (1994), in a study/research conducted at the request of the U.S. Department of Transportation (US DOT), measured the impact of the codesharing agreements between British Airways/USAir and KLM/Northwest Airlines on market share and welfare. In this study, they measured, using U.S. Origin and Destination Survey ticket sample data for the first quarter 1994 and flight alternatives, the market share effect by relating the estimation over a sample of city-pair markets of a discrete choice econometric model. This model relates market share to the attributes that characterizes the flights offered (such as fare, overall trip time, service quality, code share, online versus interline service, etc.). The results indicate significant impact across the KLM/Northwest Airlines and the British Airways/USAir code share markets in the sample: lower market share by 8.0% points for the former and 11.2% points for the latter under the counterfactual scenario (no code share).
The U.S. General Accounting Office (GAO, 1995) concluded, mainly based on interviews with representatives from governments and airlines, that strategic alliances between U.S and foreign airlines, which involve code share on a vast number of routes so as to strategically link airlines’ flight

76 Journal of Air Transportation
networks, have generated large gains for the participating carriers in terms of passengers and revenues. U.S. GAO indicated that British Airways/USAir, KLM/Northwest Airlines, and Lufthansa/United Airlines have increased their annual traffic on their alliance routes as a result of the formation of those alliances and that these gains can be attributed to: (a) code sharing and block-space sales agreements on numerous alliance routes covering a wide geographical area the alliance routes and (b) a high degree of operating and marketing integration.
There is also evidence that traffic gains can occur whether airlines re-align their strategies or not. Dresner, Flicop and Windle (1995) studied the outcome of three equity alliances (1988-Continental Airlines/SAS, 1989-Delta Air Lines/Swissair and 1989-KLM/Northwest Airlines) in order to see whether they have led to changes in airline route structure or not and to determine whether they have been successful in generating traffic or increasing market share on international routes. Using before and after alliance data for the years 1987-1991, the analysis indicated that in only one out of three agreement cases have the airlines increased their transatlantic traffic volume and increased their load factors after realigning their route systems to take advantage of the alliance. More precisely, it showed that although both KLM/Northwest Airlines and Continental Airlines/SAS followed re-aligning strategies, only the former achieved some successes in terms of traffic increase. On the contrary, Delta Air Lines/Swissair managed to increase their traffic and load factors despite not having re-aligned their route structure strategies. Whether these results can be generalised is uncertain because the study was limited only to equity alliances on the transatlantic routes. The overall conclusion was that alliances do not appear to guarantee success in the very competitive North Atlantic environment.
In his attempt to evaluate alliances’ impact on passenger traffic, Bissessur (1996) estimated a traffic model over the 1982-1992 period with data for 52 inter-hub routes and from six major alliances (European Quality Alliance, Global Excellence, British Airways/USAir, KLM/Northwest Airlines, Continental Airlines/SAS and Iberia/Aerolineas Argentinas/Viasa). By comparing the traffic change induced by non-alliance factors (real GDP) with the actual level of traffic change between the pre- and post-alliance periods, he showed that major alliances lead to traffic increases on hub-hub routes with the exception of two routes (Copenhangen-Zurich and Vienna-Geneva). A further cross-section indicated that the main factors behind the alliances’ operational success are: (a) the partners’ network size and the compatibility of these networks, (b) the frequency of service between the hubs of the partners, (c) the flight connection time at the hub, and (d) the level of competition on their networks.1
1 See also Bissessur and Alamdari (1998).

Iatrou and Skourias 77
Park and Zhang (1998) and Oum, Park and Zhang (2000) looked at the effects of an airline alliance on partner airlines’ outputs by comparing traffic changes on alliance routes with those on non-alliance routes for the period 1992-1994. Using panel data of the four major alliances (British Airways/USAir, Delta Air Lines/Swissair/Sabena, KLM/Northwest Airlines and Lufthansa/United Airlines) operating non-stop routes on North Atlantic markets (19 alliance and 36 non-alliance routes) for the 1992-1994 period, they found that most of the partners have recorded greater traffic increases on their alliance routes than on their non-alliance routes. More specifically, the alliance routes of the eight airlines studied showed traffic increases ranging between 6.8% and 66.8% whereas non-alliance routes showed traffic decreases of as much as 3.2% and increases of up to 9.1%.
Oum, Park and Zhang (2000) sought to empirically investigate the effects of alliances on air fares, passenger volume, and consumer surplus by studying four major alliances operating on the transatlantic markets for the period 1990-1994. By estimating a system of demand and price equations using a database consisting of seventeen transatlantic alliance routes, they concluded, by comparing pre- and post-alliance outcomes, that the British Airways/USAir, KLM/Northwest Airlines and Lufthansa/United Airlines alliances, which can be considered as complementary alliances, increased aggregate demand on their alliance routes during the post-alliance period, while the Delta Air Lines/Swissair/Sabena, which can be viewed as a parallel alliance, decreased aggregate demand on their alliance routes during the post-alliance period. In a separate analysis studying the effect of alliances on the partners’, the non-partners’ and total traffic, they found that: (a) complementary alliances increase total output by an average of 11-17%, while parallel alliances decrease total output by an average of 11-15% and (b) the results for the non-partners’ traffic are consistent with their theoretical predictions, which indicate that complementary alliance adversely affect non-partners’ output.
Finally, Iatrou (2004) and Iatrou and Alamdari (2003) showed, through a series of interviews and questionnaires with the executives of the alliance department of airlines participating in the four global strategic alliances (Wings, Star Alliance, oneworld and SkyTeam), that alliances have indeed produced the expected positive impact in terms of traffic.
METHODOLOGY AND DATA
The methodology used in order to measure the alliance impact relies on a time series estimation of a traffic regression model. It is mainly based on the comparison of traffic variation induced by non-alliance factors, that is, per capita GDP in constant prices (RGDPPC), with the observed traffic variation during the post-alliance period.

78 Journal of Air Transportation
Modelling the Airline Alliance Impact on Traffic
A simple way, but not an exhaustive one, to model traffic demand is to relate passenger traffic positively to real economic activity—as this is reflected by the per capita GDP in constant prices (RGDPPC)—and capacity (CAP) as a proxy of airline frequency, HHI for route specific competition and negatively to real fares (RY).2
Thus, the following multiplicative traffic model3 results: PASSijt = A RGDPPCjt
b CAPijt c RYijt
d 10(eHHIjt fD) (1) where PASSijt = Passenger Traffic for the airline pair i, route j
and year t, RGDPPCjt = Real GDP per capita of the origin country for
the route j and year t expressed in local currency, CAPijt = Capacity for the airline pair i, route j and year t, RYijt = Real yield for pair i, route j and year t. As a proxy of real yield, the world nominal yield—in United States Dollar (USD)—converted into local currency and deflated by national inflation rate is chosen, while local and national refer to the origin country. The world passenger revenue per passenger kilometre, in USD, is used as a measure of nominal yield,4 HHIjt = Route specific competition for route j and year t, and D = A dummy variable which takes value one for the years 1980-81 (Second oil shock), 1991 (Gulf war) and 2001 (terrorist attacks on September 11) and value zero in all the other years;
2 Of course, traffic for any given route tends to arise from the complex interaction of a much larger set of factors that
affect the different market segments differentially. Two main categories of factors can be distinguished (Doganis,
2002). The first one includes those factors affecting all markets (level of personal disposable income, supply
conditions, convenience of air travel, level of economic activity/trade, population size and growth rate, social
environment, attitudes to travel, etc.). The second one includes the factors that affect only particular routes but may be
totally absent on others (level of tourist attraction, exchange rate fluctuations, travel restrictions, historical/cultural
links, earlier population movements, current labour flows, nature of economic activity, etc.).
3 A major disadvantage of using load factor when measuring the alliance impact is that the alliance impact is highly
affected by service frequency. Any alliance is usually accompanied by an increase in service frequency, as the partners
attempt to integrate their networks and gain market share, which in turn will affect negatively load factors given that
traffic is likely to respond only gradually to any increasing frequencies.
4 It is acknowledged that the use of a global measure of nominal yield could lead to a mis-estimation of the price
variable impact and thus increase the chances of finding a non-significant price impact.

Iatrou and Skourias 79
which may alternatively be expressed as: LogPASSijt = a + b LogRGDPPCjt + c LogCAPijt + d LogRYijt + e HHIjt + f D (2) where Log( ): log to the base 10,
a = LogA, b, c and e > 0, d < 0.
Disposable income Any development in personal income affects the level of the purchasing
power and the propensity to undertake leisure travel in general and air travel more specifically. As income increases two things take place: First, a greater part of the disposable income is spent on non-necessary consumer goods including air travel. Second, air travel, which constitutes a more expensive but also a more convenient means of transport for longer distances, becomes more accessible and more competitive (Lansing & Blood, 1984). Therefore, greater income results in an increase of expenditure on leisure traveling, but also in air transport being favoured over other competitive and alternative means of transport, especially for longer destinations. Taking into account that data concerning disposable income are not always available and that the way of measuring it differs from country to country, the use of GDP as a proxy measure is considered as essential.
The use of GDP is considered as the most appropriate measure for at least two more reasons.5 First, it does constitute a measure index of national income and wealth and is included among the major determinants of leisure travel. As real GDP increases, people tend to have more income to consume (Kanafani, 1983) and at the same time the improvement of living standards leads to changes of consumer habits. These changes favour certain categories of goods and services, such as leisure activities, including travelling, which present high demand/revenue elasticities. Second, it does constitute a measure index of business activity and therefore wealth, and is included among the major determinants of business traveling.6
Any increase in population also leads to an increase in passenger traffic with the exception of the less developed countries, for which this relation 5 The choice of per capita GDP as an approximation of personal disposable income does entails certain risks and
restrictions as it assumes a homogeneous allocation of income among all classes and citizens.
6 The demand for business travel is not directly related to the disposable income of the business travelers themselves
but to the needs of the businesses they work for. These needs are however directly related to the economic activity,
and thus to national income and wealth.

80 Journal of Air Transportation
does not apply in most cases, if at all; for the simple reason that a large part of the population simply cannot afford air travel.
RGDPPC as an explanatory variable presents many advantages, given that it is a composite variable that combines real GDP and population, two important explicative determinants of passenger traffic, as mentioned above, while it permits the avoidance of a third one, that of exports. Furthermore, it can be considered as a variable totally independent of the alliance formation. Capacity
The use of seat kilometre available as an index measure of capacity and proxy of frequency entails a positive impact on passenger traffic for two reasons. First, any increase of available seats for any given level of demand can lead to higher supply and to fares’ decrease, which can boost passenger traffic. Second, any increase in frequency can lead to the improvement of service quantity, which in its turn enables airlines/alliances to attract more passengers and convince them to use airplanes over any alternative and competitive means of transport, especially in relation to short haul and domestic flights, always provided of course that air fares remain affordable. Increased service frequency can also stimulate traffic as more flights are offered at convenient times.7 At the level of specific airlines or routes, there is certainly an additional argument that renders frequency/capacity a significant parameter: increases in service frequency can increase the market share of an airline in relation to that of its competitors; this principle has been conceptualised in the generally accepted S-curve variation of market share with frequency (Taneja, 1981).
In a way, CAP can be considered as an index of the improvement of the quantity of service and, contrary to RGDPPC, it can be indeed
7 An implicit assumption of the traffic regression model is that the cause-and-effect relationship, if any, between
traffic and frequency/capacity is unidirectional: The explanatory variables are the cause and the dependent variable is
the effect. It seems however, that in the particular case of traffic and capacity, such a one-way cause-and-effect
relationship is not meaningful. This occurs because traffic is determined by frequency/capacity, and
frequency/capacity is, in its turn, partly determined by traffic. As a matter of fact, higher frequency/capacity can
stimulate traffic, but at the same time, a rising demand resulting from an increase in GDP can lead to an increase in
frequency/capacity to accommodate the higher number of passengers, which makes the relationship a two-directional
one. In short, this simultaneous relationship renders any distinction between dependent and explanatory variables
dubious, and the least-squares estimators are, in this case, not only biased but also inconsistent since the endogenous
explanatory variables become stochastic as they are correlated with the disturbance term of equation in which it
appears as an explanatory variable (Gujarati, 1995). In order to overcome the problem of the simultaneous-equation
bias, one could proceed to the estimation of a simultaneous two equations model, one for each of the jointly dependent
variables, but first, it is necessary first to test the hypothesis of the mutual dependency using, for example, the pair
wise Granger causality test (Granger, 1969).

Iatrou and Skourias 81
considered as an alliance factor since the formation of the airline alliance can change dramatically the frequency of service (Youssef, 1992).
Fares
Apart from income and capacity, price is another variable that might have a major impact on air travel demand. Obviously, air travel prices are expected to have a negative impact, since price and demand usually move in opposite directions. If a fare goes up, demand is expected to fall, and vice versa. Given that low fares, or a limited change of fares, are likely to stimulate demand particularly in the leisure market,8 it is necessary to include them in the regression model. Moreover, it would be illogical not to ascribe some part of the dynamic development of passenger traffic observed in recent years to the moderate evolution of nominal fares (Iatrou, 2004).
Previous studies on the issue of traffic have made use of airline yield as a good approximation of fare levels (Bissesur 1996; Morrison & Winston 1990). Airline yield indicates the passenger revenue per passenger-kilometre, that is, the ratio revenue to passenger-kilometres.
The choice of yield instead of fares is due to the various problems that have arisen from the use of ABC World Airways Guides that constitute the most official and sole information source of fares. First, available data are not very reliable in that they do not give the actual fares being paid. Indeed, owing to various unofficial discounts, the fares paid by consumers differ, often widely, from the published fares. In addition, the fare data are very complex with many different fare classes. Another restriction associated with the use of fares is that the available guides do not list fares for all destinations. The only fares that are consistently listed are those between the major hubs. On the whole, what characterizes all routes is the virtual non-availability of data for fares, their relative unreliability, which resulted in a difficult data processing to obtain the required complete and consistent time series. For this reason, it was decided that fares should not used as a variable measuring air travel demand, and yield is used instead.
In any case, it becomes obvious that yield has to be adjusted for price inflation so as to establish the real cost of air travel in relation to other goods or services and hence to correctly assess the role of air travel prices. The Herfindahl-Hirschman Index (HHI)
Competition is a key factor of traffic growth and is expected to influence it negatively. In order to take into account the competition impact the well- 8 Of course, fares are not expected to influence business and leisure travel in a uniform way. Since business travellers
do not pay for their own travel, their demand would be relatively insensitive to fare changes and their price elasticities
would be lower than those of leisure travellers. An examination of price elasticities in some studies shows this to be
true (Straszheim, 1969).

82 Journal of Air Transportation
know Herfindahl-Hirschman Index (HHI), is used. The HHI is used to measure the impact degree of competition and market concentration a certain market faces by investigating the market share of each firm. The HHI takes into account the relative size and distribution of the firms in a market and approaches zero when a market consists of a large number of firms of relatively equal size. The HHI increases both as the number of firms in the market decreases and as the disparity in size between those firms increases. It is intended to correct the possible misleading results guided only by the number of firms in the market. For example, an index of the number of firms will consider a market with 100 firms as competitive without recognising that two firms share 90% of the market, with the other 98 firms sharing only the remaining 10%. To account for both the number of firms and their market shares, the HHI is defined as the sum of the squared market share of each firm in a market as expressed in following equations 3 and 4:
∑=
= n
ii
ii
S
SA
1
(3)
HHI = ( )∑=
n
iiA
1
2 (4)
where i : the i-th airlines in the market, n : the number of airlines in the market,
iS : the annual volume of the i-th airlines,
iA : the market share of the i-th airlines, and HHI: the Herfindahl-Hirschman Index of the market. According to the definition of the HHI, the greater the HHI the less the
competition exists in the market. In the extreme cases, a monopolistic market has an HHI equivalent to 1, and the HHI of a market with a perfectly competitive structure is close to zero.
Therefore, HHI is expected to have a positive sign since a low-competition environment will all others things being equal induce a higher traffic growth. Isolation of the Alliance Impact by Separating Alliance and Non-alliance Effects
Given that traffic is explained by alliance and non-alliance factors, alliance impact can be deducted by neutralizing the influence of the latter. In

Iatrou and Skourias 83
other words, the evaluation of the alliance impact relies on the isolation of the RGDPPC effect, and therefore, on the comparison of the observed traffic variation with the traffic variation induced by RGDPPC during the post-alliance period.
Suppose that passenger traffic is a function of RGDPPC according to the equation below:
LogPASSt = a + b LogRGDPPCt (5) It follows that parameter b represents the elasticity of traffic with respect
to RGDPPC, given that the endogenous and the exogenous variables are expressed in logarithmic terms:
In the case of an autoregressive traffic regression model—that is, one
where the lagged value of the dependent variable appears as an explanatory variable on the right-hand side of the equation—b represents only the RGDPPC short term impact on traffic. Its long term or total impact is then given by:
Considering that the percentage variation in RGDPPC from alliance
formation (t) to post-alliance period (t+) is g%, it follows that the passenger traffic change induced by RGDPPC will be bg% (or bLTg%). If the observed percentage traffic variation during the given period is k%, then the percentage change in traffic brought about by the alliance formation can be approximated by (k-bg)% [or (k-bLTg)%]. An approximate value of the absolute change in traffic that results from the alliance formation is then given by r[(k-bg)/100] or r[(k-bLTg)/100] where r indicates the passenger traffic level at (t).
Because, as the airlines themselves have mentioned in the aforementioned survey and interviews, any given impact on traffic is generally observed quite rapidly—that is, within the first two years after their joining the alliance—t+ is set arbitrarily to t+2 and k% is equal to:
(6) t-1PASS t – PASS
PASS t-1
RGDPPC t – RGDPPC t-1
RGDPPC t-1
b =
(1-estimated coefficient of PASS t-1
)
b b
LT = (7)
(6)
(7)

84 Journal of Air Transportation
k% = One of the main weaknesses of this methodology is that it assumes that
the alliance impact is equal to the observed variation in traffic volume, that is, k%, whenever the RGDPPC is found to be non-significant (b = 0). The reason is that RY and CAP are considered as alliance factors whereas RGDPPC as a non-alliance factor. This can lead to a misestimation of the alliance impact on passenger traffic insofar as fares and capacity do not depend solely on alliance strategies; they are clearly influenced by a set of other factors independent of alliance formation9.
ESTIMATION METHOD AND DATA
The parameters will be determined by a time-series linear regression using ordinary least squares (OLS) unless the detection of heteroskedasticity, autocorrelation or both, requires the use of generalized least squares (GLS) in order to obtain efficient estimators and to render the usual hypothesis-testing procedure valid. In the case of heteroskedasticity, the White’s heteroskedasticity-consistent covariance matrix is chosen in order to produce consistent coefficient’s standard errors. In the autocorrelation or both heteroskedasticity and autocorrelation, the estimated generalized least squares (EGLS) is required; but one can also simply introduce the one-period lagged dependent variable among the explanatory variables.
The time span is the pre-alliance period (1982 to t) where t is defined as the date when the two partners involved extended their bilateral agreement to the route under consideration. Whenever the cooperation agreement entered in force in the first semester of year t, year t is considered as the alliance formation date. In case the cooperation began later in the year, In the opposite case, t+1 year is supposed to be the alliance formation date. One major problem which could not be overcome is that the pre-alliance period is often quite short to allow consistent econometric results. This is especially true for the partnerships that began in the late 1980s and early 1990s.
The main tests used to assess the quality of the estimation are the adjusted R2 statistics, which gives a measure of the goodness of fit, and the F
9 A fare and capacity model should have been estimated in order to quantify exactly the impact of an alliance on these
variables, that is, which part of their changes during the post alliance period is due to the alliance and which is not. If it
is assumed that φ and ω indicate respectively the part of the variation of fare and capacity that is not due to an alliance
then the alliance impact is equal to (k-bg-φdf-ωcv)% when b ≠ 0 or (k-φdf-ωcv)% when b = 0, where f% and v%
represents respectively the variation of fares and capacity over the t+2 and t period. The approach used above supposes
explicitly that φ and ω are zero. It follows there is overestimation of the alliance impact on traffic whenever (φdf)% >
-(ωcv)% and underestimation whenever (φdf)% < -(ωcv)%.
PASSt+2 - PASSt
(8)PASS t (8)

Iatrou and Skourias 85
statistics, which constitutes a measure of the overall significance of the estimated regression (joint test that all the regression coefficients are zero). Furthermore, some additional tests will be used to check whether some important assumptions of the classical linear regression model are fulfilled. More specifically, the hypothesis that disturbances are homoscedastic (White test) and uncorrelated (Durbin-Watson test) has to be controlled for. In the particular case the lagged dependent variable appears among the exogenous variables, the h-Durbin test will be used to test the error serial autocorrelation of order one.
In all cases, the e-Views software package is used in parallel with SPSS. The latter has been chosen in order to proceed to a step-wise regression which aims at determining which of all the explanatory variables is the most significant one.
The passenger and capacity data have been obtained by the series “Traffic by flight stage” published by International Civil Aviation Organization (ICAO). When such data were missing, they were obtained directly from the airlines (Air Canada year 1997) and the US DOT (KLM/Northwest Airlines years 1999-2001, American Airlines/Finnair years 1996-1997, Aeromexico/Delta Air Lines year 2000, Air France/Delta Air Lines year 1997 and SAS-United Airlines year 1991). Since the US DOT does not publish data on a one-way basis but on a round trip basis, data for any specific year, for which data are missing, had to be split based on each one-way route’s past average percentage of total traffic.10 For five additional routes, specific computation was needed in order to overcome the problem with missing data in relation to traffic and capacity for some specific years.11 It should be stressed that in all cases, the estimation of non-available data, whatever method is used, tends to exacerbate the problem of measurement error, a phenomenon frequently met in econometrics.
Real GDP per capita was obtained from the International Monetary Fund (IMF) World Economic Outlook Database. All GDP series are expressed in local currency.
The world passenger revenue per passenger kilometre (in USD) was obtained by ICAO Financial Data Commercial Airlines. The data concerning the National inflation rates (Consumer Prices Index change of rate) data were obtained from the IMF World Economic Outlook Database. For both 10 That was the case of New York-Mexico-New York (Aeromexico-2000), Paris-New York-Paris (Air France-1997),
Amsterdam-Chicago-Amsterdam (KLM-1999/2000), Amsterdam-Los Angeles-Amsterdam (KLM-1999/2000),
Amsterdam-New York-Amsterdam (KLM-1999/2000), New York-Helsinki-New York (Finnair-1996/1997), Paris-
Chicago-Paris (Air France-1997), Miami-Mexico-Miami (Aeromexico-2000) and Merida-Miami-Merida
(Aeromexico-2000).
11 London-Madrid for 1986 and Iberia, Frankfurt-Stockholm for 1991 and SAS, Copenhagen-Frankfurt for 1991 and
SAS, Bangkok-Copenhagen for 1991 and SAS and Copenhagen-Bangkok for 1991 and SAS.

86 Journal of Air Transportation
national inflation rates and cross-currency exchange rates, annual average measures instead of year-end measure are used.
The time span is covering the period beginning in 1982 and ending the year of the alliance formation.12 Of course, there are some cases of routes for which the observation period begins after 1982 because of the data non-availability: for example, in the case of SkyTeam data are available only since 1985.
There were 124 routes examined. They include hub-hub, hub-non hub and non hub-non hub routes, all served by airlines which are members of the major four global airline alliances, that is, Wings, Star Alliance, oneworld and SkyTeam. Only routes with consistent and sufficient data are included in the analysis since the aim of the data collection process was to minimize potential sources of measurement error bias, which could affect the econometric results and lead to misspecification problems. At any rate, special attention has been given to the selection of routes. The selection was effected in a way so as to retain the representative character of the sample regarding the degree of cooperation and the type of routes for each global strategic alliance.
The sample, as it becomes clear from Table 1, is mainly dominated by hub-hub and hub-non hub routes, which represent 96.8% of the total number of routes analysed (43.6% and 53.2%, respectively) and 99.2% of the total passengers carried during the year 2001 (62.1% and 37.1%, respectively). Moreover, Star Alliance tends to be over-represented, while the other three major alliances are under-represented compared to their respective weights in the total traffic of the four global strategic alliances taken together. This fact is related mostly to: (a) the belated entry of certain airlines in a given alliance, (b) the late start date of cooperation between two airlines within a given alliance, (c) the late start of some flights which began during the 2000s, and (d) the availability of relevant data.
12 Digest of Statistics on the Traffic by Flight Stage Series arranged by flight stage are available since 1969, but for
the pre-1982 period, data were only published for the four selected months of March, June, September and December.
Series containing aggregate annual data are only available since 1982. This is the main reason why the observation
period began in that year.

Iatrou and Skourias 87
Table 1: Number of routes examined for traffic impact of alliances, by alliance, type of routes and number of passengers in 2001
Hub-Hub Hub-Non
Hub
Non Hub-
Non Hub
Total
Wings No of routes
No of pass.
0
(0)
10
(1,222,255)
0
(0)
10
(1,222,255)
Star Alliance No of routes
No of pass.
44
(8,240,293)
46
(4,568,748)
2
(91,796)
92
(12,900,837)
oneworld No of routes
No of pass.
4
(1,409,335)
4
(316,727)
0
(0)
8
(1,726,062)
SkyTeam No of routes
No of pass.
6
(1,697,388)
6
(663,506)
2
(51,416)
14
(2,412,310)
Total No of routes
No of pass.
54
(11,347,016)
66
(6,771,236)
4
(143,212)
124
(18,261,464)
EMPIRICAL RESULTS
The econometric results tend to indicate that strategic alliances lead, on average, to a clear improvement in passenger traffic. Traffic Model
Overall, the estimated models on the route level are quite satisfactory, all having a high goodness of fit and consequently high explanatory powers, except for certain routes. In fact, the explained variance of passenger traffic represents more than 90% of total variance in 68.5% of the cases, while it exceeds the 70% level in 93.5% of the cases. Although, the stepwise regression method was used in order to obtain the best specification—that is, that which includes the most significant set of exogenous variables and guarantees the highest goodness of fit—significant results could not be achieved for eight routes. For these routes the adjusted multiple coefficient of determination does not exceed 60%. One probable explanation for the low explanation of these models could be the short observation period and the small number of data points upon which the regressions were based. In any case, the conclusion reached is that for these routes, the selected set of explicative variables cannot be considered as major and significant determinants of passenger traffic.
Further, the models also present high F-statistics ascertaining their validity and the significance of the retained exogenous variables, at least for 96 routes. Independent variables all had high t-statistics implying that the
88 Journal of Air Transportation
probability of them actually being zero is null at the 5% significance level. On the other hand, the Durbin-Watson statistic indicates that serial autocorrelation of first order of the disturbance was a serious problem for 68 routes. Thus, a correction was necessary, whether by introducing the lagged dependant variable (PASSt-1) in 23 cases or by estimating an Estimated Generalized Least-Squares (EGLS) in 41 cases, supposing that the disturbances follow an autoregressive error model (AR).
In all cases, the heteroskedasticity was not a major problem, but whenever and wherever it was detected, it was automatically corrected by the White method, namely by the estimation of a consistent covariance matrix.
As expected, the CAP has been revealed as the most important factor in explaining the variation in passenger numbers, since it appears in the majority of the models (97.6%, i.e., 121 routes) and exhibits a high degree of statistical significance,13 while the RGDPPC seems to have a more reduced impact, being significant in less than half of the cases (49.2%, i.e., 61 routes). That tends to indicate that these markets—the routes included are mostly non North-American originating—have not yet reached maturity. At the same time, RGDPPC is not significant for U.S. and Canadian originating routes. The short-term elasticity of traffic to RGDPPC lies in a wide range from 0.16 to 3.72, while it varies between 0.5 and 2.0 in 65.6% of the routes (80.3% when one takes into account the long term elasticity as well). These values are satisfactory considering that Bissessur (1996) obtained a similar range of values, but they exceed the values obtained previously for the income elasticity of demand for international air travel traffic (0.9 to 1.1). Finally, it seems that for 50.8% of the selected routes the alliance impact is equal to the traffic variation observed during the post-alliance period, since the methodology used supposed that whenever RGDPPC is found to be non-significant, any traffic variation induced by RGDPPC is null.
As indicated above, the capacity provided by the alliances is present in nearly all the models. This tends to demonstrate that any change in capacity introduced by an alliance is very likely to affect the traffic carried by the partners and therefore the network economies which might result. In one-third of the cases, the coefficient is less than unity, which means that any change in alliance capacity results in a lower than proportional increase in traffic.
As far as the real yield is concerned, the results were quite disappointing given that the price variable does not appear in many regressions. This variable seems to influence significantly the passenger traffic only in the case of 16 routes (12.9% of the total routes). This contradicts previous
13 One should indicate that the Granger causality test performed on the route level does not support the hypothesis of
a two-way relationship between CAP and PASS revealing that passenger traffic does not Granger-cause capacity.
Iatrou and Skourias 89
findings obtained by Iatrou (2004), which pointed to a negative and statistically significant price elasticity of demand for international passenger traffic. One possible reason is that the price variable retained is a global one, that is, one which measures the world trend of fares. Even if the fares listed in the ABC World Airways Guide had been used, there would have many chances that the same problem would have appeared, as Bissessur (1996) had already pointed out, since these fares are not the actual fares passengers are required to pay owing to the widespread practice of discounting. As for the hub-hub routes, one additional reason is that often they do not represent the passengers’ final destination but an intermediary point to their final destination. In that case, the fares paid are those of the origin country and not those of the hub country. This is certainly valid also for the hub-non hub routes but not for the non hub-non hub routes.
The HHI variable introduced to measure the route specific competition effect on traffic does not appear to be a major determinant of passenger traffic since it is significant for only 22 routes (17.7%). The estimated coefficient is positive in all cases and lies between 0.05 and 0.5 except for one route where it exceeds 1 (1.322). The competition measure has therefore the expected sign indicating that low competition positively affects allied airlines traffic. HHI limited impact could be due in some extent to the limited degree of competition which characterized the routes of our samples.
The coefficient for the dummy introduced in order to capture and neutralize the consequences of war or/and recession have the expected negative sign in all the models it appears (42 routes, i.e., 33.9%). On average, the coefficient lies between -0.012 and -0.098: this means that adverse events reduced traffic from 2.7% to 27.2%.
Alliance Impact
As stated earlier, the alliance impact is given by the traffic variation observed during the post-alliance period, when such variation cannot be attributed to non-alliance factors. So it is necessary to remove the RGDPPC effect in order to obtain this impact at least for those routes which are affected by RGDPPC. In a total of 124 routes, 61 were affected by both alliance and non-alliance factors (GDP). For the rest however, it can be safely concluded that the change in traffic is mainly due to alliance strategies. Table 2 presents the results for each global strategic alliance separately.

90 Journal of Air Transportation
Global Impact All in all, the impact of global strategic alliances is, on average,
significant and positive. The computation gives an estimated passenger increase of 9.4%, which implies an additional traffic of 1.5 millions (Table 2). The main part of this effect appears however, by the second year of the alliance formation since in the first one the traffic increase is just 2.3% compared with 6.9% for the second year (Table 3).
Table 2: Traffic impact of airline alliance, for four major global strategic alliances as observed in the second year after the alliance formation in relation to the pre-alliance
period
Alliance Additional traffic (vol.) Traffic increase (%)
SkyTeam 227,694 11.0%
Oneworld -62,875 -3.4%
Star Alliance 1,272,787 11.7%
Wings 43,327 4.6%
Total 1,480,933 9.4%
Table 3: Traffic impact of airline alliances, for four major global strategic alliances, during the post-alliance period of each alliance. The first column presents the t+1 effects
while the second column the changes observed in year t+2 in relation to the year t+1
Alliance 1st year effect 2nd year effect
SkyTeam -3.1% 14.6%
oneworld 2.1% -5.6%
Star Alliance 3.8% 7.6%
Wings -3.0% 7.8%
Total 2.3% 6.9%
Impact by global strategic alliance
Two of the strategic alliances considered, that is, Star Alliance and SkyTeam, present a traffic increase directly attributable to the alliance

Iatrou and Skourias 91
formation which exceeds the average observed: 11.7% and 11.0%, respectively.
The results are quite different for the two other alliances: Wings presents a rise much lower than the average estimated (i.e., 4.7%), while oneworld a substantial decrease (i.e., -3.4%). The lower impact as far as the former alliance is concerned can be explained by the fact that the given strategic alliance is made up of only two airlines, which cover mainly the transatlantic area, and also by the fact that the sample is exclusively composed of hub-non hub routes since the hub-hub routes cooperation (Amsterdam-Detroit, Amsterdam-Minneapolis and Amsterdam-Memphis) began quite early, with the alliance formation (1993). The positive impact found in the case of Wings hub-non hub routes should be stressed; this finding shows that the strategic alliance has positive benefits for the entire flight network, and not only for hub-hub routes, and that the existence of antitrust immunity acts in that way. The negative impact as far as oneworld is concerned is due to several reasons. Two of the major members, American Airlines and British Airways, have not managed to extend their cooperation as they would have wished, as their proposed strategic cooperation has not been granted antitrust immunity by the US DOT for anticompetitive reasons. This has excluded the possibility of any code share cooperation on the transatlantic routes and between U.S. and European hubs. Besides, these two airlines were late in developing code share practices on behind-beyond flights. These facts have obviously affected in the same adverse way the other alliance members, since American Airlines and British Airways constitute the main alliance decision makers—it should not be forgotten that these two airlines have a 10% stake in Iberia.
On the opposite side, the high alliance impact observed for Star Alliance seems to be due the existence of an extended network in which 17 airlines participate (October 2003), and to the antitrust immunity enjoyed by of the two core members of the alliance (Lufthansa and United Airlines). The same seems to be true in the case of SkyTeam since it presents an extended and complementary network. The positive results of SkyTeam can be attributed to: (a) the worldwide geographical coverage which Air France and Delta Air Lines, the core members, offer; (b) the participation of two of the most efficient hubs (in Europe and in United States) in terms of traffic and connections provided (Charles de Gaulle and Atlanta); and (c) the tighter cooperation adopted in 1998 after the signing of a new bilateral agreement between France and the U.S. (which provided for more flights connecting the two countries). Impact during the Post-alliance Period
A more in depth analysis of the alliance impact per period, as presented in Table 2, reveals that alliances have led to a reduction in traffic for both

92 Journal of Air Transportation
SkyTeam and Wings during the first year of the post-alliance period. This negative impact can be attributed to the fact that the selected routes sampled include airlines which can be characterized as founding members: Air France, Delta Air Lines and Aeromexico for SkyTeam; KLM and Northwest Airlines for Wings. This tends to show that the alliance needs time to produce any positive benefits in terms of higher traffic. Further, Air France and Delta Air Lines used to cooperate with other airlines before setting up SkyTeam. Delta Air Lines was a member of Atlantic Excellence having a partnership with Swissair. Thus, some time was certainly needed not only to overcome the change of partner, but also to achieve network harmonization, to transfer Delta Air Lines European hub activities from Zurich to Paris, and for Delta Air Lines passengers to get familiarized with the new partnerships. Additionally, it is commonly acknowledged that a strategic alliance needs more time to produce positive results than a simpler type of cooperation.
As far as Wings is concerned, the negative results might be due to Northwest Airlines facing financial situation in that particular period and to the exclusive analysis of hub-non hub routes.
By contrast, Star Alliance, which seems to be the most successful global alliance among the four considered here, presents a positive and gradually increasing impact during the two years following the alliance formation: 3.8% for the first year and 7.6% for the second one. Impact by Type of Routes
One would expect that hub-hub routes would have shown a larger impact as one of the very aims of alliances is to forward a greater percentage of the allied partners’ traffic through hubs. It seems that this is not the case since an equivalent positive impact for hub-hub and hub-non hub routes is found: 9.3% and 9.4%, respectively.14 Two reasons can explain this unexpected result. First, it can be explained by the existence of a large number of U.S. (New York, Dallas, Boston and Chicago, for example) and European final and non-hub destinations, which can be reached directly without necessarily passing through hubs. Secondly, it can also be due to the fact that the hub-hub system needs time to function efficiently. The creation of a common network, pricing and scheduling policy as well as the harmonization of terminals and technology systems (for example, Computer Reservation Systems), that would enable the partners to forward behind-beyond destinations passengers through their hubs, require certain time to be implemented. In addition, certain hubs such as London-Heathrow and Frankfurt were already important business centers and had therefore
14 In absolute numbers of course, the impact for hub-hub is twice as large as that for hub-non hub given their larger
traffic.

Iatrou and Skourias 93
significant traffic. In addition, these airports are seriously congested with little space for expansion.
The non hub-non hub routes present a positive increase in traffic, an increase directly attributable to the alliance formation, but this result cannot be considered a significant one, given the very limited number of routes (4) included in the sample studied.
Table 4: Traffic impact of airline alliances, by type of routes
Type of route %
Hub-Hub 9.3%
Hub-Non Hub 9.4%
Non Hub-Non Hub 11.6%
Alliances seem to have important spill over effects as they influence
positively the allied airlines’ traffic on their entire network. Impact by Type of Cooperation
The greater impact by far is brought about by strategic alliances with and without antitrust immunity: 14.6% and 9.8%, respectively. A strategic alliance with antitrust immunity presents a higher increase, since it enables partners to follow a common scheduling/pricing policy and to coordinate networks. This result confirms that the simple joining of a given alliance is not sufficient by itself to lead to traffic improvement and that the tighter the cooperation, the higher the benefits enjoyed in terms of traffic.
A quite surprising result is that of code share since the estimated increase in traffic brought about by this type of cooperation is almost insignificant (1.3%) and well below that of frequent flyer programs (FFP), the simplest type of cooperation. This is entirely due to the negative impact on Star Alliance code shared routes (-2.1% versus 7.6% for oneworld the other alliance for which code share routes are considered in the selected sample). The more plausible reason for this paradox is that the sample under examination included routes on which there is virtually no competition, and therefore there was no additional traffic to gain over from other competitors. FFP on the other hand, tends to register a more significant increase since the customers gain more tangible and immediate benefits from FFPs, such as mileage, than from code share.

94 Journal of Air Transportation
Table 5: Traffic impact of airline alliances, by type of cooperation
Type of cooperation %
Frequent Flier Programs 4.6%
Code share 1.3%
Strategic alliance without antitrust immunity 9.8%
Strategic alliance with antitrust immunity 14.6%
In comparison with FFP, which is a cost-free and quickly-producing
results-type of cooperation, strategic alliances seem to present a more pronounced positive impact in the second year of the post-alliance period, since they obviously need more time to produce their benefits. This conclusion agrees with Gallacher’s statement (1997) that FFPs’ ability to influence business class travelers has made them more important to global alliances than code share.
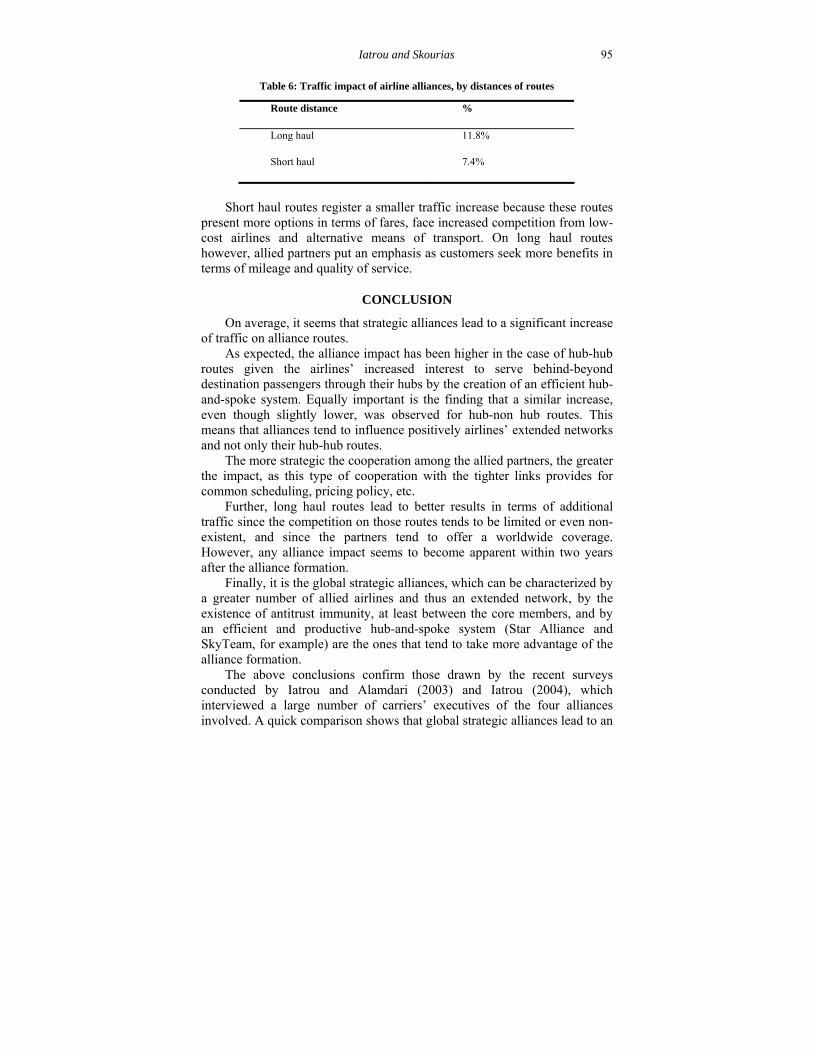
Impact by Route Distance
As expected, the largest impact is observed on long haul flights in comparison with short haul ones15 (11.8% versus 7.4%) since a larger part of passengers with behind-beyond destinations prefers to travel with allied airlines which offer better scheduling and connection times. Another reason contributing to this result might be the limited competition, which characterizes these types of routes, given the cooperation between allied airlines.
However, the short haul routes present—in the short term, and more particularly in the first year of the post-alliance period—a greater increase in traffic since they constitute in many cases the final destinations of the travelers or tourist or/and business centers especially in the case of Europe (Paris, London, Amsterdam and Frankfurt). By contrast, the greater impact for long haul routes is observed during the second year of the post-alliance period, as the positive effect of tighter cooperation in an increased number of behind-beyond destinations, network harmonization and the entrance of new airlines into the alliance.
15 Long haul routes are the intercontinental (from to continent to continent) ones while short haul routes are those
effected within the same continent.
Iatrou and Skourias 95
Table 6: Traffic impact of airline alliances, by distances of routes
Route distance %
Long haul 11.8%
Short haul 7.4%
Short haul routes register a smaller traffic increase because these routes
present more options in terms of fares, face increased competition from low-cost airlines and alternative means of transport. On long haul routes however, allied partners put an emphasis as customers seek more benefits in terms of mileage and quality of service.
CONCLUSION
On average, it seems that strategic alliances lead to a significant increase of traffic on alliance routes.
As expected, the alliance impact has been higher in the case of hub-hub routes given the airlines’ increased interest to serve behind-beyond destination passengers through their hubs by the creation of an efficient hub-and-spoke system. Equally important is the finding that a similar increase, even though slightly lower, was observed for hub-non hub routes. This means that alliances tend to influence positively airlines’ extended networks and not only their hub-hub routes.
The more strategic the cooperation among the allied partners, the greater the impact, as this type of cooperation with the tighter links provides for common scheduling, pricing policy, etc.
Further, long haul routes lead to better results in terms of additional traffic since the competition on those routes tends to be limited or even non-existent, and since the partners tend to offer a worldwide coverage. However, any alliance impact seems to become apparent within two years after the alliance formation.
Finally, it is the global strategic alliances, which can be characterized by a greater number of allied airlines and thus an extended network, by the existence of antitrust immunity, at least between the core members, and by an efficient and productive hub-and-spoke system (Star Alliance and SkyTeam, for example) are the ones that tend to take more advantage of the alliance formation.
The above conclusions confirm those drawn by the recent surveys conducted by Iatrou and Alamdari (2003) and Iatrou (2004), which interviewed a large number of carriers’ executives of the four alliances involved. A quick comparison shows that global strategic alliances lead to an
96 Journal of Air Transportation
increase in traffic, all others things being equal, within the first two years after the alliance formation, since 64% of the interviewees answered that the alliance impact on traffic exceeded 6%, while 43% of them has indicated that this effect was apparent within the first two years of the alliance formation. While the survey showed that 50% of the interviewed airlines believed that the impact is of the same range for each of the first two years of the post-alliance period, according to the econometric analysis, it is in the second year of the post-alliance that the alliance impact on traffic reaches its peak and it is double that observed during the first year.
Obviously, the above research could be extended and completed in many ways to get a more accurate assessment of airline alliance effects on traffic. First, the hypothesis considering real fares and capacities as alliance factors should be relaxed given that they cannot be considered as totally dependent of alliances, and this is especially true as far as fares are concerned. Secondly, a more accurate fare measurement should be taken into account in order to capture the price effect on traffic, since it has been shown, at least on a global level, that traffic volume is negatively correlated to real fares (Iatrou, 2004). More specifically, a route level measure should be retained as it was done in the research by Bissessur (1996). Thirdly, in theory, non-alliance routes could be used to benchmark the alliance impact in a attempt aiming to measure true alliance traffic impact, so as to reach a more reliable assessment. But such a comparison will be possible only in the future when new routes are introduced because there are practically no data about the non-alliance routes to use for benchmarking purposes. Most likely, any new routes introduced in the future will follow the alliance/code share practice. Since partner airlines tend to feed domestic traffic onto their alliance routes and or reroute it through their alliance routes (Oum, Park & Zhang, 2000; Park & Zhang, 1998), non-alliance routes traffic could decline and as a result the alliance impact could be lesser than that estimated. Finally, one should extend the analysis of the effects of complementary and parallel airline alliances on partner airlines’ outputs in order to confirm the conclusion drawn by Oum, Park and Zhang (2000) and Park and Zhang (1998) according to which complementary alliances lead to a increase in partners’ output while parallel ones lead, on the contrary, to a decrease in partners’ output.
REFERENCES
Bissessur, A., & Alamdari, F. (1998). Factors affecting the operational success of strategic airline alliances. Transportation, 25, 331-355.
Bissessur, A. (1996). The identification and analysis of the critical success factors of strategic airline alliances. Cranfield: Cranfield University.

Iatrou and Skourias 97
Brueckner, J. (2001). The economics of international codesharing: An analysis of airline alliances. Transport Policy, 19, 1475-1498.
Doganis, R. (2002). Flying Off Course (3rd ed.). London: Routledge.
Dresner, M., Flicop, S., & Windle, R. (1995). Transatlantic airline alliances: A preliminary evaluation. Journal of the Transportation Research Forum, 35, 13-25.
Gellman Research Associates, Incorporated. (1994). A study of international airline code sharing. Washington, DC: U. S. Department of Transportation.
General Accounting Office. (1995). International aviation: Airline alliances produce benefits, but effect on competition is uncertain. Washington, DC.
Granger, C. W. J. (1969). Investigating causal relations by econometric models and cross-spectral methods. Econometrica, 34, 424-438.
Gujarati, D. (1995). Basic econometrics (3rd ed.). New York: McGraw-Hill.
Iatrou K., & Alamdari, F. (2003, June). The empirical analysis of the impact of alliances on airline operations. Paper presented at the 7th World Conference of the Air Transport Research Society, Toulouse, France.
Iatrou, K. (2004). The impact of airline alliances on partners’ traffic. Cranfield: Cranfield University.
International Civil Aviation Organization. (1984). Financial data: Commercial air carriers No. 320. International Civil Aviation Organization, Montreal.
International Civil Aviation Organization. (1985). Financial data: Commercial air carriers No. 331. International Civil Aviation Organization, Montreal.
International Civil Aviation Organization. (1986). Financial data: Commercial air carriers No. 342. International Civil Aviation Organization, Montreal.
International Civil Aviation Organization. (1990). Financial data: Commercial air carriers No. 386. International Civil Aviation Organization, Montreal.
International Civil Aviation Organization. (1991). Financial data: Commercial air carriers No. 397. International Civil Aviation Organization, Montreal.
International Civil Aviation Organization. (1992). Financial data: Commercial air carriers No. 407. International Civil Aviation Organization, Montreal.
98 Journal of Air Transportation
International Civil Aviation Organization. (1993). Financial data: Commercial air carriers No. 414. International Civil Aviation Organization, Montreal.
International Civil Aviation Organization. (1994). Financial data: Commercial air carriers No. 425. International Civil Aviation Organization, Montreal.
International Civil Aviation Organization. (1995). Financial data: Commercial air carriers No. 439. International Civil Aviation Organization, Montreal.
International Civil Aviation Organization. (1996). Financial data: Commercial air carriers No. 450. International Civil Aviation Organization, Montreal.
International Civil Aviation Organization. (1997). Financial data: Commercial air carriers No. 461. International Civil Aviation Organization, Montreal.
International Civil Aviation Organization. (1998). Financial data: Commercial air carriers No. 472. International Civil Aviation Organization, Montreal.
International Civil Aviation Organization. (1999). Financial data: Commercial air carriers No. 483. International Civil Aviation Organization, Montreal.
International Civil Aviation Organization. (2000). Financial data: Commercial air carriers No. 493. International Civil Aviation Organization, Montreal.
International Civil Aviation Organization. (2001). Financial data: Commercial air carriers No. 505. International Civil Aviation Organization, Montreal.
International Civil Aviation Organization. (1996). Traffic by Flight Stage, Digest of Statistics No. 452. International Civil Aviation Organization, Montreal.
International Civil Aviation Organization. (1997). Traffic by Flight Stage, Digest of Statistics No. 463. International Civil Aviation Organization, Montreal.
International Civil Aviation Organization. (1998). Traffic by Flight Stage, Digest of Statistics No. 474. International Civil Aviation Organization, Montreal.
International Civil Aviation Organization. (1999). Traffic by Flight Stage, Digest of Statistics No. 485. International Civil Aviation Organization, Montreal.
International Civil Aviation Organization. (2000). Traffic by Flight Stage, Digest of Statistics No. 495. International Civil Aviation Organization, Montreal.
International Civil Aviation Organization. (2001). Traffic by Flight Stage, Digest of Statistics No. 507. International Civil Aviation Organization, Montreal.

Iatrou and Skourias 99
International Monetary Fund. (2005). World Economic Outlook Database. (WWW document). http://www.imf.org/external/pubs/ft/weo/2004/01/data/index.htm.
Kanafani, A. A. (1983). Transportation demand analysis. New York: McGraw-Hill.
Lansing, J., & Blood, D. (1984). The changing travel market, Ann Arbor MI: Survey Research Center, University of Michigan.
Morrison, S. A., & Winston, C. (1990). The dynamics of airline pricing and competition. In The American Economic Review, Papers and Proceedings of the hundred and second annual meeting of the American Economic Association, Atlanta, Georgia.
Oum, T., Park, J., & Zhang, A. (2000). Globalization and strategies alliances: The case of the airline industry. Oxford: Pergamon.
Oum, T., & Zhang A. (1998). Airline alliances and partner firms’ outputs. Transportation Research, 34(4), 245-255.
Park, J. (1997). The effects of airline alliances on markets and economic welfare. Transportation Research, 33(3), 181-195.
Park, J-H. and Zhang, A. (1998). Airline Alliances and partner firms’ outputs. Transportation Research, E, 34(4), 245-255.
Straszheim, M. R. (1969). The international airline industry. Washington, D.C.: Brookings Institute, Transport Research Programme.
Taneja, N. K. (1976). The commercial airline industry—Managerial practices and regulatory policies. Massachusetts: Lexington Books.
Youssef, W. (1992). Causes and effects of international airline equity alliances. PhD. Dissertation Series UCB-ITS-DS-92-1, Berkeley, CA: Institute of Transportation Studies, University of California.
Youssef, W., & Hansen, M. (1994). Consequences of strategic alliances between international airlines: The case of Swissair and SAS. Transportation Research, 28A(5), 415-431.