impact of 50% renewal portfolio standard under prop. 127
TRANSCRIPT
Policy Analysis
October 23, 2018
Impact of 50% Renewal Portfolio Standard Under Prop. 127
By Dave Wells, Research Director
Executive Summary
Proposition 127, The Clean Energy for a Healthy Arizona ballot initiative, would require utilities regulated by the Arizona Corporation Commission (ACC)—Arizona Public Service (APS) and Tucson Electric Power (TEP) most prominently—to get half of their electricity from renewables by the year 2030. The current requirement in Arizona is 15 percent by the year 2025, which APS has already achieved. If Arizona plans to make a proportional effort to mitigate the impact of Climate Change, the current portfolio standard needs to be dramatically upgraded. The question for Arizona voters is whether Prop. 127 is a desirable path to do so.
On Oct. 8, 2018, the Intergovernmental Panel on Climate Change reiterated the urgency of climate change and recommended that the renewable share of electricity reach at least 48 percent, nuclear power be maintained, and coal largely eliminated by 2030 to limit global warming.1
Climate change is expected to make the desert regions of Arizona significantly hotter and less hospitable in the years ahead. The number of days in which Phoenix went above 110 degrees in the last century has averaged 12 days. During the 1981-2010 period it rose to 18 days. In 2017 Phoenix hit 25 days at 110 degrees or higher. That repeated in 2018. By the end of this century, scientists project it will be 91 days with half of them above 115 degrees.2 Agriculture 1 Intergovernmental Panel on Climate Change (2018), “Global Warming of 1.5o C: Summary for Policmakers,” Oct. 6, p. SPM-19, http://report.ipcc.ch/sr15/pdf/sr15_spm_final.pdf. 2 Loomis, Brandon (2017), “Phoenix’s heat is rising—and so is the danger,” Arizona Republic, October 18, https://www.azcentral.com/story/news/local/arizona-environment/2017/10/18/deadly-heat-phoenix-getting-hotter-so-danger/694283001/. 2018 high temperatures at Accuweather, https://www.accuweather.com/en/us/phoenix-az/85003/july-weather/346935?monyr=7/1/2018 (4 in June, 14 in July and 7 in August).
Grand Canyon Institute Policy Analysis: Impact of 50% Renewal Portfolio Standard under Prop. 127
2
will suffer declining yields, heat-related morbidity will rise, energy consumption for cooling will rise, and the area will become less attractive to more mobile, educated workers and less attractive to tourists and retirees. Home values could stagnate or decline. One climate study suggests that by the year 2090, there is a 95 percent chance that Arizona’s economy will no longer experience any real economic growth and will begin retracting.
So is Proposition 127 the answer?
A barrage of information has besieged voters—leading to confusion as noted by Arizona Republic Left-Learning Columnist Laurie Roberts:
Whose studies do you believe? So, what’s a voter to do? Here is my best advice: believe no one.3
Her Right-Leaning counterpart Bob Robb echoed similar sentiments:
Here is the weight that voters should put on the studies by the pro side: zero. And here is the weight voters should put on the studies by the anti side: zero.4
Voters have been subjected to claims from APS that their utility bills will rise at least $1000 or double by 2030, while the Prop. 127 representatives counter that utility bills will slightly decline.
Unlike either campaign, the Grand Canyon Institute (GCI) does not have a position or stake in the initiative.5 Proponents of the initiative will be pleased to find that GCI has found claims that electric bills will rise an exorbitant amount insufficiently substantiated. APS and the No Campaign have focused on using fear as a motivator and used high-end unlikely cost estimates for compliance and purposely chosen to compare them to today’s bills without adjusting for inflation or what bills would be under an APS business as usual scenario.
Proponents of the initiative put together a mandate backed up with dynamic energy modelling where everything comes together well and no snags are hit. California is a laboratory on the
3 Roberts, Laurie (2018), “APS has 488 million reasons to vote against Prop. 127. I only have one,” Arizona Republic, Oct. 8, https://www.azcentral.com/story/opinion/op-ed/laurieroberts/2018/10/08/aps-arizona-public-service-against-prop-127-should-we-help/1570009002/ 4 Robb, Robert (2018), “The Prop. 127 debate is all wrong. Here’s a better way to evaluate the renewable energy mandate,” Arizona Republic, Sept.30, https://www.azcentral.com/story/opinion/op-ed/robertrobb/2018/09/30/arizona-prop-127-renewable-energy-impact-economy-constitution/1436484002/ 5 That won’t prevent campaigns from dismissing our analysis for reasons unrelated to its substance, however.

Grand Canyon Institute Policy Analysis: Impact of 50% Renewal Portfolio Standard under Prop. 127
3
issue as they have a more aggressive Renewable Portfolio Standard (RPS) and are making such good progress at meeting it, that they keep raising the bar. California also has a more diverse set of renewable energy sources than Arizona, especially wind and geothermal. 6 In addition, though Arizona has hydro—existing hydro is precluded from counting toward the RPS by the initiative. California adopted their RPS by legislation initially in 2002 with the latest update with Senate Bill 100 this year.7 California now plans to reach 33 percent renewable by 2020, 50 percent by 2026 and 60 percent by 2030 with a 100 percent clean standard by 2045 (nuclear and carbon capture gas would be examples of clean sources outside renewables). California has consistently altered its RPS by legislation. Consequently, a diverse set of stakeholders were involved in the process and adjustments can be made without going to voters. 8
Arizona’s Prop. 127 was developed by renewable energy advocates and is a Constitutional amendment which will be voter protected if passed, meaning if compliance issues arise, then the only way to address it will be by amending the proposition with voter approval, a slower, more cumbersome, less certain process.
Greenhouse gas emission savings depend largely on how the variable nature of solar and wind are dealt with in an expanded grid. Closing Palo Verde, as APS has suggested would occur, would seriously undermine that goal, while ceasing all use of coal sooner would enhance it. GCI does not find closing Palo Verde likely. However, when gas generation moves from base power to peaker its emissions get modestly worse, meaning some emissions benefits of solar will be lost depending on the degree to which gas generation moves from a base to a demand-matching (peaker) component of the electric portfolio.9
Other options exist beyond Prop. 127. The Arizona Corporation Commission (ACC) is a constitutional branch of government tasked with regulating the activities of public service corporations.10 Regulations over rates and charges of public service corporations place entities such as APS and Tucson Electric Power (TEP) subject to the ACC approval process for any
6 California Energy Commission (2018), “Renewable Energy-Tracking Progress,” July, https://www.energy.ca.gov/renewables/tracking_progress/documents/renewable.pdf. 7 California Energy Commission, “History of California’s Renewable Energy Programs,” https://www.energy.ca.gov/renewables/history.html. 8 Roberts, David (2018), “California just adopted its boldest energy target yet: 100% clean electricity,” Vox, Sept. 10, https://www.vox.com/energy-and-environment/2018/8/31/17799094/california-100-percent-clean-energy-target-brown-de-leon. 9 MacKinnon, Michael A., Jacob Brouwer, and Scott Samuelson (2018), “The role of natural gas and its infrastructure in mitigating greenhouse gas emissions, improving air quality, and renewable resource integration,” Progress in Energy and Combustion Science, 64 (January), pp. 62-92, https://reader.elsevier.com/reader/sd/pii/S0360128517300680?token=0A144156AD61BAAD05481981AA1653A7C6C28246156B4D0D7DBF97BAE64FDDF85B567BBE8F2B02B6E44B2B05B918287E. 10 https://www.azleg.gov/viewDocument/?docName=http://www.azleg.gov/const/15/3.htm
Grand Canyon Institute Policy Analysis: Impact of 50% Renewal Portfolio Standard under Prop. 127
4
changes in sources of energy and how customers pay for the energy. Entities like SRP, the City of Mesa and other municipal electric utilities rely on their own governing boards/councils to identify what energy sources to use and customer rates. Enhanced RPS or clean energy standards can be sought at these governing body levels, which is how Arizona’s initial RPS was adopted.
ACC Commissioner Andy Tobin has his own plan, favored by utilities, to reach 80 percent carbon-free by 2050, which includes nuclear and conservation measures. Likewise, some of the candidates running for the ACC are running on a solar-focused agenda and many observers suspect that if combined with current commissioner Bob Burns, they could form a majority to develop a more aggressive timetable than what Commissioner Tobin has proposed.
GCI has not taken a position on Prop. 127. However, two GCI board members have taken public positions in favor of it. Chris Herstam and Susan Gerard both have statements in the ballot information pamphlet in support of the initiative. Susan Gerard is also serving as co-chair for the initiative. Due to that conflict of interest, they have recused themselves from reviewing the analysis presented in this document.
While millions of dollars on both sides are being spent on this initiative, GCI has not been paid for this analysis of Prop. 127, and GCI has no financial interest tied to the initiative.
The research process has included analyzing information from:
• "The Economic Impact of the Clean Energy for A Healthy Arizona Proposal on Arizona's Economy, 2018-2060," published by the Seidman Research Institute at Arizona State University on March 19, 2018.
• Energy planning documents available from APS and Tucson Electric Power (TEP) as well as the Arizona Residential Utility Consumer Office, Natural Resources Defense Council (NRDC)l, and U.S. Energy Information Administration and many others.
• Meetings, calls, or correspondence with Professor Tim James who oversaw the Seidman Research Institute study, Dylan Sullivan-a policy adviser with the NRDC and the Yes campaign, as well as two other ASU researchers who specialize in this field and are on different sides of the initiative, Wesley Herche (for) and Peter Rez (against).
Efforts to work more closely with the No campaign in the research process were largely unsuccessful. The question for voters is not whether the current renewable standards requirement of 15 percent by 2025 needs to be improved, but whether or not this initiative is the most reasonable means to do so, including the use of a voter-protected initiative compared to citizen

Grand Canyon Institute Policy Analysis: Impact of 50% Renewal Portfolio Standard under Prop. 127
5
involvement in the ACC process or Board meetings for their respective utility providers to reduce carbon-emitting sources of energy.
Contents The Clean Energy for a Healthy Arizona Ballot Initiative ............................................................ 5
Climate Change will stifle Arizona’s economy ............................................................................ 7
Will Prop. 127 Make Bills Rise $1,000? –No. Price Impacts Modest ......................................... 8
Utility-Scale Solar has dropped in cost 80 percent in less than a decade ............................... 8
But Solar Needs Sun—Issues of Capacity Balance ................................................................ 12
Why you shouldn’t believe your electric bill will rise $1,000 under Prop. 127..................... 15
What Happens to the Energy Mix if Prop. 127 Passes? Does Palo Verde close? .................... 21
Conclusion ................................................................................................................................. 24
Appendix: Estimation of APS Figures from Seidman Research Institute Memo ...................... 25
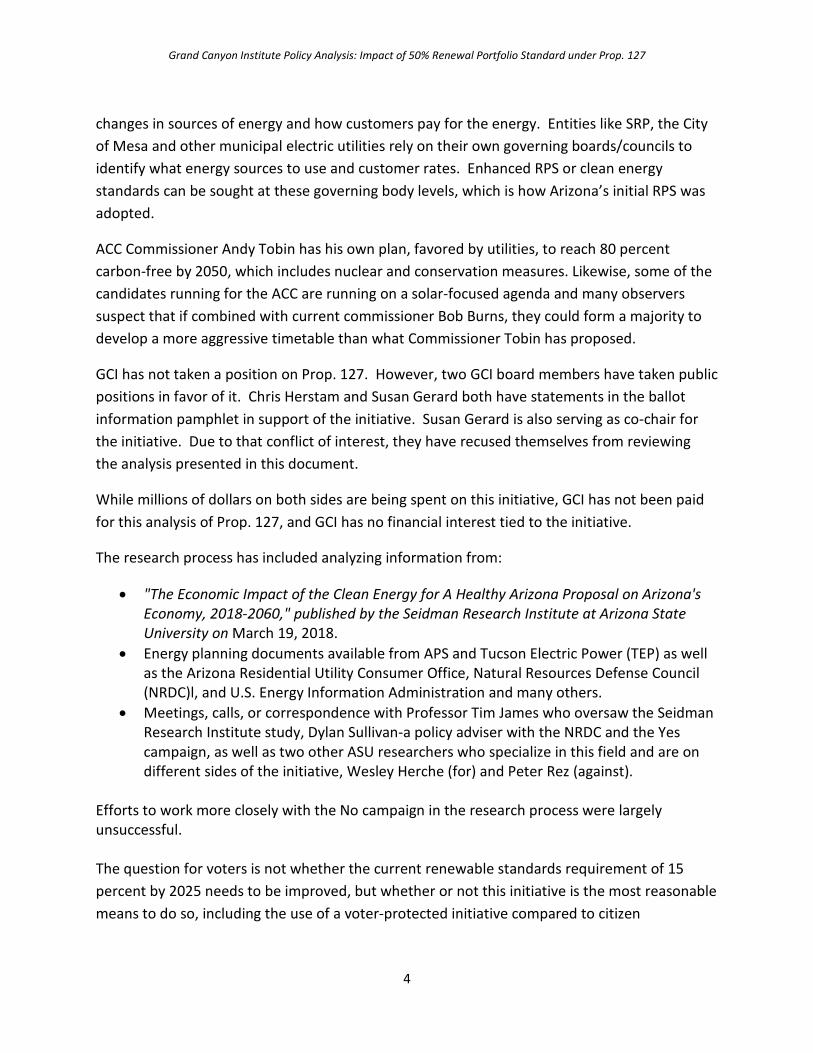
The Clean Energy for a Healthy Arizona Ballot Initiative The Clean Energy for a Healthy Arizona ballot initiative would mandate that the state’s electricity be half from renewables by the year 2030 for those electricity providers overseen by the Arizona Corporation Commission. Figure 1 illustrates that if adopted, the Renewable Portfolio Standard (RPS) required by Prop. 127 would be one of the more aggressive ones in the country, but it would be in line with the goals set by the Intergovernmental Agency on Climate Change to increase renewables to 48 percent of electric production at a minimum by 2030, maintain nuclear generation, and reduce coal-use as much as possible.11
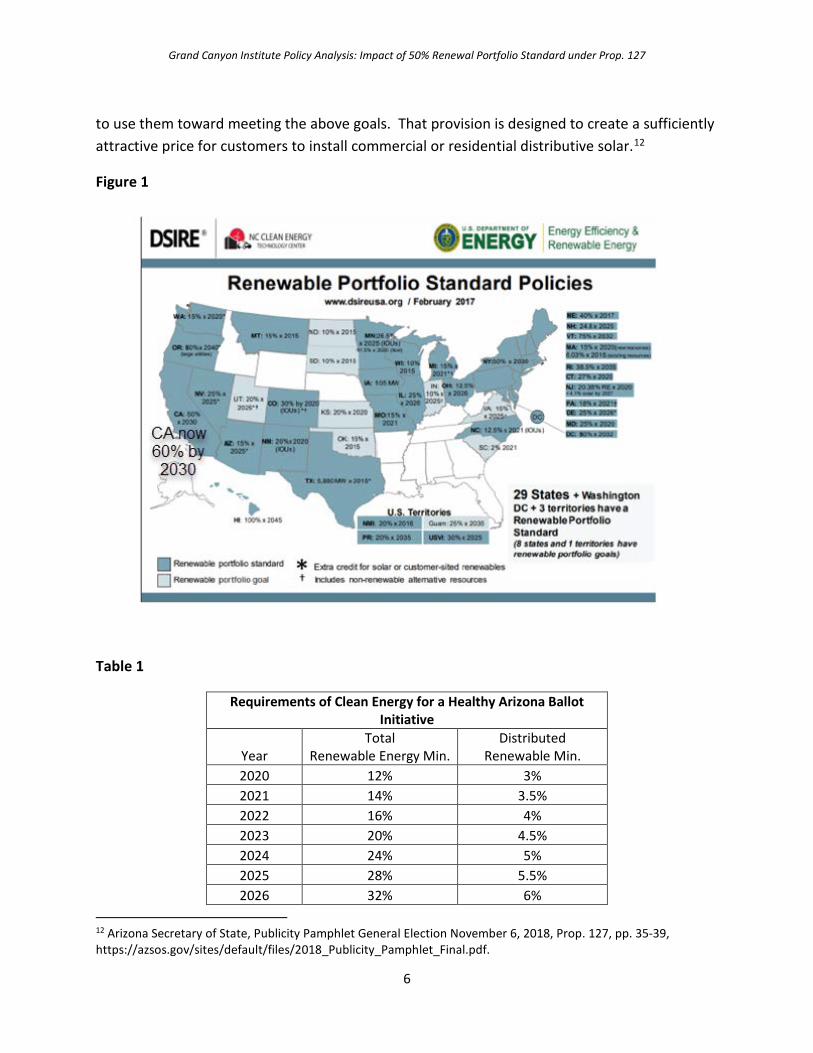
As illustrated in Table 1, the Clean Energy for a Healthy Arizona ballot initiative requires a phase- in to a 50 percent renewable standard. Noncarbon sources like nuclear do not count toward the standard. In addition, it also has a phase-in requirement for 10 percent of the energy to come from distributed sources (locally generated such as rooftops). Consumers earn a credit for each kWh that they generate and the utility must purchase these credits if it wishes
11 Intergovernmental Panel on Climate Change (2018), “Global Warming of 1.5o C: Summary for Policmakers,” Oct. 6, p. SPM-19, http://report.ipcc.ch/sr15/pdf/sr15_spm_final.pdf.
Grand Canyon Institute Policy Analysis: Impact of 50% Renewal Portfolio Standard under Prop. 127
6
to use them toward meeting the above goals. That provision is designed to create a sufficiently attractive price for customers to install commercial or residential distributive solar.12
Figure 1
Table 1
Requirements of Clean Energy for a Healthy Arizona Ballot Initiative
Year Total
Renewable Energy Min. Distributed
Renewable Min. 2020 12% 3% 2021 14% 3.5% 2022 16% 4% 2023 20% 4.5% 2024 24% 5% 2025 28% 5.5% 2026 32% 6%
12 Arizona Secretary of State, Publicity Pamphlet General Election November 6, 2018, Prop. 127, pp. 35-39, https://azsos.gov/sites/default/files/2018_Publicity_Pamphlet_Final.pdf.

Grand Canyon Institute Policy Analysis: Impact of 50% Renewal Portfolio Standard under Prop. 127
7
Requirements of Clean Energy for a Healthy Arizona Ballot Initiative
Year Total
Renewable Energy Min. Distributed
Renewable Min. 2027 36% 7% 2028 40% 8% 2029 45% 9%
2030 & later 50% 10%
Climate Change will stifle Arizona’s economy Climate change is expected to make the desert regions of Arizona significantly hotter and less hospitable in the years ahead. The number of days in which Phoenix went above 110 degrees in the last century has averaged 12 days. During the 1981-2010 period it rose to 18 days. The summers of 2017 and 2018 both hit 25 days at 110 degrees or higher. By the end of this century, scientists project it will be 91 days with half of them above 115 degrees.13 Agriculture will suffer declining yields, heat-related morbidity will rise, energy consumption for cooling will rise, and the area will become less attractive to more mobile, educated workers and less attractive to tourists and retirees.
Solomon Hsiang, Robert Kopp et al. published county-level economic damage estimates due to climate change for the years 2080-2099 in the journal Science in June 2017. Precise impact data files are available for public download.14
Maricopa County has an estimated 7.8 percent annual loss at the median. While data for the state is not compiled, the weighted average by population and income for the state was an 8.2 percent annual loss. These are the median estimates.
Since the data for Maricopa County alone is fairly close to that of the overall state and due its size provides county-level estimates with the most precision, Maricopa County’s estimate is used for the overall economic damage from Climate Change. Rather than use the median impact estimate, GCI takes the estimate for Maricopa County at the 5th Percentile, which means that their model predicts that there is a 95 percent likelihood that damages will equal or exceed this amount and applies that to the entire state. The predicted economic loss at the 5th Percentile is negative 3.4 percent. Arizona’s real economic growth is around 3.4 percent annually. So the study suggests that by 2090 (the midpoint of 2080-2099) the state will stop 13 Loomis, Brandon (2017), “Phoenix’s heat is rising—and so is the danger,” Arizona Republic, October 18, https://www.azcentral.com/story/news/local/arizona-environment/2017/10/18/deadly-heat-phoenix-getting-hotter-so-danger/694283001/. 14 Global Policy Lab-Berkeley, “Estimating Economic Damage of Climate Change in the United States,” http://www.globalpolicy.science/econ-damage-climate-change-usa/

Grand Canyon Institute Policy Analysis: Impact of 50% Renewal Portfolio Standard under Prop. 127
8
growing and possibly begin retracting with 95 percent likelihood. This impact could happen much sooner.
GCI then uses a straight-line estimate of growing losses such that in 2018 the impact is zero but by the year 2090 the full negative 3.4 percent would be realized. That means that 1.4 percent of the 3.4 percent loss would be incurred annually and gradually accumulate. In other words, the economic loss due to climate change is an additional 0.05 percent per year (that’s one-twentieth of 1 percent). So by the year 2030, economic growth in the state will be about one-sixth less than it is now due to Climate Change.
Will Prop. 127 Make Bills Rise $1,000? –No. Price Impacts Modest One of the most heavily pushed claims by the No campaign is that electric bills will rise $1,000 or more. The No Campaign sometimes asserts that bills will double. The ads cite three sources for the claims: “financial analysts,” “Seidman Research Institute,” and “Residential Utility Consumer Office(RUCO)”. GCI on multiple occasions reached out to the spokesperson for APS and the No campaign for documentation on the $1,000 claim and while a response was received, no documentation was forthcoming. The Seidman Research Institute did produce a memo on August 8th stating that bills would rise 119 percent or about $1,900. GCI analyzes its shortcomings later in this report after evaluating the other studies. But in short, that latter comparison does not adjust for inflation or compare bills to a business as usual scenario and requires assumptions regarding enormous costs, including bundling the costs of closing Palo Verde and the Four Corners Coal plant around 2030.
The Seidman Research Institute at Arizona State University did publish its projected impacts from 2018-2060 in March and RUCO put out its estimates in August. Neither provides any evidence that electric bills will rise $1,000 a year. Both relied on APS for key data inputs in their analysis.
Utility-Scale Solar has dropped in cost 80 percent in less than a decade Due to large technology and growing economies of scale, in Arizona solar generation at the utility-scale is the most cost-effective means of generating power at least during the day which corresponds fairly well with demand.
The Levelized Cost of Energy (LCOE) is the means by which efforts are made to compare the comparative cost of energy. However, it doesn’t adjust for when the energy is produced—as a plant that can produce electricity during peak times is more valuable than one that cannot do so. Solar in this way might be more valuable than wind due to the degree it better matches with demand and LCOE is now often compared with the Levelized Avoided Cost of Energy

Grand Canyon Institute Policy Analysis: Impact of 50% Renewal Portfolio Standard under Prop. 127
9
(LACE)-what it would cost to replace the energy--to measure the extent to which an energy source is being maximized. If LCOE is lower than LACE, then there are economic reasons to expand its use. This is the current case with solar energy.15 The environmental impacts of energy are not included in these comparisons. Solar provides significant net-benefits in this regard. But at the same time consumers will be concerned about cost.
Assumptions made by different analysts can differ slightly, but utility-scale solar in Arizona already meets or exceeds equivalent pricing of alternative options. The analysis by Lazard in 2017 in Figure 2 shows this comparison nationwide in the chart below—as well as the dramatic decline in solar pricing from 2009 to 2017, when LCOE costs fell by 86 percent.
Nationwide Utility-Scale Solar at $50 per Megawatt Hour is less than Natural Gas-Combined Cycle at $60 and well below nuclear and coal. As will be demonstrated below, Arizona’s utility-scale solar cost estimates are about one-third less.
Figure 2
Source: Lazard 2017 LCOE (https://www.lazard.com/perspective/levelized-cost-of-energy-2017/)
15 U.S. Energy Information Agency (2013), “Assessing the Economic Value of New Utility-Scale Electricity Generation Projects,” July, https://www.eia.gov/renewable/workshop/gencosts/pdf/lace-lcoe_070213.pdf.
Grand Canyon Institute Policy Analysis: Impact of 50% Renewal Portfolio Standard under Prop. 127
10
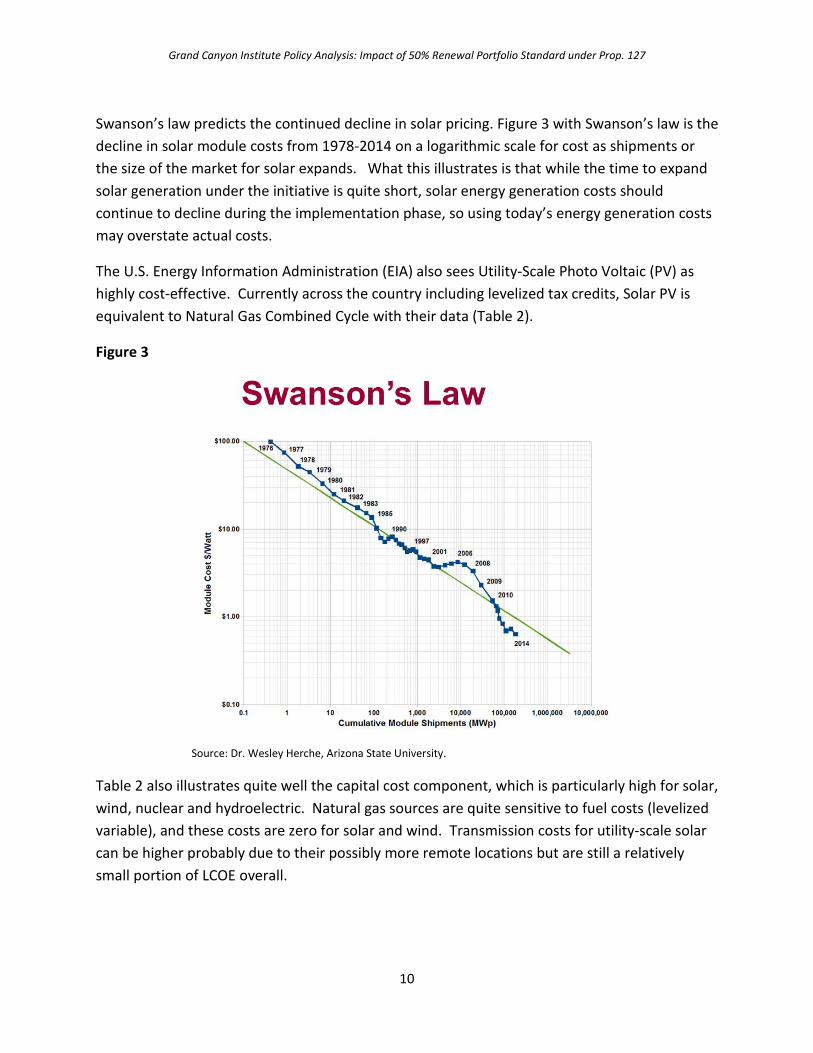
Swanson’s law predicts the continued decline in solar pricing. Figure 3 with Swanson’s law is the decline in solar module costs from 1978-2014 on a logarithmic scale for cost as shipments or the size of the market for solar expands. What this illustrates is that while the time to expand solar generation under the initiative is quite short, solar energy generation costs should continue to decline during the implementation phase, so using today’s energy generation costs may overstate actual costs.
The U.S. Energy Information Administration (EIA) also sees Utility-Scale Photo Voltaic (PV) as highly cost-effective. Currently across the country including levelized tax credits, Solar PV is equivalent to Natural Gas Combined Cycle with their data (Table 2).
Figure 3
Source: Dr. Wesley Herche, Arizona State University.
Table 2 also illustrates quite well the capital cost component, which is particularly high for solar, wind, nuclear and hydroelectric. Natural gas sources are quite sensitive to fuel costs (levelized variable), and these costs are zero for solar and wind. Transmission costs for utility-scale solar can be higher probably due to their possibly more remote locations but are still a relatively small portion of LCOE overall.

Grand Canyon Institute Policy Analysis: Impact of 50% Renewal Portfolio Standard under Prop. 127
11
Tucson Electric Power identified solar and wind as the most economical sources of energy in their 2016 Arizona analysis. Wind and solar were more efficient in their levelized cost of energy than natural gas or nuclear.16
Table 2
In Arizona, TEP entered into a Power Purchase Agreement (PPA) in 2017 for a 100 MW solar array and a 30 MW, 120 MWh solar storage facility. The direct price for solar being $O.03 per kWh with the price including storage being $0.045 per kWh, meaning that adding a four hour
16 ASU Light Works and ASU Energy Policy Innovation Council (2016), “Clean Power Plan Compliance Analysis for Arizona,” Presentation, May 12, slide 12, https://legacy.azdeq.gov/environ/air/download/cpp_comp_analysis_051216.pdf.

Grand Canyon Institute Policy Analysis: Impact of 50% Renewal Portfolio Standard under Prop. 127
12
battery raises the cost by 50 percent, but still kept the overall costs quite competitive.17 In MWh that translates to $45 including the cost of storage. First Solar reports regularly matching the 3 cents per kWh today in Arizona for PV generation (no storage).18 Consequently compared to Table 2, solar in Arizona costs about one-third less. Battery discharge for the four hours in the TEP case was 30 percent of the per hour PV capacity. Three recent Nevada projects had only a $5 per MWH premium for adding storage that delivered 25 percent of the PV per hour capacity for four hours and came in at less than $30 per MWH.19 So at this point battery technology continues to evolve, but appears cost-effective compared to natural gas, though in these examples only replaces a portion of what the panels generate during the day to cover the time when the sun sets but electricity demand remains high.
But Solar Needs Sun—Issues of Capacity Balance However, there is a catch—solar doesn’t work 24 hours a day and we don’t’ turn off the air conditioning when the sun goes down. While solar tracks demand fairly well, especially in a hot climate like Arizona, peak demand continues as the sun sets, meaning that solar must be combined with storage or natural gas generation on the grid. Likewise, during sunny but cooler times in the Spring and Fall, too much solar might be generated, so unless it can be stored or demand shifted to match this supply, the power must be curtailed, i.e., turned off, which raises costs since the resource isn’t used as efficiently.
This challenge leads to different views about how much additional generational capacity is needed under Prop. 127 to maintain balance. In California’s context, it appears that an excessive focus on building natural gas electricity reserves while the RPS was expanding led to excessive reserve margins (essentially too much capacity). Utilities need to build a buffer in summer months to make sure they can meet demand if an unplanned outage occurs or temperatures soar. Fifteen percent reserve is common and required in California. In California the forecast reserve was double that in the summer 2010, and though market forces and a
17 Bade, Gavin and Peter Maloney (2017), “Updated: Tucson Electric signs solar+storage PPA for ‘less than 4.5 cents per kWh,’” Utility Dive, May 23n https://www.utilitydive.com/news/updated-tucson-electric-signs-solar-storage-ppa-for-less-than-45kwh/443293/ and Maloney, Peter (2017), “Pressed duck: Clipping the curve with energy storage,” Utility Dive, July 5, https://www.utilitydive.com/news/pressed-duck-clipping-the-curve-with-energy-storage/446179/ 18 Mahesh Morjaria (VP of Systems Development at First Solar) spoke at an event at ASU on April 6, 2018. He said First Solar is now routinely at or less than $30 per megawatt-hour ($0.03/kw-hour) in Arizona. 19Bolinger, Mark and Joachim Seel (2018), “Utility-Scale Solar: Empirical Trends in Project Technology, Cost, Performance, and PPA Pricing in the United States-2018 Edition,” Lawrence Berkeley National Laboratory, September, p. 38, https://emp.lbl.gov/sites/default/files/lbnl_utility_scale_solar_2018_edition_report.pdf.

Grand Canyon Institute Policy Analysis: Impact of 50% Renewal Portfolio Standard under Prop. 127
13
0
0.5
1
1.5
2
California Residential Electric Price Relative to Arizona(AZ =1)
California Residential Electric Prices Compared to Arizona
1990-2017
1990 2000 2010 2017
80.085.090.095.0
100.0105.0110.0115.0
2004
2005
2006
2007
2008
2009
2010
2011
2012
2013
2014
2015
2016
2017
California to Arizona Electric Rates for Residential
Consumers
CA to AZ Residentail Rate (2004=100)
CA to AZ Residential Rate (2011=100)
Figure 4
Source: U.S. Energy Information Agency.

Grand Canyon Institute Policy Analysis: Impact of 50% Renewal Portfolio Standard under Prop. 127
14
higher RPS have led some gas operators to close, in the summer of 2017, California’s reserve margin was still forecast at 19.5 percent.20 The impact has been higher electric prices in California, though it’s hard to decipher how much overbuilding of natural gas compared to the RPS alone contribute to this, but as electricity demand has been flat in California, it seems likely that overbuilding capacity in the context of the higher RPS has been a prime contributor to increased prices.
Figure 4 puts together these elements, though it still doesn’t clarify the role of excess natural gas capacity on their grid. The top part shows the diverse mix of renewable resources in California and that solar energy has been increasing significantly since 2011. That time coincides as shown in the bottom right with California’s residential electric prices rising 10 percent compared to Arizona. However, as show in the bottom left, California residential rates have always been higher than Arizona. While today rates are about 50 percent higher, much of that difference predates any RPS introduction in California, though may reflect other energy policies and regulations or deregulation.
California’s initial RPS was passed in 2002, this was coincident with utility deregulation and Enron’s effort to rig electric prices in California—which spiked around this time, so to adjust for this, GCI starts after the price spike subsided with a 2004=100 index in its graph in the lower right. That index shows very little change in relative residential prices since the initial RPS.
While the rise in the relative price of electricity does correlate with the large growth in renewables after 2011 which moved from being primarily wind to primarily solar, solar prices during that time were considerably higher than they are today (See Figures 2 and 3 for 2011 to 2014 and compare to generation rates today of around $30 per MWH or less).
That doesn’t mean there aren’t significant planning issues needed with a 50 percent RPS and the need to develop more flexible energy systems. One advantage Arizona has in this regard, is that Arizona can learn from California’s experience to better optimize any future RPS, whether it’s Prop. 127 or something else.21 However, one disadvantage Arizona may have is issues related to the duck curve, when there is lots and sometimes excess power during the day from solar, but a big drop off as the sun sets. California has a milder climate compared to Arizona, so 20 2010 reserve margin: Behles, Deborah N. (2011) “Why California Failed to Meet Its RPS Target,” Journal of Environmental Law and Policy (Summer), https://digitalcommons.law.ggu.edu/cgi/viewcontent.cgi?article=1431&context=pubs. 2017 reserve margin and closing gas plants: Trabish Herman K. (2017), “As gas plants struggle, California seeks new flexible capacity strategies,” UtilityDive, June 27, https://www.utilitydive.com/news/as-gas-plants-struggle-california-seeks-new-flexible-capacity-strategies/445760/. 21 Trabish, Herman K. (2017), “Prognosis negative: How California is dealing with below-zero power market prices,” UtilityDive, May 11, https://www.utilitydive.com/news/prognosis-negative-how-california-is-dealing-with-below-zero-power-market/442130/

Grand Canyon Institute Policy Analysis: Impact of 50% Renewal Portfolio Standard under Prop. 127
15
the duck curve is likely more severe here—so shifting the load to be more coincident with solar or providing more storage will probably be more necessary, especially in the spring and fall. As in California, utilities will also need sufficient capacity to cover periods of successive cloudy days as well.22
Why you shouldn’t believe your electric bill will rise $1,000 under Prop. 127 Three systemic evaluations of potential impacts of Prop. 127 on cost that have been publicly released. APS has not released its internal analysis and the assumptions it is based on.
RUCO Estimates Annual Bills Rise Less than $200 Two of the studies were done in conjunction with APS one of which was actually commissioned by APS. Using data from APS, Arizona’s Residential Utility Consumer Office (RUCO) completed an analysis in August 2018.23 RUCO estimates that by 2030 generation-related costs for a consumer using 1,200 kwh per month would rise from $381, their baseline estimate to $630 a year under the initiative, a $250 increase. However, that’s also comparing 2017 dollars to 2030 dollars. If we put everything in 2017 dollars, using the assumed inflation rate APS applies elsewhere of 2.5 percent, the estimated increase is $180, as in constant dollars annual bills rise $276 under business as usual and $457 under Prop. 127.
Seidman Research Institute Estimates Annual Bills Rise About $200 Arizona State University’s Seidman Research Institute using data from APS and hired by APS, projected the impact of Prop. 127 on the Arizona economy from 2018-2060.24 The Seidman Research Institute’s REMI economic model does not provide any estimate of what will happen to consumer electricity rates. However, it did provide an estimated loss to disposable personal income of $760 million in 2030 for APS which it indicates represents two-thirds of the total impact to the state. These regional models include multiplier effects and a typical state multiplier is 1.5. So adding in a 1.5 additional impact to make the $760 million statewide and the reducing it by 1.5 to adjust for multiplier effects so only the direct bill effect is found, the Seidman Research Institute REMI model suggests a direct loss of $760 million to Disposable Personal Income. GCI presumes that $760 million is solely due to higher electric rates—meaning for a given level of electricity consumption households across Arizona had $760 million less in disposable income.
22 These limits are a particular concern of ASU Physics Professor Peter Rez. 23 Arizona’s Residential Utility Consumer Office (2018), “Residential Ratepayer Cost Analysis of Clean Energy for a Healthy Arizona Ballot Initiative, August, https://ruco.az.gov/sites/default/files/files/AZ%20RUCO%20Clean%20Energy%20for%20a%20Healthy%20Arizona%20Ballot%20Initiative%20Analysis_2.pdf. 24 Seidman Research Institute (2018), “The Economic Impact of the Clean Energy for a Healthy Arizona Proposal on Arizona’s Economy, 2018-2060: Summary Report,” March 19, http://seidmaninstitute.com/wp-content/uploads/2018/04/APS-Summary-Report-0327.pdf.

Grand Canyon Institute Policy Analysis: Impact of 50% Renewal Portfolio Standard under Prop. 127
16
Assuming real annual growth rates of 3.5 percent (Arizona averaged 3.8 percent real growth from 1998 to 2017), then $760 million represents 0.18 percent of personal disposable income in 2030 which totals $417 billion at that time in today’s dollars. Data from the U.S Energy Information Administration for Arizona for 2017 indicates that household electricity costs were 1.6 percent of personal disposable income,25so the Seidman Research Institute effectively estimates an 11 percent rise (0.18/1.6) in electricity costs due to Prop. 127. In today’s dollars that amounts to about $220 per year for a household consuming 1,200 Kwh per month on average which was the household that RUCO modeled. The typical APS household uses less energy than that, so the bill impact is likely closer to $200 annually.26
Both the RUCO and Seidman Institute models may be high end estimates because they assume the closure (or selling off) of Palo Verde, which GCI does not foresee. They also rely on other data from APS that the Yes Campaign says is too high, in terms of generation capacity and integration costs. For instance, p. 26 of RUCO’s analysis contrasts energy integration costs of $25,90 per MWH ($.0259 per kwh) at a 50 percent RPS with a Colorado utility that for a 43 percent RPS estimates the cost at only $4.09 MWH, one-sixth of the amount. RUCO used a gradual build up to the APS amount in its estimates which contributed to a 2 percent presumed rise in costs over the implementation time period.27 The RUCO and Seidman Institute (inferred) consumer price impacts are shown in Figure 5.
On the reverse side, the Yes on 127 campaign claims annual savings for customers of about $30 per year by 2030 that escalates to $60 per year by 2040 in inflation-controlled dollars from a Natural Resource Defense Council (NRDC) analysis using a dynamic simulation model from the energy firm ICF.28 This methodology is superior to the other two studies in terms of energy estimates. RUCO used an algorithm-based spreadsheet to estimate an energy compliant portfolio with APS’ current business as usual model as the starting point. RUCO noted this
25 U.S. Energy Information Agency, “2017-Average Monthly Bill -Residential,” https://www.eia.gov/electricity/sales_revenue_price/pdf/table5_a.pdf. 26 12,220 kwh annually or about 1,000 per month is the typical APS customer according to Seidman Research Institute (2018), “Estimated Increase in Residential Electric Rates Associated with Clean Energy for a Healthy Arizona (50x30 Plan),” Aug. 9, http://seidmaninstitute.com/wp-content/uploads/2018/09/Memorandum-080918.pdf. 27 Arizona’s Residential Utility Consumer Office (2018), “Residential Ratepayer Cost Analysis of Clean Energy for a Healthy Arizona Ballot Initiative, August, https://ruco.az.gov/sites/default/files/files/AZ%20RUCO%20Clean%20Energy%20for%20a%20Healthy%20Arizona%20Ballot%20Initiative%20Analysis_2.pdf. 28 Sullivan, Dylan (2018), “New Study: 50% Renewables Would Save AZ More than $4 Billion,” NRDC Blog, June 14, https://www.nrdc.org/experts/dylan-sullivan/new-study-50-renewables-would-save-az-more-4-billion. Details on the ICF energy modeling can be found here: https://www.icf.com/resources/solutions-and-apps/eepm.
Grand Canyon Institute Policy Analysis: Impact of 50% Renewal Portfolio Standard under Prop. 127
17
limitation in their analysis which limits its accuracy.29 The Seidman Research Institute uses a sophisticated economic simulation model with APS providing some of the key inputs for changes to utility inputs, but that model doesn’t capture dynamics within the Western grid that the NRDC model does. Like NRDC, APS has its own dynamic energy simulation model but has chosen not to release key details. Essentially, NRDC thinks Arizona doesn’t need to build as much new capacity as APS is planning and that the capacity can come in the form of solar instead of gas with existing gas being transformed from base or intermediate (sometimes on) to being used more often as peakers to meet gaps between renewables and energy demand.
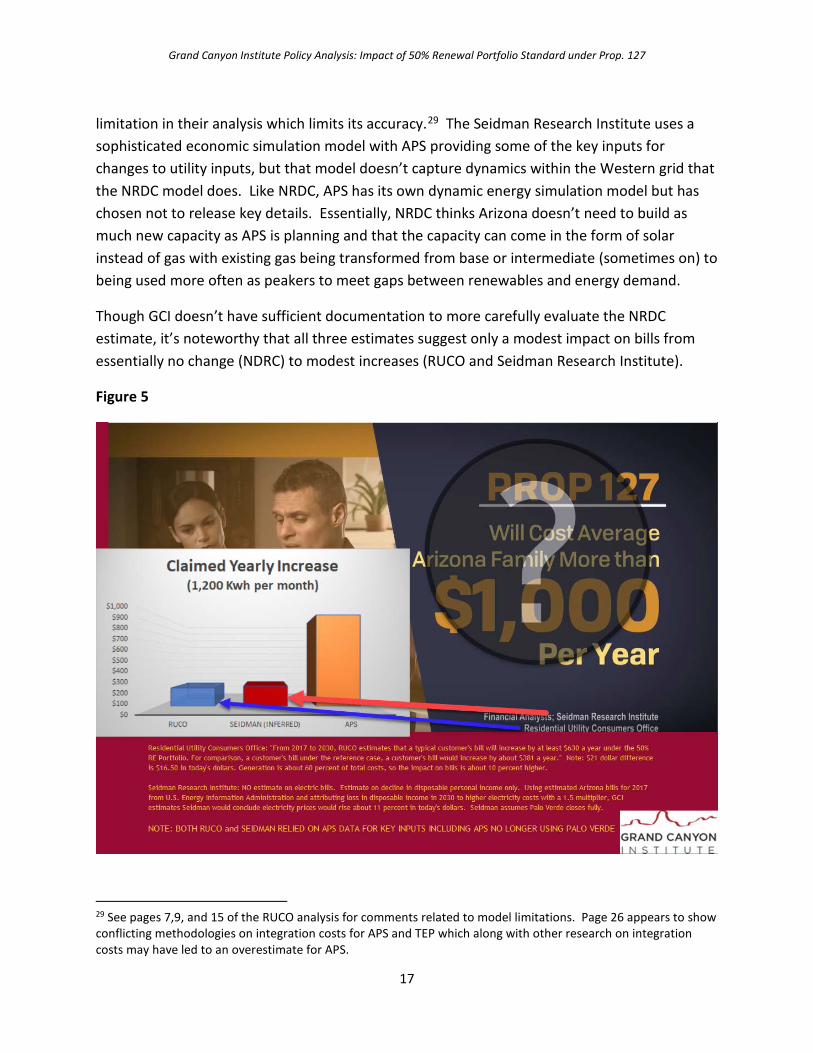
Though GCI doesn’t have sufficient documentation to more carefully evaluate the NRDC estimate, it’s noteworthy that all three estimates suggest only a modest impact on bills from essentially no change (NDRC) to modest increases (RUCO and Seidman Research Institute).
Figure 5
29 See pages 7,9, and 15 of the RUCO analysis for comments related to model limitations. Page 26 appears to show conflicting methodologies on integration costs for APS and TEP which along with other research on integration costs may have led to an overestimate for APS.
Grand Canyon Institute Policy Analysis: Impact of 50% Renewal Portfolio Standard under Prop. 127
18
Where does that $1,000 Figure come from anyway? On August 8, 2018, the Seidman Research Institute released a memo to and on behalf of APS that under Prop. 127, electricity rates for a typical household would rise $1,936 from 2017 to 2030. If one reads the notes on the memo, it’s evident that APS provided all the numbers and then asked Seidman to do the math and presumably APS sought its release in a misleading manner. The memo doesn’t reflect the normal way the Seidman Research Institute would do research, but then again, this isn’t research. It’s simply calculating a rate based on numbers APS provided.30
If it was economic analysis and the electricity price really did rise that significantly, then one would not assume that demand would stay constant as the memo does. The estimated long-run price elasticity of demand for electricity is approximately -0.5, meaning if in real dollars (dollars here were not adjusted for inflation), a 50 percent rise in electricity prices (which is roughly what the memo states when adjusted for inflation) would mean that use of electricity would drop by 25 percent.31 If APS really thought that was an accurate assessment of prices,
30 Seidman Research Institute (2018), “Estimated Increase in Residential Electric Rates Associated with Clean Energy for a Healthy Arizona (50x30 Plan),” Aug. 9, http://seidmaninstitute.com/wp-content/uploads/2018/09/Memorandum-080918.pdf. Here are the assumptions/methods portion of the memo:
1. Generation-related revenue requirements were provided by APS for both the business- as-usual (BAU) and the 50x30 Plan along with total forecast demand for 2017 and 2030. (See APS 2017 Integrated Resource Plan, Attachment C.1(B).) These allow calculation of the required increase in the system-wide (residential and commercial) generation- related rates for electricity. Seidman assumes that the increase in generation-related rates applies equally to residential and commercial customers.
2. Non-generation-related rates are estimated to rise in line with inflation. An inflation rate of 2.5%, consistent with APS publicly-available plans, is used.
3. Seidman calculates that the average residential price is composed of 60.8% generation- related elements and 39.2% non-generation elements. (See APS Functionalized Revenue Requirement 2015 Test Year Report.) This is assumed to remain constant 2017-30. (GCI note-last sentence technically incorrect since generation rises faster the percentage can’t stay constant)
4. The composite increase in the average residential electricity price over the period 2017-30 following the adoption of the 50x30 Plan is the weighted average of the required increases in generation-related (see 1.) and non-generation-related (see 2.) rates.
5. Average usage per residential customer (see the Pinnacle West Capital Corp. 2017 Statistical Report for Financial Analysis) is assumed constant between 2017-30.
6. The average annual residential bill is calculated using the residential average usage (see 5.) the average residential prices (see 4.).
31Keibun, Mori (2012), “Modeling the impact of a carbon tax: A trial analysis for Washington State,” Energy Policy, Vol. 48, September, pp. 627-639, https://doi.org/10.1016/j.enpol.2012.05.067.
Grand Canyon Institute Policy Analysis: Impact of 50% Renewal Portfolio Standard under Prop. 127
19
then their projections to need to build 5 GW of added capacity would be far more than what was necessary.32
Figure 6 marks up the memo and includes underlying figures that were not revealed or explained in the memo. The most obvious omission is that there is no comparison to what APS rates would be in the absence of Prop. 127. Now GCI calculates that business as usual rate as $0.1654 per kwh, which is still significantly less than the calculated rate due to Prop. 127 of $0.2941 per kwh. By unpacking the methodology as revealed in the memo, GCI calculates the amount that APS indicated additional costs in 2030 alone due to Prop. 127 compliance as $4.55 billion.
That’s a staggering number, which strains credibility because it is more than the combined estimated costs for APS to close out its operations with Palo Verde nuclear generating station and the Four Corners coal plant.33 When adjusted to net present value, it represents twice what RUCO estimates added transmission and power integration costs from 2017-2030 might be. And as noted earlier, RUCO’s integration cost estimate may be too high.34
Whether the change in power sources will add costs is debatable because of the low cost of renewables even with storage compared to natural gas or coal. If there’s a presumption that some added capacity, primarily in battery storage will be needed, RUCO also estimates that to be approximately half of $4.55 billion when it is converted to Net Present Value. But like the others that revenue would not need to be recovered in one year.
Publicly, APS has claimed the initiative will cost them $10 billion in infrastructure costs without detailing it well along with $3.2 billion to close the two facilities ($13.2 billion total). Even if those figures are accurate—it seems suspicious to put one-third of that amount, $4.55 billion, into the one year they asked Seidman to calculate rates for, 2030.35 Full empirical details are provided in the Appendix.
32 Pinnacle West Corporation (2018), “Powering Growth, Delivering Value,” Investor Meetings Oct. 3, Slide 8 Proposition 127, http://s22.q4cdn.com/464697698/files/doc_presentations/2018/Investor-Meetings-October-3-2018.pdf. 33 Pinnacle West Capital (PNW) Q2 2018 Earnings Conference Call Transcript, August 3, 2018, https://www.fool.com/earnings/call-transcripts/2018/08/07/pinnacle-west-capital-pnw-q2-2018-earnings-confere.aspx. 34 The Net Present Value used in APS materials applies a 7.5 percent discount rate. So, for instance, $4.55 billion in 2030 is divided by 1.07513 to get its Net Present Value in 2017, which equals $1.9 billion. Meaning if you had $1.9 billion in 2017 and invested it with a 7.5 percent rate of return in 2030 it would equal $4.55 billion. 35 Pinnacle West Corporation (2018), “Powering Growth, Delivering Value,” Investor Meetings Oct. 3, Slide 8 Proposition 127, http://s22.q4cdn.com/464697698/files/doc_presentations/2018/Investor-Meetings-October-3-2018.pdf.

Grand Canyon Institute Policy Analysis: Impact of 50% Renewal Portfolio Standard under Prop. 127
20
Figure 6
Grand Canyon Institute Policy Analysis: Impact of 50% Renewal Portfolio Standard under Prop. 127
21
What Happens to the Energy Mix if Prop. 127 Passes? Does Palo Verde close? If Prop. 127 passes, everyone gets the main idea that solar and wind generation would increase and coal will disappear faster. That sounds positive from a climate mitigation standpoint. However, solar and wind are variable power sources and the initiative does not allow credit toward the 50 percent renewables for Palo Verde’s nuclear generation—as it’s carbon-free but not considered renewable and it also precludes including existing hydro-generation. Both hydro and nuclear are consistent sources of carbon-free power and not subject to loss of power when the wind doesn’t blow, there’s cloud cover, or as what occurs every day as the sun sets. Consequently, while solar and wind may be attractive, they must be combined with other power sources or storage in order to ensure that power supply can meet power demand.
Generally, the NRDC thinks that APS overestimates electricity demand growth, so existing gas generation can be combined with additional solar. The use of solar battery storage to cover the duck curve (the time between when the sun begins to set and the end of peak demand) also plays a role though the NRDC model suggests natural gas generation being used as peakers to fill the gap initially.
By contrast, the APS and RUCO estimate assumes far more generative capacity needing to be built and Palo Verde no longer supplying power.
The differences in part are based on an assumption from APS that demand will grow much faster for electricity than NRDC expects will occur. APS anticipates electricity demand growing 3.3 percent annually, and peak demand rising 2.3 percent, though their actual demand estimates in their IRP suggest slower growth.36 NRDC instead relies on electricity projections from the U.S. Energy Information Agency which suggest a much slower growth rate of about 1 percent annually for the Pacific region. That rate of growth is consistent with Arizona’s experience over the last 15 years.37 In 2000 consumption was 918.9 trillion BTU and by 2016 it had risen to 1,033.5 trillion BTU with no real net increase over the last ten years. Consequently, their model foresees less new capacity being necessary to meet demand.
This data raises doubts about whether the amount of generating capacity APS is planning is necessary.
Regardless of these estimates, GCI anticipates Palo Verde will remain open.
36 APS, “2017 Integrated Resource Plan,” p. 33, https://www.aps.com/library/resource%20alt/2017IntegratedResourcePlan.pdf. 37 U.S. Energy Information Agency, Table CT8. Electric Power Sector Consumption Estimates, 1960-2016, Arizona. https://www.eia.gov/state/seds/data.php?incfile=/state/seds/sep_use/eu/use_eu_AZ.html&sid=AZ

Grand Canyon Institute Policy Analysis: Impact of 50% Renewal Portfolio Standard under Prop. 127
22
Palo Verde has very low marginal costs around $22 per MWH. This is cheaper than natural gas. However, unlike natural gas, nuclear power can’t be readily dialed up and dialed down. The concern arises that during the late winter and early spring and possibly fall when solar generation picks up but electricity demand is modest so that the wholesale market price for electricity will be below marginal cost. In 2017 for instance, wholesale prices dipped below $22 on 25 days, primarily in February and March.38 With the expanded growth of solar in California, the amount below $22 and the number of days beloq could increase, undermining Palo Verde’s net profitability.
However, while under Prop. 127 nuclear does not count toward the RPS, demand for nuclear power should be bolstered by California Senate Bill 100 which calls for 100 percent carbon-free energy by 2045 with 60 percent renewable by 2030. This may not help when prices are low, but should support Palo Verde more strongly at other times. Likewise, Palo Verde currently shuts down one of its three units for refueling in April and October. This schedule could be adjusted and possibly prolonged to better coincide with times when the wholesale price of electricity falls short of marginal costs. Recent research from MIT suggests nuclear plants may be better able to adapt to the flexible world of renewable energy.39
The EIA sees Palo Verde as having strong fundamentals. As the largest nuclear power-plant in the country Palo Verde has one of the lowest, if not the lowest, costs of operation due to larger economies of scale. Even under a highly price competitive environment from gas and 20 percent higher operations costs for nuclear, Palo Verde will remain open based on calculations from the Energy Information Administration. See Figure 7 below. Even under its worst case scenario where the price environment is very favorable to oil and natural gas resource technology (HRT) and operating costs of the nuclear facility rise 20 percent, Palo Verde stays open even as other nuclear facilities close. Palo Verde is not unilaterally controlled by APS either—its fellow owners would have to agree to close it, which given California’s 100 percent clean energy mandate by 2045 seems very unlikely. APS could sell, but clean energy assets are going to be worth holding on to.
38 U.S. Energy Information Agency, “Wholesale Electricity and Natural Gas Market Data,” Southwest (Palo Verde), 2017, https://www.eia.gov/electricity/wholesale/. 39 Jenkins, J.D., Z. Zou, R. Ponciroli, R.B. Vilim, F. Ganda, F. de Siisternes, A. Botterud (2018), “The beneifts of nuclear flexibility in power system operations with renewable energy,” Applied Energy, Vol. 222 (July), pp. 872-884, https://doi.org/10.1016/j.apenergy.2018.03.002.

Grand Canyon Institute Policy Analysis: Impact of 50% Renewal Portfolio Standard under Prop. 127
23
Figure 7 U.S. Energy Information Agency Expects Even Under Challenging Circumstances Palo Verde Stays Open
Grand Canyon Institute Policy Analysis: Impact of 50% Renewal Portfolio Standard under Prop. 127
24
Conclusion Climate change threatens the state’s economic future. Arizona needs to update its RPS or develop a far more aggressive clean energy policy to do its part to mitigate the impact of climate change. Prop. 127 represents one approach to doing so but is not the only means that could be pursued.
GCI finds that claims made by Prop. 127’s opponents are inaccurate—any impact on bills is modest, not dramatic.
In addition, though Palo Verde may be squeezed by the emerging solar generation that pushes down wholesale prices in the late winter and early spring, it should remain viable as it has sufficient cost-effectiveness and there are countervailing factors such as California’s mandate to get 100 percent of electricity from carbon-free sources.
Ultimately voters have to consider whether to back Prop. 127, or seek out corporation commissioners who will work strongly to implement a better RPS or clean energy standard and avoid potential complications from amending the Constitution.
Dave Wells holds a doctorate in Political Economy and Public Policy and is the Research Director for the Grand Canyon Institute, a centrist fiscal policy think tank founded in 2011. He can be reached at [email protected] or contact the Grand Canyon Institute at (602) 595-1025, ext. 2.
The Grand Canyon Institute, a 501(c) 3 nonprofit organization, is a centrist think tank led by a bipartisan group of former state lawmakers, economists, community leaders and academicians. The Grand Canyon Institute serves as an independent voice reflecting a pragmatic approach to addressing economic, fiscal, budgetary and taxation issues confronting Arizona.
Grand Canyon Institute
P.O. Box 1008
Phoenix, Arizona 85001-1008
GrandCanyonInstitute.org
Grand Canyon Institute Policy Analysis: Impact of 50% Renewal Portfolio Standard under Prop. 127
25
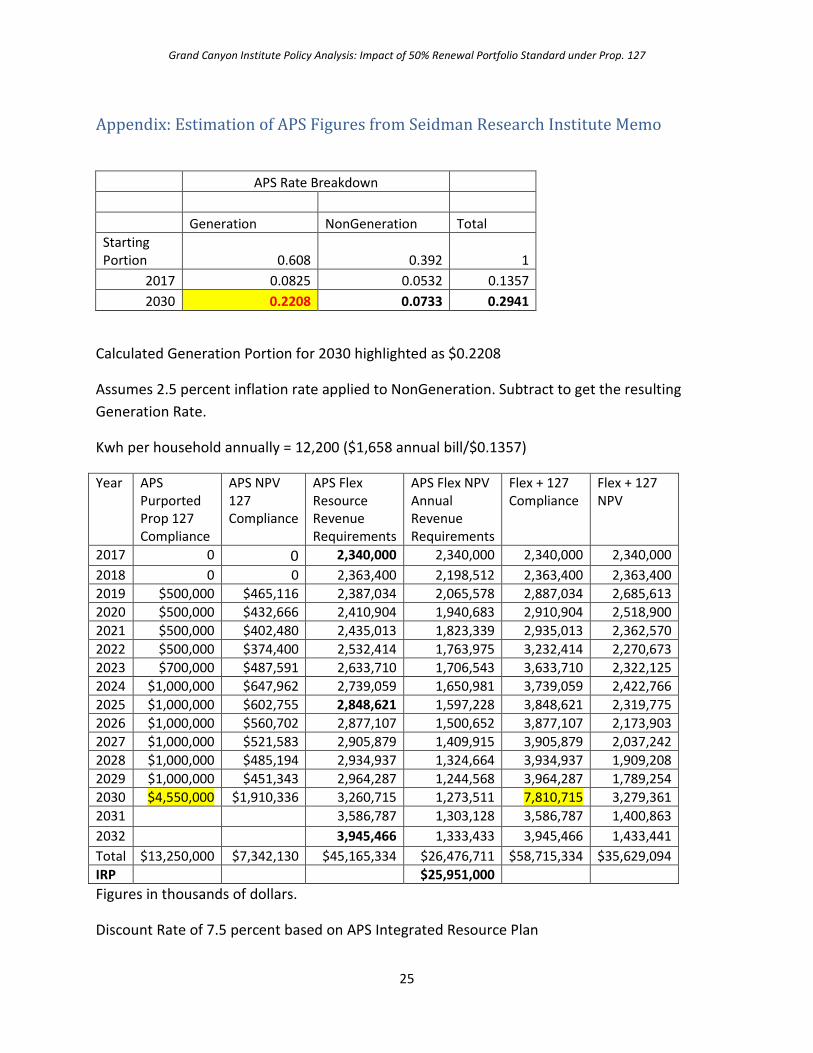
Appendix: Estimation of APS Figures from Seidman Research Institute Memo
APS Rate Breakdown
Generation NonGeneration Total Starting Portion 0.608 0.392 1
2017 0.0825 0.0532 0.1357 2030 0.2208 0.0733 0.2941
Calculated Generation Portion for 2030 highlighted as $0.2208
Assumes 2.5 percent inflation rate applied to NonGeneration. Subtract to get the resulting Generation Rate.
Kwh per household annually = 12,200 ($1,658 annual bill/$0.1357)
Year APS Purported Prop 127 Compliance
APS NPV 127 Compliance
APS Flex Resource Revenue Requirements
APS Flex NPV Annual Revenue Requirements
Flex + 127 Compliance
Flex + 127 NPV
2017 0 0 2,340,000 2,340,000 2,340,000 2,340,000 2018 0 0 2,363,400 2,198,512 2,363,400 2,363,400 2019 $500,000 $465,116 2,387,034 2,065,578 2,887,034 2,685,613 2020 $500,000 $432,666 2,410,904 1,940,683 2,910,904 2,518,900 2021 $500,000 $402,480 2,435,013 1,823,339 2,935,013 2,362,570 2022 $500,000 $374,400 2,532,414 1,763,975 3,232,414 2,270,673 2023 $700,000 $487,591 2,633,710 1,706,543 3,633,710 2,322,125 2024 $1,000,000 $647,962 2,739,059 1,650,981 3,739,059 2,422,766 2025 $1,000,000 $602,755 2,848,621 1,597,228 3,848,621 2,319,775 2026 $1,000,000 $560,702 2,877,107 1,500,652 3,877,107 2,173,903 2027 $1,000,000 $521,583 2,905,879 1,409,915 3,905,879 2,037,242 2028 $1,000,000 $485,194 2,934,937 1,324,664 3,934,937 1,909,208 2029 $1,000,000 $451,343 2,964,287 1,244,568 3,964,287 1,789,254 2030 $4,550,000 $1,910,336 3,260,715 1,273,511 7,810,715 3,279,361 2031 3,586,787 1,303,128 3,586,787 1,400,863 2032 3,945,466 1,333,433 3,945,466 1,433,441 Total $13,250,000 $7,342,130 $45,165,334 $26,476,711 $58,715,334 $35,629,094 IRP $25,951,000 Figures in thousands of dollars.
Discount Rate of 7.5 percent based on APS Integrated Resource Plan

Grand Canyon Institute Policy Analysis: Impact of 50% Renewal Portfolio Standard under Prop. 127
26
For 2017 attempted to match the nominal APS Flex Resource Nominal Revenue Requirements shown in a graph on p. 125 of the IRP for 2017, 2025 and 2032, while also trying to keep the 2017-2032 NPV for the APS Flex Resource Plan at $25,951,000 as noted in the IRP on p. 125. In addition, the original Seidman calculated generation rate of 0.0825 based on 28,351 GWH consumed in 2017 (IRP, Appendix C.1(B), p. 245) required that the revenue requirement be $2.34 billion in 2017. This is slightly higher than what the graph appears to show on p. 125. Consequently, the NPV total is 2 percent higher for the period 2017-2032 in the GCI simulation than the $25.951 billion shown in the APS IRP on p. 125 when an effort was made to match up the nominal revenue requirements also noted on the page in graphical form. These match up points are bolded in the table.
For 2030 the electricity consumption is 35,406 GWH consumed based on APS’ planning estimate noted in its Appendix on C.1(B), p. 251. To generate the $0.2208 per kwh cost figure, required the additional amount due to Prop. 127 compliance for 2030 to be $4.55 billion to reach the $7.81 billion figure that provided the required rate.
Given that APS has stated that total compliance costs including plant retirements could total about $13.2 billion, the hypothesized compliance breakdown shows a four-fold jump from 2029 to 2030, which makes the figure suspicious and not representative even using the APS high-cost scenario depicted here.
This table also enabled calculation of the base rate for generation for 2030 under the business as usual case of $.0921 per kwh for generation using just the Resource Flex nominal revenue requirement and electricity consumed. The nongeneration portion is the same based on the assumption of the memo, yielding a total 2030 BAU rate of $0.1654.