impact based forecast for heavy rainfall: subjective and
TRANSCRIPT

Impact based Forecast for Heavy rainfall:
Subjective and Objective approaches
DR RAJENDRA K. JENAMANI
Head, RSMC
National Weather Forecasting Center(NWFC)
IMD, New Delhi
Objective ➢ Heavy rainfall- Event , Hazard and Impact (Primary and secondary types
classification)
➢ Towards Computing Vulnerability and Exposure
• Static data from various sources upto districts and sub-city scale
• Preparation of MH color coded Risk based Warning(Risk types and
Occurrence probability)
➢ Four stages of Development(Threshold method, Qualitative combination
method, Impact modelling method and Climate- sensitivity method)
➢ Real time IBF adopted by IMD in monsoon 2019-2021 at Met Sub-division
wise and district scale, City based and Skill of IBF in monsoon
➢ Issues and Challenges

Hazards classification(Primary): Heavy
rainfall ➢Floods:
▪ Pluvial (Surface Flood)/Flash flooding(especially Urban
flooding)
▪ Costal flooding(low tide/high tide and rainfall epochs)
▪ Riverine flooding
➢Land slide and Land sink
➢Dam burst

Heavy rainfall Impact classification: Hazard-Flood

Methodology• Threshold method: Define a forecast threshold at which people or infrastructure in a specific
location are expected to be negatively impacted, based on the vulnerability of that
location/infrastructure. Data required-At least one historical event, or simulations, to identify
magnitude of hazard impact.
▪ Qualitative combination method: In addition to threshold method, a generalized impact is
developed for each severe weather type through consensus among the forecasters based on
subjective assessment of potential impacts corresponding to weather warning threshold. Daily VC
▪ Impact modeling method: Develop a model that combines hazard magnitude with vulnerability and
exposure to predict a level of impact. Data required-Historical hazard and impact data as well as
data on the relationships between them to improve the model
▪ Climate- sensitivity method: Using a combination of socio-economic baseline data and climate
data, identify areas where vulnerability is most closely correlated with forecastable climate risks.
Data required: Baseline socioeconomic data, livelihood zones & climatology

Progress in IMD and other MoES
Institutions for Heavy Rainfall-IBF and
Risk based warning ➢Heavy rainfall- Event and Hazard Data
➢Hazard, Exposure and Vulnerability for preparing color
coded Impact and Risk based Warning
➢Four stages of Development(Threshold method,
Qualitative combination method, Impact modelling
method and Climate- sensitivity method)

Definition and TerminologyDaily Rainfall (intensity of Rainfall- 24-hours)
Distribution No. of Places Description
Isolated one or two places <25% of stations gets rainfall
Scattered At a few places (26-50)% of stations gets rainfall
Fairly
Widespread
At many places (51-75)% of stations gets rainfall
Wide spread at most place (76-100)% of stations gets rainfall
Forecasts for spatial distribution over Met-Sub-division/district
Intensity/Hour Rainfall statistics of occurrences
Rain rate range
Light Spell Upto 50th percentile Rainfall up to 1 cm/hour
Moderate Spell Upto 80th percentile Rainfall up to 1-2 cm/hour
Intense Spell 90th percentile Rainfall 2-3 cm/hour
Very Intense Spell
99.9th percentile Rainfall 3-5 cm/hour
Extremely intense Spell
>99.99th percentile Rainfall 5-10 cm/hour
Cloud Burst - Rainfall>10cm/hours
Spell-Intensity of Rainfall-(1-Hour)

Climatology(Average frequencies in June-Sept( Heavy rainfall, Very heavy rainfall and Extremely Heavy
Rainfall days)
• Frequencies of heavy rainfalls are
highest in northeast and West Coast
of India with 2nd peak along foothills
of Himalaya and along central parts
of the country.
• Frequencies are highest in
ARPR, Assam, Meghalaya,
SHWB and Sikkim, HP,
Uttarakhand east coast, south
Chhattisgarh, and West Coast
of India
Location of IMD rain
gauges

Cloudburst▪ Extreme amount of rainfall realized in very short period of time
▪ IMD criteria-Any Precipitation event exceeding 100mm/h
▪ Frequencies over India
➢ Highest in and around the southern rim of the Indian Himalayas especially over Uttarakhand,
HP and northeastern hill states
➢ Westcoast over windward side Western Ghats Hills from Goa to Saurashtra
▪ Areas vulnerable over western Himalayas
➢ At between elevation range of 1000 m and 2500 m occurred within a small geographic area of 20-30
km
➢ 30 cloud burst events have occurred over the southern rim of the Himalayas during 1970-2016, and
around 17 cloud burst events among them occurred in Garhwal region of Uttarakhand
➢ Droplet size ranges from ~4 – 6 mm with fall speed of ~10 m/s
▪ Possible causes
➢ Orographic architecture of the mountain regions
➢ Monsoonal moist laden winds at lower levels from southeast/east towards the hills, coupled with vertical
shear in wind and orographic uplifting leading to intensely precipitating convective systems

Cloudburst Occurrences: Lack of
rainfall data and observing system
Rainfall of 3-5 cm per hour in the steep slope
mountainous regions of Himalayas. May cause
flash flood, land slides, debris flow, flash floods
with huge damages to properties and human
losses, irrespective of the rainfall amount.
Totally 28 Cbs as
per IMD criteria
Occurrences of CB events 1969-
2015 –IMD SRG/ARG data

Station State 1-day rainfall in cm Date of occurrence
1 Cherrapunji Obsy Meghalaya 156.3 16-Jun-1995
2 Amini Divi Lakshadeep 116.8 6-May-2004
3 Cherrapunji Meghalaya 103.6 14-Jun-1876
4 Ambarnath Maharashtra 101.0 27-Jul-2005
5 Cherrapunji Meghalaya 99.8 12-Jul-1910
6 Mausynram Meghalaya 99 10-Jul-1952
7 Dharampur Gujarat 98.7 2-Jul-1941
8 Cherrapunji Meghalaya 98.5 13-Sep-1974
9 Mawsynram Meghalaya 98 4-Aug-1982
10 Tamenlong Manipur 98 10-Aug-1970
11 Cherrapunji Meghalaya 97.4 5-Jun-1956
12 Mawsynram Meghalaya 94.5 7-Jun-1966
13 Mumbai Maharashtra 94.4 27-Jul-2005
14 Tamenlong Manipur 94 28-Jul-1970
15 Cherrapunji Meghalaya 93 15-Jun-1995
16 Guna Madhya Pradesh 92.8 23-Aug-1982
17 Cherrapunji Meghalaya 92.5 27-Jun-1934
18 Cherrapunji Meghalaya 90.7 25-Jun-1970
Highest one- day rainfall-in-24-hours- Over India as per IMD data
till
Observational/forecasting aspects of the meteorological
event that caused a record highest rainfall in Mumbai
RK Jenamani, SC Bhan, SR Kalsi - Current Science, 2006
-

Major High impact rainfall event leading to flood/flash flood/land slide leading to huge
lives/property losses and disruption of services in 2005-2021
• Mumbai Unusual Extreme Rainfall event 26-27 July 2005 -94-115cm(21 cm in an hour 1430-1530IST). 400 people lost their lives
• Leh cloud burst (1.3 cm far station recorded) on 6 August, 2010 leading to flash flood and mud slides
leading to over 200 deaths
• The Uttarakhand 14-17 June 2013 Event- ( with cumulative 12-35cm over the Kedarnath area with other down side of 30-
45cm and Dehradun - 60cm), devastating flash flood and series of landslides triggered killed around 6000 people made
100,000 people stranded.
• 30 July 2014, Malin was hit by mud flow/land slide early in the morning while residents were asleep and it was caused
by a burst of heavy rainfall, and killed at least 134 people.
• Kashmiri extreme Rain event 3-7 Sept 2014- with cumulative 30 to 61cm in 3 to 4 days with worst effect at capital town
of Srinagar. Around 250 lives lost with evacuation of 250,000 people
• Chennai 1-2 Dec 20-15 Extreme rainfall event -(34.5 cm at Chennai Airport with 49.4cm at Tambram)- more than 500
people were killed
• Kerala 14-16 Aug 2018 Extreme rains and Floods -25-35cm with cumulative 60-70cm by which 483 people died
• West Coast flood during different period of 1-12 Aug 2019: A Series of extreme rainfall events hit west coast of India
covering Kerala, Karnataka, Maharashtra and Gujarat and caused huge losses to lives and property (around 200 people
lost their lives 200 people (30-50cm per day have been reported)
• Monsoon 2020 - Example-Extremely heavy rainfall spell over Maharashtra, Karnataka, Kerala and adjoining Tamil Nadu
during 4-8 August 2020 -Kerala Munnar landslide and Kodagu landslides
• Monsoon 2021-Maharshtra flood -Death toll 228, highest in Raigad with 95
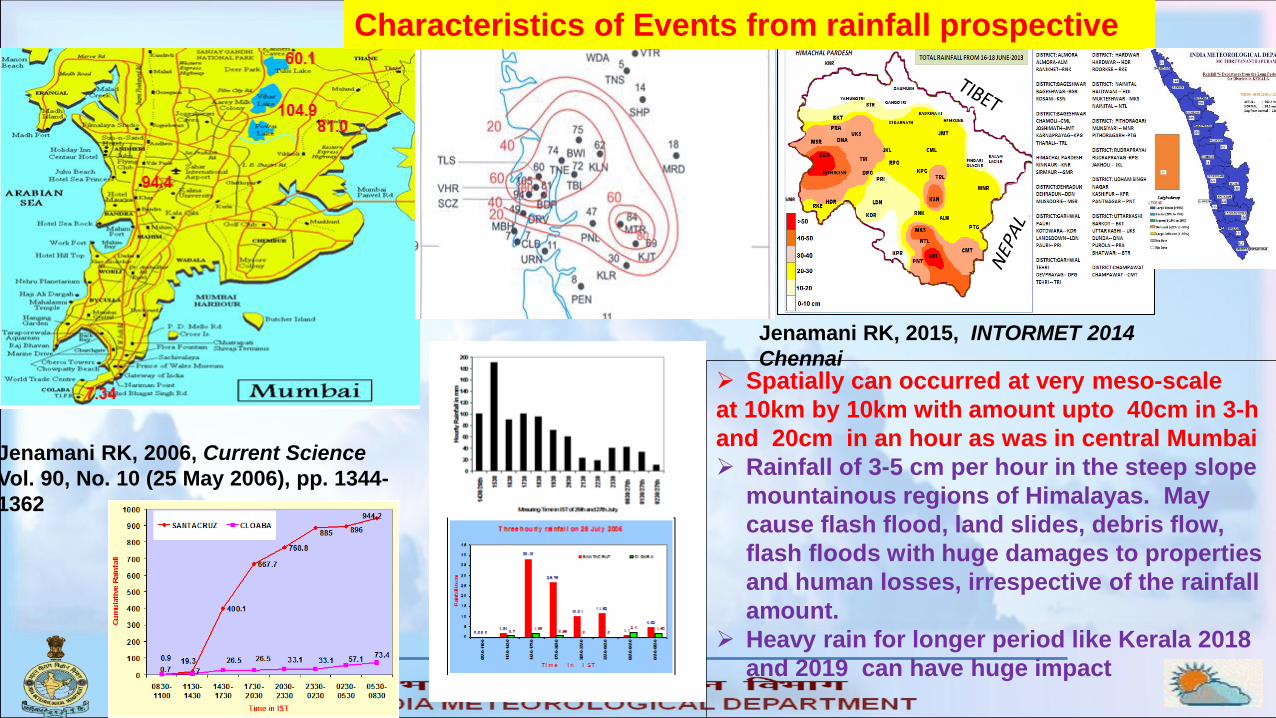
Jenamani RK, 2006, Current Science
Vol. 90, No. 10 (25 May 2006), pp. 1344-
1362
Jenamani RK, 2015, INTORMET 2014
Chennai
Characteristics of Events from rainfall prospective
➢ Spatially can occurred at very meso-scale
at 10km by 10km with amount upto 40cm in 3-h
and 20cm in an hour as was in central Mumbai
➢ Rainfall of 3-5 cm per hour in the steep slope
mountainous regions of Himalayas. May
cause flash flood, land slides, debris flow,
flash floods with huge damages to properties
and human losses, irrespective of the rainfall
amount.
➢ Heavy rain for longer period like Kerala 2018
and 2019 can have huge impact
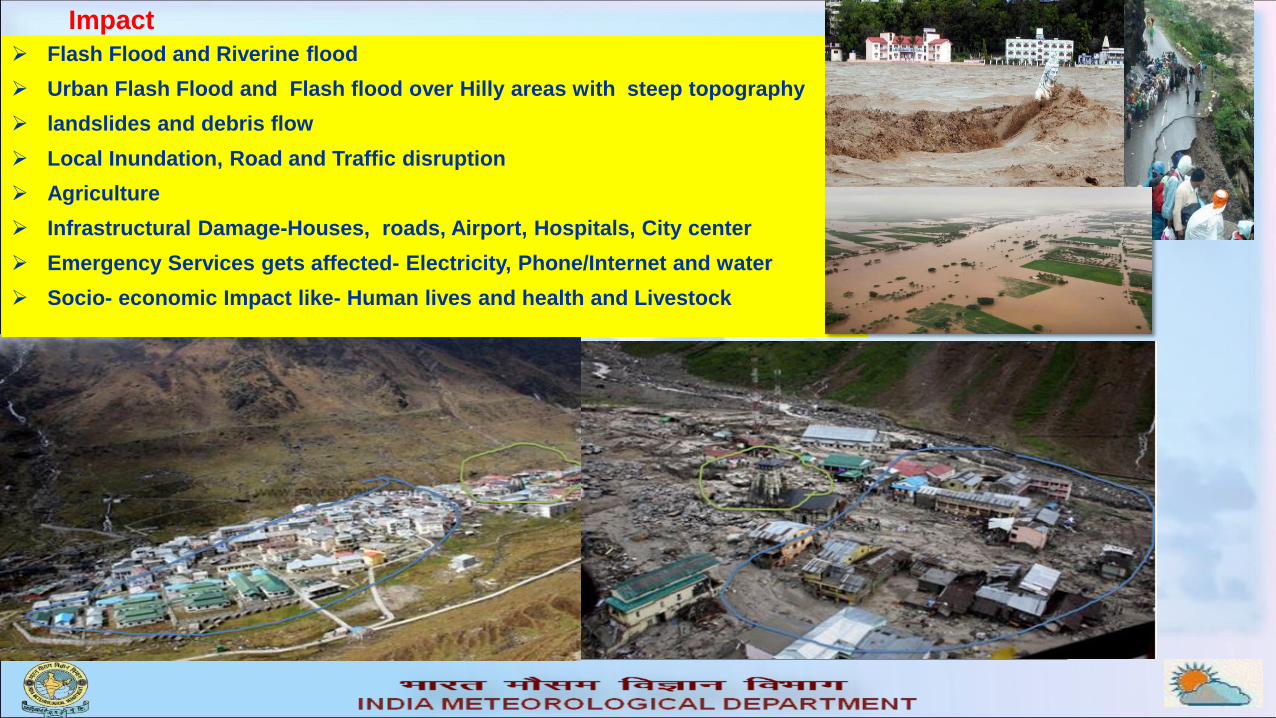
Impact
➢ Flash Flood and Riverine flood
➢ Urban Flash Flood and Flash flood over Hilly areas with steep topography
➢ landslides and debris flow
➢ Local Inundation, Road and Traffic disruption
➢ Agriculture
➢ Infrastructural Damage-Houses, roads, Airport, Hospitals, City center
➢ Emergency Services gets affected- Electricity, Phone/Internet and water
➢ Socio- economic Impact like- Human lives and health and Livestock

Impact of Urban Heavy rain spell/Extreme rainfall event

400200
6000
134 250500 483
200
1200
0
600
0
625500 602 700
0
1000
2000
3000
4000
5000
6000
7000
Mumbai 26-27July 2005
Leh cloud burst 6Aug 2010
Uttarakhand 14-17 June 2013
30 July 2014,Malin
Kashmiriextreme Rainevent 3-7 Sept
2014
Chennai 1-2 Dec2015 Extremerainfall event
Kerala 14-16 Aug2018 Extreme
rains
West Coast floodduring different3-days period of1-12 Aug 2019
Lives Lost
Rainfall during the period cumulative in mm
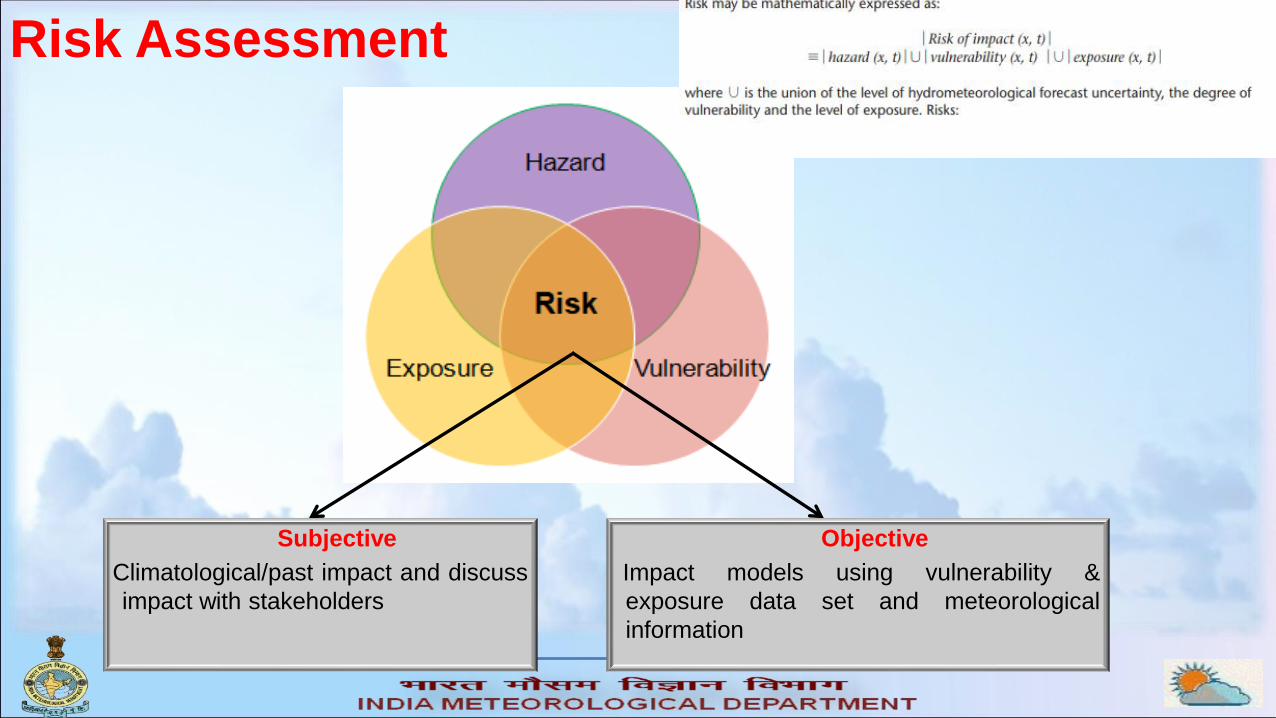
Risk Assessment
Subjective
Climatological/past impact and discuss
impact with stakeholders
Objective
Impact models using vulnerability &
exposure data set and meteorological
information


IBF of IMD operational during (Stage 1 and Stage 2)

Stage-I and II (Threshold method and Qualitative combination method)
▪ Stage I
▪ Develop a generalized impact for each severe weather type through consensus among the forecasters
based on subjective assessment of potential impacts corresponding to weather warning threshold
Development of an Impact based Forecast System in India
through four stages
14 September (Day 1):
Heavy to very heavy rainfall with Extremely heavy falls very likely at isolated
places over East Rajasthan and Meghalaya; Heavy to very heavy rainfall very
likely at isolated places over West Madhya Pradesh, Assam and Gujarat
Region and Heavy Rainfall at isolated places over Uttarakhand, Uttar Pradesh,
Bihar, Sub-Himalayan West Bengal & Sikkim, Andaman & Nicobar Islands,
Arunachal Pradesh, Nagaland, Manipur, Mizoram & Tripura, Madhya
Maharashtra, Konkan & Goa, Coastal Andhra Pradesh and Tamilnadu,
Puducherry & Karaikal.
• Generalised Impact information in terms of inundation, traffic jam etc for
red colour warning two days in advance.
• Commenced in 2019 monsoon season

22 October (Day 1)
Heavy to very heavy rainfall with extremely heavy falls at isolated
places very likely over Coastal Andhra Pradesh & Yanam; Heavy to
very heavy rainfall at a few places over Coastal Karnataka; at
isolated places over Konkan & Goa, Rayalaseema, Interior Karnataka,
Kerala & Mahe, Tamilnadu, Puducherry & Karaikal and Heavy
Rainfall at isolated places over Madhya Maharashtra, Marathwada
and Telangana.
Example : heavy rainfall-Monsoon 2019-Stage I and Stage II

Stage III and IV-Monsoon 2020
➢IBF for 25 cities implemented in monsoon 2020
started Exposure and Vulnerability data collected
for computing and assigning color code for Risk
based matrix
➢District-wise vulnerability also addressed

➢IMD guidelines 2020
▪ Monsoon 2020
❑ Met sub-division wise and district wise implemented for all major rainfall events
❑ In June 2020: SOP for Four stage IBF Heavy rainfall warning system implemented for 25
cities and at district levels.
✓ It is upto sub-city level at 5-days lead period (Guidance, Alert and Warning)-Mumbai ,
Jaipur, Bhopal, Hyderabad, Chennai, etc
❑ Products from Hazard and Impact Models- Implementation of Stage 3 and Stage 4 of IBF
Heavy rainfall
▪ I-FLOWS Mumbai and C-FLOWS Chennai implemented- Dynamic model based impact wrt
flood hazard covering areas and depth of inundation, types of exposure and vulnerability
▪ FFGS IMD-WMO
❑ Verification of IBF and Report preparation for Monsoon 2020

Stage 3 and Stage 4- Adopted in monsoon 2020-What we
did?➢ Massive socio-economic exposure and vulnerability data collection at city and district scale in
progress for various weather related hazards-NWFC/MC level
➢ IBF of Heavy Rainfall implemented at 25 capital Cities in monsoon 2020
• SOP of four stage EWS was adopted
▪ Colour coded for Risk based matrix has been prepared using past rainfall events-vulnerability
and past impact data for Mumbai, TRV, BHP and HYD
▪ The heavy rainfall intensity, frequencies and duration over a city has been considered for this
purpose.
▪ Integrated with Hazard details and Impact Scenario as available from
➢ Chennai Flood warning system (C-FlOWS) and Mumbai Flood warning system (I-FLOWS) in
full use in monsoon 2020 with time to time updates
▪ Feed back were shared with NCCR
➢ Further works in progress with NCCR, IITM, NCMRWF, WCSSP(INDO-UK Project, Sate Govt,
NDMA, RIMES, Agri. Univ., CWC, GSI, Media, Municipal corporations etc

Mega-city Integrated Flood warning System –A collaboration of stake holder-NCCR-IMD-IITM-NCRMWF-
Municipal Authority –C-FLOWS and I-FLOWS for Chennai and Mumbai

Flash Flood Threat for Mumbai on 9 June
2021 – Rainfall received: 210 mm in 24
hours.
Suburban Mumbai
Flash Flood Threat for Odisha on 26
May 2021 – Rainfall received: 300 mm
in 24 hours.
Odisha
South Asia Flash Flood Guidance System
▪ 30000 watersheds
with 4X4 km
resolution.
▪ Flash Flood Threat
issued for next 6
hours.
▪ Flash Flood Risk is
issued up to next 36
hours.
System put in operations
with effect from 23
October 2020.

Integrated Flood Warning System (i-Flows Mumbai)

Impact Based Forecast(IBF) and warnings IBF & Warning Stages
➢ Stage -1: Heavy rainfall Watch-
(3-4 days lead time daily update)
➢ Stage-2: Heavy rainfall Alert: (48
hours prior to the occurrence of
event at 12 hourly updates)
➢ Stage-3: Heavy rainfall Warning
(24 hours prior to the
occurrence of event at 06/12-
hourly updates)
➢ Stage-4: 12-Hours prior to
occurrence event–at 3-hourly
updates.


Impact Based Forecast(IBF) and warnings IBF & Warning Stages
➢ Stage-1:Heavy rainfall Watch-(3-
4 days lead time daily update)
➢ Stage-2:Heavy rainfall Alert: (48
hours prior to the occurrence and
12 hourly updates)
➢ Stage-3:Heavy rainfall Warning
(24 hours prior to occurrence &
06/12-hourly updates)
➢ Stage-4:12-Hours prior to
occurrence–3-hourly updates.

Performance of IBF-Heavy rainfall in
Monsoon 2020

Date (Periods) Areas of Low pressure System
(LPS) formed
Moved across and dissipated Duration of
LPS
ISMR WEEKLY
4-10 Aug Northwest Bay of Bengal (NW
BOB) off Odisha-west Bengal
coast as well marked low -WML
Very fast moving in the 1st half. Moved across central India and
Gujarat and entered into North Arabian Sea and dissipated over
Oman coast
6 +13%(FOR
Week ending on
12 Aug)
9-11 Aug Northwest and adjoining
Westcentral Bay of Bengal off
Odisha-north Andhra Pradesh
coasts
Very fast moving and within 36-hours, it moved across
Chhattisgarh to NE MP only. Its remnant moved to northwest
India and caused Jaipur flood on 14 Aug 2020
2
13-18 Aug NW BOB off Odisha coasts-well
marked low 3 days
Slow moving system
Across Chhattisgarh To NEMP, but its remnant as circulation
moved over to NE raj and South Punjab during 18-20 Aug
caused major spell over NW India - a most peak spell in the
season for NW India with NCR-Gurugram flood on 19 Aug
5 42%(for week
ending on 19
Aug)
19-26 Aug NW BOB-north Odisha-WML Slow moving system in the 2nd half of its life. Across central
India to southwest Raj and adj South Pak -caused flood over
Odsiha ON 20-21 Aug, over Telengana including Wrangle and
part of Hyderbad on 21 Aug, west MP –Flood over Bhopal on
22 Aug , South Raj and Gujarat-Flood on 23 and 24
7 41%(for week
ending on 26
Aug)
24 Aug -2 Sept North BOB -WML and lay over
north Odisha south GWB
Slow moving system in the 1st half of its life. Moved to Pak and
west Raj across north Odisha –south GWB, south Jahrkhand,
north Chhattisgarh, north EMP and then central parts of WMP
–Caused flood over Odisha and over MP and adj Raj-Gujarat
9

City IBF cases
➢For Mumbai- 4-7 July, 14-17 July, 4-6 Aug , 21-23
Sept 202
➢For Jaipur-14 Aug 2020
➢For Hyderabad -13 Oct
➢For Guwahati, Shilong-23 Oct
➢For Delhi- 22 July

Example-Extremely heavy rainfall spell over Maharashtra, Karnataka,
Kerala and adjoining Tamil Nadu during 4-8 August 2020”
➢Rain Event(District wise)
▪ 4 Aug- Mumbai (Dharavi)-38, Mumbai (Santacruz)-26; Mumbai (Colaba)-25,
Hosanagar-21, Bhagamandala-19
▪ 5 Aug- Palghar-46, Talasari-39, Dahanu -38, Matheran-25, Ratnagiri-22,
Kalyan-17, Thane-17, Santacruz - 8, Colaba-5
▪ 6 Aug- Vaibhavwadi-71(Sindhudurg); Mumbai(Colaba )-33 Mumbai(Santacruz)-
15,(All Konkan). MANANTODDY-19, VYTTIRI-18, NILAMBUR-10, KUPPADY-9,
MUNNAR KSEB-8(All Kerlal) Avalanchi-58(Nilagiri-TN); Bhagamandala-49 and
KOTTIGEHARA-39, (Kodagu)(all SIK)
▪ 7 Aug- PEERMADE TO-26, MUNNAR KSEB-23, IDUKKI-23, MANANTODDY-21,
VYTTIRI-19, MYLADUMPARA AGRI-18, KUPPADY-17, PALAKKAD-14(All Kerala)
BHAGAMANDALA-40, KOTTIGEHARA-36

Impact part of 4-8 Aug heavy rainfall levent
➢Mumbai- 6 Aug 2020
▪ local flash floods, inundation, road and traffic closures
affecting severely all mode of transports including air Traffic
and Airport operations, two lives were lost in Mumbai
▪ Mumbai (Colaba) reported the highest of 107kmph in
gustiness during 1700-1715 hrs IST on 6th August –Broken
windows, tree branches reported
➢ Munnar land slide- early hours of 7 Aug causing the death
toll of 60 people under slush from this huge landslide.
➢Talacauvery, Bhagamandala in Karnataka's Kodagu district
Land slide on the night of 5th August-5 people missed and
40 cows 40 cows have died in the devastation,

Munar and Kodagu land slide 2020» Future dense ARG/AWS network must be based on types of severe weather affecting district/areas most frequently
called vulnerability and its impact. Urban may have a different concept as any big-city has always needed dense network
for various customized information Sir
Kindly see the trailing e-mail on the research paper reporting very high ainfall data for Munnar landslide of last 6 Aug 2020.
» It is like accurately issued current weather/METAR in aviation may have 80-90% role in the safe operation of it, timely accurate
observation from a location or from an area helps and minimize disaster impact if not at in similar scale, but at least in manging
more affective the impact both from high temp and rainfall events
» Satellite and RADAR or any remote based observations may have limited role to get the areas experiencing extreme weather at
local scale. When we consider pockets experiencing, very high extreme temp of 45-50degC or extreme rainfall of 40-60cm in 24-
h, we need surface observational field data from these locations from an optimum dense network fully functional at 24X7 . Hence
density of AWS/ARG may vary as per vulnerability of district/areas and impacts e.g it may be the ideal network of ARG at each
10km for Mumbai, Kodagu and Munnar districts by looking at their rainfall variability at meso-scale, vulnerability and impacts,
while for Sohra Cherapunji areas, we do not need much ARG as the impact is very very less in later areas.
» It is like We choose the right coastal network and preferred met instruments HWSR, that can face the severity of cyclone
winds.
» One way, in case rainfall data network, for improving observations from extreme rainfall vulnerability pockets of India,
is to interact more with state and other private estate holders, who have their rainfall stations/network, like in the
present case, a tea estate company has rainfall data at Pettimudi station affected by a huge landslide on 6 Aug 2020 had
61.6cm with 300cm rainfall cumulatively got during 1-11 Aug 2020 (data provided by Pettimudi division Neymakkad Tea Estate,
KDHP Ltd.) while IMD got only upto some 25 cm on that day and cumulative 88cm, very less to kind of scale the disaster area
got.
» With regards

0.0
100.0
200.0
300.0
400.0
500.0
600.0 "3-4 Aug 2020 monsoon rianfall24-h4-5 Aug 2020 monsoon rianfall24-hSeries3
0.0
50.0
100.0
150.0
200.0
250.0
1 2 3 4 5 6 7 8 9 10 11
Munar daily rain in mm Aug 2020 monsoon

DATE of
Issue of IBF
SUB-DIVISION AND
DATE OF IMPACT
IMPACT & ACTION SUGGESTED
29.08.2020 Impact expected
over West Madhya
Pradesh & adjoining
southeast Rajasthan
on
29th August due to
Extremely Heavy
rainfall
1. Localized Flooding of roads, water logging in low lying areas and closure of underpasses mainly in urban areas
of the above region.
2. Occasional reduction in visibility due to heavy rainfall.
3. Disruption of traffic in major cities due to water logging in roads leading to increased travel time.
4. Minor damage to kutcha roads.
5. Possibilities of damage to vulnerable structure.
6. Localized Mudslides.
7. Damage to horticulture and standing crops in some areas due to inundation.
8. It may lead to riverine flooding in some river catchments (for riverine flooding please visit website of center water
commission (http://www.cwc.gov.in/))
9. For specific district wise impact kindly visit IMD’s sate level meteorological center websites
(https://mausam.imd.gov.in/imd_latest/contents/departmentalweb.php) and national website
(https://mausam.imd.gov.in/).
Action Suggested
• Check for traffic congestion on your route before leaving for your destination.
• Follow any traffic advisories that are issued in this regard.
• Avoid going to areas that face water logging problem often.
• Avoid staying in vulnerable structure.

Verification of IBF issued on 19 -22 Aug 2020-Category verification. Total 19 cases- Monsoon 2020-80% correct
for met-sub-division wise IBF Skill
Date Extreme heavy rain warning and IBF Rainfall realized Impacts realized
19 Aug
for Odsiha
ODISHA:- SALEPUR-30, NISCHINTAKOILI-30, NAWARANGPUR-24, MAHANGA-20,
KOTPAD-19, JEYPORE-18, KOSAGUMDA-17, KHARIAR-16, PHIRINGIA-16,
DHARMAGARH-16, AKHUAPADA-16, DABUGAN-15, KALAMPUR-15,
The fresh spell of rainfall has claimed two
lives due to wall collapse incidents on
Friday. While a woman died due to wall
collapse in Kuliana area of Mayurbhanj
district, another person was killed in a
similar incident caused by heavy rainfall in
Riamal area of Deogarh district,
20 Aug for Chhattisgarh BHAIRAMGARH-23, DARBHA-21, LOHANDIGUDA-17, BASTANAR-17, CHHINDGARH-16,
KATEKALYAN-16, BIJAPUR-12, JAGDALPUR-12,
Local flooding reported
21 and 22 West Madhya
Pradesh
21 Aug- SEHORE-AWS-32, HATPIPLAYA-27, INDORE-AWS-26, GOHARGANJ-26,
ICHHAWAR-25, ASHTA-ARG-24, BADNAGAR-24, KHATEGAON-23, BADNAWAR-23,
ARERAHILLS-21, KALAPIPAL-21, BHOPAL-AWS-ARG-21, REHTI-21, DEPALPUR-20,
SHUJALPUR-20, PIPARIYA-20, BARELI-20, GAUTAMPURA-20, BUDHNI-19,
VIDISHA-AWS-19, HOSHANGBAD-AWS-18, UDAINAGAR-18, TONKHURD-17,
SONKATCH-16, BANKHEDI-16, JAWAR-16, BAGLI-16, NUSRULGUNJ-ARG-15,
NABIBAGH-15, RAISEN-AWS-15, NARSINGARH-15, 22-Aug
BAJNA-27, GULANA-26, MOMAN BADODIYA-25, SARANGPUR-22, THANDLA-19, DHAR-
AWS-19, SARDARPUR-18, AGAR-17, GAUTAMPURA-16, RAOTI-16, BAROD-16,
21 and 22 at East RAJ 21 Aug-LOHARIA-21, BANSWARA SR-19, BHUNGRA SR-17, SABLA SR-14,
KHUSHALGARH-14
22 Aug-BHUNGRA SR-36, GHATOL-30, PIPALKHUNT SR-28, KESARPURA SR-27,
JAGPURA SR-26, SAJJANGARH SR-20, SAGWARA-20, LOHARIA-19, NITHUWA SR-19,
GARHI-18, SABLA SR-18, BANSWARA SR-18, DUG-17, BAGIDORA SR-16, DANPUR-16,
SHERGARH SR-15, KHUSHALGARH-15, ARNOD SR-15,
SE Rajasthan at Banswara District -
Highest was 36cm on 22-23 Aug -Six
stations extremely heavy -Due to flash
flood five lives lost

S.N. State No. of
Districts
Exposure data collected Impact Data/Rainfall
collected
Exposure, Impact
data and Rainfall
data shared
Impact/Risk
matrix Prepared
Separate
Impact for
each district
Remark
1 Andhra Pradesh 13 10 No 10 NA Only status sheet shared
2 Gujarat 27 1 No 1 NA Only status sheet shared
3 Haryana 22 22 22 22 For some
districts
4 Himachal Pradesh 12 12 1 1 NA Only status sheet shared
5 Jammu & Kashmir 20 20 1 14 NA Only status sheet shared
6 Karnataka 31 31 13 03 NA Only status sheet shared
7 Kerala 14 14 14 14 Common
impact for all
districts
8 Madhya Pradesh 52 22 No 22 NA Only status sheet shared
9a Maharashtra(outside
Vidarbha)
36 24 No 17 NA Only status sheet shared
9b Vidarbha
10 Punjab and Harahan 23 21 21 21 For some
districts
11 Rajasthan 33 33 0 0 NA Only status sheet shared
12 Tamilnadu 40 40 0 0 NA Only status sheet shared
13 Telangana 34 34 0 0 NA Only status sheet shared
14 Andhra Pradesh
15 Tripura 8 8 8 8 Common
impact for all
districts
31 Aug 2021: District based IBF Data status(Exposure data, Rainfall data, Impact data) and corresponding District-wise Risk Matrix preparation status (Met Sub-division Wise)

b. scheme of the cascading
effects of the heavy rain event
from say D10 to Day 0 and Day
+10 and foot prints of three
commonest: event, hazard and
impact

Issues and Challenges ➢ Heavy rainfall related Hazards has specific magnitude that unfold with a given
space‐time footprint and with the potential for adverse consequences
➢ The event footprint may vary significantly across hazards (from D-10 to D0,
D+10 issues, Also which areas to be red color impact)
➢ Location, timing, and Intensity and duration issues
➢ Color coded form as per likelihood and risk of potentially damaging event.
➢ More spatial and Temporal impact data is the need of the hour-Free flow of data
and in single system-NHP
➢ Hazard Models along with impact Models needs to be developed for
district/states
➢ Proto-types DSS needs to be installed –NCCR C-FLOWS/I-FLOWS are some but
will NCCR able to cater such needs?
➢ Outsourcing ?

Future Plan ➢ Land Slide product guidance products from GSI using GSI-UKMO NCUM heavy rainfall based landslide
model upto 5-days with GSI
➢ IBF and Risk based Warning at all these 500 number of districts and 25 cities
➢ Integrate other systems like Flash flood guidance with Stage III (By Dec. 2021)
❖ Needs FFGS to have frequent updates by integrating with real time RADAR rainfall estimates to get the
rainfall scenario
❖ FFGS to get RUC model for more frequent rainfall nowcast updates
➢ IBF data across all sectors-Crowd sourcing, Social Media
➢ Chennai and Mumbai flood warning system is in place. Performance evaluation and multi-model rainfall forecast as
input to generate scenario and consensus
➢ Bengaluru and Kolkata flood warning system awaited
➢ National/Int collaboration works NDMA, Sate Govt(SATARK, T-SMART etc), WCSSP, RIMES, NCCR-IITM, NCMRWF
➢ Workshop: Develop display system to share information between forecasters and disaster managers (GIS Platform
developed)
➢ Modification of Standard Operating Procedures: Evaluation of SOP with hindcast data
THANKS