impact assessment of who
TRANSCRIPT

Impact Assessment of WHO Prequalification and Systems Supporting Activities External Assessment Report on programmes
in the Department of Regulation of Medicines and other Health Technologies
June 2019

External Assessment Report – June 2019
i

External Assessment Report – June 2019
ii
DISCLAIMER: The contents of this document reflect a consolidation of views gathered through numerous interviews, but not the views of the World Health Organization. Confidential elements provided by interviewees for the purposes of the study and personal data have been redacted. Elements in the study may not have been verified or confirmed by the World Health Organization and no responsibility is accepted for any reliance made on the basis of this document. Similarly, recommendations made in the study do not necessarily reflect the views or intentions of the World Health Organization.
The contents of this document may be reproduced and quoted provided the source is acknowledged.

External Assessment Report – June 2019
iii
Table of Contents List of Abbreviations…………………………………………………………………………………………………………………………………. v
A Executive Summary ....................................................................................................................................... 1
A.1 Context and objectives ........................................................................................................................... 1
A.2 Summary of Methodology ..................................................................................................................... 2
A.3 Summary of Assessment ........................................................................................................................ 3
A.3.1 WHO prequalification .................................................................................................................. 3
A.3.2 Systems-supporting activities ...................................................................................................... 5
A.4 Summary of Recommendations ............................................................................................................. 6
A.4.1 Cross-cutting themes on internal operational improvement ...................................................... 6
A.4.2 Cross-cutting themes on external communication ..................................................................... 6
A.4.3 Proposed improvements on specific parts of the RHT unit ......................................................... 8
A.5 Future outlook ....................................................................................................................................... 9
B Approach and methodology .........................................................................................................................10
B.1 Sources of insight ................................................................................................................................. 10
B.1.1 Desk research and data analysis ................................................................................................ 10
B.1.2 Stakeholder interviews .............................................................................................................. 10
B.2 Assessment metrics ............................................................................................................................. 10
B.3 Limitations of the study ....................................................................................................................... 13
C WHO PREQUALIFICATION .............................................................................................................................14
C.1 Access to donor funded procurement markets (Metric 1) ................................................................... 14
C.1.1 Size of PQ-enabled market (Metric 1A) ..................................................................................... 14
C.1.2 Ratio of developing to developed country manufacturers participating (Metric 1B) ................ 15
C.2 Quality assurance system for safe and efficacious products (Metric 2) ............................................... 19
C.2.1 Donor and procurer policies on prequalification (metric 2A) .................................................... 19
C.2.2 Perception of PQ safety, quality and efficacy assurance by manufacturers, donors / procurers and NRAs (metric 2B) ................................................................................................................ 21
C.2.3 Recommendations .................................................................................................................... 25
C.3 Ensuring LMIC appropriate product development (metric 3) ............................................................... 26
C.3.1 Case studies (metric 3A) ............................................................................................................ 26
C.3.2 Perception of PQ-enabled innovation in LMIC context by manufacturers, donors / procurers and NRAs (metric 3B) ................................................................................................................ 29
C.3.3 Recommendations .................................................................................................................... 32
C.4 Economic return on investment: savings generated by PQ system (Metric 4) ..................................... 32
C.4.1 Quantitative analysis on savings generated by PQ vs investment made (Metric 4A) ................ 32
C.4.2 Case studies on price drops enabled by PQ through increased competition (metric 4B) ......... 37
C.5 Contribution to lives saved / increase in access due to savings generated by PQ (Metric 5) ............... 40

External Assessment Report – June 2019
iv
C.6 Faster access to prequalified products (Metric 6) ................................................................................ 41
C.6.1 Time to registration by country / NRA under the Collaborative Registration Procedure (Metric 6A) ............................................................................................................................................. 41
C.6.2 Perception of PQ-enabled acceleration of time to local registration by manufacturers, donors / procurers and NRAs (metric 6B).............................................................................................. 45
C.6.3 Recommendations .................................................................................................................... 48
C.7 Raising overall standards of manufacturing (metric 7) ........................................................................ 49
C.7.1 Analysis on number of developing country manufacturers with PQ and / or SRA products (metric 7A) ................................................................................................................................ 49
C.7.2 Perception of PQ impact on raising manufacturing standards by manufacturers, donors / procurers and NRAs (metric 7B) ................................................................................................ 51
D SYSTEMS-SUPPORTING ACTIVITIES ...............................................................................................................53
D.1 Technologies Standards and Norms (metric 8) .................................................................................... 53
D.1.1 Perception of norms and standards by manufacturers, donor / procurers and NRAs .............. 53
D.1.2 Recommendations .................................................................................................................... 55
D.2 Regulatory Systems Strengthening (metric 9) ...................................................................................... 55
D.2.1 Impact of activities on Regulatory Systems Strengthening (metric 9A)..................................... 55
D.2.2 Perception of utility of Global Benchmarking Tool by donor / procurers and NRAs (metric 9B) ............................................................................................................................................. 58
D.2.3 Perception of value add of RSS activities by manufacturers, donor / procurers and NRAs ....... 59
D.2.4 Recommendations .................................................................................................................... 60
D.3 Safety & Vigilance (Metric 10) ............................................................................................................. 61
D.3.1 Impact of SAV activities on an effective post-market surveillance system (metric 10A) ........... 61
D.3.2 Perception of utility of SAV activity by manufacturers, donor / procurers and NRAs (metric 10B) ........................................................................................................................................... 67
D.3.3 Recommendations .................................................................................................................... 70

External Assessment Report – June 2019
v
LIST OF ABBREVIATIONS
AEFI: Adverse Event Following Immunization API: Active Pharmaceutical Ingredient CHAI: Clinton Health Access Initiative CRP: Collaborative Registration Procedure DBS: Dry Blood Spot Specimens DCM: Developing Country Manufacturer Dx: Diagnostics EOI: Expression of Interest FPP: Finished Pharmaceutical product GBT: Global Benchmarking Tool GDUFA: Generic Drug User Fee Amendment GSMS: WHO Global Surveillance and Monitoring System HCP: Healthcare Professionals HIC: High-Income countries IHME: Institute for Health Metrics and Evaluation IVD: In Vitro Diagnostic KPI: Key Performance Indicator LMIC: Low- and Middle-Income Countries MNC: Multi National Corporation MVP: WHO cluster of access to Medicines, Vaccines and Pharmaceuticals NRA: National Regulatory Authority NTD: Neglected Tropical Disease PEPFAR: President’s Emergency Plan for AIDS Relief PMS: Post Market Surveillance PQ: Prequalification PQT: WHO Prequalification Team RH: Reproductive Heath RHT: Regulation of Medicines and other Health Technologies RSS: Regulatory Systems Strengthening Rx: Medicines SAV: Safety and Vigilance SRA: Stringent Regulatory Authority TB: Tuberculosis tFDA: Tentative Approval FDA TSN: Technologies Standards and Norms UNICEF: United Nations Children’s Fund Vx: Vaccines

External Assessment Report – June 2019
1
A Executive Summary A.1 CONTEXT AND OBJECTIVES
The Regulation of Medicines and other Health Technologies (RHT)1, operating within the WHO Cluster of Access to Medicines, Vaccines and Pharmaceuticals (MVP), focuses on four areas: (i) establishing and promulgating certain international norms and standards; (ii) strengthening the regulatory systems and promoting the concept of reliance to increase effectiveness of regulation and efficiency as requested by the World Health Assembly Resolution 67.20; (iii) helping, through the prequalification (PQ) program, to make quality assured products for public health challenges available for procurement and access, as well as to provide an assessment of product safety, efficacy, and quality that can be relied upon by member states, who chose to do so, to help inform their own regulatory decision-making and (iv) implementing and encouraging improved safety monitoring and vigilance.
Today there are over 1,700 products – medicines, vaccines, diagnostics, male circumcision devices, vector control products, immunization devices and cold chain equipment – that are prequalified and have assisted in improving public health in low- and middle-income countries2 (LMIC). Medicines PQ currently covers HIV/AIDS, Malaria, Tuberculosis (TB), Reproductive Health (RH), Hepatitis, Diarrheal diseases and selected Neglected Tropical Diseases (NTD). Vaccines PQ covers all vaccines required for routine immunization against 24 priority diseases, the immunization devices and cold chain equipment needed for an effective national vaccine program. The diagnostic program includes a wide variety of diagnostics for both endemic and epidemic diseases in LMICs as well as products for the diagnosis of Ebola and Zika virus infections. The vector control program assesses new products used to help prevent vector-borne diseases by targeting the various insect vectors. These products include bed nets, sprays, and larvicides, for example. Furthermore, all programs provide risk-based assessment of products to be potentially used in public health emergencies of international concern.
Systems-supporting activities have further provided catalytic support to strengthen country health and regulatory systems through work conducted under the umbrella of Technologies Standards and Norms (TSN), Regulatory Systems Strengthening (RSS), and Safety Monitoring and Vigilance (SAV).
Since its inception, WHO prequalification and systems-supporting activities have mostly been funded by donors. In 2017, WHO put in place a model aimed at creating a more sustainable source of financing through a new fees-based model for the manufacturers of prequalified medicines and vector control products. This model was recently broadened to diagnostics (August 2018).
One of the major donors, namely Unitaid, included a request in the most recent grant to conduct an impact assessment of WHO prequalification. The assessment conducted in the context of this request includes both qualitative and quantitative analysis and highlights the major areas where RHT’s prequalification and systems-supporting activities have had an impact (direct and indirect) on the global health eco-system across medicines, vaccines and diagnostics. The vector control PQ program was only established in 2017 and is therefore too new to be included in this current impact assessment.
As part of this assessment, more than 40 external stakeholders were interviewed – manufacturers, NRAs and donors/procurers – each of whom had experience with WHO prequalification. No patients were directly interviewed.
The main objectives of the assessment are as follows:
■ Create a fact-based understanding of the value that RHT’s PQ and systems-supporting activities have
1 Impact assessment was conducted under the structure of RHT as of January 2018 2 In this report, LMIC encompass Low and Lower Middle-Income countries as defined by the World Bank (excluding Higher
Middle-Income countries – like China or Russia)

External Assessment Report – June 2019
2
created in the global health ecosystem with a 360-degree view across all stakeholders
■ Generate both qualitative and quantitative assessments of the value created by RHT’s PQ and systems-supporting activities
■ Create insights that would feed directly into the RHT strategic plan to create a greater impact at the country level, driving towards the triple billion targets laid out in the GPW13
A.2 SUMMARY OF METHODOLOGY
In order to create a fact-based understanding of the value that RHT’s PQ and systems-supporting activities have created across all stakeholders two main sources of insight were balanced. First, desk research and quantitative data analysis provided an objective and fact-based overview of the current ecosystem, case examples and economic benefits. Second, a total of 41 detailed, deep, structured interviews (each 60-90 minute long) provided a more nuanced perspective directly linked to the needs and interests of the various stakeholder groups. The stakeholder interviews covered 15 manufacturers, 10 NRAs/SRAs and 16 donors/procurers and provided differentiated insights on medicines (Rx), vaccines (Vx) and diagnostics (Dx).
Related to prequalification, seven metrics were assessed with detailed sub-indicators for each:
1. Access to donor-funded procurement markets (evolution of market size and number of developing market manufacturers with PQ products)
2. Quality assurance system for safe and efficacious products (procurer policies and stakeholder perception on PQ quality assurance)
3. Ensuring products are developed for an LMIC context (specific case studies on PQ contribution to LMIC-tailored innovation and stakeholder perception on PQ assistance)
4. Economic return on investment (RoI), calculated as savings generated by the WHO prequalification compared to running costs
5. Contribution to lives saved, calculated as impact on number of additional patients with access to quality products in LMICs
6. Accelerated access to prequalified products in countries (ratio of NRAs granting approvals within 90 days and perception of stakeholders on value add of the WHO Collaborative Registration Procedure (CRP))
7. Impact on raising overall standards of manufacturing (ratio of developing country manufacturers (DCMs) with PQ vs SRA-approved products and stakeholder perception of improvements of manufacturing standards)
With regard to the systems-supporting activities, three metrics including sub-indicators were assessed:
1. Impact of Technologies Standards and Norms (TSN) on PQ effectiveness (stakeholder assessment of utility)
2. Impact of Regulatory Systems Strengthening (RSS) activities on NRA and regional regulatory initiative-strengthening (quantitative analysis and stakeholder assessment)
3. Impact of Safety and Vigilance (SAV) activities on adverse event reporting (quantitative analysis and stakeholder assessment of utility of SAV capability-building measures)
During the collection of the information for the assessment, the authors of this report observed the challenges staff members faced in pulling together the available data on the impact of WHO prequalification from different sources across the different teams. Closer collaboration between the various teams in RHT, as well as increased focus and resources to allow more systematic data collection and measurement of impact at country level would be beneficial (e.g., assisting NRAs on how guidelines should be used to review and evaluate sample regulatory dossiers).

External Assessment Report – June 2019
3
A.3 SUMMARY OF ASSESSMENT
A.3.1 WHO prequalification
Based on the combination of quantitative analysis and the insights from the stakeholder interviews across the different metrics, the WHO prequalification has proven to be very impactful in the medicines and vaccines space, with diagnostics rapidly gaining relevance since its relatively recent launch. Across all product streams, some areas of improvement have been identified that could enhance the impact of WHO PQ. Overall the six key findings of the PQ assessment are:
■ The WHO prequalification has enabled a large donor-funded market size of approximately USD 3.5 billion of quality, safe and efficacious products across the three streams – the market sizing considers the procurement of all prequalified medicines, vaccines and diagnostics via donor-funded procurement or large procurement agencies, where prequalification is one of the criteria for procurement. This outcome is achieved in close collaboration with other stakeholders, such as SRAs, procurers and donors, who have made important contributions to increased access across various product categories. In Malaria and 1st line TB, PQ alone has enabled ~90% of market access in terms of total value; on the other hand, 51% of HIV-ARVs in value are both WHO-prequalified and SRA-approved while 21% solely rely on PQ.3 There are likely to be additional markets that benefit from prequalified products including pre-qualified medicines, vaccines, diagnostics self-procured by country governments as well as private-sector markets in some of these countries.
■ The products within the disease in scope have expanded significantly, with ever-expanding participation among DCMs
‒ In medicines, the total number of manufacturers producing at least one PQ product has significantly increased in the last 15 years, reaching 72 in 2018 (from 9 in 2003) while DCMs now represent more than 40% of all manufacturers with PQ listed medicines.
‒ Vaccines have seen a similar trend, increasing to 40 manufacturers in 2018 (from 15 in 2003) with those from LMIC representing about half. The number of prequalified diagnostic products available on the market has almost tripled from 25 products at launch in 2013 to 70 products today. The proportion of manufacturers coming from LMIC is significantly lower than what is observed for medicines and vaccines, with less than 20% of diagnostics produced by DCMs.
■ WHO PQ is a trusted and reputed symbol for safety, quality and efficacy across stakeholders; with opportunities for further streamlining:
‒ WHO prequalification has helped to significantly broaden access to safe, efficacious and quality medicines, vaccines and diagnostics in LMICs. It has enabled:
(a) Donors to trust the prequalified products that are being procured from their funds,
(b) Countries to rely on the products coming into their jurisdiction and
(c) DCNs to compete with Multi National Corporation (MNC) quality products on a “level playing field”
■ High impact in guiding innovation and early-stage development – though scale could significantly increase through improved communication and awareness
‒ Several case examples in medicines, vaccines and diagnostics showcase the impact PQ has had in terms of enabling product innovation that is relevant for LMICs. For example, PQ played a key role in bringing paediatric TB products to market in sub-Saharan Africa and in promulgating the deployment and use of HIV-1 Viral Load assays adapted for use with dried blood spot specimens (e.g., HIV self-testing diagnostic).
3 WHO Prequalification 2016 Annual Report to Unitaid

External Assessment Report – June 2019
4
‒ While manufacturers who have engaged the WHO Prequalification Team (PQT) at early stage in the product development process are satisfied with the support, many are not aware of this dimension of PQT’s work and would appreciate WHO support to enable tailoring of products to LMIC needs (e.g., assistance on clinical development plans, etc.).
■ Public health impact: millions of patients have been reached thanks to WHO prequalification
‒ Overall, it is estimated that about 400 million additional patients may have obtained access across HIV, Malaria, Tuberculosis (TB), Reproductive Health (RH), vaccines and diagnostics on an annual basis thanks to resources saved by WHO prequalification the PQ program – and assuming funding is not diverted to other causes.
‒ There may also be an opportunity to further multiply the return through greater leveraging of existing regional regulatory networks which could amplify the work of PQ and take on additional responsibility (under the guidance of PQ)
■ A sound investment: every USD 1 invested in running the WHO prequalification contributes to savings of approximately USD 30-40 while acknowledging that WHO Prequalification operates in the broader ecosystem of Global Health stakeholders who contribute towards these savings as well
‒ The “economic return” of the WHO prequalification (operating in a broader landscape of Global Health stakeholders) was analyz ed as the savings generated per dollar that is invested in PQ, given the limited resources available to donors. The savings generated are a result of an increase in the competition that PQ has enabled by providing an avenue for LMIC manufacturers to participate in a “level field quality product” market and are analyzed by calculating the drops in price following the market entry of prequalified products from DCMs.
‒ The analysis shows that for every USD 1 that is currently invested in PQ, the return in terms of savings (enabled by PQ but also by contributions of other Global health stakeholders) is approximately USD 30-40. Most of the savings is currently generated in the medicines and vaccines space, while savings generated for diagnostics are comparably low given, inter alia, the recent start of the programme and the already relative low cost of these products (e.g., CHF 0.8 for HIV and CHF 0.19 for malaria).
■ Significant progress has been achieved in a short time with downstream NRA national registration streamlining via the Collaborative Registration Procedure (CRP) for medicines, although full compliance is still some way off; stakeholders have made a strong push to expand effective CRP to vaccines, diagnostics and more countries
‒ There is evidence that the CRP has significantly improved the efficiency of national registration procedures for medicines (e.g., alleviated redundancies, harmonized registration requirements, significantly accelerated approval timelines); this is underpinned by the desire of stakeholders to see its application expanded to further countries and product streams (diagnostics and vaccines – both of which are now underway). Since its launch in 2013, the medicines CRP has been expanded to 34 countries, most of them in sub-Saharan Africa, and the number of CRP registrations for FPPs has increased from 15 in 2013 to 123 in 2017. Overall there has been a tremendous improvement in the median registration times: prior analysis showed that timelines for downstream NRA approval after PQ could be as long as two years whereas for the products that have gone through CRP, the average in 2017 has been 93 days.
‒ However, there is room to improve as only about half of the registrations in 2017 met the 90-day time limit committed to under the CRP. At the same time, there is a striking imbalance between countries when it comes to bringing the benefits of the CRP to fruition in terms of accelerated time to approval (some consistently adhere to the 90-day limit, others rarely do).
‒ There is also a clear need to adapt the CRP to the requirements of vaccines in order to enable broader usage by vaccine manufacturers. This should also be seen in the context that the improvement of the PQ process for vaccines was one of the foremost commitments made when the new fee model

External Assessment Report – June 2019
5
was put in place.
■ Positive spill-over effect on manufacturing standards: PQ has had a positive spill over effect on the manufacturing standards of DCMs as the production lines used for non-prequalified products benefit from the improvements made to adhere to PQ standards. Procurers mentioned that as part of their screening of manufacturers, they often check if the manufacturer has PQ products in its portfolio, which is generally seen as a positive indicator for the overall quality standards across the manufacturer’s portfolio.
A.3.2 Systems-supporting activities
Member States rely on WHO for expertise and guidance in regulation, safety and quality assurance of medicines through development, establishment and promotion of international norms, physical standards, guidelines and nomenclature. The TSN team has been addressing this demand through its Expert Committees as well as through guideline development, workshops and training courses and the development of physical standards for assay validation and other regulatory activities through their series of coordinating centres who actually manufacture the physical standards. These are appreciated by stakeholders across the product streams. While interviews across stakeholders have shown that the quality of WHO standards and guidelines is widely appreciated, additional thought needs to be given to better enabling country implementation. This should include clear communication of guidelines (including the changes made and tracking by WHO of metrics to demonstrate implementation).
The Regulatory System Strengthening in LMIC has been assisted by the RSS, TSN, PQ Rx/Vx/Dx/Inspection and SAV through the development and enhancement of regulatory systems in LMIC and capability-building measures and trainings offered to NRA staff, including inspectors and assessors (e.g., rotational programs for both assessors and regulators, global and regional trainings, and continuous oversight). The RSS team trained more than 8000 regulators from all regions between 1997 and 2017 (the focal points were trained relatively evenly across the regions, the lowest being the Americas Region with 12% of total people trained and the highest being the Western Pacific Region with 22% of total people trained4), and a positive correlation can be observed between the number of trainings offered and the global number of functional NRAs (the number of functional NRA has increased by almost 70%, from 36 in 1997 to 61 in 2017 in the area of vaccine regulatory oversight). This increase in NRA functionality had a positive impact on the PQ vaccine work since most of NRAs are based in vaccine producing countries where a functional NRA is a criteria for a manufacturer to apply for PQ.
Stakeholders are complimentary about the quality of the training activities, however there is a desire for a support that is more tailored to the specific needs of the different regions and countries. There is a growing appetite among NRAs to use the Global Benchmarking Tool (GBT), while the level of understanding of its functionality and assessment criteria is still relatively low given its recent introduction. In addition, some concerns have been raised about the need for user governance and protected copyright regarding the GBT (to help reduce incidences of download, editing, mis-attribution).
WHO is seen as having a unique role in assuring post-market surveillance of prequalified medicines, vaccines and diagnostics as well as substandard and falsified products. WHO has conducted training and other capability building measures and strengthened its basic reporting system on substandard and falsified medical products, Individual Case Safety Reports (ICSR) for medicines, Adverse Events following Immunization (AEFI) for vaccines, and complaints including adverse events reported for diagnostics. As a result, data analysis shows that since the inception of these activities, there has been an increase in the number of events reported in the regions where training was conducted, which can be largely attributed to an increase in awareness of the importance of Post Market Surveillance.
However, there is a strong desire that WHO work towards establishing a more robust and tailored post-market
4 Excluding trainings provided by the Regions

External Assessment Report – June 2019
6
surveillance system with active and systematic reporting at a country level.
A.4 SUMMARY OF RECOMMENDATIONS
Based on this impact assessment, there are three major categories of proposed enhancements:
■ Improving external communication across the board
■ Improving operational efficiency for WHO and RHT activities
■ Specific improvements to various parts of the RHT unit
This section highlights the most prominent measures identified across the assessed metrics. A more detailed list of enhancements is presented at the end of relevant sections and labelled as “recommendations”. These recommendations are based on both hard-facts/data as well as perceptions from stakeholders.
A.4.1 Cross-cutting themes on internal operational improvement
On the first cross-cutting theme of enhancement, targeted measures to improve internal collaboration and cross-functional knowledge-sharing could tackle currently existing operational inefficiencies to ensure the increasing number of PQ products and potential scope expansions can be better managed within the resource-constrained setting of PQ. The following key recommendations are highlighted:
■ Step up cross-functional collaboration and communication across medicines, vaccines and diagnostics teams, especially (a) within the PQT given the potential process synergies between the streams (e.g., knowledge and resources-sharing of workshop organizations), (b) within SAV teams given the overlap in “end customers” (NRAs and health centres generating reports, and some manufacturers), and (c) within RSS given potential synergies between the various team engaged with this agenda (RSS team, PQ Rx/Vx/Dx teams, inspections team). This entails in particular:
– developing5 cross-functional / cross-stream teams on PQ, SAV and RSS that meet at least on a monthly to quarterly basis to exchange information and coordinate cross-stream activities
– regular exchange of information and knowledge, as well as coordination on PQ procedures (e.g., standardized PQ application cross streams), post-market reporting frequency (e.g., complaints) and training activities through electronic means
■ Increase cooperation with entities outside of RHT, including but not limited to
– Communicable Diseases cluster, in particular with the Global TB Programme, Control of Neglected Tropical Diseases (NTD) and the Special Programme for Research and Training in Tropical Diseases (TDR) on pharmacovigilance
– WHO Emergencies Programme on the assembly of disease commodity packages for emergencies
– WHO department of Corporate Procurement Policy and Coordination (CPC) to better ensure that the WHO QA policy can be aligned behind WHO prequalification
■ Strengthen interactive best-practice sharing platform (e.g., intranet forum, multi-party messaging platform, etc.) across teams within PQ, SAV and RSS.
■ Finalize development of the common IT system that will enable common work management processes and common data collection for evaluation of performance against public and internal performance metrics (e.g., automated updates of PQ-list, query-handling platform with queuing and alerts)
A.4.2 Cross-cutting themes on external communication
On the second cross-cutting theme of enhancement, several barriers in effective external communication appear to have been limiting the impact the PQ team and systems-supporting activities. The particular
5 Biweekly meetings already in place for Diagnostics between Dx Assessment, Inspection and SAV

External Assessment Report – June 2019
7
“hotspots” where transparency and external communication could be improved are: PQ application process, LMIC-relevant innovation support, CRP, norms and standards, and the Global Benchmarking Tool (GBT). The following recommendations are highlighted:
■ PQ application process:
– Communicate a clear path from EoI/prioritized list to PQ post-approval stage to applicants, by developing a more user-friendly, comprehensive guide (“instruction manual”) that includes:
□ Easily accessible, simplified and user-friendly step-by-step description of application process with more details on documentation required for submission at each step, set out in easily understandable language to enable first-time applicants from any country to independently build dossier for assessment
□ Clear timelines not just for overall process but for each key step in the process (set for either WHO or manufacturer depending on which party needs to act)
□ Steps to follow to maintain a product prequalified and to add post-approval changes
□ Fee payment schedule (when to pay the fees, for what period of time)
□ Annual report which discloses the usage of fees as well as performance indicators across all the streams vis-à-vis targeted performance.
■ Speed up response time for day-to-day requests from manufacturers (e.g., relating to queries on the receipt or acceptance status of new dossiers or product variation, to specific follow up questions on dossier in process, or to clarification on process requirements). Various tools need to be investigating, including well curated FAQs, template e-mails, customer-relationship-management type workflow tools, internal resourcing.
■ Continue efforts to expand existing PQ-product list to an easily accessible database with a more end-to-end lifecycle view. The database should be offered across medicines, vaccines and diagnostics. It should include:
□ Full prequalification status: pending prequalification, prequalified, rejected, delisted
□ Status on post-approval changes
□ Countries where the product is marketed
□ Approval status in countries
■ LMIC-relevant innovation: increase awareness on WHO technical assistance, in particular with DCMs and NRAs by:
– Highlighting past success stories (e.g., case examples) on the WHO website in an easily accessible and visual way
– Showcasing the benefits of the technical assistance offering at regional innovation roundtables
■ CRP: expand scope of medicines CRP to further countries by strengthening communication on the benefits of CRP to NRAs in countries where CRP is not in place (e.g., Latin America, Eastern Europe), and distribute simple and clear user-guide to improve transparency of process (e.g., have a more streamlined process for a country to sign up for CRP for all three product streams rather than separate agreements based on the stream)
■ Norms and standards: improve accessibility, user-friendliness and transparency of norms and standards on WHO website by:
– Only displaying active guidelines that are in force, while transferring expired guidelines into a publicly accessible online archive for reference
– Highlighting updated sections of a guideline, so that manufacturers who already complied with the previous guideline can focus their attention on the updates

External Assessment Report – June 2019
8
– Inclusion of metrics (and tracking) to monitor implementation of standards at country level and to track the development of new guidelines through the development process so the larger community knows the current status of a guideline under development
■ Global Benchmarking Tool6: proactively communicate on functionality and usage of GBT by:
– Sharing its benefits and functionality with NRAs at international and regional NRA roundtables and forums (e.g., such as the International Conference of Drug Regulatory Authorities)
■ Increasing transparency around the tool set up and maturity level scores design (e.g., ranking criteria and weighting) through a detailed user guide / instruction manual that is easily accessible on the WHO website
■ External communication: increase awareness of WHO support provided during the early development phase of a product, in particular with DCMs and NRAs by:
– Advertising past success stories (e.g., case examples) on the WHO website in an easily accessible and visual way
– Showcasing the benefits of the technical assistance offering at the regional innovation roundtables (see above)
A.4.3 Proposed improvements on specific parts of the RHT unit
Further key recommendations apart from the two categories mentioned above are:
■ Launch CRP best-practice sharing platform to accelerate time to approval under CRP in underperforming NRAs (e.g., by applying lessons learned from best-in-class NRAs through a collaborative platform on WHO website, in-person trainings, nomination of “CRP ambassadors”)
■ Clarify that the WHO-SRA collaborative programme is only for products not otherwise eligible to be assessed through WHO prequalification (especially the abridged PQ).
■ Tailor vaccines CRP by adapting process to specific requirements related to vaccines (e.g., easy registration of post approval changes)
■ Consider extension of CRP scope to include diagnostics
■ Institute a routine tracking process of the update and use of guidance and standards created by TSN to increase implementation rate of norms, standards and guidelines by NRAs and manufacturers.
■ Systematically conduct introductory workshops and/or Q&A annexes for NRAs and manufacturers together with any newly published guideline, increasing frequency and regularity of trainings (especially for DCMs) and create systematically monitoring Key Performance Indicators (KPIs) related to the implementation rate of the norms and standards
■ Review composition of current Expert Committees and make public the extensive efforts to ensure a suitable balance in terms of skill sets, experience and gender
■ Consider modifying current operating model for committees to facilitate more real-time interventions, including the use of video meetings to augment the annual in-person meeting
■ Establish clear user governance rules for GBT and obtain consent from stakeholders relying on the tool or its methodology, equip with intellectual property protection (e.g., protected copyrights) and enforce proprietary usage by following up with other actors using or modifying GBT without WHO consent
■ Establish clear timeline in which countries should implement a variation to a PQ listed product that PQ has approved
6 Limited number of reference point as limited number of NRAs have, at this stage, had experience with the GBT

External Assessment Report – June 2019
9
A.5 FUTURE OUTLOOK
Going forward, three key trends will continue to impact the environment in which RHT operates and will require a flexible approach from RHT in order to sustain its impact.
First, there is rise in prevalence of non-communicable diseases in LMIC, such as cardiovascular diseases, cancer, chronic respiratory diseases and diabetes. Coupled with this, there is an increasing expectation that patients in LMIC obtain access to quality medicines and diagnostics to prevent and treat such diseases. In the longer run, WHO Prequalification should think about ways in which it can stay relevant and become a key enabler in this field, for example by including new classes of products on the WHO Prequalification list, in particular biologics, biosimilars and chemotherapy drugs to treat basic cancers (e.g., leukaemia).
Second, there is a growing expectation from manufacturers, HCPs and patients that hurdles to speedy market access be lowered and more homogeneity be created with regard to registration and approval procedures across countries. WHO Prequalification is uniquely positioned to help deliver on this expectation – as NRAs increase gradually in capacity and capability WHO’s expected role in providing a strong global framework and trainings to improve and harmonize approval processes across LMIC will be key (i.e., further increased emphasis compared to today). It will be key to strengthen and ensure WHO provides state-of-the art programs (such as the CRP) and platforms that enable data sharing between WHO and NRAs to accelerate market access.
Third, substandard and falsified medicines, vaccines and diagnostics originating from LMIC are becoming an increasing concern for health systems across the globe, not only in LMIC but also in the developed world.7 Recent scandals on vaccines, anticoagulants and cancer medications have brought this issue to the forefront of public discourse. Although RHT does not have the sole and primary responsibility for pharmacovigilance, there is an expectation among stakeholders that WHO will take a leadership role in the fight against substandard and falsified products. In the long run, RHT to should lead efforts in collaboration with member states to build a more robust, active global vigilance system with systematic reporting.
□ □ □
7 WHO, A study on the public health and socioeconomic impact of substandard and falsified medical products (2017)

External Assessment Report – June 2019
10
B Approach and methodology B.1 SOURCES OF INSIGHT
In order to create a fact-based understanding the value that RHT’s PQ and systems-supporting activities have created across all stakeholders two main sources of insight were balanced. First, desk research and data analysis provided an objective and fact-based overview of the current ecosystem, case examples and economic benefits. Second, interviews provided a more nuanced perspective directly linked to the needs and interests of the various stakeholder groups.
B.1.1 Desk research and data analysis
A thorough and systematic desk research was conducted to gather, inter alia, perspective on donor and procurer policies, regulatory requirements, case studies showcasing impact of RHT work on LMIC health ecosystems, and user friendliness of WHO public information platforms. Sources of information included WHO and external publications and reports, academic literature, company websites, and expert interviews. Data analysis was conducted to assess, in particular:
■ Evolution of market size for PQ products in medicines, vaccines and diagnostics
■ Impact on number of Developing Country Manufacturers (DCMs) and Multi National Corporation (MNCs) participating in the PQ enabled market
■ Savings generated by the WHO prequalification vs costs generated, including impact on number of additional patients with access to quality products in LMIC
■ Speed of NRA registration procedures under the Collaborative Registration Procedure (CRP)
■ Evolution of reporting on adverse events and substandard and falsified products
■ Evolution of score on functionality of country regulatory systems
B.1.2 Stakeholder interviews
Structured 60-minute interviews were conducted across a broad range of stakeholders to gather external perspectives on various aspects of PQ and systems-supporting activities and to identify strengths and improvement areas. Both qualitative and quantitative questions were covered to ensure room for discussion and sharing of opinion while allowing for fact-based comparison between stakeholders.
60 individuals were contacted for interviews, with 41 interviews conducted, across a wide range of stakeholder groups8: manufacturers, National Regulatory Authorities (NRA), donors, procurers and other implementation partners. The stakeholders were balanced across regions and sizes and covered Medicines, Vaccines and Diagnostics.
■ 15 manufacturers across medicines (6), vaccines (5) and diagnostics (4)
■ 10 NRAs/SRAs
■ 16 donors/procurers (including separate interviews with different units of the same organization)
Perceptions on specific topics (e.g., Collaborative Registration Procedure, Global Benchmarking Tool) have only been considered when stakeholder interviewed has had a direct experience related to that topic.
B.2 ASSESSMENT METRICS
The WHO PQ team’s (PQT) mission is to
“work in close cooperation with national regulatory agencies and partner organizations to make quality priority
8 No patient has been interviewed while conducting this report

External Assessment Report – June 2019
11
medicines available for those who urgently need them. This is achieved through assessment and inspection activities, building national capacity for manufacture, regulation and monitoring of medicines, and working with regulators to register those medicines quickly.”
The assessment presented in this report covers a range of metrics against which impact is measured. The metrics are aligned with the core dimensions of WHO PQ team’s mission. For the PQT, the assessment covers 7 metrics and 13 sub-indicators (see exhibits).
EXHIBIT 1: OVERVIEW OF ASSESSMENT METRICS FOR PREQUALIFICATION STREAMS (1/2)

External Assessment Report – June 2019
12
EXHIBIT 2: OVERVIEW OF ASSESSMENT METRICS FOR PREQUALIFICATION STREAMS (2/2)
Similarly, the systems-supporting activities are assessed against a range of metrics which reflect the mission of the WHO teams on Technologies Standards and Norms (TSN), Regulatory Systems Strengthening (RSS) and Safety and Vigilance (SAV).
The TSN team works to fulfil WHO’s goal to “to develop, establish and promote international standards with respect to biological and pharmaceutical products”. It does so through guideline development, workshops and training courses, its Expert Committees, and other activities.
The WHO RSS team’s mission is:
“Built on three main pillars – access, innovation and regulation – EMP promotes policies and technical capacities in low-resourced health systems, develops international standards for the manufacturing and regulation of health products and provides guidance for health systems everywhere to deliver them safely and cost-effectively.”
The SAV team’s goal is to:
“Provide evidence-based support to countries to ensure safe use of health technologies (devices, medicines, vaccines, procedures and systems) in patients”, which it does by “coordinating global networks for information sharing, such as data bases and monitoring and alert systems, and by supporting countries to develop national capacities for the post-mark surveillance of health products.”
This defined goal is articulated around three major axes:
- Protect the public from untoward effects of health products
- Protect the program and therefore public health from poor science, rumours and other allegations
- Strengthen country capacity

External Assessment Report – June 2019
13
Three metrics and 6 sub-indicators address the system-supporting activities (see exhibit).
EXHIBIT 3: OVERVIEW OF ASSESSMENT METRICS FOR SYSTEMS SUPPORTING ACTIVITIES
B.3 LIMITATIONS OF THE STUDY
Three key limitations of the work are identified. First, given the short time available the number of interviews possible was limited. In agreeing the methodology with the WHO team and funders a target of 30 interviews was set, across the three major stakeholders: NRAs, manufacturers, Donors/Procurers. To minimize the impact of this limitation, members of all the relevant WHO teams were consulted extensively to identify and agree an appropriate mix of interviewees. In the end, the target number of interviews was exceeded (a total of 41 interviews were conducted). Of course, this is still by no means exhaustive and additional interviews could be conducted to further enrich this report provided longer timeframe and resources (e.g., include more manufacturers) and encompass additional stakeholders (e.g., include patient interviews, regional regulatory bodies). It should however be mentioned, that the key themes discussed in the report emerged consistently from the interviews conducted, and every effort has been made to fact check statements.
Secondly, several data challenges were faced in the availability and quality of data. This report brings together multiple data sources and includes extensive work to collate and analyze new data sources from a wide variety of places. That said, in some places fully current data was not available, in these cases the most recent data available was used (for example, in the RoI analysis 2016 data was used). In addition, certain data were not available for reasons of confidentiality, or are simply not collected at present, limiting the indicators which could be assessed.
Thirdly, the agreed scope of this work was primarily WHO Prequalification, with activities of other teams included where they support PQ. However, this is not an exhaustive review of the impact of all activities, of all the other teams within RHT.

External Assessment Report – June 2019
14
C WHO PREQUALIFICATION C.1 ACCESS TO DONOR FUNDED PROCUREMENT MARKETS (METRIC 1)
C.1.1 Size of PQ-enabled market (Metric 1A)
Assessing the full size of the PQ enabled market across medicines, vaccines and diagnostics is key to grasp the magnitude of WHO prequalification, as well as its evolution over time.
An extensive analysis of the PQ enabled market was conducted in 2016, using 2014 reported data from multiple donor reports across all diseases areas (e.g., HIV, TB, Malaria). The size of the PQ enabled market was assessed only for procurement funded by donors, excluding government procurements and private markets. In order to estimate the donor-funded, PQ-eligible market size, a triangulation of different data sources was conducted. The analysis included a triangulation of reported data with direct donor conversations and a detailed comparison of procured products with the list of prequalified products in order to identify the PQ-enabled market size. For the purpose of this report and given the short nature of this engagement, the base analysis was not redone completely, but was extrapolated to see how the market evolved since 2014 based on the latest data available. In order to assess the 2014-2016 evolution, different methodologies were applied for medicines, vaccines and diagnostics depending on data availability (see details below). In addition to that, key qualitative external events that have had an impact in shaping the overall trend of the market where considered (e.g., Cholera vaccine becomes part of vaccination schedule in Africa in 2016, diagnostic products in new areas obtain PQ status: HBV in 2014, HCV in 2015, HPV in 2017).
The methodology used to estimate the 2014-2016 evolution was as follows:
■ Medicines: growth rate calculated separately for HIV, Malaria, TB and RH based on the extrapolated procurement value of the 1-2 largest donors in each disease area9
■ Vaccines: growth rate calculated based on UNICEF 2014-2016 procurement increase, PAHO expenditures assumed flat over that period
■ Diagnostics: HIV based on triangulated data from Global Fund, USAID, UNICEF, WHO; Malaria size estimated based on HIV vs Malaria sales ratio in 2014
Based on this triangulation, the 2016 estimated total size of the PQ-enabled donor-funded market is about US$3.5 billion. Vaccines represent the largest PQ enabled market stream, with more than two-thirds of this (US$2.1 billion), followed by medicines (US$1 billion) and diagnostics (US$0.3 billion).
9 HIV – GF (~45% of HIV/ARV donor-funded market); Malaria – GF and Unitaid (~55%); TB – GF (~90%); RH – USAID and
UNPFA (~90%)

External Assessment Report – June 2019
15
EXHIBIT 4: TOTAL DONOR-FUNDED PQ ENABLED MARKET, ACROSS STREAMS
EXHIBIT 5: EVOLUTION OF DONOR-FUNDED PQ ENABLED SPEND 2014-2016
C.1.2 Ratio of developing to developed country manufacturers participating (Metric 1B)
a) Medicines
(i) Manufacturers of PQ products
The WHO prequalification for medicines / Finished Pharmaceuticals Products (FFPs) was launched in 2002, when 6 products received WHO prequalification status. Back then, less than 17% of these products were produced by DCMs. This share has steadily increased overtime, and DCMs now represent more than 40% of all manufacturers.

External Assessment Report – June 2019
16
The total number of manufacturers producing at least one PQ product has also significantly increased in the last 15 years, reaching 72 in 2018 as manufacturers from all origins (see exhibit).
In the same period, the disease areas covered has also be broadened significantly: in 2002, only HIV products were prequalified, after which TB products were added in 2003, Malaria was added in 2004, Reproductive Health and Influenza in 2009, Diarrhea in 2012, Neglected Tropical Diseases in 2013 and most recently Hepatitis in 2016.
The WHO prequalification was broadened to Active Pharmaceutical Ingredient (API) in 2013, when 18 manufacturers had one or more of their products prequalified. The number of manufacturers benefiting from WHO prequalification has more than doubled in 5 years, reaching 42 in 2018. When WHO prequalification for APIs was launched in 2013, a vast majority of the manufacturers (85%) came from LMIC and this share still holds true in 2018.
EXHIBIT 6: EVOLUTION OF FPP/ API PQ MANUFACTURERS FROM 2002 TO 201810
There is a growing appetite for PQ products, both for API and finished products as well as a clear tendency for more manufacturers to be attracted by WHO prequalification. However, no significant shift in the dynamic of the country of origin of the manufacturer has been observed and Developing Country Manufacturers (DCMs) and Multi-National Corporations (MNCs) from high-income countries (HIC) seem to have developed a comparable appetite from PQ over time (stable shares overtime for both finished goods and API). The steady increase of manufacturers making use of PQ for FPPs is a testimony to the stability of the ecosystem. The same is true for API. The standalone assessment of APIs is a unique feature of the WHO prequalification, which is not offered by other organizations or authorities. Based on manufacturer interviews, the standalone assessment of APIs is seen as a key value proposition of PQ as it allows for flexible API sourcing and ensures minimal supply disruption.
(ii) PQ products manufactured
When WHO prequalification was launched, manufacturers prequalified on average 3 products. This number has almost doubled within the last 15 years, with now 5.7 products attributed to one manufacturer: the increase in number of manufacturers (see above) combined with an increase in PQ products per manufacturer led to a significant increase in total PQ products available: from 22 in 2002 to 417 in 2018 (x15).
With regard to APIs, the average number of APIs prequalified per manufacturer has remained stable overtime (about 3 PQ APIs). The growing number of manufacturers enrolled in the PQ process drove the overall number of API prequalified to more than double in just 5 years, from 51 in 2013 to 119 in 2018.
10 WHO list of prequalified FPPs; WHO list of prequalified APIs; World Bank country classification (status 2018)
FPPs APIs
002
6 9
03 08
21
13 2018
40
72
2018
42
013
18

External Assessment Report – June 2019
17
EXHIBIT 7: EVOLUTION OF FPP/API PRODUCTS FROM 2003 TO 201811
b) Vaccines
When the vaccine WHO prequalification was launched in 198712, 4 manufacturers – all from MNCs - had one or more of their vaccines prequalified. Since then, the dynamic has changed and DCMs represent about half of them.
In the same time period, the scope of vaccines covered has also been extended: in 1987, only two diseases area were covered by WHO prequalification (BCG and Yellow Fever); since then the scope of diseases covered has significantly increased and is now covering about 20 diseases areas (43 total denomination including combinations).
There is a growing appetite for prequalification and in addition to the growing number of manufacturers prequalifying at least one vaccine, there is a growing number of vaccines that are prequalified per manufacturer. The number of vaccines that are prequalified per manufacturer is negatively correlated with income level of the country where the manufacturer is from. The higher the income, the lower the number of vaccines prequalified per manufacturer. In 2018, on average, a DCMs prequalified 7.5 product when a MNC manufacturer prequalified only 4.5.
This difference in number of average vaccines prequalified can partially be explained by the fact that multiple presentation forms of the product (e.g., vial, ampoule) and a different number of doses per package are available for the same vaccine.
EXHIBIT 8: EVOLUTION OF PQ VACCINE MANUFACTURERS FROM 1987 TO 201813
11 WHO list of prequalified FPPs; WHO list of prequalified APIs; World Bank country classification (status 2018) 12 Not formally named PQ at that time; also see: Twenty-five years of the WHO vaccines prequalification programme (1987-
2012): Lessons learned and future prospective. Vaccine 2015 Jan 1; 33(1): 52-61 13 WHO prequalified vaccines list; World Bank country classification (status 2018)
PIs
08 201813
232
002
417
03
2822 72
119
2018013
51
82% 76%
987 98
9
08
64
0393 13
18
29
15
0%

External Assessment Report – June 2019
18
EXHIBIT 9: EVOLUTION OF PQ VACCINES FROM 1987 TO 201814
c) Diagnostics
The first diagnostics products that benefited from the PQ label date back to 201015. At that time, 2 products, all from MNCs, were prequalified.
Overtime, some DCMs, coming from China, Russia and India, have registered PQ diagnostic products but they still represent less than 20% of all the manufacturers.
As observed for both medicines and vaccines, there is a growing interest for prequalification for diagnostics and the number of manufacturers who prequalify at least one of their product more than doubled in just 5 years, from 12 in 2013 to 28 in 2018. As a result, the number of prequalified diagnostic products available on the market has almost tripled (from 25 products in 2013 to 70 products today), as well as the therapeutic areas covered. As of 2018, the following diseases benefit from PQ products: HIV, HBV, HCV, HPV and Malaria.
EXHIBIT 10: EVOLUTION OF PQ DIAGNOSTICS MANUFACTURERS FROM 2010 TO 201816
EXHIBIT 11: EVOLUTION OF PQ DIAGNOSTICS FROM 2010 TO 201817
14 WHO prequalified vaccines list; World Bank country classification (status 2018) 15 The WHO Test Kit Evaluation programme began in 1988 with the objective to give an evidence-based decision for WHO
procurement – it was then superseded by WHO prequalification 16 WHO list of prequalified in vitro diagnostics; World Bank country classification (status 2018)
7
987 13
179
08
102
0393
1369
36
980%
010
1
12
130%
2
25
13010
0%
External Assessment Report – June 2019
19
C.2 QUALITY ASSURANCE SYSTEM FOR SAFE AND EFFICACIOUS PRODUCTS (METRIC 2)
C.2.1 Donor and procurer policies on prequalification (metric 2A)
a) Medicines
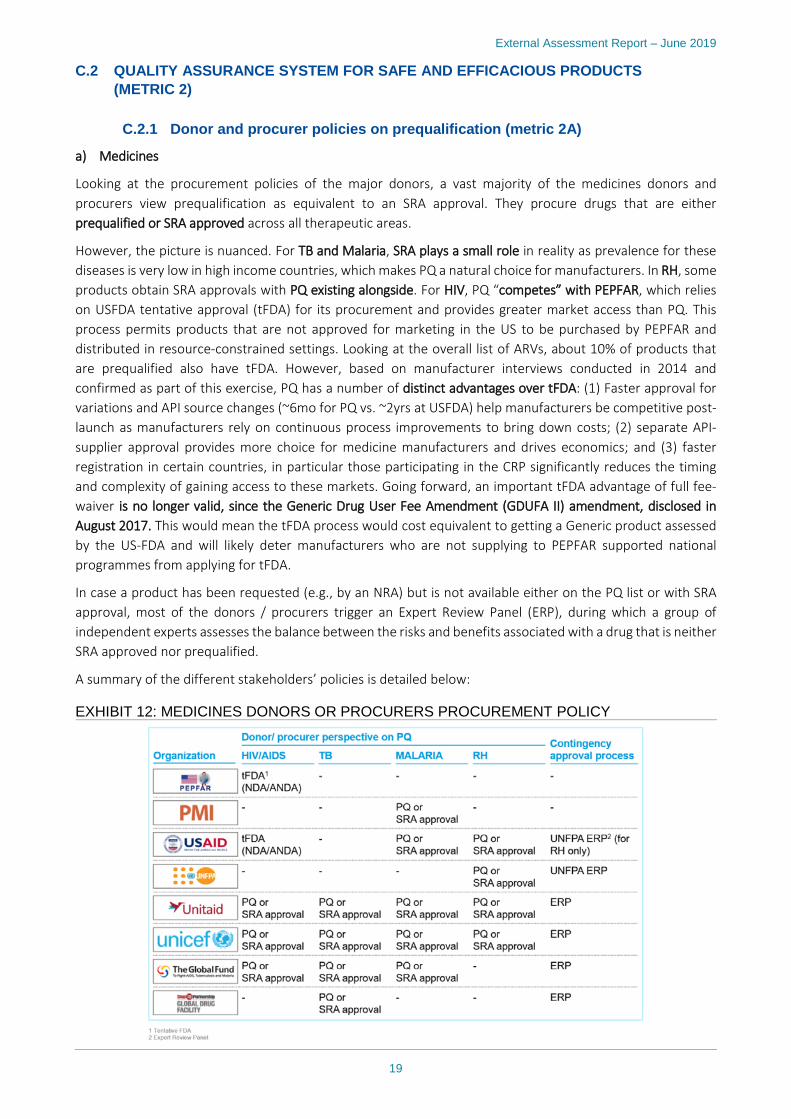
Looking at the procurement policies of the major donors, a vast majority of the medicines donors and procurers view prequalification as equivalent to an SRA approval. They procure drugs that are either prequalified or SRA approved across all therapeutic areas.
However, the picture is nuanced. For TB and Malaria, SRA plays a small role in reality as prevalence for these diseases is very low in high income countries, which makes PQ a natural choice for manufacturers. In RH, some products obtain SRA approvals with PQ existing alongside. For HIV, PQ “competes” with PEPFAR, which relies on USFDA tentative approval (tFDA) for its procurement and provides greater market access than PQ. This process permits products that are not approved for marketing in the US to be purchased by PEPFAR and distributed in resource-constrained settings. Looking at the overall list of ARVs, about 10% of products that are prequalified also have tFDA. However, based on manufacturer interviews conducted in 2014 and confirmed as part of this exercise, PQ has a number of distinct advantages over tFDA: (1) Faster approval for variations and API source changes (~6mo for PQ vs. ~2yrs at USFDA) help manufacturers be competitive post-launch as manufacturers rely on continuous process improvements to bring down costs; (2) separate API-supplier approval provides more choice for medicine manufacturers and drives economics; and (3) faster registration in certain countries, in particular those participating in the CRP significantly reduces the timing and complexity of gaining access to these markets. Going forward, an important tFDA advantage of full fee-waiver is no longer valid, since the Generic Drug User Fee Amendment (GDUFA II) amendment, disclosed in August 2017. This would mean the tFDA process would cost equivalent to getting a Generic product assessed by the US-FDA and will likely deter manufacturers who are not supplying to PEPFAR supported national programmes from applying for tFDA.
In case a product has been requested (e.g., by an NRA) but is not available either on the PQ list or with SRA approval, most of the donors / procurers trigger an Expert Review Panel (ERP), during which a group of independent experts assesses the balance between the risks and benefits associated with a drug that is neither SRA approved nor prequalified.
A summary of the different stakeholders’ policies is detailed below:
EXHIBIT 12: MEDICINES DONORS OR PROCURERS PROCUREMENT POLICY

External Assessment Report – June 2019
20
b) Vaccines
In vaccines, there are a number of products that apply both in HIC and LMIC, such as the pneumococcal conjugate vaccine. However, PQ has adopted an LMIC centric approach which comes to bear especially for vaccines. The PQ reviews on quality, safety and efficacy are very specific to needs of LMIC by taking into account the risk and benefit relevant to the local population of intent, which varies significantly from the US or Europe, where incidence and burden of disease are lower, demographics are different, and the standard of care available is higher. Through the procedure for assessing the Programmatic Suitability of Vaccines for Prequalification (PSPQ), PQT also reviews practical non-medical considerations specific to LMIC settings, such as logistics, cold chain, thermal stability, etc.
Given the special requirements for vaccines in LMIC, most vaccines procurers rely on WHO prequalified products exclusively. As an example, GAVI and UNICEF, which supply about two thirds of the total donor funded vaccines for LMIC, only accept products that are prequalified.
In case no prequalified product is available, GAVI would seek for the approval of a fully functional NRA in both the country where the product is manufactured and the country where the product is to be delivered. A similar policy can be found with UNICEF, which only procures vaccines that are prequalified by WHO. However, some donors / procurers (PAHO, MSF, ICRC) have a broader acceptance policy and procure vaccines that are either prequalified or SRA approved.
A summary of the different stakeholders’ policy can be found below:
EXHIBIT 13: VACCINES DONORS OR PROCURERS PROCUREMENT POLICY
c) Diagnostics
Like the medicines donors, most of the diagnostics donors accept both PQ and stringently assessed products.
However, with each donor having his own internal policy, some specificities can be found. For example, UNICEF, UNDP and UNFPA only accept prequalified diagnostics for HIV and Malaria, but accept PQ or stringently assessed products for Reproductive Health. On the other hand, the Clinton Foundation only accept PQ products for Malaria and Reproductive Health but accept both stringently assessed products and PQ for HIV diagnostics.
The PQ list is not exhaustive and does not cover all disease areas. Should a Recipient wish to procure a product that is not covered by PQ, the donor can either trigger an ERP (The Global Fund or Unitaid) or follow WHO endorsement if it is a TB diagnostic. Indeed, no diagnostics are on the PQ list when it comes to TB but some

External Assessment Report – June 2019
21
products had been endorsed by WHO (TB diagnostics are evaluated and guidelines are developed through the WHO TB program).
A summary of the key organizations’ internal policies can be found below:
EXHIBIT 14: DIAGNOSTICS DONORS OR PROCURERS PROCUREMENT POLICY
C.2.2 Perception of PQ safety, quality and efficacy assurance by manufacturers, donors / procurers and NRAs (metric 2B)
On the topic of safety, quality and efficacy assurance, four major themes have emerged based on structured interviews with manufacturers, donors/procurers and NRAs. Some aspects relating to these themes are overarching across all PQ streams, while some are specific to either medicines, vaccines or diagnostics. Insights and perceptions are nuanced depending on the specific expectations of each stakeholder group.
The four themes that have emerged are: (i) PQ is seen to have enabled broader access to quality products in LMIC; (ii) safety and quality of products in LMIC has been positively impacted; (iii) the transparency of the end-to-end PQ assessment process could be improved; (iv) the overall timelines for the PQ assessment have improved but timeliness and responsiveness for certain aspects of the process could be improved.

External Assessment Report – June 2019
22
EXHIBIT 15: STAKEHOLDER PERCEPTION OF SAFETY, QUALITY AND EFFICACY18
a) Overarching themes
(i) Access to quality products
There is a clear perception that PQ has helped to significantly broaden access to quality medicines, vaccines and diagnostics in LMIC by enabling pooled procurement for multiple countries (see metric 2A above) and by increasing competition in LMIC, leading to lower prices (see metric 4B for a quantitative analysis of price impact).
From the perspective of Multi National Corporation (MNC) manufacturers, PQ has made it financially attractive to market products in smaller LMIC because PQ has enabled an aggregation of demand across countries through pooled procurement. This benefit is felt in particular by MNCs manufacturing vaccines (see below).
From the perspective of DCMs, PQ has enabled access to LMICs mainly because it has helped them reach the quality level required to obtain NRA approvals on a consistent basis and to participate in international tenders and pooled procurement. This is achieved through the special guidance that WHO provides to DCMs throughout the registration process. It is a benefit that is perceived equally by DCMs of both medicines and vaccines.
From the perspective of donors and procurers, PQ has enabled a significant increase in patient access to quality products in LMIC, which represents the flipside of the improved market access experienced by manufacturers. The main enabler of this, from the viewpoint of donors and procurers, is the fact that PQ has increased competition by making it possible for DCMs to enter the market (see quantitative analysis metric 1B above). As seen quantitatively in metric 4B, this has led to a drop in prices especially for HIV/ARV and Malaria medicines 18 Only stakeholders that provided scores listed
“WHO organizes meetings with manufacturers […] we work very closely […] It is especially helpful for manufacturers that are less exposed to SRA”

External Assessment Report – June 2019
23
and for vaccines, which has allowed more patients in LMIC to get access to affordable treatment.
(ii) Improvement of quality standards
The quality of medicines, vaccines and diagnostics available in LMIC has been positively impacted by PQ, which is generally seen as a stringent assessment. Despite occasional safety and quality issues with PQ products reported, the trust level in the safety, quality and efficacy of PQ products is high among all stakeholders. In terms of product streams, this holds true for medicines, vaccines and diagnostics.
For medicines and diagnostics, procurers have mentioned quality issues that are occasionally discovered at the verification stage before being distributed, i.e. product supplies that are not in line with the specifications that have originally been prequalified (see examples below). Procurers in these streams have therefore expressed a desire that WHO / PQ play a more prominent role in assuring quality post-prequalification by allowing for systematic feedback on quality issues at the procurement stage (e.g., lot testing).
(iii) Transparency
The transparency of the PQ process could be improved, mainly with regard to the current status of PQ products and the fee structure.
With regard to the first point, WHO PQ currently publishes a list of prequalified medicines, vaccines and diagnostics; however, stakeholders are looking for more. With regard to transparency on the status of PQ products, donors and procurers across all product streams have mentioned that they would desire an easily accessible database showing the current status of prequalified products, including variations, approval status in countries, rejection or de-listing. While not all aspects of these processes are under the direct control and purview of PQT, the WHO PQT could establish the right linkages to enable such a transparent informational database. Currently, donors and procurers find it difficult to access this information and have to resort to individual e-mail enquiries, for which it often takes long to obtain a response.
With regard to transparency on fees, some vaccine manufacturers have mentioned improvement potential (see examples below).
(iv) Timely process
Finally, there is perception that the process can be lengthy both with regard to timelines for registration and in terms of responsiveness to regular requests.
Manufacturers across all product streams appreciate that there has been a significant acceleration of registration timelines for PQ products within the last few years, from lead times of 2-3 years on average to usually one year or less currently. Considering the interviews conducted in 2014, where up to 25% of manufacturers across medicines and diagnostics highlighted a faster dossier review as an important priority, this can be considered as a positive achievement.
However, donors and procurers in particular felt that the process for inclusion of new products in the PQ list
“It would be very useful for procurers and manufacturers to have a database on registration status for PQ products in countries; this hasn’t been implemented even though we have tried for years”
“PQ needs to communicate more pro-actively on the status of variation applications: whether a certain variation is being assessed or has been accepted – we cannot find any info regarding this online, so we need to send an e-mail”
“We are regularly informed on new listings, but are not always informed on de-listings, issues with manufacturers, etc.”

External Assessment Report – June 2019
24
is lengthy, at times leading to delays in patient access for medicines and vaccines.
Manufacturers and donors / procurers across all products streams felt that responsiveness to requests in regular correspondence could be improved. This can relate to queries on the receipt or acceptance status of new dossiers or label variations, to specific follow-up questions on dossier in process, or to clarification on process requirements.
b) Medicines
(i) Access to quality products
As seen quantitatively in metric 4B and confirmed by donor perception, the fact that PQ has made it possible for DCMs to enter the market has had a particularly positive effect on HIV/ARV and Malaria medicines, where significant price drops have allowed more patients to get access to affordable treatment in LMIC (see quantitative analysis in metric 5). TB has also seen an increased availability of products which has led to decreases in price.
All stakeholders have mentioned that they would like to see an expansion of the PQ list to include more products on the WHO list of essential medicines, in particular biologics, biosimilars and chemotherapy drugs to treat basic cancers (e.g., leukemia).
(ii) Improvement of quality standards
For medicines, procurers have mentioned quality issues that are occasionally discovered at the verification stage before being distributed. For example, one medicines manufacturer increased the acceptance threshold for impurities versus what had been prequalified, which the procurer discovered as part of a verification it conducted. Similarly, medicines from multiple DCMs have been found to carry incorrect labelling. Procurers of medicines, have therefore expressed a desire that WHO / PQ play a more prominent role in assuring quality post-prequalification by allowing for systematic feedback on quality issues at the procurement stage.
c) Vaccines
(i) Access to quality products
The benefit of access to smaller DCMs is felt in particular by Multi-National Corporations (MNCs) manufacturing vaccines, where UNICEF which supports Gavi for vaccines, vaccine related devices and supplies and cold chain equipment, manages supply and procurement, with the indication of awards for WHO PQ as part of their policies, lead procurement with a two-thirds share of the donor funded market. MNCs have stated that PQ has led to a rapid increase in DCM sales for some vaccines, whereas priori to PQ introduction, DCMs had virtually no sales.
From the perspective of donors and procurers of vaccines, it was stressed that in PQ has been a key enabler of increased patient access for some vaccines, as the market entry ofDCMs has led to a drop in price (e.g., see metric 4B for quantitative analysis on Pentavalent vaccine).
A number of MNC manufacturers have expressed a desire for an exemption from national registrations as a
“There is a fundamental capacity issue; the PQ team is often a bottleneck in administrative processes, which sometimes leads to delays in patient access to vaccines, even for high priority requests”
“PQ has opened the market to manufacturers from LMIC and resulting lower prices have generated savings for the system”
“Without PQ we would not have this market, before PQ we had no sales in LMIC. Prequalification has changed how we do business in the world, there are countries that were not on our map before.”

External Assessment Report – June 2019
25
third step after SRA approval and prequalification for UN procured vaccines. Given vaccines are intended for prophylactic use to safeguard public health on a campaign basis, these manufacturers believe that they require more flexibility than pharmaceuticals and biotherapeutics.
(iii) Transparency
Vaccine manufacturers have mentioned that the feel a need for transparency as to where the fees paid to prequalify a product are spent within WHO, i.e. whether they go towards overhead expense of are earmarked to a specific department or product category. Furthermore, it was mentioned after the payment of the initial registration fee, there is insufficient information on when the annual retention fee is due, for how long it will have to be paid, etc.
d) Diagnostics
(i) Access to quality products
In contract to medicines and vaccines, diagnostics manufacturers did not feel that PQ has been a game changer in enabling access in LMIC. As seen quantitatively in metric 7A, market entry of DCMs has been very limited in diagnostics, with a series of such manufacturers having had their products de-listed. The diagnostics market, thus, sees majority supplied by MNC manufacturers, although manufacturers from China are increasingly entering the market.
In addition to this, it is often perceived as easier for manufacturers to obtain the CE-mark rather than undergoing the PQ process – a situation that differentiates diagnostics from medicines and vaccines where an SRA approval is a major barrier for DCMs, making PQ the procedure of choice.
All stakeholders, especially procurers and NRAs, have mentioned that they would like to see an expansion of the PQ list to include more diagnostic products, in particular in hematology, TB and tropical diseases beyond Malaria.
(ii) Improvement of quality standards
Similar to medicines, procurers of diagnostics have mentioned quality issues that are occasionally discovered at the verification stage before being distributed. For example, manufacturers have been found to supply oral fluid HIV rapid diagnostic tests whose specifications were different from what was prequalified.
In addition, among LMIC diagnostics manufacturers there is a perception that PQT may apply a more lenient standard to MNCs who have products with significant sales across markets when considering de-listing because of the gap in access it would leave.
As a result, diagnostic procurers have also expressed an interest a more systematic quality tracking mechanism to ensure that products supplied are in line with prequalification standards.
C.2.3 Recommendations
The PQ system of assuring the safety, quality and efficacy of medicines, vaccines and diagnostics is working well overall, with some opportunities to improve the transparency of the prequalification process (requirements, approval status, timelines, fees) and the responsiveness to manufacturer and procurer requests. If these process challenges are addressed and sufficient capacity provided, an expansion of the WHO prequalification to further disease areas or product categories with a high unmet need could be considered. Based on desk research and interviews, a series of enhancements were identified that could help address the above-mentioned challenges:
■ PQ process clarification: communicate a clear path from EoI / prioritized list to PQ post-approval stage to applicants, by developing a more user-friendly, comprehensive guide (“instruction manual”) that includes:
– A step-by-step description of the application process with details on the documentation required for submission at each step, set out in easily understandable language to enable first-time applicants

External Assessment Report – June 2019
26
from LMIC to independently build the dossier for assessment
– Clear timelines not just for the overall process but for each key step in the process (set for either WHO or the manufacturer depending on which party needs to act)
– Steps to follow to maintain a product prequalified and to add post-approval changes
– Fee payment schedule (when to pay the fees, for what period of time) as well as annual report on where the fees are spent
By clarifying the overall PQ process for manufacturers, the number of queries received is likely to decrease, thereby increasing WHO PQT capacity to answer additional case-by-case requests and improving the overall response rate.
■ PQ database: expand currently existing PQ-list containing applicant, prequalification date and therapeutic area; develop an easily accessible database with a more end-to-end lifecycle view and a real-time status update on prequalified products / candidate products. The database should be offered across medicines, vaccines and diagnostics. It should include:
– Full prequalification status: pending prequalification, prequalified, rejected, delisted
– Status on post-approval changes
– Countries where the product is marketed
– Approval status in countries
This database should be offered across all streams: medicines, vaccines and diagnostics.
■ PQ scope: conduct assessment on disease areas and product categories for potential future expansion of PQ list reflecting unmet needs of LMIC (areas with highest PQ value-add, market failures, etc). Based on interviews, the following areas are proposed for consideration:
– More products on the WHO list of essential medicines, in particular biologics, biosimilars and chemotherapy drugs to treat basic cancers (e.g., leukemia)
– More diagnostic products (e.g., hematology, TB, tropical diseases beyond Malaria)
■ Operational capacity: tackle operational inefficiencies to ensure increasing number of PQ products and potential scope expansions can be managed without compromising process efficiency. In particular:
– Reduce number of queries through better explanation of PQ application process (see above)
– Step up IT capabilities to reduce churn created through manual work (e.g. automated updates of PQ-list, query-handling platform with queuing and alerts)
– Increase collaboration across Rx, Vx, Dx and other teams through exchange of knowledge; this includes entities outside of RHT, such as the Communicable Diseases cluster, the WHO Emergencies Programme on the assembly of disease commodity packages for emergencies, or the WHO department of Corporate Procurement Policy and Coordination (CPC) to better ensure that the WHO QA policy can be aligned behind WHO prequalification
C.3 ENSURING LMIC APPROPRIATE PRODUCT DEVELOPMENT (METRIC 3)
C.3.1 Case studies (metric 3A)
An important aspect of WHO PQT’s mission is to foster innovation and enable the right ecosystem to support the development of products that are tailored to the needs of LMIC. The PQT does so by leveraging strong partnerships with donors, manufacturers and local NRA and providing technical guidance to manufacturers.
Several case examples can be made for all product streams, showcasing WHO PQT’s value proposition to both manufacturers and healthcare systems in LMIC by enabling specific innovations.

External Assessment Report – June 2019
27
a) Medicines
Two specific case examples can be highlighted to illustrate WHO support in regard to innovation for medicines.
(i) Rectal Artesunate Suppositories (RAS) – MA123 and MA124)19
Rectal Artesunate Suppositories are used for severe malaria patients unable to access WHO-recommended parenteral treatment (preferably injectable artesunate) immediately. This alternative treatment helps reduce the risk of death and disability by ‘buying time’ until the patient can get to a healthcare facility for intravenous artesunate treatment
In 2005, WHO first recommended the use of RAS for pre-referral management of young children with severe malaria but, until 2018, no RAS product had met international quality standards, leaving countries with limited options to cope with children in need of pre-referral care
This situation hampered widespread availability and use of quality-assured RAS and forced malaria-endemic countries to choose from sources of drug supply that did not meet international standards (e.g., Mepha product). However, in 2013, Medicine for Malaria Venture (MMV) and Cipla approached WHO PQ to find a collaborative solution.
WHO played a key role by:
■ Enabling and coordinating a joint effort between MMV, WHO TDR, Unitaid, WHO’s Global Malaria Program, Cipla and Strides to develop a product that would meet the international requirements and bridge the existing gap
■ Prequalifying the first two RAS specifically developed for LMIC:
– MA124, 100mg - Rectal capsules, by Cipla Ltd, India (February 2018)
– MA123, 100mg - Rectal capsules, by Strides Shasun Ltd, India (June 2018)
■ Providing continuous guidance from WHO PQ team during the registration process facilitated and accelerated the approval
(ii) Pediatric TB products (TB 302 and TB 309)20
Around the world, most children do not have access to TB medicines in the proper doses or formulations. One of the top reasons behind this, is that children rarely are included in clinical trials evaluating new medicines, making it hard for regulators to approve a pediatric drug or a children-tailored formulation.
In order to cope with the need of children-specific drug on the market (e.g., reduced doses), care providers and parents have to crush or chop adult pills to approximate the correct dose for children. This is a daily struggle throughout the six-month treatment period and creates a guessing game of whether children receive the right dose.
Ultimately, these medicines can negatively impact adherence, outcomes, and may contribute to the development of drug-resistant TB.
WHO played a key role in addressing this issue by:
■ Enabling a strong partnership with Unitaid and the TB Alliance to develop child-friendly fixed-dose combinations to treat drug-susceptible TB through the STEP-TB project (Speeding Treatments to End Pediatric Tuberculosis)
■ Rapidly prequalifying two TB treatment products specifically developed for pediatric use:
– TB302, Isoniazid/Rifampicin - 50mg/75m - Dispersible tablet, by Macleods Pharmaceuticals Ltd, India (August 2017)
19 MMW and Unitaid websites, MA123 and MA124 WHO Prequalification information 20 TB Alliance website, TB302 and TB309 WHO Prequalification information

External Assessment Report – June 2019
28
– TB309, Isoniazid/Pyrazinamide/Rifampicin - 50mg/150mg/75mg - Dispersible tablet, by Macleods Pharmaceuticals Ltd, India (December 2017)
■ Providing continuous guidance during the registration process facilitate and accelerate in-country approval
These two specific pediatric TB products offer significant advantages over previously used adult formulations, increasing the adherence and improving the outcomes because:
■ Pediatric targeted drugs contain the “correct” dosage (WHO-recommended dose) – there is no need for the caregiver to crush of chop the product
■ Because the product is quickly dispersible in liquid, it is easy for parents to give and for young children (under 25kgs) to take
■ The product is flavored (fruit flavor), making it even easier for the children to adhere to the treatment
b) Vaccines
(i) MenAfriVac (Meningococcal A conjugate vaccine)21
Epidemics of meningococcal A meningitis have swept across 26 countries in sub-Saharan Africa for a century, killing and disabling young people every year. Following an epidemic that killed more than 25,000 people in 1996, WHO and PATH created the Meningitis Vaccine Project (MVP) with Gates’ support (US$70 million) to develop a meningitis vaccine for Africa.
However, developing an innovative vaccine was not the only issue to face and several African Minister of Health made it clear that a cost of more than US$0.50 per dose would be unsustainable (US $0.50 is less than 1/10 the cost of a typical new vaccines).
As a result, MVP put in place a product development plan consisting of a pharmaceutical, clinical, and regulatory strategy for the development of the vaccine, and identified a DCM (Serum institute Of India) willing to manufacture an affordable conjugate vaccine.
The first clinical trial was launched in 2005 while WHO prequalification was received by 2010, which is a record time to develop an innovative product. As a result, in-country registration process was facilitated for the local NRAs and, since launch in 2010, 217 million vaccines have been used.
WHO played a key role in this success by:
■ Spearheading the international effort together with PATH, which led to MenAfriVac being developed in record time and at less than 1/10 the cost of a typical new vaccine (<US$0.50 per dose)
■ Prequalification of this vaccine using a fast track procedure in less than 6 months
■ Expediting the licensure of the vaccine and ensure widespread use in countries through the WHO facilitated collaborative process
■ Supporting the National Regulatory Authority of India, DCGI, through twinning process with Health Canada on assessment, inspection and other regulatory processes
(ii) Inactivated Polio Vaccines (IPV)
Although the oral poliovirus vaccine (OPV) is currently being used to interrupt transmission of wild poliovirus (WPV), the OPV is a live attenuated product that can in rare occasions cause outbreaks of vaccine-derived polio. Therefore, the Global Polio Eradication Initiative (GPEI) cannot rely on it to maintain a polio-free world.
GPEI is planning to stop using OPV as soon as WPV has been certified as eradicated, which is expected to occur in 2020 or 2021. At that point in time, IPV will be needed to ensure that the poliovirus is never reintroduced.
21 Meningitis Vaccine Project (MVP) website, WHO interview, WHO website (The MenAfriVac story)

External Assessment Report – June 2019
29
However, today’s IPV market is fragile, without enough near-term supply for all countries to have access to at least one full dose of IPV in their routine immunization programs.
In order to support innovation and ensure that there is sufficient supply, WHO PQ prequalified six IPVs since 2005, from different developed and DCMs (including Sanofi Pasteur, AJ Vaccines, Bilthoven Biologials, Serum Institute of India, GSK). However, despite continuous efforts from WHO, there is no probability of supply meeting one-dose demand in 2017–2019 in most scenarios22. The earliest improvement in the supply situation is likely to come in 2020–2021 when new vaccines achieve WHO prequalification.
During this time period, WHO PQ plays an important role to ensure there is sufficient supply, especially for high-demand products, including:
■ Ensuring access to quality-assured vaccines through continuous monitoring of prequalified vaccines, including discussions with relevant NRAs
■ Ensuring enough manufacturers are able and willing to take part in the PQ process
■ Making sure the prequalification process is rapid and efficient, and prioritize high-importance products
c) Diagnostics
(i) Abbott RealTime HIV-1 Viral Load adapted for use with dried blood spot specimens
Testing of HIV viral load (VL) with limited resources can be challenging because of the scarcity of skilled phlebotomists, the specimen processing required time (less than 6 hours), and the need for cold chain transport of processed specimens to centralized testing facilities.
Dried blood spot specimens (DBS) are an alternative specimen that simplifies the above-mentioned barriers. Indeed, DBS offers significant advantages: phlebotomy is not needed, the processing is minimal, and the transportation is easier and cheaper as cold chain is not required.
In addition, the validation of DBS as a specimen type by the manufacturer allows for reduced risk of product misuse (off-label) with clear manufacturer guidance on how to collect, process, store and transport for all specimen types, how to store the test kit and how to perform the assay with all specimen types.
WHO played a key role in promulgating the development and use of DBS by:
■ Advocating with the diagnostics industry for expansion of their viral load products to include DBS
■ Thereby moving some of the manufacturers, such as Abbott, to making DBS protocols available
■ Abbott RealTime HIV-1 Viral Load was adapted and prequalified for DBS in 2011 and benefits have gone beyond expectations
C.3.2 Perception of PQ-enabled innovation in LMIC context by manufacturers, donors / procurers and NRAs (metric 3B)
EXHIBIT 16: STAKEHOLDER PERCEPTION ON INNOVATION IN THE LMIC CONTEXT23
22 Gavi Supply & Gap analysis 23 Only stakeholders that provided scores listed

External Assessment Report – June 2019
30
a) Overarching themes
On the topic of innovation, three major themes have emerged based on our interviews with manufacturers, donors/procurers and NRAs: (i) PQ is seen to have enabled tailoring of products to the LMIC specific context; (ii) however, most of the stakeholders do not fully grasp the role that PQ has played in fostering innovation itself; (iii) there is a perception that PQ’s role in innovation could be more clearly defined and communicated.
(i) Development of LMIC tailored products
WHO guidelines, in addition to PQT’s continuous support to developers, are well appreciated by the different stakeholders. By developing specific guidelines that ensure products are tailored to the needs of LMIC (e.g., specific climatic and epidemiologic conditions), WHO was seen by the majority of interviewees to have enhanced the quality, usability and appropriateness of innovative products.
From the manufacturer perspective, this statement holds true for most of the 14 manufacturers interviewed (both MNCs and DCM), and across all streams (medicines, vaccines, diagnostics). Most commented that is was sometimes hard for them to have an extensive knowledge of the countries’ specificities and requirements.
(ii) Support for innovation
NRAs, donors and manufacturers rarely associated PQ with direct stimulation of innovation, although this was not always seen as a problem:
However, they did see a clear role for WHO, in extension to the PQ list, which indirectly supports innovation. There were multiple comments from all interviewees, that the currently limited scope of the PQ list makes it challenging for manufacturers to push for innovation in therapeutic areas. This suggests that PQ may be indirectly stimulating innovation through shaping demand. For therapeutic areas outside the PQ list, the inability to take a product through the PQ process appears to be a barrier to innovation.
(iii) Definition and communication of role
Across all product streams, stakeholders pointed out that WHO could do more to define and communicate its role in regard to innovation.
From the perspective of the NRAs, WHO’s main role in innovation is to target and assess a product profile, there is no expectation that WHO should be involved in supporting innovation on a regular basis. However, as demonstrated by the case examples described under metric 3A, WHO does support innovation to bridge a gap when needed (e.g., WHO collaboration with Medicine for Malaria Venture (MMV), WHO Special Programme for Research and Training in Tropical Diseases (TDR), Unitaid, WHO’s Global Malaria). It does this by leveraging its international footprint and collaborating with donors, manufacturers and NRAs.
From the perspective of 6 out of 14 manufacturers interviewed, there is an opinion that there is a need for support from WHO on fostering the development of innovative products. Even though PQT offers technical advice and assistance to manufacturers (e.g., on good manufacturing practices, product requirements for LMICs), many of the DCMs were not aware of it.
There is a mixed perception from donors and procurers, as some of them acknowledged the role of WHO in
“We do not have people present in those market […] so it is hard for us to assess the exact needs.”
“I have not really seen an impact in innovation, but I am not sure that WHO should play a role there.”
“As a sponsor of product development, it is important to get early and consistent input […]; it would be ideal if we could go through an advisory procedure with the WHO and receive technical support on the potential of the product and how it can be positioned to develop an appropriate development plan.”

External Assessment Report – June 2019
31
supporting targeted innovation in case of a specific need (i.e. developing a product that specifically addresses an unmet need such as pediatric formulation for Rx or dry-based sample for Dx); but others regret the fact that WHO does not have a clear positioning on innovation.
b) Medicines
(i) Development of LMIC tailored products
Manufacturers who have worked together with the PQT in the development process of a product are have a positive perception of the collaboration they have experienced. However, covering more therapeutic areas (e.g., hormonal contraceptives) is seen as a priority for all stakeholders as PQ is perceived as largely focused on Malaria and HIV. This would indirectly support innovation and better tailor to LMIC needs.
(ii) Innovation support
Medicines stakeholders (as in other streams) are on the lookout for an extension of the PQ list, which is generally seen as too restricted at the moment, that would allow them to innovate. For example, there is close attention on biologics and biosimilars, which are not covered by the PQ list.
In addition, donors and procurers have voiced a desire that WHO play more active role in supporting the development of new delivery mechanisms for drugs. On the other hand, from the perspective of NRAs, directly supporting core innovation (e.g., a new mechanism of action) would be a challenge for medicines as more than three quarters of the manufacturers that prequalify their products are generic players.
c) Vaccines
(i) Development of LMIC tailored products
Vaccine manufacturers acknowledge the fact that WHO supports, to some extent, innovation, by providing tailored advice and guidelines along with PQ. In some cases, it has allowed manufacturers to bring some innovation at formulation level to market (e.g., thermal stability), which would have been hard to implement without WHO support.
However, despite the fact that manufacturers acknowledge WHO guidance on country specific requirements, manufacturers from the South East Asian and Western Pacific regions have highlighted a desire to see more focus on regions outside of Africa. Currently, they perceive WHO’s LMIC specific guidance as too Africa-focused, with therapeutic areas and requirements tailored for this continent. For example, while Enterovirus 71 presence in Africa is limited, there is a high unmet need Asia, where manufacturers are pushing for the vaccine to be recognized as PQ eligible.
(ii) Innovation support
There is a perceived misalignment on WHO’s role in innovation. Even though WHO is seen as an innovation facilitator, some manufacturers regret the fact that WHO does not sufficiently address the pricing challenge. Given the majority of PQ products will be marketed in LMIC, it is challenging for manufacturers to trust the fact that innovation will allow them to set a better price.
“There is no PQ available for those products, so there is no incentive for manufacturers to enter those countries”.
“They should be more proactive in pushing innovation and technical support; e.g. novel drug delivery mechanisms, such nanotechnology to produce pills, improved solubility, long-acting injectables, etc.”
“The participation in PQ forced us to address programmatic suitability issues, i.e. we look more closely at thermal stability, cold chain, size of vials etc.”

External Assessment Report – June 2019
32
In that sense, donors feel that WHO has a role to play in managing manufacturers’ expectations while supporting the innovation process and, in some cases allow for flexibility in pricing to reward innovation targeted at unmet needs in LMIC.
d) Diagnostics
(i) Development of LMIC tailored products
Diagnostics are perceived as less mature than medicines and vaccines, and would hence require more support from WHO to innovate and develop solutions that are tailored to LMIC needs. From the perspective of manufacturers and donors, guidelines developed by WHO for diagnostics are less comprehensive than the ones developed for medicines and vaccines because of the lower maturity of the market.
C.3.3 Recommendations
Those manufacturers who have engaged the WHO PQT early on in the product development process have highly appreciated the support and technical assistance provided by the PQT. However, many stakeholders are either not aware of this dimension of PQT’s work or do not think it necessarily has to be part of its mandate. Many of them would appreciate WHO support to enable tailoring of products to LMIC needs (e.g., technical input on epidemiological country specificities, assistance on clinical development plans, etc.). To address this, two major enhancement areas are proposed:
■ External communication: increase awareness of WHO support provided during the early development phase of a product, in particular with DCMs and NRAs by:
– Advertising past success stories (e.g., case examples) on the WHO website in an easily accessible and visual way
– Showcasing the benefits of the technical assistance offering at the regional innovation roundtables (see above)
■ Insights gathering: strengthen formal procedure to collect input from NRAs on local unmet needs, pain points currently not addressed by products on the market, and expectations for product features in order to enable more tailored advice to manufacturers that addresses specific country needs. This could be achieved through:
– Electronic surveys
– Regional innovation roundtables bringing together LMIC NRAs and manufacturers
C.4 ECONOMIC RETURN ON INVESTMENT: SAVINGS GENERATED BY PQ SYSTEM (METRIC 4)
C.4.1 Quantitative analysis on savings generated by PQ vs investment made (Metric 4A)
The return on investment of WHO prequalification is a core metric to assess the impact the program has had on the global health system and patients in LMIC. In order to be useful, such an assessment needs to satisfy a number of criteria:
(i) A simple methodology that is easy to understand and communicate
(ii) Consistent with overall market and cost analyses work
(iii) Takes into account all relevant products streams and alternate regulatory pathways
The analysis done as part of this report covers HIV, Malaria, TB and RH for medicines, all vaccines, and HIV and
“We invested a lot in a product that was the first of its kind, but we were not able to price it accordingly”

External Assessment Report – June 2019
33
Malaria for diagnostics. Rather than counting the entire procurement market, it only looks at at the donor-procured market for LMIC (excluding government procurement) and procurement of prequalified products only.
It is understood that WHO prequalification operates in an environment where its impact can only be achieved in close collaboration with other stakeholders, such as SRAs, procurers and donors. All of those have made important contributions to increased access across various product categories. As an example, in Malaria and 1st line TB, PQ alone has enabled ~90% of market access in terms of total value; in these disease areas, SRA plays a small role as prevalence for these diseases is very low in high income countries, which makes PQ a natural choice for manufacturers. On the other hand, 51% of HIV-ARVs in value are both WHO-prequalified and SRA-approved while 21% solely rely on PQ.24 The comparatively smaller scope of PQ in ARVs is linked to the traditionally important role of PEPFAR, which relies on USFDA tentative approval (tFDA) for its procurement and provides greater market access than PQ.
Overall philosophy of calculating RoI: It is well recognized that PQ operates in a reality where donor funding is limited and not sufficient to cover the entire population affected. In such a resource constrained setup, as donors generously invested in PQ in the past, the “economic return” was considered as the savings generated per $ that is invested in PQ. The savings generated are a result of an increase in competition that PQ has enabled by providing an avenue for DCMs to participate in the market. It is recognized that the methodology has some limitations, notably (a) it does not quantify the “$ value” of lives saved (an inherently difficult proposition), and (b) not all savings observed in the market are fully linked to PQ-enabled competition (attributability).
In order to estimate the donor-funded PQ-eligible market size, a triangulation of different data sources was conducted. The analysis is based on data from 2014, for which complete datasets are available from all sources used for triangulation. Given the donor-funded market size is unlikely to have changed by any significant extent due to a largely fixed donor spend, the estimated range of RoI calculated for 2014 can be assumed to be representative for the present date.
For medicines, the following sources were used: (i) HIV/ARV: WHO Global Price Reporting Mechanism (GPRM) database, triangulated with Unitaid, UNAIDS, Global Fund, PEPFAR, CHAI data; (ii) Malaria: WHO GPRM database, triangulated with Unitaid, CHAI, IHME, WHO World Malaria Report data; (iii) TB: Global Fund Price & Quality Reporting (PQR)25 database, triangulated with IHME, GDF/StopTB data; (iv) RH: RHInterchange database26. For vaccines, UNICEF Supply Division data was used, complemented by PAHO data, and calibrated to only include sales of prequalified products. Finally, for diagnostics, datasets used for triangulation were from Global Fund, USAID, UNICEF, WHO.
24 WHO Prequalification Annual Report 2016 to Unitaid 25 http://pqr.theglobalfund.org 26 https://www.unfpaprocurement.org/rhi-home

External Assessment Report – June 2019
34
a) Methodology
EXHIBIT 17: ROI METHODOLOGY HIGH-LEVEL OVERVIEW
To calculate savings generated by the PQ system, a three-step approach has been applied.
As step one, savings are calculated on an annual basis for the top products (by donor-funded sales) in each medicines, vaccines and diagnostics. Within medicines, savings are separately calculated for the top products in each major disease area covered, i.e. in HIV, Malaria, TB, and RH. For example, in medicines the top 3 drugs analyzed for HIV are Efavirenz + Lamivudine + Tenofovir disoproxil fumarate, Lamivudine + Nevirapine + Zidovudine, and Lopinavir + Ritonavir, which together make up about 65% of total donor-funded HIV/ARV sales. Where different presentations or dosage strengths exist, as for example for most ARVs, savings are calculated separately for each of those.
The methodology for calculating savings for each of the products (or presentations / dosage strengths) is based on a multiplication of units sold and of price drops observed as a result of new manufacturers entering the market due to PQ. To calculate price drops, the price prior to market entry of the first major DCMs is generally taken as the starting price point (averaged across several years in some cases) and is compared to the latest price point in the dataset. In order to focus on PQ-enabled savings, no savings are counted for products where majority sales are MNC manufacturers and price drops are unlikely to have been enabled by PQ (e.g., pneumococcal conjugate vaccine) as few DCMs have entered, or where prices fluctuate significantly over time.
EXHIBIT 18: STEP ONE – CALCULATE SAVINGS FOR TOP PRODUCTS
As step two, savings for the top products are summed up. For the lower bound scenario, only these savings are taken into account and it is assumed that PQ has generated no savings for other products within a stream or disease. For the higher bound scenario, savings on the top products are scaled up to the full donor-funded PQ-enabled LMIC market size using the ratio of sales of top products versus total market sales of all prequalified products (e.g., excluding PEPFAR procurement based on tentative FDA approval for ARVs, etc.).
0.320.350.370.490.50
12112010
-0.18
201413
1165Volume (Mn)
208Savings (USD Mn)
Unit price drop (USD)

External Assessment Report – June 2019
35
EXHIBIT 19: STEP TWO – SCALE UP TO TOTAL DONOR-FUNDED PQ-ENABLED LMIC MARKET
As step three, savings are aggregated across all products streams and compared to PQ-related costs (FY 2013). Costs taken into account to calculate the return on investment for PQ are: (i) variable PQ costs; (ii) fixed PQ costs; and (iii) indirect PQ costs. For details on what the cost items include, reference is made to exhibit further below. The RoI is then calculated as the fraction of savings generated per 1 unit of cost.
EXHIBIT 20: STEP THREE – CALCULATE RETURN ON INVESTMENT
b) Output
The analysis based on the methodology and data sources laid out above yields an estimated total savings range of US$826–1,074 million across medicines, vaccines and diagnostics, while acknowledging that WHO Prequalification program operates in the broader ecosystem of Global Health stakeholders who contribute towards these savings as well. Savings divide into the three streams as follows:
(i) Medicines: US$416 – 592 million
(ii) Vaccines: US$407 – 474 million
(iii) Diagnostics: US$3 – 8 million
Savings generated for diagnostics as a result of WHO prequalification are comparably low at this stage, but it needs to be kept in mind that the situation at the starting point is different between Rx, Vx and Dx.
Indeed: First, diagnostics only became part of WHO prequalification relatively recently (2008), hence the timeframe considered in the analysis is relatively short. Secondly, prices for many of diagnostics were already low when the first diagnostic products were prequalified in part because they were for use in LMIC (e.g., UN market for HIV RDT has been mature since early 1990s, with already low prices – around USD 1.2). Certain products also have a market in HIC (e.g., HIV molecular testing for HIV viral load), however, even though prices dropped in LMIC for these products, volumes were limited initially as this technology requires specialized laboratory environment and skilled lab technicians. In addition, many instruments used in LMICmanu are
Scale up to total savings for product stream / disease area Calculate RoI for PQ program & PQ related activities
▪ Sum savings of all dosage strengths for top 3 products– Top 2 product types1 for Rx-RH and
diagnostics– Top 5 products for vaccines
1
▪ Scale up savings of top products of disease area to total donor funded PQ approved LMIC market (based on 2014 market share)– Higher bound: savings to sales ratio of
top products considered equal for other products
– Lower bound: no savings for non-top products considered
2
65 %
Savings EFV/3TC/TDF2
Savings product Z
204Savings top 3 drugs
Market share of top drugs
312Total Rx-HIV market savings
208
X
…
Σ
Example: Rx-HIV – Higher boundUSD Mn
Calculate savings for product dosage strength
Calculate RoI for PQ program & PQ related activitiesScale up to total savings for product stream / disease area
Calculate savings for product dosage strength
▪ Calculate PQ related costs– Variable PQ costs– Fixed PQ costs– Indirect PQ costs– Non-PQ RHT costs are excluded
2
▪ Determine Return on Investment3
▪ Sum savings across all product streams1
28
1,073
~40
Rx-HIV savings
Product stream Z savings
PQP savings
PQP related costs
Return on Investment (-)
312
X
…
Σ
PQ program – Higher boundUSD Mn

External Assessment Report – June 2019
36
closed systems meaning that proprietary reagents and sometimes consumables must be used.
Overall, it is agreed that quality has a price and that it should not go below a bottom threshold under which quality is impacted.
Costs are calculated in aggregate across all streams, as seen in the following exhibit. They reach a total of US$28.4 million as per FY 2013.
EXHIBIT 21: OVERVIEW OF WHO PQT / RHT COST COMPONENTS IN SCOPE FOR ROI
At PQ-enabled savings of US$826 – 1074 million and costs of US$28.4 million across medicines, vaccines and diagnostics, this leads to an estimated return on investment of about 30-40 to 1 for the PQ-enabled donor-funded market.

External Assessment Report – June 2019
37
EXHIBIT 22: ROI ANALYSIS OUTPUT
C.4.2 Case studies on price drops enabled by PQ through increased competition (metric 4B)
As described above, the methodology used herein for calculating the economic impact relies on an analysis of the savings generated to the system as a result of a reduction in prices that is the consequence of increased competition with additional players getting access to the donor-funded market. The following section examines a few case examples across medicines, vaccines and diagnostics where price drops have occurred over time for products marketed in LMIC for which manufacturers have obtained prequalification. In some of the case examples, price drops can be attributed to PQ, in others there are competing factors leading to a decrease in prices including contributions of other Global health stakeholders.
a) Medicines
(i) Case example 1: Efavirenz + Lamivudine + Tenofovir disoproxil fumarate (HIV/ARV)
Efavirenz + Lamivudine + Tenofovir disoproxil fumarate, the largest ARV drug by market share in 2014, saw a sharp price decrease in 2012 when the first DCM entered the market with a PQ-listed product, based on a USFDA tentative approval. After that, the price dropped continuously over a series of years as two additional products by other DCMs got PQ listed (both products later obtained prequalification in 2017 and 2015). Subsequently, the originator adjusted pricing to the same level as its competitors from 2012 onwards so that by 2014, all manufacturers had an average price between $ 0.30-0.35/unit. As demonstrated by the above, within the context of the overall ecosystem of drug procurement, PQ has facilitated market entry of DCMs, which in turn increased competition and led to a reduction of overall market prices.

External Assessment Report – June 2019
38
EXHIBIT 23: CASE EXAMPLE – EFAVIRENZ + LAMIVUDINE + TENOFOVIR (HIV/ARV)
(ii) Case example 2: Arthemether + Lumefantrine (Malaria/ACT)
Drug prices for this Malaria drug decreased in 2006, one year before the first DCM entered the market. This was the case even though the two DCMs who entered a year later, managed to achieve only limited sales before obtaining PQ status. In 2010 and 2011, all manufacturers were forced to increase prices due to a global Artemisinin shortage, a key ingredient of Artemether. However, prices again dropped significantly after 2011, showing the impact on prices that PQ had as a consequence of the DCM market entry it enabled.
EXHIBIT 24: CASE EXAMPLE – ARTEMETHER + LUMEFANTRINE (MALARIA/ACT)

External Assessment Report – June 2019
39
b) Vaccines
(i) Case example 3: Pentavalent vaccine (DTP-HepB-Hib)
The original pentavalent vaccine (DTP-HepB-Hib), was initially priced at an average unit price of around $3.6/dose for UNICEF procurement. With the market entry of several DCMs with prequalified products, prices started dropping around 2008. By 2014 the overall market price drop was nearly 50%. Since then, new suppliers have continued to drive down prices with the latest offering from one of the DCVMs at being $0.69/dose for a 10-dose vial as of 2018. This is another example for competition enabled by PQ which led to a price drop in the market and, as a consequence, increase access of patients to high quality vaccines in LMIC.
EXHIBIT 25: CASE EXAMPLE – PENTAVALENT VACCINE (DTP-HEPB-HIB)
(ii) Case example 5: Pneumococcal Conjugate Vaccine (PCV)
PCV sales in LMIC have been supplied by two Multi National Corporations (MNCs), since 2010, with no notable DCM products. As of 2012, average market price dropped from around $7 per unit to around $5.5 in 2014 and slightly above $4 by 2016. However, the price drop cannot be attributed to WHO prequalification. Rather, other factors were at play – notably, an Advance Market Commitment (AMC) led by GAVI and the World Bank, and an immunization campaign by MSF. The AMC was launched in 2009 and manufacturers agreed to supply the vaccine at a “tail price” of $3.50/dose once a certain volume of doses have been supplied by the manufacturer. In 2014, Medicines Sans Frontières (MSF) launched its “A FAIR SHOT” campaign to lower the price of the vaccine to $5 per child ($1.67 per dose) in all developing countries.
Given price decreases for PCV cannot be attributed to the WHO prequalification, no savings have been taken into account for the calculation the RoI discussed under metric 4A above.
c) Diagnostics
(i) Case example 6: Rapid HIV serology tests
HIV Rapid Diagnostic Tests (RDTs) are typically used for detection of HIV antibodies in capillary whole blood or oral fluid. For an accurate HIV diagnosis, there must be three sequential reactive (positive) test results: assay 1 (first-line), and assays 2 and 3 (as second and third line respectively). Assay 1 is used at a higher volume and hence priced lower than assays 2 and 3 (see exhibit). One of the Diagnostic players is the clear market leader for assay 1 RDTs, mainly due to reputational advantages in LMIC and a short “window period” between

External Assessment Report – June 2019
40
infection and test response. Another MNC competes in the Assay 2 segment, where it has an advantage due to higher specificity of its test but where volumes are lower because it applies only to a subset of patients testing positive with assay 1.
As a result of the segmentation of this market with little direct competition between segments and, thus far, little competition from DCMs, price drops have been minimal. This may change in the future as more DCMs, notably from China, are expected to enter the market.
EXHIBIT 26: CASE EXAMPLE – RAPID HIV SEROLOGY TESTS
C.5 CONTRIBUTION TO LIVES SAVED / INCREASE IN ACCESS DUE TO SAVINGS GENERATED BY PQ (METRIC 5)
As seen above, by enabling more manufacturers to enter the market and increasing competition, WHO prequalification program has directly contributed to price decreases for various product categories (while acknowledging that PQ operates in broader ecosystem of other Global health stakeholders). As a result, procurers have been able to buy more drugs with the same budget – or reallocate the savings to other purposes – thereby increasing the number of patients that can potentially access the treatment.
The number of additional patients than could benefit from the treatment can be estimated by comparing the freed-up budget realized for each disease area with the average cost of the treatment per patient per year.
The freed-up budget is calculated based on the savings (see section above) generated for each disease area, by applying the ratio of savings vs the total market to the existing donor-spend per disease area and product stream. When estimating the freed-up budget, it is thus assumed that overall donor-spend remains fixed.
The analysis leads to the following results:
a) Medicines
The therapeutic area where PQ had the biggest impact is Malaria, as an additional ~200 million people could potentially get access to the treatment thanks to a freed-up budget of an estimated US$124-145 million, at a treatment cost per patient per year of US$0.6827.
27 Treatment cost based on Global Fund data

External Assessment Report – June 2019
41
Other diseases have also benefited from the price decrease, such as HIV (+3.4-4.6 million potential additional patients) and tuberculosis (+20k potential additional patients). No significant PQ-enabled savings were estimated for reproductive health.
b) Vaccines
About US$337-382 million have been saved and, based on an average cost per patient of US$2.19, more than 150 million additional patients have been or could have been vaccinated28.
c) Diagnostics
About US$3.4-7.7 million have been saved and, based on average cost per patient of US$1.33, between 2.5 and 5.8 million additional patients got access.
Overall, it is estimated that about 400 million additional patients may have obtained access across HIV, Malaria, TB, RH, vaccines and diagnostics thanks to resources freed up by WHO prequalification– and assuming funding is not diverted to other causes.
EXHIBIT 27: DETAILED COSTS SAVINGS REALIZED, BY THERAPEUTIC AREA
C.6 FASTER ACCESS TO PREQUALIFIED PRODUCTS (METRIC 6)
C.6.1 Time to registration by country / NRA under the Collaborative Registration Procedure (Metric 6A)
In LMIC with limited regulatory resources, the registration of medicines, vaccines and diagnostics can take a considerable amount of time. Previous work has shown lead times of up to 2-3 years, delaying access to
28 Assuming an average treatment cost of 2.19 USD (Based on UNICEF price data)

External Assessment Report – June 2019
42
potentially lifesaving treatments. To address this challenge, the WHO launched the Collaborative Registration Procedure (CRP) for FPPs in 2013. Since then, it has been expanded to 34 countries across all WHO regions, who participate on a voluntary basis.29 In 2016, the CRP was extended to vaccines.30 The CRP relies on the collaboration of manufacturers (applicants), NRAs and the WHO reducing duplication by giving NRAs access to applicant dossiers submitted for prequalification (including assessment and inspection outcomes). In turn, participating NRAs commit to reaching their decision within 90 days of receiving access to the assessment and inspection information, as to whether it will register the FPP, and to communicate its decision to WHO and the applicant within a further 30 days.
EXHIBIT 28: COUNTRIES PARTICIPATING IN WHO CRP FOR FPPS / VACCINES
Since its creation, NRAs in LMIC have increasingly relied on the CRP procedure to accelerate their approval procedures for Medicines. NRA registrations of FPPs have increased more than eight-fold from 15 in 2013 to a total of 123 in 2017 (counting single registrations, separate for each country).
While the adoption of the CRP has been a great success, the acceleration of the registration process has not been consistent across the board. Overall there has been a measurable improvement in the median registration times which stood at 1-2 years in Sub-Saharan Africa prior to the inception of CRP, based on data collected by the Bill & Melinda Gates Foundation in 2013.
29 Armenia, Botswana, Burkina Faso, Burundi, Caribbean Community (CARICOM), Cameroon, Côte d'Ivoire, Democratic
Republic of the Congo, Eritrea, Ethiopia, Georgia, Ghana, Kenya, Kyrgyzstan, Lao People's Democratic Republic, Madagascar, Malawi, Mali, Mozambique, Namibia, Nigeria, Pakistan, Philippines, Senegal, Sierra Leone, South Africa, Sri Lanka, Tanzania, Thailand, Uganda, Ukraine, Zambia, Zanzibar, Zimbabwe (WHO website, status August 2018)
30 Eritrea, Ghana, Pakistan, Sri Lanka, Thailand, Uganda, South Africa, Zanzibar, Zimbabwe

External Assessment Report – June 2019
43
EXHIBIT 29: MEDIAN REGISTRATION TIMELINES PRIOR TO INTRODUCTION OF CRP IN 2013
EXHIBIT 30: NRA APPROVAL TIMELINES BEFORE VS AFTER INTRODUCTION OF CRP FOR FPP
However, only about half of the registrations have met the 90-day time limit committed to under the CRP. In 2017, 59 out of 123 CRP registrations took less than 90 days from application to approval, while 41 took more than 120 days.
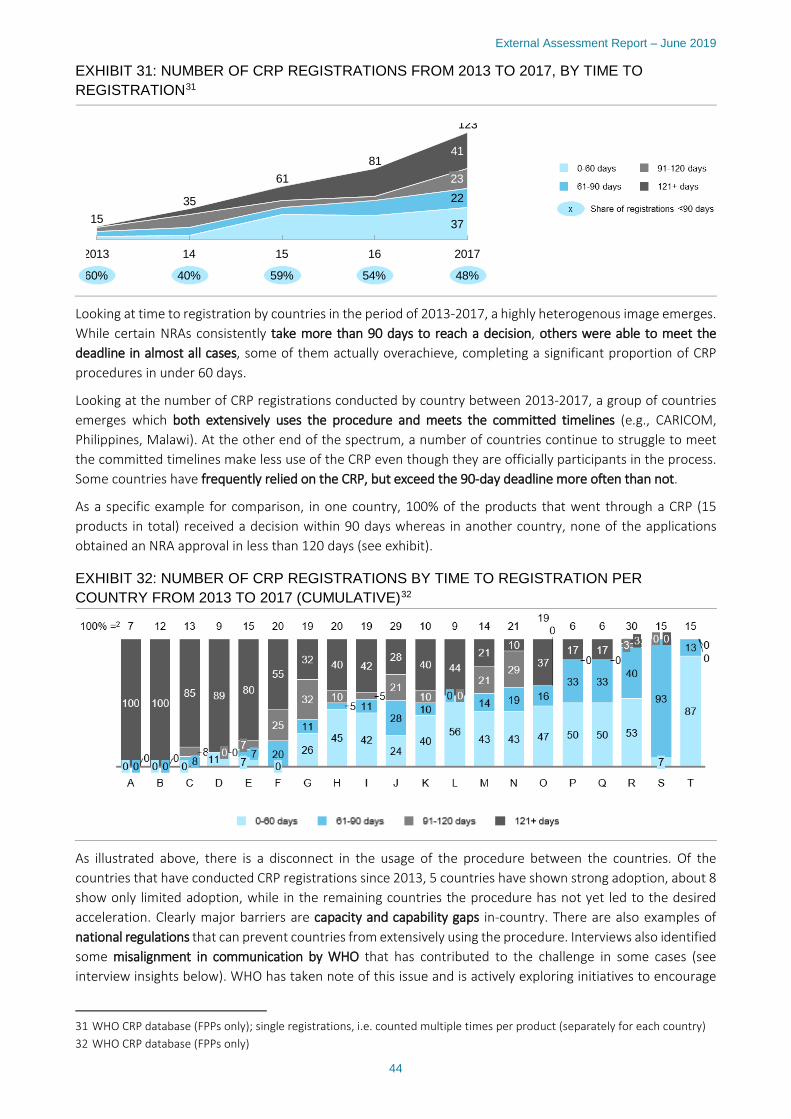
External Assessment Report – June 2019
44
EXHIBIT 31: NUMBER OF CRP REGISTRATIONS FROM 2013 TO 2017, BY TIME TO REGISTRATION31
Looking at time to registration by countries in the period of 2013-2017, a highly heterogenous image emerges. While certain NRAs consistently take more than 90 days to reach a decision, others were able to meet the deadline in almost all cases, some of them actually overachieve, completing a significant proportion of CRP procedures in under 60 days.
Looking at the number of CRP registrations conducted by country between 2013-2017, a group of countries emerges which both extensively uses the procedure and meets the committed timelines (e.g., CARICOM, Philippines, Malawi). At the other end of the spectrum, a number of countries continue to struggle to meet the committed timelines make less use of the CRP even though they are officially participants in the process. Some countries have frequently relied on the CRP, but exceed the 90-day deadline more often than not.
As a specific example for comparison, in one country, 100% of the products that went through a CRP (15 products in total) received a decision within 90 days whereas in another country, none of the applications obtained an NRA approval in less than 120 days (see exhibit).
EXHIBIT 32: NUMBER OF CRP REGISTRATIONS BY TIME TO REGISTRATION PER COUNTRY FROM 2013 TO 2017 (CUMULATIVE)32
As illustrated above, there is a disconnect in the usage of the procedure between the countries. Of the countries that have conducted CRP registrations since 2013, 5 countries have shown strong adoption, about 8 show only limited adoption, while in the remaining countries the procedure has not yet led to the desired acceleration. Clearly major barriers are capacity and capability gaps in-country. There are also examples of national regulations that can prevent countries from extensively using the procedure. Interviews also identified some misalignment in communication by WHO that has contributed to the challenge in some cases (see interview insights below). WHO has taken note of this issue and is actively exploring initiatives to encourage
31 WHO CRP database (FPPs only); single registrations, i.e. counted multiple times per product (separately for each country) 32 WHO CRP database (FPPs only)
37
22
41
2013
35
14
15
123
16
81
2017
23
15
61
60% 40% 59% 54% 48%

External Assessment Report – June 2019
45
greater uptake.
C.6.2 Perception of PQ-enabled acceleration of time to local registration by manufacturers, donors / procurers and NRAs (metric 6B)
a) Overarching themes
On the topic of PQ-enabled acceleration of time to local registration, 3 cross-cutting themes have emerged from interviews with manufacturers, donors/procurers and NRAs: (i) When leveraged optimally by countries, the Collaborative Registration Procedure (CRP) significantly accelerates the registration process, leading to easier and faster launches in LMICs; (ii) the scope of the CRP could be further broadened to step up use in vaccines, include diagnostics and extend to further countries; and (iii) communication about the benefits and optimal use of CRP to NRAs could be improved.
EXHIBIT 33: STAKEHOLDER PERCEPTION ON ACCELERATION OF TIME TO REGISTRATION33
a) Medicines
(i) Accelerated access
Both manufacturers and NRAs mentioned that the accelerated national procedure is a significant advantage of PQ, which is not offered by other organizations such as PEPFAR or USAID.
From the perspective of manufacturers, the CRP allows for more predictability of registration timelines and allows them to reduce workload as the PQ dossier can be leveraged to obtain NRA approval in multiple countries.
From the perspective of NRAs, CRP has helped free up capacity because being able to leverage PQ dossiers, technical assessment results and inspection outcomes which significantly reduces duplication. As a result, NRAs have mentioned that they are able to parallel process more applications and have been able to reduce time to registration by applying abbreviated procedures. At the same time, they also report that PQT capacity building in NRAs linked to the CRP has enabled NRA assessors to ask more targeted questions to applicants. In the experience of NRAs, this has led to an improved quality of dossiers from applicants who have a better idea of what is expected.
33 Only stakeholders that provided scores listed
“Having a faster approval is a huge advantage of WHO. Other organizations like PEPFAR or USAID do not grant such an advantage”
“Prequalification means LMIC don’t have to do full assessment, they can do an abbreviated registration procedure for prequalified products”

External Assessment Report – June 2019
46
(ii) Scope
Several medicines manufacturers as well as donors and procurers have mentioned that the scope of CRP for FPPs should be expanded to include more countries. In particular outside of Africa, the use of CRP is still limited (see exhibit). In addition, some countries who are officially participating in the CRP are found not to apply the procedure, for example by not responding to requests made under the requirements of the CRP.
All stakeholders believe that improved communication about the benefits of the CRP could help address these issues (see below for further details).
(iii) Communication
According to all stakeholders, certain aspects of communication around CRP could be improved by WHO.
The first aspect relates to communication about the added benefits that CRP offers to NRAs in LMIC with constrained resources. Both manufacturers and donors believe that there is currently a need for more awareness in many LMIC about the benefits, and in some cases the existence, of CRP. This could be addressed through increased best-practice sharing by WHO PQT, whereby countries that are successfully using CRP are proactively engaged to advocate for and explain specific benefits to other countries. Improved awareness-building through in-person training and capability-building efforts and/or improved communication through electronic means and the WHO website should help foster participation of more LMIC in the CRP.
The second aspect raised primarily by NRAs is that NRAs, with the support of WHO, could do more to better explain the CRP process to applicants. This would reduce time lost on follow-up queries and further accelerate the process, increase adherence to the 90-day timeline.
b) Vaccines
(i) Accelerated access
Where the CRP for vaccines has been used, feedback from manufacturers and NRAs is moderately positive in terms of its contribution to accelerated NRA approval procedures. However, compared to the CRP for FPPs, more improvement potential has been highlighted.
“Before, we could only access the public assessment reports. Now, with the CRP, we have access to the actual WHO assessment dossiers; that has made the process more useful”
“Dossiers from manufacturer applicants have improved, now that they know assessors look for very specific items”
“CRP works well for us, we usually get approval within 3 months. Except for 2-3 countries who want to apply their own standards and do not reply to requests made under the CRP; if these countries are listed on WHO website as participating in CRP, WHO should make sure they apply the procedure.”
“Most of the countries still do not understand the utility of the CRP […] It has been in place for a couple of years but only a few countries are actively doing it.”
“Most of the countries still do not understand the benefits of the CRP.”
“NRA, in collaboration with WHO, could do more to explain process to applicants, this would speed up the process.”

External Assessment Report – June 2019
47
One aspect that has been noted by vaccine manufacturers is that CRP, as it was originally developed for medicines, did not properly account for specificities of vaccines when it was adapted to cover them. A specific example relates to lifecycle management. Post-approval variations are much less frequent for medicines than they are for vaccines. The current CRP is not seen to offer a very good process for post-approval variations. For some vaccine manufacturers, this has been a major source of frustration and the main reason why they do not rely on CRP.
Furthermore, and going beyond the CRP specifically, vaccine manufacturers have highlighted that some NRAs have begun to set additional requirements on top of PQ, which is a burden for manufacturers and creates duplication in the registration process. In addition, it was noted more than once that certain NRAs have begun to ask for PQ as a blanket requirement even for products that are not on the PQ list – in some cases, this has led to delayed or foregone market access for vaccines (e.g., Cambodia).
(ii) Scope
Even though CRP is also in use for vaccines, it’s use is significantly less widespread across countries and awareness among NRAs and manufacturers is lower than for FPPs based on stakeholder interviews conducted. In the view of vaccine manufacturers, this is partly linked to the fact that the process is not optimally adapted to the specific requirements of vaccines (e.g., relating to post-approval variations; see above). In addition, it is believed that communication about the existence of CRP for vaccines could be improved towards NRAs, in order to foster better participation.
(iii) Communication
The level of awareness about the existence of the CRP for vaccines in low both among manufacturers and NRAs. According to manufacturers as well as donors / procurers, the fact that CRP exists not only for medicines but also for vaccines should be better communicated to NRAs, together with a clear explanation of the added benefits of CRP for resource-constrained NRAs. This can be done through training, conferences and other face-to-face interactions, but also through an improved online communication. As a case in point, it is seen as very easy to find information on the CRP for FPPs on WHO’s website through a simple web search; on the other hand, it is very difficult to find any comprehensive information on the CRP for vaccines.
c) Diagnostics
(i) Accelerated access
Given diagnostics has so far not benefited from a collaborative registration procedure, impact perceived by stakeholders in terms of accelerated NRA approvals has been limited. A key barrier to the establishment of a CRP for diagnostics is that many countries still do not regulate medical devices, including in-vitro diagnostics (IVDs) and as such there is no valid counterpart to collaborate with for the WHO. On the other hand, due to the existence of PQ for diagnostics, there is an increased interest to implement regulation for IVDs going forward.
Nevertheless, some NRAs have highlighted that even without a CRP, time to registration has improved for diagnostics as a result of PQ, based on two factors. First, capability-building measures by PQT have allowed NRA assessors to become more targeted during the preliminary screening of applications, which is reducing churn related to repeated queries between NRAs and applicants. Second, NRAs often use an abbreviated registration procedure for diagnostics that have obtained PQ, which is on average about a third of the time shorter than a full assessment.
Diagnostics manufacturers, similarly to vaccines, have noted the experience that countries are increasingly
“There is no good process for post-approval changes, which are very frequent for vaccines, while much rarer for medicines; we have not used CRP for this reason. If WHO could make sure you could quickly get variations approved, we might find it more useful.”

External Assessment Report – June 2019
48
setting their own requirements in addition to PQ or setting PQ as a blanket requirement for all products in the registration procedure, which leads to a duplication of work. WHO is seen to have role in ensuring that PQ is not pushed outside its intended purpose of enabling supranational supply by countries, otherwise it could end up having an unintended negative impact on access.
(ii) Scope
NRAs and procurers have both expressed a strong desire to explore an expansion of the CRP to diagnostics. An expansion would have to take into account specific requirements of diagnostics rather than applying the process for medicines one-to-one.
However, it must be taken into account that expanding the CRP scope to diagnostics is a complex and lengthy process, as many countries still do not regulate medical devices, including In Vitro Diagnostics (IVDs). In that case, there is no counterpart to collaborate with. As such, the CRP for Dx needs to go hand in hand with the strengthening of regulatory systems for medical devices/IVDs.
(iii) Communication
NRAs have highlighted their experience that many diagnostics manufacturers are not aware of PQ in general and that they receive a lot of applications from manufacturers that are not prequalified. This is seen as due to two main factors. First, as opposed to medicines and vaccines, where the barrier to obtaining an SRA is very high, it is comparably easy to obtain a CE-mark for diagnostics. Since the CE-mark is in most cases accepted by NRAs in the same way as a PQ-label, many manufacturers, including DCMs, currently choose this option instead of PQ. Second, especially in the case of Sub-Saharan Africa, manufacturers benefit from the fact that many African NRAs do not assess diagnostics at all – hence the benefit of PQ is lower than in medicines or vaccines. The low level of awareness about PQ as a result of these two factors means that an even higher degree of communication from WHO about the benefits of PQ is expected by NRAs.
C.6.3 Recommendations
The CRP is recognized as having significantly improved the efficiency of national registration procedures for medicines (e.g., alleviated redundancies, harmonized registration requirements, significantly accelerated approval timelines), which is underpinned by the desire of stakeholders to see an expansion of its application to further countries and diagnostics. At the same time, there is a striking imbalance between countries when it comes to bringing the benefits of the CRP to fruition in terms of accelerated time to approval (some consistently adhere to the 90-day limit, others rarely do). In addition, there is a clear need to adapt the CRP to the requirements of vaccines in order to enable broader usage by vaccine manufacturer. This is seen in the context that the improvement of the PQ process for vaccines was one of the foremost commitments made when the new fee model was put in place. The following recommendations should be considered to address these issues:
■ Improved impact of medicines CRP:
– Proactively ensure that all countries officially participating in the scheme are fully leveraging the CRP through:
□ The creation of transparency around the number of registrations through CRP per country (e.g., visual mapping of time to approval, including a comparison between countries)
"PQ has become a gatekeeper, without PQ you cannot even begin registration process in some LMIC; however, once you start a national registration, NRAs do not really rely on PQ dossier, instead there is a duplicative assessment. A collaborative registration procedure would help improve this issue."
“We think it should be a top priority for WHO PQ to roll out a CRP for IVDs”

External Assessment Report – June 2019
49
□ In-person follow-ups by PQT to identify NRA pain points and elaborate action plan to increase usage
– Launch CRP best practice sharing platform to accelerate the time to approval under CRP in underperforming NRAs by applying the lessons learned from best-in-class NRAs; this can be implemented through a multi-channel approach:
□ Collaborative platform on WHO website to collect best practices and facilitate the exchange of information between NRAs, complemented by direct electronic notifications
□ In-person training and capability building to reinforce the application and implementation of best practice
– Nomination of “CRP ambassadors” from among the best-in-class NRAs to be paired with less successful NRA’s as part of a “buddy system”
■ Tailoring and expansion of vaccines CRP:
– Adapt process to specific requirements of vaccine manufacturers (e.g., easy registration of post approval changes); gather systematic input from vaccine manufacturers on key requirements
– More proactively communicate the existence of the vaccines CRP to NRAs and manufacturers through in-person interaction and by enriching information on vaccines CRP via an easily accessible platform on the WHO website
■ Expansion of CRP scope:
– Expand scope of medicines CRP to further countries by strengthening communication of the benefits of CRP to NRAs in countries where CRP is not in place (e.g., Latin America, Eastern Europe), and distribute simple and clear user-guide to improve transparency of process
– Consider extending CRP scope to include diagnostics
C.7 RAISING OVERALL STANDARDS OF MANUFACTURING (METRIC 7)
C.7.1 Analysis on number of developing country manufacturers with PQ and / or SRA products (metric 7A)
In order to quantitatively assess the impact WHO prequalification has had on DCMs’ ability to raise their manufacturing standards and participate in the procurement market with quality products, an analysis based on their PQ and SRA status can be considered as a proxy.
The two criteria that can be assessed based on available data are whether the PQ program has:
a) allowed manufacturers from LMIC with limited means and experience to enter the donor funded market; and
b) whether it has facilitated SRA approvals.
In order to assess the above two criteria by proxy, the number of manufacturers34 that have at least one prequalified product was evaluated and, among them, the number of manufacturers that managed to get an SRA approval (on the same PQ product).35 This was analyzed separately for medicines, vaccines and diagnostics. Linked to the criteria above, the rationale for the analysis is built on two premises:
a) Manufacturers that have at least one prequalified product but no SRA approval for their product represent the pool of manufacturers that would likely not have been able to access the donor funded market without the existence of PQ, in each product stream. As such, they represent the “PQ-enabled” part of the market,
34 Only considering DCMs from low income and lower middle income countries, according to the World Bank Classification
(i.e. not including China, Russia, etc.). 35 FDA Approval (Rx/Vx) and CE-mark (Dx) taken as a proxy for SRA approval

External Assessment Report – June 2019
50
which thanks to PQ has been able to lift their manufacturing standards enough to be able to meet the quality requirements of the major procurers (who as per their policy require the products they buy to be prequalified (or SRA approved in some cases).36
b) While it is difficult to establish a direct causal relationship, manufacturers that have obtained SRA approvals for the PQ products, in some cases, may have been able to do so thanks to PQ: having a product prequalified in some cases paves the way for manufacturers to obtain an SRA approval, as the dossier submitted and the capabilities acquired to get a product prequalified can be leveraged as a basis to obtain an SRA approval. Beyond that, it can be assumed that some of the products that are both prequalified and SRA approved are likely to have been able to access the donor funded market even without PQ, but the timeline of their SRA approval may have been longer without PQ to back up their applications.
Based on this analysis, the different streams show the following results (as of 2018):
As of 2018, the number of DCMs that have gained access to the donor funded market thanks to PQ is:
■ Medicines: out of 19 DCMs of FPPs and 14 DCMs of APIs, 11 and 6 have gained access to the donor funded market as their products are not SRA approved; 8 each for FPPs and APIs have obtained SRA approval
■ Vaccines: out of 10 DCMs of vaccines, 10 have gained access to the donor funded market as their products are not SRA approved; none have obtained SRA approval
■ Diagnostics: only 1 DCMs has gained access to the donor funded market as their products are not stringently assessed; none have obtained a stringently assessed approval
EXHIBIT 34: DCMS WITH ≥ 1 PQ PRODUCT / SRA APPROVAL
36 For details, see metric 2A above.

External Assessment Report – June 2019
51
C.7.2 Perception of PQ impact on raising manufacturing standards by manufacturers, donors / procurers and NRAs (metric 7B)
EXHIBIT 35: STAKEHOLDER PERCEPTION ON IMPROVEMENTS OF OVERALL MANUFACTURING STANDARDS37
As seen above, PQ is widely recognized to have increased both the quality of the products and the quality of the dossier that is sent by the manufacturers, making it easier for NRAs to both trust the product and accelerate its registration.
However, the impact and benefits of WHO prequalification go beyond the PQ scope as best practices learnt are often shared and replicated for other products. This statement is acknowledged across all streams (medicines, vaccines, diagnostics).
From an NRA and manufacturer perspective, PQ has had a positive impact on non-PQ products in two major ways:
First, it improved the quality of the files received for registration, which facilitates the approval process. Indeed, having a prequalified product allowed the manufacturers (especially those from LMIC) to have access to best practices on how to prepare a dossier (e.g., data points to include, ways to present the data). There were also reports that manufacturers (particularly the small ones) were able to leverage these learnings with other products that may not be prequalified. Thus, PQ is thought to be raising the bar in areas beyond its direct scope.
Second, as plants are improved to comply with the PQ requirements, there is a positive spill over effect as other production lines are used for other products that may not be prequalified are also improved. Applying the same quality standards for all products, in the view of most NRAs, raised the overall quality of the products manufactured, especially for DCMs.
From the perspective of MNC manufacturers, PQ has had little impact on the quality of their products. This can be explained by the fact that a vast majority of their portfolio is SRA approved, with no major difference to PQ standards. For this reason, some MNC manufacturers tend to see PQ as a redundancy as a redundancy, which leads to additional work for the manufacturer rather than an added benefit with respect to quality.
37 Only stakeholders that provided scores listed
“We are sharing resources within the company, so it increased the overall quality of the products that we manufacture […]; over the past few years, we have seen a shift in mentalities and quality now trumps price, regardless of the product considered”

External Assessment Report – June 2019
52
Procurers mentioned that as part of their screening of manufacturers, it is often checked if the manufacturer has PQ products in their portfolio. If it is the case, this is generally seen as a positive indicator for the manufacturer’s overall quality standards across the portfolio. However, there is awareness among donors and procurers that some manufacturers do “game the system” by maintaining alternative production lines with lower standards.
“It does not make any difference for us […]; SRA and PQ have the same kind of requirements, all of our products are manufactured following the same guidelines. We need to fill two separate dossiers and follow two different guidelines […]; but in the end, the standards are quite the same.”

External Assessment Report – June 2019
53
D SYSTEMS-SUPPORTING ACTIVITIES D.1 TECHNOLOGIES STANDARDS AND NORMS (METRIC 8)
D.1.1 Perception of norms and standards by manufacturers, donor / procurers and NRAs
Member States rely on WHO for expertise and guidance in regulation, safety and quality assurance of medicines through development and promotion of international norms, standards, guidelines and nomenclature. The TSN team addresses this demand through its Expert Committees, guideline development, workshops and training courses, and other activities, which are highly appreciated by stakeholders across product streams.
As part of the interviews with manufacturers, donors/procurers and NRAs on the topic of norms and standards, two major themes have emerged: (i) while the quality of WHO standards and guidelines is widely appreciated, implementation could be further enhanced; and (ii) more tailored guidelines would be expected by all stakeholders, especially for vaccines and diagnostics.
EXHIBIT 36: STAKEHOLDER PERCEPTION ON TECHNOLOGIES STANDARDS AND NORMS38
a) Overarching themes
On top of all themes related to guidelines, manufacturers would like to see more opportunities to give feedback on draft guidelines and get a better understanding on why some feedback is not implemented.
(i) Ease of implementing norms / calibration of the requirements
It is widely acknowledged among both NRAs and manufacturers that WHO’s TSN work has been pivotal. From the perspective of NRAs, interviews revealed that they actively follow standards and guidelines published by the WHO and generally aim to quickly translate them into national regulation. For DCMs in particular, there is high reliance on and appreciation for the WHO guidelines and the support provided by the TSN team as it is challenging for them to directly follow national rules and guidelines.
At the same time, MNC manufacturers observed that while the quality of the guidelines is high, the WHO TSN team could do more to encourage implementation at the national level, which they regard as critical if they are to have any impact. In the observation of these manufacturers, the number of workshops being held to present the updated norms and standards has decreased over the past few years. As a result, their proper implementation has been delayed or carried out sub-optimally in some countries.
38 Only stakeholders that provided scores listed
“Implementation of new WHO guidance is critical. Technical norms & standards do not have any impact if not implemented at the national level.”

External Assessment Report – June 2019
54
As a result, they recommend that any WHO guideline, especially if not accompanied by an implementation workshop, should at minimum be accompanied by a Q&A annex tackling implementation issues and providing implementation recommendations. In addition, stakeholders also mentioned that it was important for guidelines to be associated to implementation KPIs which could be monitored by WHO to allow it to measure its impact. Explicit consideration of driving and measuring implementation should be included from the planning stage for a new guideline.
Furthermore, despite acknowledging that the new WHO website is more user friendly, manufacturers (especially smaller ones with limited resources) complained that WHO does not ‘track changes’ when updating and communicating the guidelines. They also criticized that outdated guidelines are still on the website and not marked as inactive. As a result of the current information setup, some guidelines are not implemented due to inability to systematically review entire documents to identify updates or to identify active vs expired norms.
Better curation of guidelines on the website, whereby only active guidelines were displayed would provide greater clarity, while expired guidelines could be transferred into a publicly accessible online archive for reference. A note clarifying what has changed from any previous guideline could also be included in the recommended Q&A annex mentioned above.
(ii) Tailoring of norms
From the point of view of NRAs, WHO should further collaborate with them to better tailor the norms to the specific constraints of their countries. Even though WHO strives to develop TSN guidelines in consultation with NRAs and generally makes them available for feedback through the website, meetings or workshops, a number of NRAs have expressed that they would like to have more opportunity to share their feedback with WHO’s TSN team and see them implemented in the published norms.
From the points of view of the vaccines and diagnostics manufacturers, WHO should further tailor the guidelines to the specific requirements of diagnostics and vaccines, as they are currently perceived as too medicines focused (see details below).
From the perspective of the donors and procurers, the norms should be further tailored to the environmental and epidemiological (prevalence of diseases) context of the countries in which these norms are to be implemented. One of the potential root causes brought up in the interviews as contributing to this, aside from the inherent constraint of resources, is the composition of the Expert Committees in terms of experience and skillsets. These experts, however, are nominated and made available by regulatory authorities, i.e., potentially associated with the perception of imbalance.
“In recent years, the number of implementation workshops carried out by WHO has decreased. This decrease has been unfortunate as implementation workshops for new guidelines provide an opportunity for NRAs to meet with WHO to bolster understanding and discuss potential challenges & bottlenecks regarding implementation of new guidance”
“WHO issued a guideline on variation applications for vaccines back in 2015 that was not implemented locally; we ran an internal survey to ask the countries if they had implemented the guideline and the results were surprisingly low; WHO guidelines are good, but implementation is far from great”
“We do not have time to read the very long guidelines that WHO publishes and to compare them with the older ones to see what has changed; it would be helpful if they could just indicate the changes”
“We often receive requests for input into development of technical norms and standards very late, too late to give input.”

External Assessment Report – June 2019
55
It is evident that extensive efforts and rules are in place to ensure the balance in these committees, so thoughtful review is needed to understand where this perception is arising from. It may be simply a case of publicizing the efforts made to ensure balance, or it may be that in the interest of time there are urgent cases where a full committee cannot be convened.
D.1.2 Recommendations
Interviews with the various stakeholders have shown that the quality of WHO standards and guidelines is widely appreciated. Efforts by WHO teams to establish global norms and standards have actively supported an overall increase of the manufacturing standards and quality of the products available on the market.
Moving forward, the level of implementation by NRAs and manufacturers could be improved. In order to address these issues, the following recommendations are made:
■ Communication: improve the accessibility, user-friendliness and transparency of the database on WHO website by:
– Only displaying active guidelines that are in-force, while transferring expired guidelines into a publicly accessible online archive for reference
– Highlighting updated sections of a guideline, so that manufacturers who already complied with the previous guideline can focus their attention on the updates
■ Implementation: increase the implementation rate of guidelines by NRAs and manufacturers by:
– Conducting introductory workshops for NRAs and manufacturers and providing a Q&A annex that addresses implementation issues and key changes vs the previous guidance and provides recommendations, together with any newly published guideline
– Increasing the frequency and regularity of trainings, especially for DCMs
– Making implementation a key component of guideline development, right from the planning stage; consideration should be given throughout the guideline development process to how implementation will be supported and measured (including creating and systematically monitoring KPIs related to the implementation rate of the norms and standards)
D.2 REGULATORY SYSTEMS STRENGTHENING (METRIC 9)
D.2.1 Impact of activities on Regulatory Systems Strengthening (metric 9A)
Over the past decades, the Regulatory Systems Strengthening (RSS) team has worked with the PQ (Rx/Vx/Dx/Inspection), the TSN and the SAV teams towards a common goal: building NRAs’ capability to raise their standards and create autonomous capable entities that can be recognized as functional NRAs.
The capability-building measures and training offered to NRA staff, including regulators and assessors, play a key role in building NRA capabilities. WHO efforts are targeted at organizing and facilitating rotational programs (for both assessors and regulators), global and regional trainings, as well as continuous support.
In order to meet this goal and build in-country capabilities, the RSS team has trained a significant number of regulators (more than 8000) from all over the world, between 1997 and 2017. Focal points have been trained relatively evenly across regions (lowest being the Americas Region with 12% of total people trained and highest being Western Pacific Region with 22% of total people trained39).
There is a positive correlation between number of trainings offered and the global number of functional NRAs. Indeed, in two decades, the number of functional NRA (based on vaccines standards only) has increased by almost 70%, from 36 in 1997 to 61 in 2017.
39 Excluding trainings provided by Regions

External Assessment Report – June 2019
56
However, the distribution of that increase is not homogeneous across. While certain regions have witnessed a significant increase, others have clearly proven more challenging (or started from a lower base). For example, in the African Region number of functional NRAs has not significantly increased in 20 years, from none in 1997 to 2 in 2017 (less than 4% of the countries in that region). However, it must be acknowledged that building an agency from one maturity level to the other is a long fought-battle and ongoing progress may not be fully reflected in those figures.
On the contrary, the number of functional NRAs has significantly increased in the South-East Asia Region, where 64% of the countries had a functional NRA in 2017 (from 9% in 1997) – which is the same level as the European Region.
EXHIBIT 37: WHO TRAINED MORE THAN 8000 NRA STAFF WORLDWIDE, CONTRIBUTING TO 70% INCREASE OF FUNCTIONAL NRA AT GLOBAL LEVEL40
On top of the training provided by the RSS team, the PQ teams for medicines, vaccines and diagnostics also contribute to the reinforcement and capability building of local NRAs through different training options specific to their product stream.
(i) Medicines team
Since 2001, a total of 1983 assessors coming from 36 countries have attended at least one prequalification medicines assessment session in Copenhagen, Denmark (43% coming from LMIC, e.g., Uganda, Tanzania, Ghana, Zimbabwe, Kenya).
In addition to the prequalification medicines assessment sessions, WHO PQ Rx team is also organizing 3-month rotational programs, during which an assessor from a given country visits WHO HQ for ~90 days. As of 2015, 37 assessors coming from 15 countries had benefited from that program. The program opened up to inspectors in 2014 and to vaccines assessors in 2015.
40 Data provided by WHO RSS team

External Assessment Report – June 2019
57
(ii) Vaccines team
Similar to what is offered for medicines, the Vx PQ team is also organizing 3-month rotational programs at WHO HQ on top of other systems-supporting activities held by the team. As of 2017, 5 countries had benefited from a 3-month rotational program (Nigeria, Tanzania, Zambia, Saudi Arabia, India). Systems-supporting activities (e.g., three sessions of reviews of dossiers per year, post PQ activities) have been offered to more than 50 assessors from NRAs coming from both LMIC and HIC.
(iii) Diagnostics team
69 Regulators / Inspectors were also trained by the PQ Dx team as of 2017. The endpoint of the training is to discuss new guidelines put in place by WHO and to assess their implementation in the country.
In addition to the support provided by both the RSS and the PQ teams to regulators, PQT Inspections organizes 4 types of capacity building activities to support local NRAs inspectors.
■ Training of local in-country NRA inspectors: Local NRA, invited by WHO, send inspectors as observers to attend local inspections (273 as of 2017, see exhibit below)
■ Participation of NRA inspectors in WHO inspections as observer inspectors: NRAs invited to nominate inspectors to participate (27 as of 2017, see exhibit below)
■ Rotational programs: NRA inspectors spend 3-4 months at WHO HQ as rotational inspectors (8 as of 2017 had completed the program – 5 of them completed the program in 2018, see exhibit)
■ Invitation of ex-rotational NRA inspectors as co-inspector: NRA inspectors also get the opportunity to further strengthen their training with WHO (14 as of 2017, 4 in 2018, see exhibit)
EXHIBIT 38: 4 TYPES OF CAPACITY-BUILDING ACTIVITIES ARE HELD TO SUPPORT LOCAL NRAS BY THE WHO INSPECTIONS TEAM
In addition to these training programs, PQT Inspections organizes training and workshop seminars including:
“During their rotation, the rotational fellows participated in a wide range of prequalification activities and were provided with a complete set of the WHO norms and standards that underpin prequalification.” PQ Rx team

External Assessment Report – June 2019
58
Data integrity trainings (South Africa and Switzerland), joint workshops (e.g. Brazilian Ministry of Health, PAHO and UNFPA workshop), BE training for Ethiopia in 2015 on inspection of a clinical trial site.
D.2.2 Perception of utility of Global Benchmarking Tool by donor / procurers and NRAs (metric 9B)
In 2013, the WHO launched the Global Benchmarking Tool (GBT), a powerful tool which aims to evaluate countries’ regulatory systems through systematic benchmarking, classifying countries into four categories.
EXHIBIT 39: WHO GBT PERFORMANCE MATURITY LEVELS
The methodology includes:
■ NRA identification of strength and area for improvements
■ Formulation of an Institution Development Plan (IDP) built on strengths identified to address gaps
■ Aid in the prioritization of IDP interventions
■ Monitoring of progress and achievements.
As of July 2018, the GBT only “addresses regulation of medicines and vaccines. Future revisions are expected to address blood products including whole blood, blood components and plasma-derived medicinal products; and medical devices including diagnostics.” 41
Only insights provided by stakeholders who have had direct exposure to the GBT are provided below.
There is a growing appetite from NRAs to use the tool, as they see it as an opportunity to benchmark their own system, specifically addressing their gaps and finding support to fill them.
41 WHO Global Benchmarking Tool (GBT) for evaluation of national Regulatory Systems:
http://www.who.int/medicines/regulation/benchmarking_tool/en/

External Assessment Report – June 2019
59
However, two issues were raised in particular:
(i) Transparency of the ranking
Both NRAs and donors/procurers noted desire to have increased transparency around the criteria and their weighting to classify countries into maturity levels and to move from one level to the next. NRAs would like to see a fully transparent report on criteria and scores attributed that were used to rank them as well as specific guidance on what is needed to progress to the next level.
Despite WHO continuous efforts, it needs to be kept in mind that increasing transparency is a complex process as some NRAs do not want their ranking to be disclosed.
(ii) Control of quality and usage
Donors/procurers have noted that WHO RSS should better control usage and modifications of the GBT. They highlighted that the current need for user governance and IP protection leads to replications whose purpose and accuracy may not always be aligned with WHO’s requirements. In order to avoid misinformation about the tool and sub-optimal applications of modified versions by other actors, it was proposed that the RSS team establish user governance rules and consider obtaining IP protection.
D.2.3 Perception of value add of RSS activities by manufacturers, donor / procurers and NRAs
EXHIBIT 40: STAKEHOLDER PERCEPTION ON VALUE-ADD OF RSS ACTIVITIES42
As part of the stakeholder interviews conducted, NRAs and donors/ procurers were asked about the value-add of WHO’s RSS activities.
Across all product streams, with no major difference highlighted between medicines, vaccines and diagnostic, two themes were highlighted.
(i) Valuable RSS training which could be further strengthened with more regional/country tailoring
42 Only stakeholders that provided scores listed
“We have not really expected the GBT, so it was a bonus. It highlights the areas where we need to fill the gaps. However, we have not seen the result yet.”
“We have questions regarding the transparency of the ranking. We do not know what the exact thresholds and criteria are to go from level 1 to 2, 3 or 4; WHO should make it crystal clear for the countries on how to accurately assess their potential to be upgraded.”
“WHO has no control over the tool; they should establish user governance rules and put some IP around it; at the moment it can be downloaded and modified by anyone”

External Assessment Report – June 2019
60
The training offered by the WHO teams (RSS and PQ Rx/Vx/Dx/Inspection teams) are unanimously praised by the different stakeholders, who are complimentary about their quality. It was noted that the impact of the training offered often went beyond the training itself, as trained NRA personnel leverage their new skills to build capabilities of their colleagues, thereby supporting a long-term improvement of the registration system and processes.
Beyond that, RSS support on regulatory harmonization has allowed the different NRAs to communicate with each other and led to the initiation of work-sharing initiatives among NRAs in LMIC (e.g., SADC/ZAZIBONA, ECOWAS, IGAD, SEARN, EAC). NRAs participating in these work-sharing schemes expressed that WHO RSS support and oversight is seen as a critical component to assure the ongoing success and development of their initiative.
However, from the perspective of some NRAs, the training is not tailored enough to their specific needs, either within one region (i.e., needs and requirements from different countries within one region are not the exactly the same) or across several regions (e.g., trainings seen as too Africa-focused by NRAs interviewed from outside Africa).
(ii) Opportunity for RSS through decentralization of PQ activities
Despite the quality of the trainings and the support offered by WHO, some NRAs proposed exploring a decentralization of parts of the PQ process, whereby some of the assessment steps could be conducted in regional centres of excellence. It is felt by NRAs that this would strengthen their regulatory system capabilities, reduce demand/burden on the HQ team and at the same time help WHO tailor their work more to the region/country need going forward.
D.2.4 Recommendations
The training on RSS offered by the different WHO teams (RSS, PQ teams and Inspections team) is highly appreciated by the different stakeholders, who are complimentary about their quality. However, there is a desire for a support that is more tailored to the specific needs of different regions and countries. There is a growing appetite by NRAs to use the GBT, although the level of understanding of its functionality and assessment criteria is still relatively low given its recent introduction. In addition, some concerns have been raised about the need of user governance regarding the GBT. These issues could be addressed with the following measures:
■ Collaboration and communication across teams: increase the collaboration across the different teams involved in activities related to regulatory systems strengthening (RSS team, PQ Rx/Vx/Dx teams, inspections team) through regular workshops/meetings and exchange of knowledge and information. A
“The quality of WHO trainings is excellent, our assessors come back from Copenhagen all “fired up” with new knowledge, new ways of doing things”
“The work-sharing cooperation we have with our neighbouring countries was initiated with the support of WHO RSS, since then hundreds of registrations have been processed through the system”
“Insights & training materials that are more country-specific would be good instead of aggregate information used across regions”
“PQ could empower trained assessors to set up regional centres / clusters to do PQ in regions, to decentralize the process while providing oversight. This would allow the PQ process to scale while managing resources. It would also strengthen regions”

External Assessment Report – June 2019
61
wide range of training activities are being offered and there may be opportunities to coordinate the offering more into a package that is more coherent from a country perspective
■ Tailoring of training activities: hold regional roundtables for NRAs to share local pain points and unmet needs; leverage insights to draft more tailored training materials and content
■ Usage control of GBT:
– Establish clear user governance rules for GBT (e.g., conditions for use of methodology and modifications of content) and obtain consent from stakeholders relying on the tool or its methodology
– Provide tool and methodology with intellectual property protection (e.g., copyrights); enforce proprietary usage by following up with other stakeholders using or modifying GBT without WHO consent
■ Communication: raise awareness of the GBT and proactively communicate its functionality and usage by:
– Continuing efforts to promote the usage of the GBT by NRAs by sharing its benefits and functionality during training activities and regional NRA roundtables (see above)
– Promoting transparency around the tool set up and maturity level scores design (e.g., ranking criteria and weighting) and raising awareness of existing tools such as detailed user guide / instruction manual, which should be easily accessible on the WHO website
D.3 SAFETY & VIGILANCE (METRIC 10)
D.3.1 Impact of SAV activities on an effective post-market surveillance system (metric 10A)
The SAV team has set itself the goal of promoting the global safety of medical products by coordinating global networks for information sharing, such as data bases and monitoring and alert systems, and by supporting countries to develop national capacities for the post-marketing surveillance of health products. This goal is articulated around three major axes:
‒ Protect the public from untoward effects of health products
‒ Protect the program and therefore public health from poor science, rumours and other allegations
‒ Strengthen country capacity
through close coordination with the different programs streams (e.g., vaccines) at headquarter and in regions with support from an independent expert committee and a flexible network.
Activities conducted under this umbrella encompass the monitoring of and response to substandard and falsified medical products, Individual Case Safety Reports (ICSR) for medicines, Adverse Events following Immunization (AEFI) for vaccines, and complaints including adverse events reported for diagnostics.
For each of these categories, RHT SAV groups have conducted trainings and other capability building measures. Since the inception of these activities, there has been an increase in the number of events reported, which can be largely attributed to an increase in awareness on the importance of post market surveillance. Training activities to strengthen local NRAs and develop national capacities for the post-market surveillance of health products are playing a key role in further bolstering awareness level of the countries. By leveraging its international footprint and network of experts, WHO is a central player in providing these training activities and a lot of NRAs exclusively rely on WHO to build their capabilities.
The following subchapters use historical data on training and adverse event reporting to quantitatively assess correlation between WHO’s SAV activities and the effectiveness of the post-marketing surveillance system in different regions, for the above-mentioned categories.
a) Substandard and falsified products

External Assessment Report – June 2019
62
See below definition of Substandard and Falsified Products, as per highlighted on the WHO website43:
Substandard refers to products that are “out of specification”, i.e. authorized medical products that fail to meet either the quality standards or specifications, or both.
Unregistered / Unlicensed refers to medical products that have not undergone evaluation and/or approval by the National or Regional Regulatory Authority (NRRA) for the market in which they are marketed/distributed or used, subject to permitted conditions under national or regional regulation and legislation.
Falsified refers to medical products that deliberately/ fraudulently misrepresent their identity, composition or source.
From 2012 to 201644, about 320 regulators that had been appointed by NRAs as focal points for substandard and falsified medical products have been trained by WHO staff. In the same period, the number of products45 reported to the WHO Surveillance and Monitoring System Database (SMSD) increased from 84 in 2012 to 195 in 2017, all regions considered. A positive correlation can be highlighted between the number of trainings offered and the number of reports recorded in the database, as shown in the exhibit below.
Among the regions who reported, Africa accounts for more than a third of the total incidents reported (37%), closely followed by the European and American regions (25% and 22% respectively).
Of course, the increase cannot be solely attributed to training, especially in regions where there is a strong existent quality surveillance network (esp. Americas and European regions)46.
EXHIBIT 41: CUMULATIVE NUMBER OF FOCAL POINTS TRAINED AND OF PRODUCTS REPORTED47 TO THE WHO SURVEILLANCE AND MONITORING SYSTEM DATABASE
43 http://www.who.int/medicines/regulation/ssffc/definitions/en/ 44 Missing data from 2017 to 2018 45 A “product” refers to a particular medicine, vaccine or diagnostic kit 46 WHO Global Surveillance and Monitoring System for Substandard and Falsified Medical Products, 2017 report 47 Not necessarily leading to adverse events

External Assessment Report – June 2019
63
b) Medicines
Over the past two decades, the number of Individual Case Safety Reports48 (ICSR) for medicines has significantly increased (up to 25% p.a. in 2000-2017 for some regions49), in parallel with the number of trainings that have been offered.
Since about 2000, WHO has been offering both annual meetings for a global audience with host regions rotating in irregular sequence, and region-specific trainings taking place once in every 1-2 years.
As seen in detail below for the different WHO regions, a positive correlation can be observed in almost all regions between trainings offered and number of ICSRs recorded on VigiBase, the WHO global ICSR database. Due to the limited number of training sessions conducted and the unclear influence of competing external factors and systemic trends influencing reporting rates, the rise in reporting rates cannot be fully attributed to WHO’s SAV activities in all cases. However, spikes in reporting rates immediately following major training activities in given regions, especially in Africa, South-East Asia, and the Western Pacific region do point to a positive effect of WHO’s activities in the past. As a guidance for the future, they also highlight the necessity for the WHO to keep offering high-quality capability building measures and trainings at regular intervals across different regions.
(i) African region (AFRO)
Africa is the region that benefitted from the highest number of region-specific trainings, with four of them held between 2007 and 2016:
■ 2007: Introduction of annual pharmacovigilance
■ 2007: Introduction of active surveillance (Malaria)
■ 2008: Network of PV consultants for Africa
■ 2016: Tools and trainings to improve quality of reports
The number of ICSRs submitted in that region has significantly increased: +14% p.a. on average since 2000. This number is even higher if taken between 2007 (first regional training) and 2017, reaching +32% p.a., suggesting that the SAV training activities may have positively impacted ICSR reporting rates.
This being said, despite continuous efforts from WHO, Africa remains the region with the lowest ISCRs reporting rate worldwide, with only 2 reports / 100,000 population of countries reporting at least one case (compared to about 110 in the Americas region).
(ii) Eastern Mediterranean Region (EMRO)
One region-specific training was held for the Eastern European region in 2015 under the slogan “Regional meeting on strengthening PV system”. Since 2000, the region has experienced an increase in ISCR of 17% p.a., with a spike between 2010 and 2014, just after it hosted the 2009 annual global meeting.
However, the number of reports is still low when compared to other regions, with only 4 reports / 100,000 population of countries reporting at least one case.
(iii) European Region (EURO)
Two region-specific trainings were held in the European region:
■ 2010: Active Surveillance of HIV medicines
■ 2012: WHO guideline on Patient reporting
An increase of 12% p.a. since 2000 in the number of ICSRs reported has been observed, especially from 2008 onwards. The number of ICSRs is one of the highest in the world, with about 50 reports / 100,000 population
48 Refers to adverse events, safety related as opposed to substandard or falsified 49 Based on VigiBase (WHO global database of ICSR)

External Assessment Report – June 2019
64
per country reporting at least one case.
(iv) Americas Region (AMRO)
The Americas Region is the region with the highest number of ICSRs reported, with about 110 reports / 100,000 population. As a reference and despite WHO efforts, Africa, Eastern Mediterranean and South-East Asia Region have less than 10 reports / 100,000 population of reporting countries.
Despite the fact that the number of ICSRs reported saw only a slight increase overall since 2000 at +3% p.a., there is a visible correlation between the reporting rate and the two global and one region-specific trainings which were held in the region since 2006: while the reporting rate plummeted in 2000-2006, there was a marked increase following the trainings in 2007-2016.
(v) South-East Asian Region (SEARO)
Two trainings were held in the region:
■ 2010: PV training course for ASEAN countries
■ 2015: PV workshop (active monitoring) in Malaysia
Coinciding with this, there was a significant increase (+25% p.a. since 2000) in the number of ICSRs reported, especially starting from 2010 onwards. Before that data, almost no ICSRs were reported in the WHO database.
As a result of this increase, about 7 reports / 100,000 population of reporting countries were received in 2017.
(vi) Western Pacific Region (WPRO)
Western Pacific region is the region that has seen the steepest increase following trainings offered. Aside from two global meetings hosted in 2000 and 2014, two trainings them were specifically offered for that region:
■ 2015: PV inspection course in China
■ 2015: PV inspection course in Malaysia
Indeed, the reporting system was almost non-existent before 2012 and steadily increased to reach about 30 reports / 100,000 population in 2017. Part of this trend may be due to the rapid maturation of the Chinese monitoring system over the past decade.
EXHIBIT 42: NUMBER OF ICSR SUBMITTED / 100,000 POPULATION OF COUNTRIES REPORTING AT LEAST 1 CASE
In addition to the trainings offered, WHO also implemented parallel SAV measures to further facilitate the pharmacovigilance process, especially for LMIC.

External Assessment Report – June 2019
65
Vigiflow (2008): Vigiflow is a low-cost data management solution of international (ICH) standard offered by WHO. It allows LMIC countries to manage their data and easily submit reports to the WHO global database.
WHO-Global Fund decision to include Min PV in GF grants (2010): a list of minimum requirements needed to develop a functional PV system that is provided to Member States, to help set up PV systems (through the grants that they received from Global Fund). The list was set up in collaboration with the Global Fund.
IsoP PV curriculum (2011): WHO worked in collaboration with the International Society of Pharmacovigilance to develop an extensive Pharmacovigilance curriculum, which can be used to tailor PV training to different post graduate healthcare professionals working in PV. The curriculum is posted on the ISOP website, and various material has been added to different components of the curriculum.
c) Vaccines
Over the past decade, the number of countries reporting at least 10 Adverse Events Following Immunization (AEFI) reports per 100,000 surviving infants has significantly increased, from 77 in 2010 to 114 in 2017.50
This trend is reflected globally, as local NRAs strengthen their safety monitoring systems through different capability building activities like knowledge sharing platforms or trainings. WHO has played a key role in trainings for local NRA by holding regional workshops organized by both the WHO HQ51 and the WHO regional teams.
As seen in detail for the different WHO regions below, there is a correlation between the number of workshops held by the WHO to strengthen reporting and the rate of increase in countries with a basic vaccine safety monitoring system in place. In Africa, which hosted 10 workshops (29 countries participating), South-East Asia, which also hosted 10 workshops (13 countries participating), and the Western Pacific region, which hosted 9 workshops (13 countries participating), the rate of increase in 2010-2017 was consistently higher than for the other regions, which benefitted from less trainings. Notably, in region where no trainings were offered (e.g., the Americas), the number of countries reporting has remained stable. While these trends cannot be fully attributed to the WHO’s SAV activities given competing external factors, they do highlight a positive effect of the capability-building measures, which contribute to building awareness on the importance of a robust safety and monitoring system for vaccines in the regions.
[Note: all the workshops referred below were offered by the WHO HQ team. No consolidated data of the number of workshops held by regional teams were retrievable.]
(i) AFRO
Africa is the region where the largest number of workshops were held. In total, 10 workshops organized by WHO have been offered between 2012 and 2017. During that period, the number of countries reporting AEFI tripled, from 7 in 2012 to 21 in 2017, representing almost half of the countries in the African region (45%).
(ii) EMRO
In the region, three workshops were held between 2014 and 2015. One can observe a steady increase in the number of countries reporting AEFI – from 8 in 2010 to 12 in 2017, representing about 60% of the eastern Mediterranean region countries.
(iii) EURO
In 2017, almost three quarter of the European countries reported AEFI reports, down from 60% in 2010. In that region, 5 workshops were held between 2015 and 2017 by WHO HQ.
(iv) AMRO
No workshop was held in the American region and there was no difference in the number of countries that
50 WHO UNICEF Joint Reporting Form mechanism 51 On average, between 1 and 5 countries were represented during the training

External Assessment Report – June 2019
66
reported AEFI reports, between 2010 and 2017 (steady rate of 57% of the countries reporting).
(v) SEARO
South East Asia is the region were the highest proportion of countries report AEFI, more than 80% of them reporting in 2017. Eight workshops were held in South East Asia between 2012 and 2017 and an increase of 12% p.a. in the number of countries reporting was observed.
(vi) WPRO
The number of countries reporting AEFI doubled in the last 7 years, from 6 to 12, representing almost half of the countries in that region. In total, 9 workshops were held between 2010 and 2017.
EXHIBIT 43: NUMBER OF COUNTRIES REPORTING ≥ 10 CASES / 100,000 SURVIVING INFANTS TO WHO, PER REGION
d) Diagnostics
Four SAV trainings have been offered so far by WHO to further strengthen the local NRA diagnostic safety and vigilance activities.52 The first of them was held in 2016, hence an accurate correlation between the number of adverse events reported and the number of trainings offered is challenging. However, since the beginning of the training program, there is a clear tendency towards an increase of adverse IVD events reported: from 0 in 2014 (before the start of the training program) to 27 in 2017, globally.
The highest number of cases reported are issued from regions that benefited from the trainings (African and European region).
The trainings offered, as well as the country participation, is listed below:
■ 2016: Training for 9 Anglophone African countries: Burundi, Ethiopia, Kenya, Nigeria, Rwanda, Tanzania, Uganda, Zambia, Zimbabwe
■ 2016: African PMS session (>20 countries)53 ■ 2017: Training for 11 Francophone African countries: Benin, Burundi, Burkina Faso, Cameroon, Chad,
Gabon, Guinea, Mali, Rwanda, Senegal, Togo
■ 2018: Training for 11 Russo-phone European countries: Armenia, Azerbaijan, Belarus, Georgia, Kazakhstan, Kyrgyzstan, Moldova, Russia, Tajikistan, Turkmenistan, Ukraine
52 According to WHO RHT 53 Special session held at the African Society for Laboratory Medicine

External Assessment Report – June 2019
67
EXHIBIT 44: NUMBER OF ADVERSE IVD EVENTS REPORTED
D.3.2 Perception of utility of SAV activity by manufacturers, donor / procurers and NRAs (metric 10B)
On the topic of surveillance and vigilance, two major themes have emerged based on interviews conducted with manufacturers, donors/procurers and NRAs: (i) While WHO’s pioneering work in setting up a basic safety and monitoring system is appreciated by all stakeholders, WHO is expected to take a more active role in promoting post market surveillance going forward; and (ii) WHO’s communication on adverse events and awareness building around the importance of post-market surveillance could be further improved.
EXHIBIT 45: STAKEHOLDER PERCEPTION ON POST MARKET SURVEILLANCE54
a) Overarching themes
(i) WHO support on SAV activities
Across all streams and all stakeholders, stakeholders appreciate WHO’s pioneering role in setting up a basic safety and monitoring system for medicines (through the Uppsala Monitoring Centre and VigiBase), vaccines, diagnostics and the effect it has had in LMICs. The WHO is also credited with bringing attention to the big challenge of substandard & falsified products in LMIC through the establishment of the WHO Global Surveillance and Monitoring system in 2013. Across streams, stakeholders see WHO’s trainings and other capability-building measures as having a positive effect by creating awareness about the importance of post-market monitoring in LMICs.
As the only organization with a truly global purview covering not just the industrialized world, but also and especially low resource countries, the WHO is in fact seen as the grail keeper of the global safety and vigilance system. At the same time, stakeholders appreciate that the ultimate responsibility for post-market surveillance and vigilance lies with the countries.
However, WHO’s central role in SAV is increasingly leading to expectations that it takes a more proactive role
54 Only stakeholders that provided scores listed

External Assessment Report – June 2019
68
in promoting not just a passive post-market surveillance system relying on spontaneous reporting, but a more robust, active system with systematic reporting. Manufacturers have highlighted that as a result of pool procurement of medicines and vaccines for multiple LMICs, it is difficult for them to run their own monitoring and response system at the country level – instead they look to WHO and the procurers for support.
According to both donors and manufacturers, this requires two things: (a) that the WHO teams engaged in SAV activities work more cross-functionally across medicines, vaccines and diagnostics and devote more attention to proactive monitoring and rapid response; and (b) that trainings on post-market surveillance are conducted more frequently and regularly in order to build sustained awareness and capabilities at the country-level. One way proposed for LMICs to achieve more robust post-market surveillance capabilities despite limited resources is the sharing of resources through collaborations across countries.
The trainings currently offered are praised for their quality by all stakeholders from all streams and are seen as essential for LMICs to strengthen their own post market surveillance systems. However, their frequency as well as the scope of the people invited is questioned.
From the NRAs’ point of views, these trainings should:
■ Include both regulatory and healthcare professionals (HCP), to foster a systematic reporting system at the HCP level and catalyse the level of awareness in the country
■ Be held on a regular basis (more than twice a year): given NRA employee turnover is high in some LMIC countries, offering trainings on a regular basis is critical to ensuring continuous monitoring and adverse event reporting
(ii) Communication
Moreover, both manufacturers and donors have mentioned that WHO’s communication with regard to adverse events could be more timely and transparent. While it has been mentioned that responses to adverse events can take up to a year, partly due to the fact that the relevant teams for medicines and vaccines at the WHO only meet about once or twice a year, rapid response is important in particular to manufacturers, who want to react with timely measures to prevent a detrimental impact on patient health and product reputation.
b) Medicines
(i) WHO support on SAV activities
Medicines is where the need for post market surveillance was highlighted the most across stakeholders:
“We would like WHO to more proactively inform on adverse events; we do not have people present in those markets, so it is difficult for us to get the info and modify the product if needed”
“The NRAs need to manage post market surveillance, but they need more guidance from WHO; the issue is even bigger when there is no NRA in the country.”
“There is an urgent need to have an active pharmacovigilance, with WHO actively monitoring safety, rather than conducting observational studies.”
“WHO needs to invest more in trainings to create more awareness about the importance of post-market monitoring”
“Reporting rates are low in our country because there is no awareness of physicians and nurses about the importance of proactively collecting reports; WHO should train HCP’s and do so regularly because there is a high turnover”

External Assessment Report – June 2019
69
establishing a sustainable pharmacovigilance (PV) and reporting system is among the top priorities for manufacturers, NRAs and donors.
As an example, one donor even suggested that WHO should make it a requirement for prequalified products to conduct phase IV studies, with on-going monitoring of the product, especially in pediatric care.
However, most stakeholders recognize the fact that WHO should not be held responsible for all PV activities and that they should, to some extent, be taken over by countries. Indeed, the ultimate goal should be to create and support independent NRAs that are able to trace the products distributed on their soil. One way proposed for LMICs to achieve more robust post-market surveillance capabilities despite limited resources is the sharing of resources through collaborations across countries.
Furthermore, the quantity of the adverse events reported, all streams included, has significantly increased over the last decade (see exhibit in section above) – as well as the number of trainings offered to build in-countries capabilities. This trend highlights an increasing in country-awareness about the critical aspect of pharmacovigilance activities. However, some NRAs warned about the fact that the sole quantity criteria are not sufficient to assess the effectiveness of the SAV activities. Indeed, the quality of the reports is as important, if not more, as the quantity and health practitioners should be further educated in that sense.
c) Vaccines
(i) WHO support on SAV activities
As seen on exhibit above, there has been a significant increase in the number of adverse events related to vaccines reported in the last few years (about +10% per annum on global average). Both manufacturers and donors acknowledge this trend and appreciate the contribution WHO has made through workshops held to strengthen reporting.
However, from the point of view of vaccines’ manufacturers, the adverse events are often not transmitted fast enough due to lack of resources and capabilities in countries. These delays can lead to a delay in the response to adverse events as well as rumors and misinformation about vaccines. In addition, DCMs have a strong desire for a more in-depth support from WHO (beyond the existing one or two-day meetings) on how to build a strong vigilance system since many of them do not have such a system in place and lack the capabilities do install one.
“PV systems must allow for clear traceability, safe prescription and dispensing of medicines to patients, and enable accurate reporting and analysis of adverse event data. WHO’s work on establishing sustainable PV & reporting systems, as well as highlighting best practices, should remain a priority in LMICs.”
“LMIC NRAs will never have the resources of an SRA, but collaboration is critical to help them build an active post market surveillance system”
“How many reports you get is not enough – it leads to a false sense of security, that you are doing something. It is not just collecting data, but the quality of the data received is also critical. “
“Apart from trainings there is no good system to ensure surveillance and monitoring at the country level; response to adverse events is not quick enough to address the rumors and misinformation about vaccines, e.g. that they are creating side effects such as autism.”

External Assessment Report – June 2019
70
d) Diagnostics
(ii) Communication
The diagnostic post market surveillance system is seen as less mature than the one for medicines or vaccines. As a result, expectations towards the role of WHO in SAV greatly vary among stakeholders, but it is generally accepted that WHO SAV teams are responsive, flexible and willing to help – despite the need to strengthen clear communication around it.
D.3.3 Recommendations
WHO is seen as having a unique role in assuring the post-market surveillance of prequalified medicines, vaccines and diagnostics as well as of substandard and falsified products. WHO SAV’s pioneering work in setting up a basic safety and monitoring system for LMIC (e.g., through the Uppsala Monitoring Centre or WHO GSMS) is recognized and appreciated across the stakeholders. At the same time, there is a strong desire that WHO SAV work towards establishing a more robust post market surveillance system comprising with more active, systematic reporting at the country level. A few targeted measures could deliver improvements by addressing internal operational and external challenges (capability-building):
■ Cross-functional collaboration and communication: work more cross-functionally across medicines, vaccines, and diagnostics given the overlap in “customers” – (a) NRAs and clinics generating reports at the national level, and (b) manufacturers:
– Creating cross-functional teams on post-market surveillance that interact on a regular basis by exchanging information and meeting at least on a quarterly basis
– Coordinating reporting frequency and mechanisms
■ Increase cooperation with on pharmacovigilance with the Communicable Diseases cluster, in particular with the Global TB Programme, Control of Neglected Tropical Diseases (NTD) and the Special Programme for Research and Training in Tropical Diseases (TDR)
■ Acceleration of response time: increase frequency of SAV meetings to review adverse event reports (e.g., ADR, AEFI, etc.) from annual to quarterly basis to decrease response time
■ Step-up in training activity:
– Conduct more frequent and regular in-country trainings on post market surveillance to build sustainable awareness and capabilities at the country level and to increase regularity and quality of the reporting
– Conduct regular workshops for DCMs to enable them to set up robust vigilance and post-market surveillance systems

External Assessment Report – June 2019

External Assessment Report – June 2019