immigration status and stroke - tspace.library.utoronto.ca
TRANSCRIPT

THE ASSOCIATION BETWEEN IMMIGRATION STATUS AND
STROKE INCIDENCE, CARE AND OUTCOMES
(Spine title: Immigration status and stroke)
by
Manav Virat Vyas
A thesis submitted in conformity with the requirements
for the degree of Doctoral of Philosophy (Clinical Epidemiology and Health Care Research),
Institute of Health Policy, Management, and Evaluation
University of Toronto
© Copyright by Manav V. Vyas, 2021

ii
The association between immigration status and stroke incidence,
care and outcomes
Manav V. Vyas
Doctoral of Philosophy (Clinical Epidemiology and Health Care Research)
Institute of Health Policy, Management, and Evaluation
University of Toronto
2021
ABSTRACT
Immigrants to high-income countries have a lower cardiovascular disease incidence and
mortality compared to host populations, a phenomenon termed the healthy immigrant effect.
However, differences in stroke incidence, care and outcomes between immigrants and host
populations have not been well-characterized. We studied the incidence, acute care, and
short-term and long-term outcomes of stroke in immigrants compared to long-term residents
in Ontario, Canada. People born outside of Canada who immigrated after 1985 were
considered immigrants. Compared to long-term residents, immigrants had stroke at a younger
age and had a lower adjusted hazard of stroke (hazard ratio [HR] 0.67; 95% confidence
interval [CI] 0.66-0.68). Compared to long-term residents, immigrants were less likely to
seek care for transient ischemic attacks, and among patients with ischemic stroke, immigrants
received equal or better acute stroke care, had higher disability on discharge (adjusted risk
ratio 1.18, 95% CI 1.13-1.22), and marginally lower long-term (15 years) mortality (adjusted
HR 0.94, 95% CI 0.88-1.00). These associations varied with age at the time of stroke, stroke

iii
subtype, ethnicity, country of origin, and immigration class, highlighting heterogeneity in the
observed healthy immigrant effect. While the lower incidence of stroke and the lower
mortality following stroke in immigrants compared to long-term residents may suggest a
healthy immigrant effect, the younger age at the time of stroke and the higher disability on
discharge in immigrants compared to long-term residents highlights a higher risk of
premature and disabling stroke in immigrants. Further research should evaluate the reasons
for the observed differences, which could then inform the design of effective interventions to
improve stroke outcomes for both immigrants and long-term residents.
Keywords immigration status, stroke, incidence, care, outcomes, and ethnicity

iv
िव�ा ददाित िवनयं िवनया�ाित पात्रताम् |
पात्र�ा�नमा�ोित धना�म� ततः सुखम् ||
--
vidyā dadāti vinayaṃ vinayā dadāti pātratāṃ |
pātratvadhanamāproti dhanādharma tat: sukham ||

v
ACKNOWLEDGMENTS
I want to thank IHPME and the University of Toronto for providing an excellent research and
learning environment. In particular, I thank Zoe Downie-Ross and Rob Fowler for their
guidance and support.
I am thankful to my friends in Canada who have pulled me up when I was feeling low, and
my friends in India and outside, who have helped me remain true to my roots (you all know
who you are!).
I want to thank my committee members, Drs. Andreas Laupacis, Frank Silver and Peter
Austin for their unwavering support and encouragement throughout the past several years,
and for bearing with me through long presentations and tiring committee meetings. Your
patience and enthusiasm are greatly appreciated! I also want to thank Jiming Fang for his
friendship and statistical advice – I will miss knocking on your door and showing you my
new SAS macros! Most importantly, I want to thank my mentor and supervisor, Dr. Moira
Kapral. Moira, I would not be able to accomplish this Himalayan task without your help and
support. You are an incredible mentor and a source of constant inspiration. You encouraged
me to become independent, develop my own ideas, and tirelessly and selflessly worked with
me, and for me. I am very grateful to have you as a mentor, and will forever remain indebted!
This work would not be possible without endearing support from my family, close and
extended (including cousins), who have toiled with me on this journey. My brother, Dev, his
wife, Sarah, and my three nephews, Jay, Rohan and Noah, are a constant source of happiness
in my life and I appreciate all the time we spend together. My wife, Krishna, who has been a
solid support, and who never questioned my career path, despite it being riddled with
uncertainty. Krishna, your quiet and perceptive love helps me become my best version.
Thank you for your love and support! Lastly, and importantly, I want to thank my parents to
whom I owe everything! Mum and Dad, your selfless love and tremendous belief in my
ability has helped me become who I am today. Thank you and love you!

vi
TABLE OF CONTENTS
ABSTRACT ........................................................................................................................ ii
ACKNOWLEDGMENTS .................................................................................................. v
TABLE OF CONTENTS ................................................................................................... vi
List of Tables .................................................................................................................... xii
List of Figures .................................................................................................................. xiv
Chapter 1 Introduction and literature review................................................................ 1
1 Overview of objectives .................................................................................................. 2
2 Scope of the problem ..................................................................................................... 2
3 Immigrants in Canada .................................................................................................... 3
4 Immigrants in Ontario .................................................................................................... 4
5 Immigration and health .................................................................................................. 5
5.1 Healthy immigrant effect ........................................................................................ 5
5.2 Acculturation effect ................................................................................................ 5
5.3 Return migration (salmon effect) ............................................................................ 6
6 Why study stroke? .......................................................................................................... 7
6.1 Stroke is a leading cause of death and disability .................................................... 7
6.2 Unique characteristics of stroke .............................................................................. 8
7 Immigration and stroke .................................................................................................. 8
7.1 Stroke incidence ...................................................................................................... 9
7.2 Acute care and short-term outcomes ..................................................................... 10
7.3 Long-term outcomes ............................................................................................. 10
8 Ethnicity and stroke...................................................................................................... 11

vii
8.1 Ethnicity and stroke incidence .............................................................................. 11
8.2 Ethnicity and stroke care and short-term outcomes .............................................. 11
8.3 Ethnicity and long-term outcomes ........................................................................ 12
9 Potential confounders ................................................................................................... 12
9.1 Age ........................................................................................................................ 12
9.2 Socioeconomic status ............................................................................................ 12
9.3 Lifestyle and vascular risk factors ........................................................................ 13
10 Confounders vs. mediators ........................................................................................... 14
11 Why is it difficult to study immigrants? ...................................................................... 15
11.1 Selection bias when studying immigrants............................................................. 15
11.2 Lack of randomized controlled trials .................................................................... 17
11.3 Lack of animal models .......................................................................................... 17
12 Rationale for the research............................................................................................. 17
13 Data sources ................................................................................................................. 18
13.1 Administrative databases ...................................................................................... 18
13.2 Ontario Stroke Registry ........................................................................................ 19
13.3 Surname algorithm ................................................................................................ 20
13.4 Immigration Refugee and Citizenship Canada database ...................................... 21
14 Defining immigration status in Ontario ....................................................................... 21
15 Research Questions ...................................................................................................... 32
15.1 Stroke incidence .................................................................................................... 32
15.2 Acute care and outcomes on discharge ................................................................. 32
15.3 Long-term outcomes and secondary stroke preventive care ................................. 32

viii
Chapter 2 Immigration Status and Stroke incidence .................................................. 33
1 Overview ...................................................................................................................... 34
2 Research Questions ...................................................................................................... 34
3 Study population .......................................................................................................... 34
4 Exposure of interest...................................................................................................... 35
5 Outcomes of interest .................................................................................................... 35
6 Statistical Analysis ....................................................................................................... 36
6.1 Primary analyses ................................................................................................... 36
Why use age as time-scale? .................................................................................. 36
6.2 Secondary analyses ............................................................................................... 37
Effect of age .......................................................................................................... 37
Country of origin, immigration class, and acculturation ...................................... 37
7 Results .......................................................................................................................... 38
7.1 Baseline characteristics ......................................................................................... 38
7.2 Incidence of stroke and stroke subtypes ............................................................... 38
7.3 Country of origin and acculturation ...................................................................... 39
8 Discussion .................................................................................................................... 51
8.1 Summary ............................................................................................................... 51
8.2 Key findings .......................................................................................................... 51
8.3 Strengths and limitations....................................................................................... 53
8.4 Implications........................................................................................................... 54
Chapter 3 Immigration status, acute stroke care and short-term outcomes............. 55
1 Overview ...................................................................................................................... 56

ix
2 Research Questions ...................................................................................................... 56
3 Study population .......................................................................................................... 56
4 Exposure of interest...................................................................................................... 57
5 Outcome of interest ...................................................................................................... 57
6 Statistical Analysis ....................................................................................................... 58
6.1 Primary analyses ................................................................................................... 58
Why use IPTW analyses? ..................................................................................... 59
6.2 Secondary analyses ............................................................................................... 60
Country of origin and acculturation measures ...................................................... 60
6.3 Sensitivity analyses ............................................................................................... 60
7 Results .......................................................................................................................... 61
7.1 Baseline differences .............................................................................................. 61
7.2 Differences in acute stroke care ............................................................................ 61
7.3 Primary analyses ................................................................................................... 62
7.4 Country of origin and acculturation ...................................................................... 63
7.5 Sensitivity analyses ............................................................................................... 63
8 Discussion .................................................................................................................... 76
8.1 Summary ............................................................................................................... 76
8.2 Key findings .......................................................................................................... 76
8.3 Strengths and limitations....................................................................................... 78
8.4 Implications........................................................................................................... 79
Chapter 4 Immigration status and long-term outcomes ............................................. 80
1 Overview ...................................................................................................................... 81

x
2 Research Questions ...................................................................................................... 81
3 Study population .......................................................................................................... 81
4 Exposure of interest...................................................................................................... 82
5 Outcomes of interest .................................................................................................... 83
6 Statistical Analysis ....................................................................................................... 84
6.1 Primary analyses ................................................................................................... 84
Determining loss to follow-up .............................................................................. 85
6.2 Secondary analyses ............................................................................................... 86
Effect of age .......................................................................................................... 86
Ethnicity ................................................................................................................ 86
Country of origin and acculturation factors .......................................................... 86
6.3 Sensitivity analyses ............................................................................................... 87
Stroke severity and palliative care status .............................................................. 87
6.4 Exploratory analyses ............................................................................................. 87
7 Results .......................................................................................................................... 88
7.1 Baseline characteristics ......................................................................................... 88
7.2 Primary outcomes ................................................................................................. 89
7.3 Effect of age .......................................................................................................... 90
7.4 Ethnicity and Immigration status .......................................................................... 90
7.5 Country of origin and acculturation ...................................................................... 90
7.6 Exploratory analyses ............................................................................................. 91
8 Discussion .................................................................................................................. 108
8.1 Summary ............................................................................................................. 108

xi
8.2 Key findings ........................................................................................................ 108
8.3 Strengths and limitations..................................................................................... 111
8.4 Implications......................................................................................................... 113
Chapter 5 Discussion .................................................................................................... 114
1 Summary .................................................................................................................... 115
2 Limitations ................................................................................................................. 116
3 Future projects ............................................................................................................ 118
4 Implications ................................................................................................................ 119
Curriculum Vitae .......................................................................................................... 120
References ...................................................................................................................... 122

xii
List of Tables
Table 1.1. Definitions of variables included in this dissertation. ........................................... 22
Table 1.2. List of countries in each region selected. .............................................................. 30
Table 2.1. Baseline characteristics of immigrant and long-term residents in Ontario, Canada
at the start of cohort (January 1, 2003). .................................................................................. 40
Table 2.2. Association between immigration status and incidence of stroke or TIA in
Ontario, Canada between 2003 and 2018 (median follow-up of 15 years). ........................... 41
Table 2.3. Risk of stroke or transient ischemic attack in immigrants compared to long-term
resident based on immigration-related factors. ....................................................................... 42
Table 3.1. Characteristics of patients with ischemic stroke or TIA seen at regional stroke
centres in Ontario, Canada between July 2003 and April 2013 (N = 34,987). ....................... 64
Table 3.2. Processes of stroke care and outcomes in immigrants and long-term residents with
ischemic stroke or TIA (N = 34,987). ..................................................................................... 66
Table 3.3. Disability following ischemic stroke among immigrants and long-term residents
in Ontario, Canada. ................................................................................................................. 68
Table 3.4. Disability after ischemic stroke in different groups of immigrants (based on region
of origin, time since immigration, age at arrival, and immigration class) compared to long-
term residents in Ontario, Canada. .......................................................................................... 69
Table 3.5. Non-stroke centres cohort. Characteristics of the cohort (N = 16,060). ............... 70
Table 3.6. Non-stroke centres cohort. Processes of stroke care between immigrants and long-
term residents with ischemic stroke or TIA in the cohort (N = 16,060). ................................ 71
Table 4.1. Administrative databases used to determine date of last health system contact and
statistics on contact with health care system in Ontario. ........................................................ 93
Table 4.2. Characteristics of included patients with ischemic stroke in Ontario, Canada
between April 2002 and March 2013 (N = 31,923). ............................................................... 94
Table 4.3. Baseline characteristics of the cohort by ethnicity. ............................................... 96

xiii
Table 4.4. Cause of death in immigrants and long-term residents who died during follow-up.
................................................................................................................................................. 99
Table 4.5 Mortality and vascular event recurrence following ischemic stroke in immigrants
and long-term residents of Ontario ....................................................................................... 100
Table 4.6. The association between immigration status and long-term outcomes in patients
with ischemic stroke in Ontario, Canada. ............................................................................. 101
Table 4.7. The interaction between immigration status and ethnicity on long-term outcomes
following ischemic stroke in Ontario, Canada. ..................................................................... 102

xiv
List of Figures
Figure 1.1. Factors related to human migration. ...................................................................... 3
Figure 1.2. Selection bias in observational studies of immigrants in host nations. ............... 16
Figure 2.1. Cohort selection when evaluating the incidence of stroke or TIA in immigrants
and long-term residents. .......................................................................................................... 43
Figure 2.2. Effect of age on the association between immigration status and incidence of
stroke or transient ischemic attack shown as unadjusted and adjusted HR of outcome in
immigrants compared to long-term residents. ........................................................................ 44
Figure 2.3. Effect of age on the association between immigration status and incidence of
ischemic stroke in immigrants compared to long-term residents. .......................................... 45
Figure 2.4. Effect of age on the association between immigration status and incidence of
intracranial hemorrhage in immigrants compared to long-term residents. ............................. 46
Figure 2.5. Effect of age on the association between immigration status and incidence of
transient ischemic attack in immigrants compared to long-term residents. ............................ 47
Figure 2.6. Effect of age on the association between immigration status and incidence of
subarachnoid hemorrhage in immigrants compared to long-term residents. .......................... 48
Figure 2.7. Adjusted hazard ratio (95% confidence interval) of stroke or TIA and subgroups
of ischemic stroke and intracranial hemorrhage in immigrants compared to long-term
residents based on country of origin. ...................................................................................... 49
Figure 2.8. Adjusted hazard ratio (HR) of stroke or TIA in immigrants compared to long-
term residents of Canada based on the country of origin of immigrants (depicting the top 1%
countries from where immigrant originate). ........................................................................... 50
Figure 3.1. Flow diagram. Selection of the study cohorts. .................................................... 73
Figure 3.2. Regional stroke centres cohort. Balance between baseline characteristics assessed
as absolute standardized differences between immigrants and long-term residents before
(solid circles) and after (empty circles) applying inverse probability of treatment weights to
the entire cohort. ..................................................................................................................... 74

xv
Figure 3.3. Non-stroke centres cohort. Balance between baseline characteristics assessed as
absolute standardized differences between immigrants and long-term residents before (solid
circles) and after (empty circles) applying inverse probability of treatment weights to the
entire cohort. ........................................................................................................................... 75
Figure 4.1. Balance before and after application of inverse probability treatment (IPT)
weights to the cohort of patients with ischemic stroke. ........................................................ 103
Figure 4.2. Hypothetical cases to illustrate loss to follow-up using administrative database.
Subject A was not to lost to follow-up, Subject B would be considered lost to follow-up, and
Subject C had the event of interest (death) and so is not considered lost to follow-up. ....... 104
Figure 4.3. Participant selection for the study. .................................................................... 105
Figure 4.4. All-cause mortality and vascular event recurrence following ischemic stroke in
immigrants and long-term residents...................................................................................... 106
Figure 4.5. Results of multivariable proportional hazards models to evaluate effect of
acculturation on mortality and vascular event recurrence following ischemic stroke. ......... 107

1
Chapter 1 Introduction and literature review

2
1 Overview of objectives
a. To compare the incidence of stroke in immigrants and long-term residents.
b. To study the quality of acute stroke care and short-term outcomes after ischemic
stroke in immigrants and long-term residents.
c. To evaluate long-term outcomes and secondary stroke preventive care in immigrants
and long-term residents with ischemic stroke.
d. For all of the above, to evaluate the effect of immigration-related factors such as
country of origin, time since immigration, age at arrival, and immigration class.
2 Scope of the problem
Migration is a universal phenomenon. Animals and birds migrate long distances, integrating
external and internal factors, to avoid adverse seasonal climates, avoid predators at
vulnerable life stages, and reach final destinations that provide food.1 There is evidence that
supports that human migration began about 1.8 million years ago as the genus Homo moved
out of the continent now known as Africa to other parts of the world.2 Over the years, human
beings have migrated for a variety of reasons, and the factors associated with this migration
have changed over time. Figure 1.1 shows some factors associated with human migration in
modern times.
In recent years, human migration has increased due to socio-economic reasons, as well as
war, persecution and climate change.3 In 2019, over 200 million people worldwide were
considered immigrants.4 While most migration occurs from one low- or middle-income
country to a neighbouring low- or middle-income country, the second most common type of
migration is from a low- or middle-income country to a high-income country, and this is the
focus of this dissertation.5 In 2018, approximately 10 million people migrated permanently or
temporarily to one of the G20 countries.5 Many of these immigrants now reside in North
America and Europe.4 In addition to providing immigrants with a safe living environment (in
most high-income countries), such migration has allowed populations of the host countries to
grow, which has been associated with an economic advantage.6 In the absence of immigrants
from low- and middle-income countries, it is anticipated that by 2070 the population of North

3
America would decrease by 21%.7 Thus, in addition to contributing to growing economies,
immigrants lead to demographic shifts in the host populations. These demographic shifts
affect population-level health in host populations, making it important for healthcare
providers and policy makers to understand the health of immigrants.3
Figure 1.1. Factors related to human migration.
(Adapted from Foresight: Migration and Global Environmental Change (2011) Final Project Report. The
Government Office of Science, London)
3 Immigrants in Canada
Prior to “European contact”, Canada was inhabited by people of different cultural
backgrounds who settled in the North Americas for agriculture and fishing.8 First Nations,
Inuit and Métis people are jointly recognized as the Aboriginal peoples of Canada, hereafter
referred to as Indigenous peoples of Canada. British and French colonization during the 17th
and 18th centuries led to a shift in the demographics of Canada’s population. This
colonization of the Canadian lands led to significant changes in lives of Indigenous peoples
of Canada, and reconciliation efforts are still underway for the wrong done to the rightful
owners of Canadian lands. Indigenous peoples of Canada, who are considered the owners of

4
the Canadian lands, are the only non-immigrants to Canada. However, this dissertation will
focus on immigrants who arrived in Canada after 1985 (because of limitations in our data –
vide infra). This dissertation also does not identify Indigenous people as a separate group for
analyses, as such work must be undertaken in partnership with Indigenous communities or
organizations and is beyond the scope of this body of work.
Since Confederation in 1867, more than 17 million immigrants have come to Canada9 and
Canada is considered a “mosaic” country because of its history of accepting immigrants over
the years. According to the 2016 Census report, approximately 1 in 5 Canadians identified
themselves as foreign-born or immigrant.10 Most immigrants to Canada after the World Wars
came from Europe and North America based on the then present nationality- and ethnicity-
based immigration policies. However, in 1967, Canada became the first country to introduce
a points-based system for economic migration (Order-in-Council, October 1st, 1967, PC
1616) that facilitated immigration of people of non-European and non-American
backgrounds. Some version of this scoring system has been employed to the present date.
The points are accumulated based on education, work experience, proficiency in either the
English or French language, and family ties in Canada. A higher score suggests a higher
likelihood of immigration, and the cut-off values have varied over the years. As a result of
this policy, recent Canadian immigrants have been younger and more educated compared to
immigrants who arrived in prior years, and compared to the host populations.10 The country
of origin of immigrants has changed over time, with the majority of the most recent
immigrants to Canada arriving from South Asia, East Asia, and Africa.11
4 Immigrants in Ontario
Ontario is Canada’s most populous province. Of the total Ontario population of 14 million
people, approximately 21% are considered immigrants.10 Permanent residents and citizens
and those on valid work visas are covered by the provincial health plan which includes
coverage for physician services, hospital and emergency room care, and investigations
ordered by physicians. Prescription medications are also covered for those who are 65 years
or older and for younger people if they spend a part (approximately 4% or more) of their net
income on prescription drug costs. The vast majority of immigrants to Ontario have public

5
healthcare coverage which is identical to that of long-term residents. This is in contrast to
some high-income countries where the quality of healthcare is closely related to health
insurance coverage.12 Those not covered under Ontario’s health insurance plan include
asylum seekers, migratory farm workers and undocumented immigrants, and the findings
from this dissertation will not apply to these groups. This is a limitation of this dissertation.
5 Immigration and health
5.1 Healthy immigrant effect
Previous research suggests that immigrants are generally healthier than host populations.
This is called a healthy immigrant effect.13,14 It is due a selection bias whereby only those
with a certain human capital and health can immigrate.15 Such selection bias is amplified by
the points-based system which favours immigrants with knowledge of Canadian languages,
as well as certain education and work experience.16 Furthermore, pre-immigration health
assessments aim to select those who are healthy and can contribute to the Canadian
economy.17
The effect of such selective migration and its impact on health has been studied previously.
Compared to the host populations, immigrants have been found to have a lower all-cause
mortality18, lower incidence of cancer19, schizophrenia20, and cardiovascular disease21, and
lower mortality following these conditions22,23. However, this healthy immigrant advantage
varies based on various factors, including immigration class (refugee vs. economic) and
country of origin.21 It has also been shown to vary based on measures of acculturation as the
immigrants accrue risk factors similar to that of host populations, known as the acculturation
effect.
5.2 Acculturation effect
Multiple reasons have been proposed for the acculturation effect. Immigrants from low- and
middle-income countries typically have lower rates of unhealthy behaviours compared to
host populations in high income countries. When this is a consequence of delayed
industrialization and its attendant side effects, it has been described as a time traveller
effect.24 However, with time, health behaviours including smoking25, alcohol use26, sedentary
6
behaviour27, and diet28 may change in immigrants such that the rates in immigrants become
similar to those of the host populations. In addition to lifestyle changes, immigrants may also
face psychosocial problems that include stress of living in new environment and living away
from their families, which could influence the risk of chronic disease over time.29,30
Furthermore, immigrants may face discrimination and racism and this too has been linked to
poor health outcomes, including cancer and cardiovascular disease.31–33 Lastly, immigrants
are often underemployed – working in a career or a job that is not representative of the
education level attained – because their education from home countries is not transferrable,
or not easily transferrable.31 Many immigrants work in precarious work environments,
including doing shift work, which has been linked to development of cardiovascular disease
and cancer.34,35
The most commonly used proxy of acculturation is time since immigration because over time
immigrants accrue risks similar to that of host nations. However, age at which immigrants
arrive in host nations also makes a difference because younger immigrants are more likely to
assimilate than older immigrants.36 Furthermore, immigration class could modify this
association, as those who migrate on economic basis are more likely to adapt when compared
to immigrants who arrive as refugees (forced migration).37
5.3 Return migration (salmon effect)
Much like the salmon and other species that return to their spawning grounds or birth place at
the end of life, humans may also return to their regions of origin closer to the time of their
death.38,39 The reasons for such return migration are not clearly understood, but one
hypothesis is that there is a sense of stability and comfort in being close to one’s place of
origin.24 Other factors may include being closer to friends and family, and patriotic
sentiments. This return migration can affect studies of mortality in immigrants compared to
long-term residents because eventual deaths in those who return to their home regions will
not be counted in the country under study. Such unbalanced follow-up between two
comparison groups has been shown to lead to biased estimates in both observational and
experimental studies.40,41 This bias, called the salmon bias, has been well-studied in Hispanic

7
and Asian Americans returning to their home regions in older ages and eventually being lost
to follow-up.42,43
6 Why study stroke?
6.1 Stroke is a leading cause of death and disability
Stroke is a leading cause of death and disability worldwide.44 Stroke is also a common
cardiovascular condition. The lifetime risk of stroke in people over 25 years as per the Global
Burden of Disease study was about 24.9% in 2016, with no difference in the lifetime risk of
stroke between men and women (24.7% vs. 25.1%).45 This suggests that there is a 1 in 4
chance of developing stroke over one’s lifetime. The worldwide age-standardized incidence
of stroke in 2016 was 203 per 100,000 people, which was lower than estimates from previous
years, yet higher than that of most other neurological conditions.46 Stroke is among the most
common causes of hospital admissions in Canada, and in 2013, about 405,000 people in
Canada were living with the effects of stroke.47,48
In addition to being common, stroke is associated with significant morbidity and mortality. In
2016, about 5.5 million deaths worldwide were attributed to stroke and 116.4 million
disability adjusted life-years were lost due to stroke, the highest among all neurological
conditions.46 The estimated weighted-mean cost per patient per month of outpatient and
inpatient stroke care from a healthcare perspective was about US dollars (USD) 1,515
(standard deviation USD 1,396) based on a study of 60 different stroke programs across
various countries.49 These costs did not include costs from informal caregiving or lost
productivity50. In Canada, the average annual costs of stroke based on a single centre study
was Canadian dollar (CAD) 74,353, with higher costs for disabling stroke (CAD 107,833).51
Because of its high cost and the high incidence and prevalence, stroke is one of the most
expensive health conditions in Canada, with an estimated CAD 3.6 billion a year in both
direct and indirect costs.52 Thus, studying stroke incidence and outcomes is valuable from a
public health perspective, and for the planning of healthcare services and spending. Given the
increasing population of immigrants worldwide, it is important to study the association of
immigration status with stroke incidence and outcomes.

8
6.2 Unique characteristics of stroke
Unlike other medical conditions such as cancer or mental health conditions that have an
insidious onset of symptoms, stroke by definition involves the rapid or sudden onset of focal
neurological symptoms, often characterized by weakness or language difficulties that last for
more than 24 hours.53 Thus, most patients with symptoms of stroke end up seeking some
form of health care either at the onset of the symptoms or shortly thereafter. Therefore, this
avoids length-time bias which is common when studying other medical conditions such as
cancer.54 Furthermore, contrary to mental health conditions where stigma and patient
preferences influence health seeking behaviour and eventual diagnosis55, the physical
symptoms of stroke are usually sufficiently noticeable to permit a prompt diagnosis.56 One
exception may be patients with minor stroke or transient ischemic attack (TIA) who may not
seek urgent medical attention, or may seek attention outside of an acute care hospital.57
According to the Canadian Stroke Best Practice Guidelines and other international
guidelines, people with suspected or confirmed stroke should be admitted to an acute care
hospital for urgent evaluation.58,59 This allows one to use hospitalizations or emergency
department visits, typically captured in administrative health data, as a proxy for stroke
incidence. Because evidence-based measures of quality of care are well-developed for stroke
care, these can be used as a proxy for the overall quality of health care in immigrants
compared to long-term residents.58,59 Lastly, most patients with stroke require regular
medical follow-up for management of vascular risk factors and secondary prevention, and
thus one can study quality of secondary stroke preventive care and long-term outcomes
following stroke.60,61 Therefore, from a public health perspective, studying the association
between immigration status and stroke incidence, care and outcomes can provide important
information on immigrant health that is not confounded by disease-specific diagnostic or
care-seeking biases.
7 Immigration and stroke
The following section is a narrative summary of the literature on immigration status and
stroke. The literature search was done in Medline using subject heading [exp
Cerebrovascular Disorders/ and exp human migration/] and free text words (‘cerebral’ or

9
‘cva’ or ‘cve’ or ‘cerebro’ or ‘ICH’ or ‘TIA’ or ‘SAH’ or ‘subarachnoid’ or ‘stroke’ or
‘infarct’ or ‘transient ischemic attack’ or ‘parenchymal’ or ‘intracerebral hemorrhage’ or
‘bleed’, and ‘immigrant’ or ‘migrant’ or ‘immigration’ or ‘emigrant’ or ‘emigration’ or
‘refugee’ or ‘expat’ or ‘asylum’), and only including studies published in English language.
7.1 Stroke incidence
Estimates of stroke incidence in immigrants compared to the host populations have generated
variable findings. In a Danish study of over 45,000 people hospitalized due to cardiovascular
disease, the adjusted incidence of stroke was similar in immigrants who arrived as refugees
and the host population (incidence rate ratio [IRR] 1.07, 95% confidence interval [CI], 0.97-
1.18), but it was lower in immigrants who arrived in the family-reunified category (IRR 0.56,
95% CI 0.48-0.66).62 In Sweden, the adjusted relative risk of a first-ever stroke in a cohort of
people living in the city of Malmö was higher in those born in Hungary or Yugoslavia
(immigrants) compared to those born in Sweden, and lower in immigrants born in China or
Vietnam compared to those born in Sweden.63 In comparison, the rate of stroke-related
hospitalization in Italy was higher in immigrant men and women compared to the Italian
population.64 In the United States of America (US), the Health and Retirement Study,
including adults (50 years and older) reported a lower odds ratio (OR) of incident stroke (OR
0.58, 95% CI 0.41-0.81) in foreign-born Hispanics compared to non-Hispanic Whites, in
comparison to stroke incidence in US-born Hispanics compared to non-Hispanic Whites (OR
1.07, 95% CI 0.80-1.42) .65 A Canadian study of young adults (aged 18 to 65 years) found
that the incidence of stroke in immigrants was lower than in non-immigrants, despite
adjusting for various baseline differences, but it did not evaluate the risk based on country of
origin or immigration class.66 Another Canadian study found that the age-standardized
incidence of stroke was lower in immigrants (1 per 1000 person-years) compared to long-
term residents (1.3 per 1000 person-years), with variation in the risk based on the region of
origin of immigrants.21 These findings highlight the need to consider both the country of
origin and the immigration class of immigrants when studying the influence of immigration
status on stroke incidence. Of note, little is known about potential differences in the
incidence of stroke subtypes (ischemic vs. hemorrhagic) in immigrants compared to non-

10
immigrants, or about the effect of measures of acculturation such as time since immigration
or age at immigration.
7.2 Acute care and short-term outcomes
One prior study has reported on short-term stroke outcomes in immigrants compared to long-
term residents. The Brain Attack Surveillance in Corpus Christi project included 935
Mexican Americans with stroke of whom 83 (8.9%) were immigrants with an average length
of stay in the US of 47 years.67 While there were no major differences in baseline vascular
risk factors, at 90 days post-stroke immigrants had a better functional outcome (activities of
daily living/instrumental activities of daily living; mean difference, -0.22; P=0.02; 1-4,
higher scores worse) and no difference in neurological outcomes (log-National Institutes of
Health Stroke Scale [NIHSS]; mean difference, -0.15; P=0.15; 0-44, higher scores worse)
compared to non-immigrants.67 In Florida, a small case series (n = 216) comparing acute
stroke care of Haitian (immigrants from Haiti) to non-Haitian stroke patients found no
significant differences in stroke severity or rates of thrombolysis administration68 To our
knowledge, there have been no other published studies comparing acute stroke care in
immigrants and non-immigrants.
7.3 Long-term outcomes
All-cause mortality at one-year following a diagnosis of stroke was lower, although the
confidence interval crossed 1.0, in immigrants compared to non-immigrants in Ontario,
Canada (OR 0.88, 95% CI 0.71-1.1).60 In Denmark, all-cause mortality (average follow-up
time 5.4 years) following stroke was lower in refugees (HR 0.72, 95% CI 0.60-0.87) and
family-reunified immigrants (HR 0.64, 95% CI 0.48-0.86) compared to the general
population.62 However, in the same study, there was no difference in cardiovascular disease-
related mortality following stroke in immigrants compared to the general population,
irrespective of immigration class.62 To our knowledge, the long-term rates of vascular event
recurrence or stroke recurrence based on immigration status have not been reported.

11
8 Ethnicity and stroke
The association between immigration status and stroke incidence, care and outcomes cannot
be studied without considering the ethnicity of immigrants. Ethnicity refers to shared culture,
such as language, ancestry, practices, and beliefs whereas race refers to physical differences
that groups and cultures consider socially significant.69 For the purposes of this dissertation,
we will mainly focus on ethnicity; however, when reviewing the literature in the US, we will
describe race-related disparities in care (especially concerning Black Americans).
8.1 Ethnicity and stroke incidence
Previous research has shown variation in the incidence of stroke and subtypes based on
ethnicity. Compared to the Dutch ethnic group in the Netherlands, the risk of overall stroke
and each stroke subtype was higher in the Surinamese ethnic group, and lower in the
Moroccan ethnic group.70 In South London, people of African and Caribbean origin had a
higher rate of stroke and its subtypes compared to the White British.71 In the US, a higher of
risk of overall stroke was found among Blacks72 and Hispanics73 compared to White
Americans, whereas the risk was lower for ischemic stroke and higher for intracerebral
hemorrhage in Asian Americans74. In Canada, South Asian ethnicity was associated with a
lower risk of ischemic stroke and hemorrhagic stroke; whereas Chinese ethnicity was
associated with a lower risk of ischemic stroke, but a higher risk of hemorrhagic stroke.75
Therefore, when evaluating the incidence of stroke, one should assess for ethnic differences
in the incidence of stroke subtypes as well as overall stroke incidence.
8.2 Ethnicity and stroke care and short-term outcomes
In Amsterdam, a hospital-based study of 510 patients with acute stroke found that non-White
patients were less likely to receive thrombolysis than White patients (odds ratio [OR] 0.34,
95% CI 0.17-0.71), and this was partly explained by a later arrival at the hospital.76 Similarly,
in the US, compared to White patients, Black and Hispanic patients with stroke were less
likely to receive thrombolysis, deep vein thrombosis prophylaxis, and antithrombotics and
lipid-lowering therapy on discharge.77 In a cohort of patients with ischemic stroke over the
age of 65 years (i.e., Medicare beneficiaries) in the US, non-White ethnic groups (Black,
Hispanic, and Asian) had lower unadjusted and adjusted odds of being independently

12
ambulatory at discharge than their White counterparts.78 Another study found that Asian
Americans had a lower adjusted odds of being independently ambulatory at discharge after
stroke than White Americans (OR 0.84, 95% CI 0.79-0.99) and a lower odds of achieving a
modified Rankin score of 0 or 1 (OR 0.80, 95% CI 0.76-0.83).79 In one Canadian study, the
odds of institutionalization (being admitted to a long-term care facility) after stroke were
higher in immigrants than non-immigrants, in both unadjusted and adjusted analyses;
however, the confidence intervals were wide and included null values.66
8.3 Ethnicity and long-term outcomes
In England, Black Caribbeans and Black Africans have been found to have better long-term
survival at 15 years compared to Whites after a diagnosis of stroke.80,81 In contrast, long-term
mortality following stroke in a US study did not vary based on race in one study.82 The South
London Stroke Registry in the UK did not find an association between Black ethnicity and
risk of stroke recurrence at 10 years83,84; whereas, the multivariable-adjusted hazard ratio of
recurrent stroke among Black Americans was 1.36 (95% CI 1.29-1.44) compared to White
Americans in one US study.
Thus, ethnicity is an important consideration when evaluating stroke incidence, care and
outcomes of immigrants.
9 Potential confounders
9.1 Age
Age is the most important risk factor for stroke incidence, and older age is associated with
increased disability and mortality after stroke.85,86 As previously discussed, due to selective
migration patterns, immigrants are generally younger than host populations. In addition,
Black, Hispanic or Asian ethnic groups have stroke at a younger age than White
populations.79,87,88 Thus, it is important to consider the differential effect of age on the
association between immigration and stroke incidence and case-fatality.
9.2 Socioeconomic status
Low socioeconomic status has been associated with a higher risk of stroke incidence and
worse outcomes following stroke.89–93 Therefore, when studying the association between

13
immigration status and stroke incidence and outcomes, it is important to account for
differences in socioeconomic status between immigrant and host populations.
Socioeconomic status generally incorporates some measure of income and/or education.
Because of points-based immigration policies, immigrants in Canada are generally well-
educated (especially those who arrived as economic migrants), yet have a higher likelihood
of having chronic low-income (defined as family income below the low-income cut-off for 5
consecutive years or more) than those who are Canadian-born..94 Chronic low-income was
observed in immigrants irrespective of education attainment and duration of stay in Canada,
and unobserved factors other than economic policy and immigrant background characteristics
were felt to be contributing to these differences.94
9.3 Lifestyle and vascular risk factors
In an international case-control study that included people from 32 different countries around
the world, a large proportion of the variation in the risk of stroke was explained by the
presence of vascular risk factors that included: hypertension, diabetes, dyslipidemia, waist-
to-hip ratio, smoking, physical activity, dietary habits, alcohol intake and psychosocial
factors.95 These risk factors (collectively known as vascular risk factors) have been
associated with stroke incidence and stroke outcomes.95 Prevalence of these risk factors can
change upon immigration and with acculturation27,28,96, and can vary based on immigration
class.97
Previous research suggests that immigrants to Sweden and the US have lower rates of
smoking and alcohol use than the host populations.98,99 These differences could be related to
lower access to these substances in some countries of origin or due to differences in cultural
practices and societal norms regarding substance use.99 Similarly, the dietary habits of
immigrants depend on ethnocultural factors and tend to differ from those of the host
populations.28,100,101 Availability and access to fruits and vegetables is different in source
countries and host countries which could partly be responsible for the differences in dietary
habits.100 While most dietary choices of immigrants are considered healthier in regards to
cardiovascular disease incidence than the western diet, the dietary habits of South Asians
have been associated with a higher risk of cardiovascular disease.28 The rates of active or

14
sedentary behaviours also vary based on immigration status.102,103 Differences in physical
activity and diet coupled with ethnicity influence rates of obesity and waist-hip ratio, and
vary with immigration status.104,105
Immigrants have been found to have lower rates of hypertension than host populations in the
US and Canada.104,106 However, in a population-based survey in the US, South Asian
immigrants developed hypertension at a younger age than non-immigrants (non-Hispanic
Whites),107 and studies from the US and the UK suggest that immigrants are less likely than
the host populations to achieve control of hypertension.108,109 Furthermore, rates of
hypertension vary with ethnicity, with those arriving from Africa and the Caribbean more
likely to have hypertension than other immigrant groups in the UK, and by race, as Black
Americans have a higher population attributable risk of hypertension for cardiovascular
disease than White Americans.110,111 Similarly, the prevalence of diabetes in immigrants
varies based on country of origin, with those from the Indian subcontinent (which includes
India, Pakistan, Afghanistan, Sri Lanka) having a higher prevalence than immigrants from
other world regions.104,112,113 Furthermore, the influence of diabetes on the incidence and
outcomes of stroke is different in South Asians compared to non-South Asian ethnic groups,
suggesting an additive interaction of diabetes with South Asian ethnicity.114 Lastly, based on
a systematic review of the literature on the incidence and care of diabetes among immigrants
around the world, it was noted that that control of diabetes in immigrants was on average
worse than that of host populations, with access to primary preventative care, access to
affordable medications, and lack of knowledge and language barriers identified as possible
explainations.115 In the US, Hispanic immigrants were found to have higher rates of
hyperlipidemia (above normal total cholesterol) and among those treated for high cholesterol,
only 64.3% had achieved appropriate cholesterol control.96
Therefore, it is important to evaluate vascular risk factors when studying the association
between immigration status and stroke incidence and outcomes.
10 Confounders vs. mediators
When considering the pathways through which immigration status could be associated with
stroke incidence and outcomes, it is important to recognize that traditional vascular risk

15
factors such as smoking, alcohol use, sedentary behaviour, diet, hypertension, diabetes, and
dyslipidemia, and ethnicity can also be considered mediators, and not mere confounders.116
This is the case because these risk factors may be in the causal pathway of the association
between immigration status and stroke incidence and outcomes (mediator), for example, diet
has been shown to mediate the association between immigration and acculturation and
prevalence of diabetes117, and are also independently associated with both immigration status
and stroke incidence and outcomes (confounder). However, in the US, such traditional risk
factors only accounted for half of the excess stroke risk in Blacks compared to Whites118, and
similarly in Canada, traditional risk factors did not fully explain the observed variation in the
incidence of cardiovascular disease between different immigrants based on region of origin.21
Therefore, to understand the contribution of various risk factors on the observed associations
between immigrations status and outcomes of interest, this dissertation will report
unadjusted, age- and sex-adjusted, and fully adjusted associations between immigration
status and stroke incidence and outcomes. The fully adjusted outcomes will include
traditional vascular risk factors, when available. This dissertation will not attempt to address
whether the latter are mediators, confounders or both. Furthermore, interactions between
immigration status and vascular risk factors are also beyond the scope of this dissertation, but
will be considered in future research projects.
11 Why is it difficult to study immigrants?
11.1 Selection bias when studying immigrants
In an experimental study of new butterflies that were released into different habitat patches,
about 40% of the butterflies settled in a new patch during their lifetime (immigrated from
original patch), and the factors associated with lower rates of emigration included higher
density of butterflies, abundance of flowers, and large patch area. Female butterflies
emigrated earlier in their life and moved farther away than male butterflies, and the
emigrating butterflies were larger than those who stayed.119 Similar to animal studies, many
factors are responsible for human migration and vary based on factors related to individuals,
home countries, and host countries. While most human migration can be considered
16
controlled or planned, it can occur due to natural calamities (earthquakes, tsunami and
floods) or human-made calamities (war and persecution).
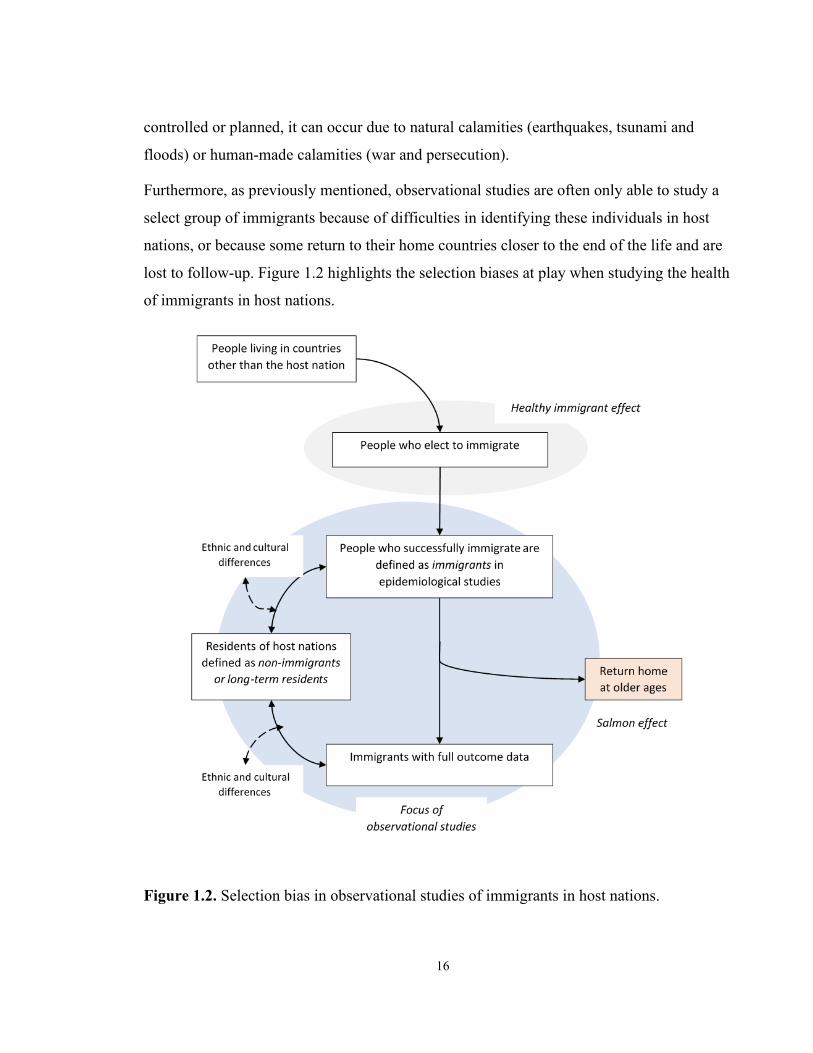
Furthermore, as previously mentioned, observational studies are often only able to study a
select group of immigrants because of difficulties in identifying these individuals in host
nations, or because some return to their home countries closer to the end of the life and are
lost to follow-up. Figure 1.2 highlights the selection biases at play when studying the health
of immigrants in host nations.
Figure 1.2. Selection bias in observational studies of immigrants in host nations.

17
11.2 Lack of randomized controlled trials
A natural experiment study of immigration via a random selection process (a lottery system)
found that the Tongan people who immigrated (randomly selected) to New Zealand had
higher rates of hypertension that persisted over time compared to those living in Tonga who
applied but were not randomized to immigrate to New Zealand.120 However, such natural
experiment studies in humans are rarely possible.
Thus, one has to rely on well-designed observational studies to evaluate the health effects of
immigration.
11.3 Lack of animal models
Studies on migratory birds found biological changes of pre-migratory hyperphagia and
obesity to act as an energy source for short- or long-range flights and support pre-migration
preparation in animals.121 However, unlike animals, migration in humans is not a biological
process alone, as many socioeconomic factors dictate who elects to migrate. Furthermore, the
lived experience of immigrants before and immediately after immigration is unique and
varies based on individual, environmental and social factors. This psychosocial impact of
immigration is difficult to evaluate using animal models.
12 Rationale for the research
For the reasons described above it is challenging to study the health of immigrants, yet it is
important to study the association between immigration status and stroke incidence, care and
outcomes because the number of immigrants will likely continue to increase world-wide and
the knowledge of this association will be helpful for host nations to plan allocation of health
care resources. This is especially important as immigrants are generally younger than the host
populations, and will contribute to the ageing population of host nations over time. Further,
immigration is both a consequence of the social determinants of health and a social
determinant of health in its own right. Thus, studying immigrant health in high-income
countries allows one to evaluate the impact of socioeconomic factors associated with being
an immigrant (for example age, sex, ethnicity, education) on maintaining or degrading health
upon immigration such that the observed associations can be applicable to broader

18
populations beyond immigrants.122 Finally, if ethnic differences in stroke incidence or
outcomes based on the country of origin of immigrants are identified, future work can focus
on understanding the social and biological factors driving these differences which can in turn
guide the development of targeted primary and secondary prevention measures.
13 Data sources
13.1 Administrative databases
Health administrative data are routinely collected health information, which include
information on acute care hospital admissions (Canadian Institutes of Health Information
Discharge Abstract Database) and same day surgery or emergency department (ED) visits
(National Ambulatory Care Reporting Systems). Diagnoses, including the main diagnosis –
the most resource intensive diagnosis – are included in these databases using International
Statistical Classification of Diseases and Related Health Problems 9th revision (ICD-9) and
10th revision (ICD-10) codes. These databases will be the primary source to identify incident
events of stroke or transient ischemic attack (TIA) (chapter 2).123 Using information from
hospitalizations alone to identify incident stroke or TIA has been shown to be excellent with
over 92% (95% CI 88-95) correct diagnoses, with kappa statistic of 0.89 (95% CI 0.82-
0.96).123 While this study did not report sensitivity or positive predictive value, another
study, using similar inpatient hospitalizations codes for incident stroke or TIA, reported a
sensitivity of 82.2% (95% CI 81.0-83.3) and a positive predictive value of 68.8% (95% CI
67.5-70.0).124 For prevalent cases, different from incident cases, we will further include
primary care or specialist physician visits where the final diagnosis code was in keeping with
a stroke or TIA. A combination of acute care, emergency department, and outpatient care
(one hospitalization or emergency department visit for stroke or TIA OR two (2) outpatient
physician claims of stroke or TIA within 365 days) has been shown to have moderate
sensitivity (68.0%; 95% confidence interval [CI] 60.5-75.5) and very high specificity
(98.9%; 95% CI 98.6-99.2) for the identification of prevalent stroke or TIA.125
We will also include the following databases, where relevant, to determine prevalence of risk
factors, receipt of outpatient or ambulatory care, or loss to follow-up: Registered Persons
Database (RPDB) to obtain demographic (date of birth, sex, date of death and date of last

19
health system contact) information on people who have ever received provincial health
coverage; National Rehabilitation Reporting System (NRRS) to capture outpatient or
inpatient rehabilitation received at a designated rehabilitation centre; Ontario Drug Benefit
database (ODB) to identify prescription claims; Ontario Health Insurance Plan (OHIP)
Claims database to determine eligibility of receipt of provincial health insurance plan and to
identify outpatient physician visits; Ontario Laboratories Information System (OLIS) for
laboratory results; the Postal Code Conversion File (PCCF) to permit linkage to the Canada
Census database to determine neighbourhood-level income; and the death registry and the
Office of the Registral General Database (ORGD) to provide information on deaths and
cause of death.
These databases are held securely at ICES (formerly the Institute for Clinical Evaluative
Sciences) and are linked using unique encoded identifiers. ICES has developed its own
validated cohort algorithms to identify people with hypertension126, diabetes127, chronic
obstructive pulmonary artery disease128, and congestive heart failure129. We will use these
algorithms to identify the prevalence of these conditions in our cohorts, as well as similar
validated algorithms for dyslipidemia130 and atrial fibrillation131. Please see Table 1.1 for
details on definitions of various outcomes and covariates.
13.2 Ontario Stroke Registry
The Ontario Stroke Registry (OSR) is a province-wide registry that includes data on all
consecutive stroke patients seen at regional stroke centres in Ontario between 2003 to 2013,
as well as on a population-based simple random sample of patients seen at all other
institutions across the province of Ontario.132 Data collection was performed by chart
abstractors with neurological expertise, with the final diagnosis and other data elements
obtained through review of clinical and neuroimaging data. Validation by duplicate chart
abstraction has shown excellent agreement for key variables in the OSR.132 The registry
collected information on pre-hospital care (arrival by ambulance, time from symptom onset
to hospital arrival, care received at a regional stroke centre), hyperacute stroke care (hospital
arrival to brain imaging, results of brain imaging, receipt of thrombolysis, door-to-needle
time, admission to intensive care unit, admission to stroke unit) and in-hospital care (vessel

20
imaging and results, whether a swallowing assessment was performed, prescription of
antihypertensive, antiplatelet or anticoagulants on discharge in patients with ischemic stroke,
duration of hospitalization, and in-hospital complications, including pneumonia and deep
vein thrombosis). It also included clinical information such as the National Institutes of
Health Stroke Scale (NIHSS), side of stroke, type of stroke, and modified Rankin Scale
(mRS) on discharge. The registry has been used previously to identify sex differences in care
and outcomes following stroke133, to evaluate the effect of socioeconomic status on stroke92,
and to evaluate factors associated with in-hospital complications such as pneumonia134, and
percutaneous endoscopic gastrostomy (PEG)135. We will use data from the registry to
evaluate acute stroke care, disability on discharge, and long-term outcomes following
ischemic stroke (chapters 3 and 4).
13.3 Surname algorithm
Unlike the United Kingdom136 and the United States84 where data on ethnicity or race are
collected in hospital-based records, Canada does not collect these data at the time of
hospitalization or at the time of application of provincial health insurance coverage. Thus, we
will use a surname algorithm developed by ICES to classify the Ontario population (both
immigrants and long-term residents) into three ethnic groups: South Asian, Chinese and
other.137 Among long-term residents, the “other” category is mainly comprised of
Caucasians. As per the 2016 Census Report, of the 3.8 million (29.3% of Ontario’s
population) people residing in Ontario who self-identified as visible minority, 29.6% were of
South Asian ethnicity (Indian, Pakistani, Sri Lankan, or Bangladeshi) and 19.4% were of
Chinese ethnicity (people from China, Taiwan, Hong Kong or Macau). These two ethnic
groups constituted the most common non-Caucasian ethnic groups in Ontario followed by
Black (16.2%), Filipino (8.6%), and Arab (5.4%) ethnicity.10 Indigenous peoples constituted
2.8% of Ontario’s population. The positive predictive value using the surname algorithm
compared to the self-reported ethnicity on survey data was 89.3% for South Asian ethnicity
and 91.9% for Chinese ethnicity. The algorithm has low sensitivity (50.4% for South Asian
and 80.2% for Chinese), and thus, should be used with caution when evaluating the
proportion of people with a certain ethnicity in a disease cohort.137

21
13.4 Immigration Refugee and Citizenship Canada database
Immigration Refugee and Citizenship Canada (IRCC) is a federal agency overseen by the
Ministry of Immigration that reviews immigration applications and selects the immigrants
that meet Canadian immigration requirements. The IRCC’s permanent resident database
containing the Ontario portion is available for use at ICES. This includes records of people
who landed in Ontario; immigrants who initially landed in another province, but eventually
resided in Ontario are not included in the IRCC. The start date for these records is January 1,
1985. The database contains information on country of citizenship at the time of immigration
application, immigration class (economic, family class, or refugee class), age at the time of
arrival, and year of arrival. Economic immigrants are those who arrived through the points-
based scoring system, family class immigrants are those who arrived based on family
reunification procedures, and refugee class immigrants are those who arrived as refugees.
Overall, 85% of records in the IRCC can be matched to ICES administrative databases, either
using deterministic, or, when not possible, probabilistic linkage. There is no variation in the
success of this match based on age or sex.
14 Defining immigration status in Ontario
We will obtain records of immigrants arriving to Ontario from the IRCC’s permanent
resident database. We will define immigrants as those born of outside of Canada who became
permanent residents after January 1, 1985, whereas those born in Canada or those who
arrived in Ontario prior to January 1, 1985 will be considered long-term residents. Thus, the
latter group will include both Canadian born and, because the cohort start date for this
dissertation was 2003, those immigrants who have lived in Ontario for 18 years or more. Our
data sources do not allow us to identify those immigrants not included in the IRCC database
(asylum seekers, migratory workers, and people awaiting refugee hearings). If eligible for
provincial health insurance, some of these immigrants will be misclassified as long-term
residents; however, we assume that they will represent a small proportion of long-term
residents.
Because we are interested in the ethnic origin of immigrants, we will use the country of
citizenship at the time of immigration and classify the immigrant group into the following

22
categories to group them in world regions that could represent similar ethnicities: Western
countries, Africa, Caribbean, East Asia, Latin America, Middle East, and South Asia (see
Table 1.2 for list of countries included in each region).
Table 1.1. Definitions of variables included in this dissertation.
Variable Type Definition Data
source
Chapters
that used
this
variable
Exposures of
interest
Immigration status Binary Immigrants – born outside of Canada and
moved after January 1, 1985
Long-term residents – Canadian born or
those who moved to Canada before
January 1, 1985
IRCC All chapters
Among immigrants
only
Time since
immigration
Categorical <5, 5 to 10 years, and > 10 years IRCC All chapters
Age at arrival Categorical < 25, 25 to 50 years, and > 50 years IRCC All chapters
Immigration class Categorical Family or other – people who immigrated
under the family reunification program of
immigration
Economic – people who immigrated
based on points-based system of
immigration
IRCC All chapters

23
Refugee – people who immigrated based
on humanitarian grounds of immigration
Region of origin Categorical See details in Table 1.2 IRCC All chapters
Ethnicity Categorical Chinese – people from or having ancestry
in China, Hong Kong, Macau, or Taiwan
South Asian – people from or having
ancestry in India, Pakistan, Sri Lanka or
Bangladesh
Other – not belonging to either of above
two categories
Surname
algorithm
4
Outcomes of
interest
Incident stroke or
transient ischemic
attack (TIA)
Binary Hospitalization or emergency department
with a corresponding ICD-10 code in the
main diagnostic field: H34.1, G45.x
excluding G45.4, I60.x excluding I60.8,
I61, I63, I64.
CIHI-
DAD or
NACRS
2
Incident ischemic
stroke
Binary Hospitalization or emergency department
with a corresponding ICD-10 code in the
main diagnostic field: H34.1, I63, I64
CIHI-
DAD or
NACRS
2 & 4
Incident
intracerebral
hemorrhage
Binary Hospitalization or emergency department
with a corresponding ICD-10 code in the
main diagnostic field: I61
CIHI-
DAD or
NACRS
2 & 4
Incident
subarachnoid
hemorrhage
Binary Hospitalization or emergency department
with a corresponding ICD-10 code in the
main diagnostic field: I60 excluding I60.8
CIHI-
DAD or
NACRS
2

24
modified Rankin
scale
Categorical Based on chart review
0 = no disability
1 = No significant disability despite symptoms; able to carry out all usual duties and activities
2 = Slight disability; unable to carry out
all previous activities, but able to look
after own affairs without assistance
3 = Moderate disability; requiring some
help, but able to walk without assistance
4 = Moderately severe disability; unable
to walk and attend to bodily needs
without assistance
5 = Severe disability; bedridden,
incontinent and requiring constant
nursing care and attention
6 = dead
OSR 3
Disabled on
discharge
Binary mRS between 3 and 5 – measured on the
day of discharge
OSR 3
Death Binary Along with date of death RPBD All chapters
Vascular event
recurrence
Binary Incident stroke (composite of ischemic
stroke or intracerebral hemorrhage)
identified based on the code reported
above OR
Incident MI (ICD 10: I21 or I22)
CIHI-
DAD or
NACRS
4
Stroke recurrence Binary Incident stroke (composite of ischemic
stroke or intracerebral hemorrhage)
identified based on the code reported
above
CIHI-
DAD or
NACRS
4

25
Cardiovascular
mortality
Binary Death in patients with the following ICD
code as the most likely cause of death:
I20-25or I60-69 (cardio) or I63, I64,
H34.1
OGRD 4
Process measures
Arrival by
ambulance
Binary
Chart review OSR 3
Times from last
seen normal to
arrival in hospital
(in hours)
Continuous
Type of
cerebrovascular
event – ischemic
stroke vs. TIA
Categorical
Patients with TIA
admitted to an
inpatient unit
Binary
Received
thrombolysis
Binary
Reason for no
thrombolysis – too
late
Binary
Palliative status Binary
Length of stay Continuous

26
National Institutes
of Health Stroke
Scale (NIHSS)
Continuous
Carotid imaging Binary
Dysphagia
screening
Stroke unit care
Echocardiography
Holter monitor
Anti-platelet or anti-
coagulant agent on
discharge
Anti-hypertensive
agent on discharge
Lipid-lowering
agent on discharge
Secondary stroke
preventive care
Receipt of test for
HbA1 or LDL
Binary Test results included in provincial
laboratory database
OLIS 4
Met target for
HbA1c or LDL
Binary If they reach the target as defined in the
text
OLIS 4
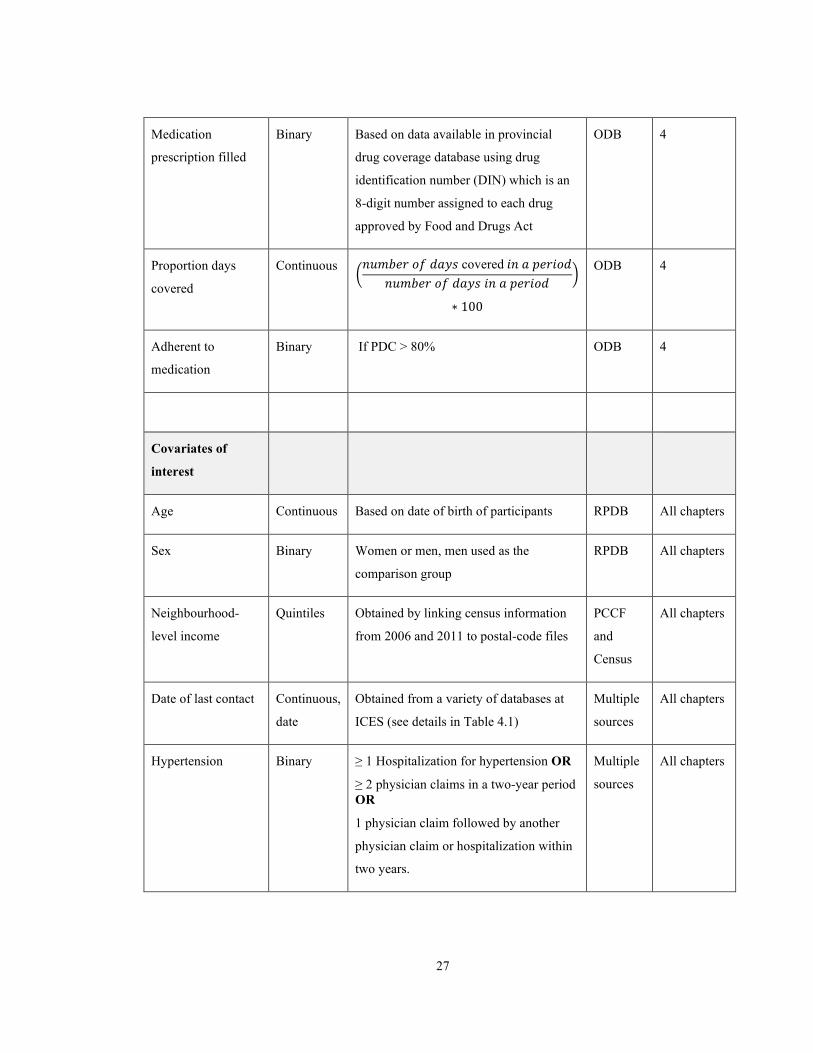
27
Medication
prescription filled
Binary Based on data available in provincial
drug coverage database using drug
identification number (DIN) which is an
8-digit number assigned to each drug
approved by Food and Drugs Act
ODB 4
Proportion days
covered
Continuous �𝑛𝑛𝑛𝑛𝑛𝑛𝑛𝑛𝑛𝑛𝑛𝑛 𝑜𝑜𝑜𝑜 𝑑𝑑𝑑𝑑𝑑𝑑𝑑𝑑 covered 𝑖𝑖𝑛𝑛 𝑑𝑑 𝑝𝑝𝑛𝑛𝑛𝑛𝑖𝑖𝑜𝑜𝑑𝑑
𝑛𝑛𝑛𝑛𝑛𝑛𝑛𝑛𝑛𝑛𝑛𝑛 𝑜𝑜𝑜𝑜 𝑑𝑑𝑑𝑑𝑑𝑑𝑑𝑑 𝑖𝑖𝑛𝑛 𝑑𝑑 𝑝𝑝𝑛𝑛𝑛𝑛𝑖𝑖𝑜𝑜𝑑𝑑�
∗ 100
ODB 4
Adherent to
medication
Binary If PDC > 80% ODB 4
Covariates of
interest
Age Continuous Based on date of birth of participants RPDB All chapters
Sex Binary Women or men, men used as the
comparison group
RPDB All chapters
Neighbourhood-
level income
Quintiles Obtained by linking census information
from 2006 and 2011 to postal-code files
PCCF
and
Census
All chapters
Date of last contact Continuous,
date
Obtained from a variety of databases at
ICES (see details in Table 4.1)
Multiple
sources
All chapters
Hypertension Binary ≥ 1 Hospitalization for hypertension OR
≥ 2 physician claims in a two-year period OR
1 physician claim followed by another
physician claim or hospitalization within
two years.
Multiple
sources
All chapters

28
Diabetes Binary ≥ 3 physician diagnostic code (250) in a
one-year period
Multiple
sources
All chapters
Chronic obstructive
pulmonary disease
(COPD)
Binary ≥1 Hospitalization for COPD OR
≥ 3 physician claims in a two-year period
Multiple
sources
2
Charlson
comorbidity index
Continuous ICES-derived scale (described in detail in
the text section 6.1 in Chapter 3)
Multiple
sources
All chapters
Congestive heart
failure (CHF)
Binary ≥ 1 Hospitalization OR
1 physician claim in emergency visit or
outpatient clinic, followed by ≥ 1
Hospitalization, ER visit, or physician
claim within one year.
Multiple
sources
2
Binary Based on chart review OSR 3, 4
Dyslipidemia Binary Based on OLIS database:
Levels above the threshold (2.5 mg/dL) will be considered to have hyperlipidemia OR
ODB claims for one of the statins (using
DIN list)
Multiple
sources
2
Based on chart review OSR 3, 4
Atrial fibrillation Binary 1 hospitalization (CIHI-DAD) or 1 emergency room visit (NACRS/SDS), ICD-10 (2002 onwards) – I48; ICD-9 (pre-2002) – 427.31 or 427.32 OR
cardioversion (without physician billing
codes) – using billing code Z437
Multiple
sources
2
Binary Based on chart review OSR 3, 4
Stroke or TIA
prevalence
Binary
one hospitalization or emergency
department visit for stroke or TIA (using
ICD-9 or ICD-10 codes) OR
CIHI-
DAD,
2

29
two outpatient physician claims of stroke
or TIA within 365 days (OHIP specific
diagnostic codes)
NACRS
or OHIP
Prior stroke or TIA Binary Based on chart review OSR 3, 4
Dementia Binary
Chart review OSR 3, 4
Coronary artery
disease
Binary
Current smoking Binary
Chronic kidney
disease
Binary
Cancer Binary
Teaching hospital Binary
Language fluency Binary
Abbreviations: IRCC – Immigration Refugee and Citizenship Canada; OSR – Ontario Stroke Registry; PCCF –
Postal Code Conversion File; RPDB – Registered Person’s Database; CIHI-DAD – Canadian Institute of Health
Information-Discharge Abstract Database; NACRS – National Ambulatory Care Reporting System; ORGD –
Office of Registrar General-Deaths; OLIS – Ontario Laboratories Information System.

30
Table 1.2. List of countries in each region selected.
World region Countries included
Africa Angola, Republic of Benin, Republic of Botswana, Burkina-Faso,
Burundi, Federal Republic of Cameroon, Republic of Central African
Republic, Chad, Comoros, the Democratic Republic Congo, People's
Republic of the Djibouti, Equatorial Guinea, Eritrea, Ethiopia, Gambia,
Ghana, Republic of Guinea, Guinea-Bissau, Republic of Ivory Coast,
Kenya, Lesotho, Liberia, Madagascar, Malawi, Republic of Mali, Republic
of Mauritania, Mauritius, Mayotte, Mozambique, Namibia, Republic of the
Niger, Nigeria, Rwanda, Sao Tome and Principe, Sao Tome E Principe,
Senegal, Seychelles, Sierra Leone, Democratic Republic of Somalia,
Republic of South Africa, Republic of South Sudan, Swaziland, United
Republic of Tanzania, Republic of Togo, Uganda, Zambia, Zimbabwe.
Caribbean , Bermuda, Jamaica, Republic of Trinidad and Tobago, Barbados,
Anguilla, Antigua and Barbuda, The Bahama Islands, Cayman Islands,
Dominica, Grenada, Nevis, St. Kitts-Nevis, St. Lucia, St. Vincent and the
Grenadines, Turks and Caicos Islands, British Virgin Islands, Cuba,
Dominican Republic, Guadeloupe, Haiti, Martinique, US Virgin Islands,
Aruba, Guyana, Surinam, French Guiana, Cape Verde Islands, St. Helena,
Sint-Maarten
East Asia Gabon Republic, Macau Sar, People's Republic of China, Taiwan, Hong
Kong, Japan, Republic of Indonesia, Philippines, Myanmar (Burma),
Malaysia, Singapore, Brunei, Cambodia, People's Democratic Republic of
Korea, Republic of Korea, Laos, People's Republic of Mongolia, Thailand,
Tibet, Socialist Republic of Vietnam, Nauru, Papua New Guinea, Fiji,
New Caledonia, Vanuatu, The Solomons, Soloman Islands, Tuvalu,
Kiribati, Guam, Republic of The Marshall Islands, Federated States of
Micronesia, Republic of Palau, Cook Islands, Wallis And Futuna, Pitcairn
Island, American Samoa, Western Samoa, French Polynesia, Tonga,
Reunion, Macau, Commonwealth of the Northern Mariana Islands,
Democratic Republic of East Timor
Latin America Mexico, Belize, Costa Rica, El Salvador, Guatemala, Honduras,
Nicaragua, Republic of Panama, Panama Canal Zone, Puerto Rico,

31
Argentina, Brazil, Chile, Colombia, Peru, Uruguay, Venezuela, Bolivia,
Ecuador, Paraguay, Falkland Islands, Cape Verde Islands.
Middle East Turkey, Armenia, Azerbaijan, Georgia, Kazakhstan, Kyrgyzstan,
Tajikistan, Turkmenistan, Uzbekistan, Israel, Lebanon, Syria, Palestinian
Authority (Gaza/West Bank), Cyprus, Iran, Iraq, Jordan, Kuwait, Saudi
Arabia, Bahrain, Oman, Qatar, Republic of Yemen, People's Democratic
Republic of Yemen, United Arab Emirates, Egypt, Algeria, Morocco,
Tunisia, Libya, Western Sahara, Democratic Republic of Sudan.
South Asia Sri Lanka, India, Pakistan, Bangladesh, Afghanistan, Bhutan, Nepal
Western countries United Kingdom, Austria, Belgium, Luxembourg, Czechoslovakia, Czech
Republic, Slovak Republic, Denmark, Estonia, Latvia, Lithuania, Finland,
France, Germany, Greece, Hungary, Republic of Ireland, Italy, Malta, The
Netherlands, Norway, Poland, Portugal, Azores, Madeira, Spain, Canary
Islands, Sweden, Switzerland, Union of Soviet Socialist Republics,
Croatia, Yugoslavia, Slovenia, Bosnia-Herzegovina
Belarus, Moldova, Russia, Ukraine, Serbia and Montenegro, Republic of
Serbia, Republic of Montenegro, Republic of
Kosovo, Macedonia, Albania, Andorra, Bulgaria, Gibraltar, Iceland,
Liechtenstein, Monaco, Romania, San Marino, Holy See, Australia, New
Zealand, United States of America, Greenland, Montserrat, England,
British Overseas Citizen, Northern Ireland, Scotland, Wales, Channel
Islands, Cyprus, Belize
All data analyses will be performed using SAS 9.4 © 2002-2012 by SAS Institute Inc., Cary,
NC, USA.

32
15 Research Questions
15.1 Stroke incidence
What is the association between immigration status and the incidence of stroke in adults (age
> 18 years) residing in Ontario, Canada?
Hypothesis
We hypothesize that immigrants will have a lower risk of stroke than long-term residents;
however, this association will vary based on country of origin.
15.2 Acute care and outcomes on discharge
Are there differences in the quality of acute stroke care and disability on discharge following
ischemic stroke in immigrants and long-term residents seen at acute care hospitals in Ontario,
Canada?
Hypothesis
We hypothesize that there will be a delay in stroke onset to arrival time for immigrants
compared to long-term residents, but there will be no differences in the quality of acute
stroke care or disability on discharge following ischemic stroke between immigrants and
long-term residents.
15.3 Long-term outcomes and secondary stroke preventive care
Following an ischemic stroke, do long-term outcomes of all-cause mortality and vascular
event recurrence and secondary stroke preventive care vary between immigrants and long-
term residents in Ontario, Canada?
Hypothesis
We hypothesize that the long-term outcomes of all-cause mortality and vascular event
recurrence, and secondary stroke preventive following ischemic stroke will not vary between
immigrants and long-term residents.

33
Chapter 2 Immigration Status and Stroke incidence

34
1 Overview
This chapter will compare the incidence of stroke and stroke types in immigrants and long-
term residents using administrative databases.
2 Research Questions
1. Does the incidence of stroke and stroke subtypes vary between immigrants and
long-term residents?
2. Does the association between immigration status and stroke incidence vary by age,
country of origin of immigrants, and immigration class?
3 Study population
We identified all Ontario residents aged 18 to 105 years on January 1, 2003 (cohort start
date) who were eligible for the provincial health insurance plan on this date and in the year
prior using the provincial registered person’s database. We excluded people residing in a
long-term care home in the 5 years prior to the cohort start date and those with a history of
stroke or transient ischemic attack in the 12 years prior to the cohort start date (using a stroke
prevalence algorithm: hospital or emergency department visit with a diagnosis of stroke or
TIA OR two (2) physician claims within 365 days with corresponding diagnostic code for
stroke or TIA, details in Table 1.1).124 Given that over 95% of immigrants reside in urban
areas of the province, we excluded those living in non-urban areas (defined as those residing
in a Canadian Census-defined geographic area with a population of less than 10,000
residents).
Using unique identifiers, we linked these individuals to administrative databases that are held
securely at ICES. We obtained information on age, sex, neighbourhood-level income from
population-based registry, census and postal-code files (see Table 1.1 for details). We also
obtained information on comorbidities such as hypertension126, diabetes127, dyslipidemia,
atrial fibrillation131, chronic obstructive pulmonary disease (COPD)128 and congestive heart
failure (CHF)129 using validated algorithms (Table 1.1).

35
4 Exposure of interest
We defined immigrants as those born outside of Canada who became permanent residents
between January 1, 1985 and the cohort start date, whereas those born in Canada or those
who arrived in Ontario prior to 1985 were considered long-term residents.
5 Outcomes of interest
Our primary outcome was occurrence of first-ever stroke, defined as an emergency
department visit or an admission to an acute care hospital with the main diagnosis (most
resource intensive diagnosis) of stroke, composite of ischemic stroke (ICD-10 code: ischemic
stroke (H34.1, I63.x, I64.x), intracerebral hemorrhage (I61.x) or subarachnoid hemorrhage
(I60.x, excluding I60.8) or TIA (G45.x excluding G45.4). This definition has a high
sensitivity and specificity.123 We elected to include “stroke, not otherwise specified” (I64.x)
in the definition of ischemic stroke because after the directive from the Canadian Stroke
Strategy in 2010, there was a reduction in the use of this code (almost halved) with a
corresponding increase in the prevalence of ischemic stroke (I63.x), suggesting that with
provision of brain imaging for all patients seen in emergency room or hospitalized, it was
clear that that I64.x was possibly incorrectly used in patients with ischemic stroke.124 Further,
when the algorithm using ICD-10 codes (including I64.x in ischemic stroke) were compared
to medical chart review, they were found to have a positive predictive value of over 85%.123
We included TIA and emergency department visits as well as hospitalizations to minimize
the impact of differential care-seeking behaviours and admission thresholds for minor events.
The secondary outcomes were stroke subtypes of ischemic stroke, intracerebral hemorrhage,
and subarachnoid hemorrhage, and TIA. If an individual had more than one event during
follow-up, we included the first event in the primary analyses. We set the date of end of
follow-up as March 31, 2018.

36
6 Statistical Analysis
6.1 Primary analyses
We reported standardized differences to compare baseline characteristics between
immigrants and long-term residents. Standardized differences express the difference in
means or prevalence between two populations as a proportion of the pooled standard
deviation. We used the convention that standardized differences greater than 0.10 are
considered to reflect a meaningful difference.138
We used age as the time-scale in the survival analyses to account for the differential age of
cohort participants at the start of the cohort.139 Thus, the unadjusted estimates from such
models can be considered age-adjusted. We used cause-specific Cox proportional hazards
models to calculate the unadjusted and adjusted hazard ratio (HR) of stroke or TIA in
immigrants compared to long-term residents, adjusting for sex, neighbourhood-level income,
hypertension, diabetes, dyslipidemia, atrial fibrillation, CHF and COPD. These models
accounted for the competing risk of death and censored subjects at the end of the study
period or at time of emigration (if alive and event free).140 We obtained information
regarding date of death through linkage to the death registry and that of loss to follow-up
using multiple databases. We repeated the above analyses for each stroke subtype (ischemic
stroke, intracerebral hemorrhage and subarachnoid hemorrhage) and TIA separately.
Why use age as time-scale?
Conventionally, the time-scale used in survival analysis (or time to event analysis) is time on
study, measured from the start date of the study to the end of the study. An alternate
approach is to consider age of the participants as a time-scale, with change in the age of the
participants from the start of the study to the end of the study considered as time elapsed.
This approach was compared to the traditional approach by Korn et al. and they suggested
that using length of follow-up (or time on study) as the time scale was “incorrect” when there
is a wide age distribution of study participants at the start of the study.139 They reported that
using age as time-scale accounted for the age effects of an exposure on the disease incidence
and adjusted for age in the analyses in contrast to adding age as a covariate when using time
on study as the time-scale. As an advantage, using age as a time-scale could better account
37
for the left-censoring of the study participants compared to traditional methods.139 Given that
we included all urban Ontario residents, the cohort participants’ age had a significantly large
variation with some being 80 years and older and others being only 18 years old at cohort
start date. In order to account for this wide age range at cohort start date, as well as the
younger average age of immigrants compared to long-term residents, we used age as the
time-scale when analyzing the risk of the outcome of interest during a set follow-up time.
6.2 Secondary analyses
Effect of age
Given the differences in the age distribution between immigrants and long-term residents in
our cohort and to evaluate the age-dependent effect of immigration status on the incidence of
stroke or TIA, we calculated piecewise unadjusted and adjusted HRs of stroke or TIA and
stroke subtypes in immigrants compared to long-term residents in the following age groups:
18-29, 30-39, 40-49, 50-59, 60-69, 70-79, and 80 years or more. We adjusted for the
following variables in the adjusted analyses: sex, neighbourhood-level income, hypertension,
diabetes, dyslipidemia, atrial fibrillation, CHF and COPD.
Country of origin, immigration class, and acculturation
Based on their country of citizenship prior to arrival, we classified immigrants into seven
major world regions: Western countries, Africa, Caribbean, Middle East, Latin America, East
Asia, and South Asia (Table 1.2 for details on classification).141 We calculated the adjusted
cause-specific HR of stroke or TIA in immigrants from each of these seven world regions
compared to long-term residents. We conducted similar analyses for ischemic stroke and
intracranial hemorrhage separately.
We created three separate multivariable cause-specific hazards models to evaluate the effect
of immigration class (refugee, economic or family class or other), time since arrival (> 5
year, 5 to 10 year, and ≥ 10 years), and age at arrival (< 25 years, 25-50 years, and ≥ 50
years) on the outcome of incident stroke or TIA. Time since arrival and age at arrival were
considered proxies for the acculturation effect. In each of these three models, long-term
residents were compared to immigrants using the immigration-related variable, separately.

38
7 Results
7.1 Baseline characteristics
We included 8 090 524 urban Ontario residents aged 18 years or over without a prior history
of stroke or TIA. Of these, 1 216 557 (15.0%) were immigrants (Figure 2.1). Immigrants
were younger (median age at cohort start 39 vs. 44 years, P < 0.001), more likely to reside in
low-income neighbourhoods (34.5% vs. 18.9%, P < 0.001), and less likely to have
comorbidities at baseline compared to long-term residents (Table 2.1).
7.2 Incidence of stroke and stroke subtypes
During 109 million-years of follow-up, we observed 235 336 TIA or stroke events.
Compared to long-term residents, and using age as the time scale, the occurrence of the
competing event of death was less common in immigrants (adjusted HR 0.46, 95%
confidence interval 0.45-0.68), whereas loss to follow-up was more common in immigrants
(adjusted HR 1.23, 95% CI 1.22-1.23). Immigrants were younger at the time of the stroke or
TIA (median age 67 vs. 74 years, P < 0.001). Of the event types, ischemic stroke was the
most common followed by TIA, intracranial hemorrhage and subarachnoid hemorrhage
(Table 2.2).
Compared to long-term residents, immigrants had a lower crude incidence rate of stroke or
TIA (10.9 vs. 24.5 per 10,000 person-years), and a lower crude hazard of stroke or TIA (HR
0.67, 95% CI 0.66-0.68), and this did not alter after accounting for sex, neighbourhood-level
income and comorbidities (adjusted HR 0.67, 95% CI 0.66-0.68) (Table 2.2). In the adjusted
analyses, compared to long-term residents, the reduction in the adjusted hazard in immigrants
was greater for TIA (HR 0.53, 95% CI 0.51-0.54) than for ischemic stroke (HR 0.71, 95% CI
0.69-0.72), subarachnoid hemorrhage (HR 0.86, 95% CI 0.81-0.91) or intracranial
hemorrhage (HR 0.89, 95% CI 0.85-0.93) (Table 2.2). Figures 2.2 to 2.6 highlight the non-
linear age-dependent effect of immigration status on the incidence of stroke or TIA and
subtypes, with lower adjusted HRs in immigrants compared to long-term residents with
increasing age.

39
7.3 Country of origin and acculturation
Most immigrants to Ontario arrived from three regions: Western countries (i.e., Europe,
USA, Australia or New Zealand) (28.2%), South Asia (20.0%), and East Asia (18.1%) (Table
2.1). Table 2.1 also shows the baseline characteristics of immigrants by region of origin.
The difference in the adjusted hazard of stroke or TIA between immigrants from Africa (HR
0.80, 0.74-0.85), the Caribbean (HR 0.95, 95% CI 0.91-1.00) or Latin America (HR 0.86,
95% CI 0.82-0.91) and long-term residents (comparison group) was less pronounced than
that for other immigrants, and this was true for both ischemic stroke and intracranial
hemorrhage (Figure 2.7). Immigrants from East Asia had a lower adjusted hazard of ischemic
stroke (HR 0.63, 95% CI 0.60-0.66) compared to long-term residents but a higher adjusted
hazard of intracranial hemorrhage (HR 1.09, 95% CI 1.00-1.19) (Figure 2.7). The adjusted
HR of stroke or TIA in immigrants compared to long-term residents based on country of
origin of the top 1% countries of origin (based on number of stroke/TIA events) is shown in
Figure 2.8.
Most immigrants in Ontario were economic migrants (43.8%), and the median age at arrival
was 30 years (Q1-Q3, 23-39 years), with a median duration of residence in Ontario of 9 years
(Q1-Q3, 5-12 years). The difference in the adjusted rate of stroke or TIA in immigrants
compared to long-term residents was less pronounced for refugees (HR 0.91, 0.88-0.94) than
economic immigrants (HR 0.65, 95% CI 0.63-0.67) or family class immigrants (HR 0.64,
95% CI 0.63-0.66) (Table 2.3). Acculturation measured using age at arrival showed that,
compared to long-term residents, immigrants who were older than 50 years at the time of
immigration had a greater reduction in adjusted the hazard of stroke or TIA (HR 0.60, 95%
CI 0.59-0.61) than immigrants who were younger than 25 years at the time of immigration
(HR 0.86, 95% CI 0.81-0.92). There was a modest variation in the hazard of stroke or TIA in
immigrants compared to long-term residents based on time since arrival (Table 2.3).

40
Table 2.1. Baseline characteristics of immigrant and long-term residents in Ontario, Canada at the start of cohort (January 1, 2003).
Characteristics World region of immigrants All immigrants Long-term
residents Africa
Caribbean
East Asia
Latin
America
Middle East
South Asia
Western
countries
Total 57 960 86 916 220 715 93 226 104 901 243 843 344 256 1 216 557 6 873 967
Median age (Q1-Q3) 37 (28-45) 37 (29-46) 39 (32-48) 38 (29-47) 38 (30-47) 37 (29-48) 40 (31-48) 39 (31-48) 44 (32-57)
Female, n (%) 28,832 (49.7) 46,350 (53.3) 122,729 (55.6) 46,644 (50.0) 47,981 (45.7) 117,278 (48.1) 174,843 (50.8) 614 515 (50.5) 3 526 608 (51.3)
Neighbourhood-level
income, n (%)
Lowest quintile 28,825 (49.7) 36,951 (42.5) 73,471 (33.3) 36,936 (39.6) 35,341 (33.7) 98,944 (40.6) 87,144 (25.3) 420 112 (34.5) 1 300 077 (18.9)
Highest quintile 4,916 (8.5) 4,494 (5.2) 21,440 (9.7) 6,401 (6.9) 13,467 (12.8) 13,231 (5.4) 54,279 (15.8) 124 775 (10.3) 1 445 937 (21.0)
Comorbidities, n (%)
Hypertension 6,726 (11.6) 14,128 (16.3) 27,109 (12.3) 11,458 (12.3) 10,617 (10.1) 32,746 (13.4) 33,827 (9.8) 148 859 (12.2) 1 356 624 (19.7)
Diabetes 3,117 (5.4) 6,346 (7.3) 9,538 (4.3) 5,951 (6.4) 4,903 (4.7) 21,552 (8.8) 10,011 (2.9) 66 474 (5.5) 433 368 (6.3)
Dyslipidemia 245 (0.4) 360 (0.4) 621 (0.3) 582 (0.6) 761 (0.7) 1,779 (0.7) 1,446 (0.4) 6 192 (0.5) 94 864 (1.4)
Atrial fibrillation 128 (0.2) 210 (0.2) 657 (0.3) 295 (0.3) 591 (0.6) 607 (0.2) 1,639 (0.5) 4 634 (0.4) 97 458 (1.4)
CHF 255 (0.4) 473 (0.5) 733 (0.3) 559 (0.6) 678 (0.6) 1,558 (0.6) 1,703 (0.5) 6 468 (0.5) 110 738 (1.6)
COPD 1,054 (1.8) 1,317 (1.5) 4,781 (2.2) 2,211 (2.4) 2,074 (2.0) 3,947 (1.6) 7,080 (2.1) 25 183 (2.1) 390 139 (5.7)
n = total number; % = proportion; Q1-Q3 = first and third quartile; age is in years; CHF – congestive heart failure; COPD – chronic obstructive pulmonary disease.

41
Table 2.2. Association between immigration status and incidence of stroke or TIA in Ontario, Canada between 2003 and 2018 (median follow-up of 15 years).
Immigrants
n = 1 216 557
Long-term residents
n = 6 873 967
Unadjusted HR
(95% CI)
Adjusted HR
(95% CI)
Stroke or TIA 18 173 (10.9) 217 163 (23.4) 0.67 (0.66-0.68) 0.67 (0.66-0.68)
Stroke subtypes
Ischemic stroke 11 604 (7.0) 135 377 (14.6) 0.71 (0.70-0.72) 0.71 (0.69-0.72)
Intracranial hemorrhage 4 959 (3.0) 78 289 (8.4) 0.89 (0.85-0.92) 0.89 (0.85-0.93)
TIA 2 436 (1.5) 22 198 (2.4) 0.52 (0.50-0.53) 0.53 (0.51-0.54)
Subarachnoid
hemorrhage 1 312 (0.8) 9 858 (1.1) 0.87 (0.82-0.92) 0.86 (0.81-0.91)
Hazard ratio (HR) and confidence interval (CI) obtained using cause-specific hazards models using age as time-scale, and
adjusted estimates obtained after adjusting for sex, neighbourhood-level income, and comorbidities (hypertension, diabetes,
dyslipidemia, atrial fibrillation, congestive heart failure, and chronic obstructive pulmonary disease); values in parenthesis
represent crude incidence rate per 10,000 person-years, with incidence defined as emergency room visit or hospitalization
for outcome of interest using corresponding ICD-10 code.

42
Table 2.3. Risk of stroke or transient ischemic attack in immigrants compared to long-term resident based on immigration-related factors.
N n
(rate per 10,000
person-years)
Adjusted HR
(95% CI)
Long-term residents
(comparison group)
6 873 967 217 163 (23.4) 1.00
Age at arrival
< 25 years 360 932 2916 (2.0) 0.86 (0.81-0.92)
25 to 50 years 714 241 5365 (8.6) 0.75 (0.74-0.77)
> 50 years 141 384 9892 (49.3) 0.60 (0.59-0.61)
Time since arrival
< 5 years 279 633 996 (7.9) 0.75 (0.73-0.78)
5 to 10 years 385 455 8575 (10.1) 0.64 (0.62-0.65)
≥ 10 years 551 469 8602 (12.9) 0.68 (0.66-0.69)
Immigration class
Family or other 487 215 10 446 (6.8) 0.64 (0.63-0.66)
Refugee 196 480 2816 (15.7) 0.91 (0.88-0.94)
Economic 532 862 4911 (10.3) 0.65 (0.63-0.67)
Hazard ratio (HR) and confidence interval (CI) obtained using cause-specific piecewise hazards models using age as time-
scale, and adjusted estimates obtained after adjusting for sex, neighbourhood-level income, and comorbidities (hypertension,
diabetes, dyslipidemia, atrial fibrillation, congestive heart failure, and chronic obstructive pulmonary disease).

43
Figure 2.1. Cohort selection when evaluating the incidence of stroke or TIA in immigrants
and long-term residents.
Footnote: transient ischemic attack (TIA), Ontario Health Insurance Plan (OHIP) – provincial health plan, landing date
refers to the date when an immigrant became permanent resident of Ontario.

44
Figure 2.2. Effect of age on the association between immigration status and incidence of
stroke or transient ischemic attack shown as unadjusted and adjusted HR of outcome in
immigrants compared to long-term residents.
Footnote: Hazard ratio and confidence interval obtained using cause-specific piecewise hazards models using age as
time-scale.

45
Figure 2.3. Effect of age on the association between immigration status and incidence of
ischemic stroke in immigrants compared to long-term residents.

46
Figure 2.4. Effect of age on the association between immigration status and incidence of
intracranial hemorrhage in immigrants compared to long-term residents.
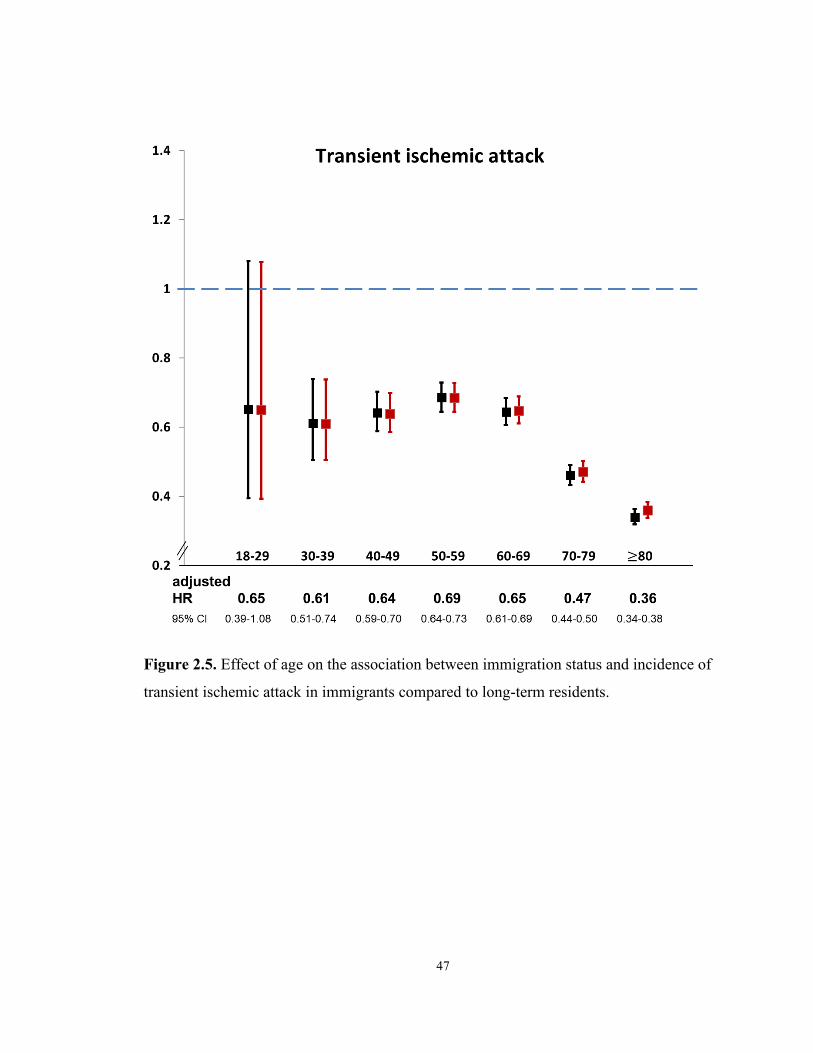
47
Figure 2.5. Effect of age on the association between immigration status and incidence of
transient ischemic attack in immigrants compared to long-term residents.

48
Figure 2.6. Effect of age on the association between immigration status and incidence of
subarachnoid hemorrhage in immigrants compared to long-term residents.

49
Figure 2.7. Adjusted hazard ratio (95% confidence interval) of stroke or TIA and subgroups of ischemic stroke and intracranial
hemorrhage in immigrants compared to long-term residents based on country of origin.
Footnote: Hazard ratio and confidence interval obtained using cause-specific hazards models using age as time-scale adjusting for sex, neighbourhood-level income, and
comorbidities (hypertension, diabetes, dyslipidemia, atrial fibrillation, congestive heart failure, and chronic obstructive pulmonary disease). *includes all stroke types and TIA.

50
Figure 2.8. Adjusted hazard ratio (HR) of stroke or TIA in immigrants compared to long-
term residents of Canada based on the country of origin of immigrants (depicting the top 1%
countries from where immigrant originate).

51
8 Discussion
8.1 Summary
In this large-scale study from the most populous province of Canada (over 14 million
people), immigrants had a 33% lower rate of stroke or TIA than long-term residents, with no
change after accounting for baseline differences, and with variation in the association by age,
stroke subtype, country of origin, and immigration class.
8.2 Key findings
The finding of a lower rate of stroke or TIA in immigrants compared to long-term residents is
in keeping with previous reports that have found a lower incidence of stroke in foreign-born
people compared to general populations in Denmark, Sweden, and the US62,63,142, and is
considered to be attributable to a healthy immigrant effect where through a self-selection
process immigrants are generally healthier than host populations.15,143 Age is the single most
important risk factor for stroke144, and immigrants were younger than the long-term residents
in our cohort in keeping with selective migration of younger individuals.145 However, the
lower incidence of stroke in immigrants persisted even after using age as time-scale and
accounting for other baseline differences, consistent with a previous Ontario study.66 One
proposed reason for this health advantage is that immigrants come from a health transition
period where lifestyle or environmental risk factors such as diet and physical activity104
confer a lower risk of cardiovascular diseases and cancer, a phenomenon sometimes referred
to as time travelling.24
Of note, the association between immigration status and stroke incidence varied with age,
with greater reductions in the hazard of stroke or TIA in immigrants compared to long-term
residents with increasing age. Because only first stroke or TIA was included in the analyses,
the younger age of immigrants at the time of the first event could mean that that the
proportion of event-free older immigrants was lower than long-term residents and may partly
52
explain the impact of age. Another explanation may be a phenomenon termed salmon bias,
whereby immigrants return to their home regions when they are older or closer to their
death,146 and these deaths would not be captured in our databases. We accounted for this in
our analyses by censoring outcomes of these individuals at the time of loss to follow-up.
An international case-control study found that age at the time of stroke was lower in people
living in South Asia, China, Southeast Asia and Africa compared to those living in Western
Europe, North America or Australia,147 with poor primary prevention and occurrence of
vascular risk factors at an earlier age proposed as causes.147,148 We also found that
immigrants were younger at the time of stroke. Our study did not evaluate explanations for
this finding, but previous work has found that immigrants have lower rates of primary care
utilization than long-term residents, possibly due to challenges in navigating new healthcare
systems and difficulty findings primary care physicians who speak their language.149–151
Organizations involved in integrating immigrants in host nations and in reducing the burden
of stroke can work to improve knowledge of and access to primary care in immigrants and
promote the development of novel primary care-based models and interventions.152–154
The reduction in the hazard of TIA associated with immigration status was greater compared
to other cerebrovascular event subtypes, consistent with other studies that have found a lower
risk of TIA in immigrants.155 This suggests the need to improve education about stroke or
TIA symptoms in immigrants, to ensure that medical attention is sought for even minor
symptoms.156 In contrast, the reduction in the hazard of intracranial hemorrhage was not as
large, suggesting persistence of a higher rate of intracerebral hemorrhage compared to other
stroke types in people of low-middle income countries even after immigration to
Canada.45,157 These findings present an opportunity to improve primary prevention strategies
that target early diagnosis and treatment of hypertension and other risk factors.
The association between immigration status and lower stroke incidence was less marked in
African, Caribbean, and Latin American immigrants compared to those from other world

53
regions, and is in line with the higher risk of cerebrovascular events observed in Black
Americans, in people of African or Caribbean descent in England, and in Latin/Hispanic
communities in the US.73,158,159 Further work is needed to determine whether these
differential rates are due to variations in the prevalence or management of vascular risk
factors such as hypertension, and to what extent such rates are mediated by neighbourhood-
level factors, sociodemographic factors, and the immigrant experience.118 Interestingly, East
Asian immigrants had a lower adjusted hazard of ischemic stroke than long-term residents,
but a higher adjusted hazard of intracranial hemorrhage. Previous research supports the
observed diverging pattern for different stroke subtypes in East Asians.160 A higher risk of
intracranial small vessel atherosclerosis in East Asians has been implicated as a possible
explanation for this phenomenon.157
Although all classes of immigrants had a lower incidence of stroke than long-term residents,
the magnitude of this reduction was lower for refugees compared to other immigrants,
suggesting that the healthy immigrant effect may not be observed when the migration is
forced161, or that assimilation may be less for refugees compared to skilled migrants who
have higher education and can speak English or French.162,163 Future work should evaluate
health outcomes in immigrants using other measures of acculturation such as languages
spoken or education prior to arrival, proportion of time spent in Canada, or other factors such
as number of non-immigrant friends, or other self-reported acculturation scales.105,164
8.3 Strengths and limitations
Our study is strengthened by use of a large, population-based cohort from an entire province,
and using age as a time-scale to account for differences in age between immigrants and long-
term residents at cohort entry139, and it is likely to provide valid estimates of the association
between immigration status and incident stroke.
This study has some limitations. We classified immigrants as those who moved to Ontario
after 1985, and considered immigrants who moved in Ontario before 1985 as long-term

54
residents. Thus, our findings are most generalizable to people who have immigrated within
the past three decades. Second, we did not have information on potential risk factors such as
education, family history, smoking, alcohol, diet, physical activity, or body mass index, and
we also did not have information on screening or control of vascular risk factors such as
hypertension.45,147 Third, we only included incident strokes and TIAs resulting in an
emergency department visit or hospitalization, and thus would have missed minor strokes or
TIAs that did not result in hospital assessment. Fourth, we did not include cerebrovascular
death in our estimation of stroke or TIA incidence.45 Finally, we did not have information on
stroke etiology.
8.4 Implications
The younger age at the time of stroke in immigrants suggests that premature stroke could be
averted by regular and perhaps early screening of vascular risk factors in immigrant
populations. The greater comparative likelihood of intracerebral hemorrhage compared to
other stroke types in immigrants, especially in those from Africa, the Caribbean and East
Asia, supports the need to improve screening and treatment of hypertension, the most
important modifiable risk factor of stroke.147 The overall lower rate of stroke or TIA in
immigrants should prompt future studies to understand the mediators of this healthy
immigrant effect, and use this knowledge to develop targeted primary preventative measures
to reduce the risk of stroke in both immigrants and long-term residents.

55
Chapter 3 Immigration status, acute stroke care and short-term
outcomes

56
1 Overview
This chapter will evaluate processes of acute stroke care and short-term outcomes following
ischemic stroke between immigrants and long-term residents using data from the Ontario
Stroke Registry.
2 Research Questions
1. Do processes of acute stroke care (use of ambulance, receipt of IV thrombolysis,
and others) vary between immigrants and long-term residents?
2. Is disability on discharge (measured as modified Rankin Score) different in
immigrants and long-term residents following ischemic stroke?
3 Study population
We used data from the OSR to identify a cohort of patients with ischemic stroke or transient
ischemic attack (TIA) seen in the emergency department or hospitalized at any of the 11
regional (comprehensive) stroke centres between July 1, 2003 and March 31, 2013. We
performed sensitivity analyses using people seen at non-stroke centres (see below). We
excluded patients with hemorrhagic stroke, as the processes of care and outcomes for this
group differ from those with ischemic stroke. We also excluded patients aged less than 18
years or greater than 105 years, and those with in-hospital stroke. If an individual had more
than one emergency department (ED) visit and/or hospitalization for ischemic stroke or TIA
during the study time frame, we included only the first event. Because over 95% of
immigrants with ischemic stroke or TIA reside in urban areas (population greater than
10,000), we excluded patients who resided in rural regions at the time of their stroke to
ensure geographic comparability between the exposure and the comparison groups.
The OSR was used to provide information on stroke type as well as clinical variables
including time of stroke onset and hospital arrival, stroke severity based on the National
Institutes of Health Stroke Scale (NIHSS; derived from the Canadian Neurological

57
Score165,166), in-hospital processes of care, and medications and disability at discharge
(measured as modified Rankin scale, mRS). Validation by duplicate chart abstraction has
shown excellent agreement for key variables in the OSR.132 Using unique encoded
identifiers, we linked the cohort to population-based administrative databases housed at ICES
to provide information on comorbid conditions, and location of residence (including median
neighbourhood income) (see Table 1.1 for data sources and algorithms for each variable).
4 Exposure of interest
Our exposure of interest was immigration status. We defined immigrants as those born
outside of Canada who became permanent residents on or after January 1, 1985 whereas
those born in Canada or those who arrived in Ontario prior to 1985 were considered long-
term residents.
5 Outcome of interest
Our primary outcome was disability on discharge, a binary outcome, defined as a modified
Rankin Scale (mRS) score of 3 to 5, among those with ischemic stroke. The modified Rankin
scale is an internationally accepted scale with very good interobserver agreement (weighted
kappa 0.91) to measure disability in patients who have suffered a stroke.167 It is an ordinal
scale with 7 levels: 0 to 6, where 0 is no residual symptoms and 6 is death, and value of 3 or
more suggest moderate to severe disability such that one needs either some or considerable
help with daily activities.159
Secondary outcomes in the cohort with ischemic stroke or TIA were the time of hospital
arrival from the onset of stroke symptoms and arrival by ambulance. Secondary outcomes in
the subgroup with ischemic stroke were: (1) stroke unit care; (2) thrombolysis in eligible
patients (defined as those with ischemic stroke who arrived within the time window to
receive thrombolysis and did not have any contraindications); (3) vascular imaging (any of
CT or MR angiogram or carotid dopplers); (4) dysphagia screening; (5) Holter monitor and

58
echocardiography; (6) antiplatelet or anticoagulant drugs on discharge; (7) antihypertensive
and lipid lowering drugs on discharge; and (8) length of hospital stay (see Table 1.1 for data
source for each outcome). Most of these were obtained from the Ontario Stroke Registry. The
provincial insurance plan provides coverage for these investigations and interventions.
6 Statistical Analysis
We compared baseline variables and stroke care delivery between immigrants and long-term
residents using the Kruskal Wallis test for continuous variables, and the chi-square test for
categorical variables. We reported standardized differences, which express the difference in
means or prevalence between two populations as a proportion of the pooled standard
deviation. We used the convention that standardized differences greater than 0.10 are
considered to reflect a potentially meaningful difference.138 Due to the large sample size, we
elected to consider differences in process measures as being clinically meaningful using
standardized differences, and did not put emphasis on statistical difference using P values.
6.1 Primary analyses
We used inverse probability of treatment weighting (IPTW) using the propensity score to
account for differences in the distribution of baseline covariates between immigrants and
long-term residents with ischemic stroke. Stabilized weights were derived from the
estimated propensity scores. Weighted standardized differences were used to assess the
similarity of immigrants and long-term residents after application of the IPT weights.168 We
then used log-binomial models to assess the effect of immigration status on disability on
discharge (mRS between 3 and 5). The model was estimated using generalized estimating
equation methods with an independent working correlation structure to account for the
within-subject homogeneity induced by the weights. In a sensitivity analysis, we also
assessed the association between immigration status and disability on discharge using an
ordinal logistic regression model for ordinal levels of mRS scores.169 Further, we calculated
unadjusted, age- and sex-adjusted and IPT weights-adjusted hazard ratios (HR) of 30-day

59
mortality in immigrants compared to long-term residents using Cox proportional hazards
models. We reported point estimates and 95% confidence intervals (CIs); and P values with
2-sided alpha level of 0.01 set as a cut-off for statistical significance, after Bonferroni
correction for multiple testing.170
Why use IPTW analyses?
IPTW approach is one of several methods of using the propensity score.171 Using the
estimated propensity score, weights are derived that are equal to the inverse of the probability
of receiving the treatment/exposure that the subject actually received. In the sample weighted
using these ‘inverse probability of treatment weights’, the distribution of measured baseline
covariates will be similar between treated and control subjects. Thus, measured confounding
has been removed by incorporating these inverse probability of treatment weights. The
propensity score was estimated by regressing immigrant status on measured baseline
covariates.172 This model adjusted for age, sex, neighbourhood-level income, hypertension,
diabetes, dyslipidemia, previous stroke/TIA, and atrial fibrillation, congestive heart failure,
coronary artery disease, kidney failure requiring dialysis, dementia, cancer, and Charlson
comorbidity index score. The latter was developed to estimate 1-year mortality of patients
admitted to the hospital or enrolled in research studies on the basis of the following comorbid
conditions (weights in the parenthesis): myocardial infarction, congestive heart failure,
peripheral vascular disease, cerebrovascular disease, dementia, chronic pulmonary disease,
connective tissue disease, ulcer disease, mild liver disease, diabetes (weight = 1), hemiplegia,
moderate or severe renal disease, diabetes with end organ damage, primary cancer (weight =
2), and moderate or severe liver disease, metastatic solid tumor, and AIDS (weight = 8).173
This has been modified by subsequently with weights for the latter three categories as
follows: and moderate or severe liver disease (weight =3), metastatic cancer, and AIDS
(weight = 6).174 We derived the modified Charlson score using multiple databases available
at ICES. We did not adjust for baseline stroke severity because it was felt to be a factor in the

60
causal pathway between the association of immigration status and our primary outcome of
interest.
We elected to use IPTW approach over conventional multivariable regression methods
because a) propensity score methods have a slightly more empirical power than multivariable
regression with low number of events per confounder175, b) we were interested in reporting
relative risk of our outcome in immigrants compared to long-term residents using log
binomial models176,177; however, the latter often have “failed convergence” or numerical
instability due to not respecting natural parameter constraints, especially in a multivariable
adjusted model with multiple covariates178,179, and c) IPTW approach would allow us to
retain all cohort participants in analyses compared to propensity score matched analyses
where only those who are matched are included171.
6.2 Secondary analyses
Country of origin and acculturation measures
To evaluate the effect of country of origin, we calculated multivariable-adjusted risk ratios of
being disabled on discharge in immigrant groups (based on WHO-world regions) compared
to long-term residents using the original unweighted sample of people with ischemic stroke.
We then used the same sample to examine the effect of acculturation on outcomes by
conducting three separate analyses in which long-term residents were compared to subgroups
of immigrants based on (1) time since immigration [3 levels: ≤ 5 years, 6 to 10 years, and >
10 years]; (2) age at arrival [2 levels: ≤ 50 years and > 50 years]; and (3) immigration class
[3 levels: economic, refugee, and family or other]. These models adjusted for the same set of
variables used for calculating IPT weights.
6.3 Sensitivity analyses
To examine whether our findings were generalizable to patients seen outside of regional
stroke centres, we replicated our analyses in a separate cohort of adult patients, identified

61
from the OSR, with ischemic stroke or TIA residing in urban Ontario who were seen at non-
stroke centres.
7 Results
7.1 Baseline differences
We included 34,987 patients with stroke and TIA who resided in urban Ontario and were
seen at regional stroke centres (Figure 3.1). Of these 2,649 (7.6%) were immigrants from 122
different countries, with South Asian (17%), Filipino (9.1%) and Chinese (6%) being the
most common ethnic groups based on country of origin (Table 3.1). Immigrants were
younger than long-term residents at the time of their stroke (median age 67 vs. 76 years),
were more likely to reside in lower income neighborhoods (proportion residing in the 20% of
neighborhoods with the lowest median income 33.1% vs. 21.7%), and had a slightly greater
stroke severity (mean NIHSS 7.7 vs. 7.0) (standardized difference > 0.10 for all
comparisons) (Tables 3.1 & 3.2, and Figure 3.2). Smoking and vascular risk factors were less
common among immigrants, except for diabetes which was more common in immigrants
compared to long-term residents (34.3% vs. 29.3 %) (Table 3.1 and Figure 3.2).
7.2 Differences in acute stroke care
There was no difference in the proportion arriving by ambulance or the time from onset of
symptoms to hospital arrival between immigrants and long-term residents (Table 3.2).
Immigrants were less likely than long-term residents to be diagnosed with TIA (29.0% vs.
34.2%), and, among those with TIA, less likely to be admitted to hospital (22.5% vs. 27.9%).
In the subgroup of patients with ischemic stroke, processes of care were similar in
immigrants and long-term residents, with no difference in stroke unit care, guideline-
recommended investigations (vascular imaging, prolonged cardiac monitoring, and
echocardiography), dysphagia screening, prescriptions of medications for secondary stroke
prevention on discharge, or length of hospital stay. Immigrants were more likely than long-

62
term residents to receive thrombolysis (21.2% vs. 15.5%), were less likely to be treated with
a palliative approach (7.3% vs. 13.0%), and had lower in-hospital mortality, albeit with
standardized difference below 0.10 for the latter (8.2% vs 11.5%) (Table 3.2).
7.3 Primary analyses
After applying stabilized IPT weights to the cohort with ischemic stroke, the standardized
differences of the baseline characteristics of interest between immigrants and long-term
residents were all below 0.10 (Figure 3.2). In the unadjusted analysis, there was no
difference in the probability of disability at discharge between immigrants and long-term
residents. However, in both age- and sex-adjusted (aRR 1.15, 95% CI 1.11-1.20) and IPTW-
adjusted analyses (aRR 1.18, 95% CI 1.13-1.22), immigrants had a higher probability of
disability on discharge (Table 3). Of note, the age- and sex-adjustment was obtained by using
IPT weights derived by only including age and sex. Observed association persisted when
using ordinal regression to model the modified Rankin score on an ordinal scale (adjusted
odds ratio of a higher modified Rankin score on ordinal scale 1.44; 95% CI, 1.31-1.57)
(Table 3.3). We evaluated for model overspecification and influential observations in the log
binomial models and for proportionality assumption in Cox models (mortality), and none of
the assumptions were violated.
We found that immigrants had a lower rate of 30-day mortality than long-term residents
(unadjusted HR 0.72; 95% CI 0.62-0.84); however, after accounting for age and sex the rate
of 30-day mortality were similar in immigrants and long-term residents (age- and sex-
adjusted HR 0.99; 95% CI 0.84-1.16). The rate of 30-day mortality was slightly higher in
immigrants after full IPT weight adjustment, albeit with wide confidence intervals (HR 1.10;
95% CI 0.91-1.32).

63
7.4 Country of origin and acculturation
In patients with ischemic stroke, we found that immigrants from East Asia (aRR 1.20; 95%
CI, 1.10-1.31) and South Asia (aRR 1.15; 95% CI, 1.05-1.28) were more likely to be disabled
compared to long-term residents, whereas those from Latin America or Western/European
regions of the world had similar outcomes to long-term residents (Table 3.4). Compared to
long-term residents, the adjusted risk of disability in patients with ischemic stroke was higher
in immigrants who arrived in Canada after the age of 50 years (aRR 1.13; 95% CI, 1.08-1.17)
or in those who came as family class migrants (aRR 1.14; 95% CI 1.08-1.19) or refugees
(aRR 1.13; 95% CI, 1.02-1.26) (Table 3.4).
7.5 Sensitivity analyses
There were 16,060 patients with ischemic stroke or TIA seen at non-stroke centres (Figure
3.1), of whom 1,396 (8.7%) were immigrants. At non-stroke centres, immigrants were less
likely than long-term residents to arrive by ambulance (48.9% vs. 56.6%); had a longer time
from stroke onset to hospital arrival (median 9 vs. 6 hours); were equally likely to receive
thrombolysis (8.3% vs. 7.9%); and, in those who did not receive thrombolysis, this was more
likely to be due to arriving too late (58.7% vs. 51.5%) (Tables 3.5 and 3.6, and Figure 3.3).
Other process measures were similar between immigrants and long-term residents in the two
cohorts. Similar to our primary cohort, in patients with ischemic stroke at non-stroke centres,
immigrants were more likely to be disabled on discharge compared to long-term residents
(IPTW-adjusted RR 1.09; 95% CI, 1.03-1.15) (Table 3.3).

64
Table 3.1. Characteristics of patients with ischemic stroke or TIA seen at regional stroke centres in Ontario, Canada between July 2003 and April 2013 (N = 34,987).
Characteristics Immigrants
(n = 2,649, 7.6%)
Long-term residents
(n = 32,338, 92.4%)
Female, n (%) 1,256 (47.4) 16,033 (49.6)
Median age in years (Q1 - Q3) 67 (55-78) 76 (64-83)
Neighborhood-level quintile, n (%)
Lowest quintile (1st) 876 (33.1) 7,032 (21.7)
Highest quintile (5th) 327 (12.3) 6,880 (21.3)
Treatment at a teaching hospital, n (%) 1,971 (74.4) 27,190 (84.1)
Fluent in English and/or French* 1,965 (74.1) 30,520 (94.4)
Comorbidities, n (%)
Hypertension 1,854 (70.0) 23,681 (73.2)
Diabetes 909 (34.3) 9,486 (29.3)
Dyslipidemia 1,107 (41.8) 13,078 (40.4)
Current smoker 364 (13.7) 5,371 (16.6)
Coronary artery disease 471 (17.8) 7,340 (22.7)
Previous stroke/TIA 672 (25.4) 9,529 (29.5)
Atrial fibrillation 347 (13.1) 5,633 (17.4)
Dementia 126 (4.8) 2,995 (9.3)
Congestive heart failure 329 (12.4) 5,653 (17.5)
Cancer 134 (5.1) 2,786 (8.6)
Dialysis 84 (3.2) 882 (2.7)
Mean Charlson comorbidity index (SD) 1.99 ± 1.97 2.07 ± 2.0
Among immigrants only
Top countries of origin
Philippines 242 (9.1)
India 204 (7.7)
China, People's Republic of 153 (5.8)
Sri Lanka 125 (4.7)
Jamaica 115 (4.3)

65
Poland 109 (4.1)
United Kingdom and Colonies 105 (4.0)
Pakistan 94 (3.5)
Guyana 93 (3.5)
Most common mother tongue
English 442 (16.7)
Tagalog 214 (8.1)
Cantonese 186 (7.0)
Arabic 130 (4.9)
Russian 124 (4.7)
Level of education
None 226 (8.5)
Secondary or Less 1429 (53.8)
Formal Trade Certificate or Apprenticeship or
non-University certificate 352 (13.3)
Some University - No Degree 119 (4.5)
Bachelor's Degree 404 (15.2)
Some Post-Grad. Education (Master's,
Doctorate or non-degree) 124 (4.7)
Q1-Q3 – 1st and 3rd quartile; SD – standard deviation; n – numbers, % - proportion of total n in column, *Where
information on language was available.

66
Table 3.2. Processes of stroke care and outcomes in immigrants and long-term residents with ischemic stroke or TIA (N = 34,987).
Immigrants Long-term
residents
Standardized
difference
P
value
n = 2,649 n = 32,338
Prehospital care
Arrival by ambulance, n (%) 1,563 (59.0) 19,990 (61.8) 0.06 0.004
Median time from last seen normal
to arrival in hospital, hours (Q1 –
Q3)
4 (1-15)
4 (1-17)
0.04 0.08
Type of cerebrovascular event <0.001
Ischemic stroke, n (%) 1,880 (71.0) 21,291 (65.8) 0.11
TIA, n (%) 769 (29.0) 11,047 (34.2) 0.11
Patients with TIA admitted to hospital,
n (%)
173 (22.5) 3,086 (27.9) 0.13 0.001
Processes of stroke care in the subgroup of patients with ischemic stroke (n = 23,171)
Received thrombolysis, n (%) 398 (21.2) 3,301 (15.5) 0.15 <0.001
Reason for no thrombolysis – too
late, n (%)
795 (42.3) 9,196 (43.2) 0.02 0.45
Median door-to-needle time,
minutes (Q1 – Q3)
73 (57-94)
72 (55-94)
0.03 0.54
Median time from last seen normal
to thrombolysis, minutes (Q1 – Q3)
150 (120-185)
145 (117-180)
0.10 0.83
Stroke severity
Mean NIHSS (SD)
Median NIHSS (Q1 – Q3)
7.7 (7.0)
6 (2-11)
7.0 (6.5)
5 (2-11)
0.10
0.09
<0.001
<0.001

67
Median length of stay, days (Q1-Q3) 7 (3-14) 7 (3-14) 0.04 0.11
Carotid imaging, n (%) 1,506 (80.1) 16,298 (76.6) 0.09 <0.001
Dysphagia screening, n (%) 1,185 (67.7) 13,211 (67.7) 0.00 0.96
Stroke unit care, n (%) 1,114 (59.3) 13,394 (62.9) 0.07 0.002
Echocardiography, n (%) 1,247 (66.5) 13,371 (62.9) 0.08 0.002
Holter, n (%) 657 (35.0) 6,843 (32.2) 0.06 0.012
Palliative status, n (%) 127 (7.3) 2,529 (13.0) 0.19 <0.001
Among those alive on discharge
Anti-platelet or anti-coagulant agent
on discharge, n (%)
2,284 (91.3) 27,180 (90.9) 0.01 <0.001
Anti-hypertensive agent on
discharge, n (%)
1,645 (65.7) 20,137 (67.3) 0.03 0.73
Lipid-lowering agent on discharge, n
(%)
1,594 (63.7) 18,232 (61.0) 0.06 <0.001
Outcomes on discharge$
Dead on discharge 151 (8.2) 2,397 (11.5) 0.01 <0.001
Disabled on discharge (mRS 3 to 5) 920 (54.7) 9,762 (52.7) 0.04 0.11
Q1-Q3 – 1st and 3rd quartile; SD – standard deviation; n – number, % proportion; NIHSS – National Institutes of
Health Stroke Scale; TIA – transient ischemic attack. $only in patients with ischemic stroke.

68
Table 3.3. Disability following ischemic stroke among immigrants and long-term residents in Ontario, Canada.
Immigrants
# events (%)
Long-term residents
(reference)
# events (%)
Risk ratio
(95% CI)
P value
Regional stroke centre
Disabled on discharge* 920 (54.7) 9,762 (52.7)
Unadjusted estimates 1.04 (0.99-1.09) 0.11
Age- & sex-adjusted† 1.16 (1.11-1.21) <0.001
IPTW adjusted 1.18 (1.12-1.23) <0.001
IPTW adjusted odds ratio (for
each point increase on the mRS
scale)
1.44 (1.31-1.57) <0.001
Non- stroke centre
Disabled on discharge* 468 (56.3) 4,174 (57.2)
Unadjusted estimates 0.98 (0.92-1.05) 0.62
Age- & sex-adjusted† 1.16 (1.11-1.21) <0.001
IPTW adjusted 1.09 (1.02-1.16) <0.001
IPTW adjusted odds ratio (for
each point increase on the mRS
scale)
1.16 (1.02-1.32) 0.02
IPTW – inverse probability treatment weights obtained after accounting for: age (continuous), sex (male
reference), income quintiles, diabetes, hypertension, dyslipidemia, CAD, congestive heart failure, dementia,
dialysis dependence, current smoking, atrial fibrillation, prior stroke/TIA, cancer, Charlson comorbidity index. *Disability defined as modified Rankin Scale (mRS) 3 to 5; †IPT weights obtained after adjusting for age (continuous) and sex (male reference).
Reference – long-term residents formed the reference group when calculating the risk ratio (the risk of being
disabled in immigrants compared to long-term residents).

69
Table 3.4. Disability after ischemic stroke in different groups of immigrants (based on region of origin, time since immigration, age at arrival, and immigration class) compared to long-term residents in Ontario, Canada.
# events (%) Disabled on discharge*
aRR (95% CI)
Long-term residents 9,762 (52.7) 1.00 (reference)
Region of origin
Africa 41 (59.4) 1.16 (0.96-1.40)
Caribbean 86 (55.8) 1.12 (0.98-1.28)
East Asia 209 (58.5) 1.20 (1.10-1.31)
Latin America 58 (44.6) 0.98 (0.82-1.17)
North Africa – Middle East 86 (54.8) 1.12 (0.99-1.28)
South Asia 134 (53.8) 1.15 (1.05-1.28)
Western/European 219 (50.2) 1.01 (0.93-1.10)
Time since immigration
≤ 5 years 131 (49.1) 1.11 (1.00 – 1.23)
6 to 10 years 152 (55.5) 1.10 (1.01 – 1.21)
> 10 years 637 (55.8) 1.10 (1.06 – 1.15)
Age at arrival
≤ 50 years 263 (40.9) 1.04 (0.96 – 1.14)
> 50 years 637 (64.6) 1.13 (1.08 – 1.17)
Immigration class
Family or other 620 (60.1) 1.14 (1.08 – 1.19)
Refugee 140 (50.0) 1.13 (1.02 – 1.26)
Economic 159 (43.1) 1.09 (0.97 – 1.22)
aRR – adjusted risk ratio obtained using multivariable Poisson regression model adjusting for: age (continuous),
sex (male reference), income quintiles, diabetes, hypertension, dyslipidemia, CAD, congestive heart failure,
dementia, dialysis dependence, current smoking, atrial fibrillation, prior stroke/TIA, cancer, Charlson
comorbidity index. *Disability defined as modified Rankin Scale (mRS) 3 to 5.

70
Table 3.5. Non-stroke centres cohort. Characteristics of the cohort (N = 16,060).
Characteristics Immigrants
(n = 1,396), 8.5%
Long-term residents
(n = 16,060), 91.5%
Female, n (%) 712 (51.0) 7,162 (48.8)
Median age in years (Q1 - Q3) 70 (58 – 79) 76 (65 – 84)
Neighbourhood-level quintile, n (%)
Lowest quintile (1st) 406 (29.1) 2,890 (19.7)
Highest quintile (5th) 128 (9.2) 2,698 (18.4)
Treatment at a teaching hospital, n (%) 118 (8.5) 2,407 (16.4)
Fluent in English or French, n (%) 410 (29.4) 8,670 (59.1)
Comorbidities, n (%)
Hypertension 999 (71.6) 11,192 (76.3)
Diabetes 559 (40.0) 4,822 (32.9)
Dyslipidemia 575 (41.2) 5,762 (39.3)
Atrial Fibrillation 161 (11.5) 2,393 (16.3)
Previous stroke/TIA 365 (26.1) 4,686 (32.0)
Dementia 79 (5.7) 1,379 (9.4)
Congestive heart failure 180 (12.9) 2,620 (17.9)
Coronary artery disease 265 (19.0) 3,748 (25.6)
Current smoker 127 (9.1) 2,070 (14.1)
Chronic kidney disease (on dialysis) 74 (5.3) 745 (5.1)
Mean Charlson comorbidity index (SD) 2.1 (2.0) 2.1 (2.0)
Q1-Q3 – 1st and 3rd quartile; SD – standard deviation; n – numbers, % - proportion of total N in column; TIA –
transient ischemic attack.

71
Table 3.6. Non-stroke centres cohort. Processes of stroke care between immigrants and long-term residents with ischemic stroke or TIA in the cohort (N = 16,060).
Immigrants Long-term
residents
Standardized
difference
P value
n = 1,396 n = 16,060
Prehospital care
Arrival by ambulance, n (%) 682 (48.9) 8,298 (56.6) 0.16 <0.001
Median times from last seen
normal to arrival in hospital,
hours (Q1 – Q3)
9 (2 – 24)
6 (2 – 19)
0.16
<0.001
Type of cerebrovascular event 0.17 <0.001
Ischemic stroke, n (%) 924 (66.2) 8,513 (58.1)
TIA, n (%) 472 (33.8) 6,151 (41.9)
Patients with TIA that are
admitted to a hospital
116 (24.6) 1,689 (27.5) 0.07 0.18
Processes of stroke care in the subgroup of patients with ischemic stroke (n = 9,437)
Received thrombolysis, n (%) 77 (8.3) 676 (7.9) 0.01 0.68
Reason for no thrombolysis –
too late, n (%)
497 (58.7) 4,038 (51.5) 0.14 <0.001
Median door-to-needle time,
minutes
(Q1 – Q3)
58 (50-82)
66 (49-93)
0.15
0.24
Median time from LSN to
thrombolysis, minutes (Q1 –
Q3)
135 (115-191)
147 (113-189)
0.07
0.59
Mean NIHSS (SD)
Median NIHSS (Q1 – Q3)
6.4 (5.7)
5 (2-10)
6.2 (5.9)
4 (1-10)
0.04
0.07
0.29
0.06
Palliative status, n (%) 54 (6.0) 1,044 (12.7) 0.23 <0.001

72
Median length of stay, days
(Q1-Q3) 7 (3-15) 7 (3-14) 0.07
0.043
Carotid imaging, n (%) 662 (71.6) 5,555 (65.3) 0.14 <0.001
Dysphagia screening, n (%) 504 (56.4) 4,872 (59.2) 0.06 0.10
Stroke unit care, n (%) 295 (31.9) 2,759 (32.4) 0.01 0.77
Echocardiography, n (%) 598 (64.7) 4,738 (55.7) 0.19 <0.001
Holter, n (%) 295 (31.9) 2,180 (25.6) 0.14 <0.001
Among those alive on discharge
Anti-platelet or anti-coagulant
agent on discharge, n (%)
782 (88.6) 6,730 (84.8) 0.11 0.83
Anti-hypertensive agent on
discharge, n (%)
660 (74.7) 5,796 (73.0) 0.05 0.24
Lipid-lowering agent on
discharge, n (%)
610 (69.1) 4,975 (62.7) 0.14 <0.001
Q1-Q3 – 1st and 3rd quartile; SD – standard deviation; n – numbers, % - proportion of total N in column; NIHSS
– National Institutes of Health stroke scale.

73
Figure 3.1. Flow diagram. Selection of the study cohorts. Abbreviations: OSR – Ontario Stroke Registry IRCC – Immigration, Refugee and Citizenship Canada; PCCF –
Postal CodeOM Conversion File; RPDB – Registered Person’s Database.
Non-urban resident was defined as residing in a geographically defined area (based on postal code files) with
population less than 10,000.

74
Figure 3.2. Regional stroke centres cohort. Balance between baseline characteristics assessed
as absolute standardized differences between immigrants and long-term residents before
(solid circles) and after (empty circles) applying inverse probability of treatment weights to
the entire cohort.
Abbreviations: CAD – coronary artery disease; CHF – congestive heart failure; TIA – transient ischemic
attack; income – refers to neighbourhood-level income quintile where 1 is the lowest and 5 is the highest
income quintile; charlson refers to Charlson comorbidity index; and dialysis refers to chronic kidney disease
requiring dialysis.

75
Figure 3.3. Non-stroke centres cohort. Balance between baseline characteristics assessed as
absolute standardized differences between immigrants and long-term residents before (solid
circles) and after (empty circles) applying inverse probability of treatment weights to the
entire cohort.

76
8 Discussion
8.1 Summary
In this retrospective cohort study, we found that, compared to long-term residents,
immigrants to Canada were younger at the time of stroke onset, had greater stroke severity
and were less likely to present with TIA. In patients who had ischemic stroke, immigrants
were more likely to be disabled at discharge than long-term residents. Processes of stroke
care were similar in immigrants and long-term residents seen at stroke centres; however,
among those patients seen at non-stroke centres, immigrants were less likely than long-term
residents to arrive by ambulance and had a longer time between stroke onset and hospital
arrival. Lastly, immigrants had similar 30-day mortality compared to long-term residents.
8.2 Key findings
The lower frequency of presentation with TIA among immigrants in our primary cohort
aligns with previous research that reported a lower frequency of TIA diagnosis among ethnic
groups in high-income countries compared to their White counterparts.180 This may reflect
differences in health-seeking behaviors or knowledge of stroke symptoms in immigrants
compared to long-term residents or may be due to missed diagnoses of minor stroke and TIA
in immigrants who present with acute transient or minor neurological symptoms.11
Our finding of a younger age at stroke onset in immigrants compared to long-term residents
is consistent with previous studies suggesting that Asian Americans79, Black British181, and
Chinese and South Asian Canadians182 experience stroke at a younger age than their White
counterparts. Potential explanations for this finding include an early onset of vascular risk
factors, or suboptimal management of risk factors due to social stressors183, lack of coverage
for medications184, or poor health literacy among immigrants.185 In our cohort, vascular risk
factors, except for diabetes, were less common in immigrants compared to long-term
residents; however, we did not have information on the duration or management of

77
traditional vascular risk factors, or other risk factors such as lipoprotein levels, dietary habits
or measures of obesity (such as waist-to-hip ratios).186
Compared to long-term residents, we found that immigrants with ischemic stroke at stroke
centres were more likely to receive thrombolysis, and it is possible that this was due to
greater stroke severity among immigrants as well as to a younger age at presentation. Despite
the fact that more frequent receipt of thrombolysis would be expected to reduce post-stroke
disability144, immigrants with ischemic stroke were more likely than long-term residents to
be disabled on discharge. This may be in part attributable to baseline difference in stroke
severity, less frequent use of palliative care in immigrants compared to long-term residents187
resulting in survival with greater disability, differences in processes of care related to
language fluency188 or (less likely) differences in post-thrombolysis complications.79 This
finding is consistent with a prior study that reported an adjusted odds ratio of 1.4 (95% CI
1.0-1.9) for institutionalization at the time of discharge, a proxy measure for disability,
among immigrants compared to long-term residents with stroke.66
Previous studies have mainly focused on the incidence of stroke deaths in immigrants, rather
than stroke case-fatality. A population-based study in Ontario found a lower age-standardized
rate of cardiovascular death among immigrants compared to long-term residents [0.8 vs. 1.5
cardiovascular deaths/1000 person-years among men, and 0·4 vs. 0·7 among women].21 In
contrast, a study from England and Wales found that immigrants had higher age-standardized
cerebrovascular disease mortality rates than long-term residents, with variation based on
country of origin and with the highest mortality among South Asians immigrants.189 Our
findings are consistent with a previous Canadian study which used new receipt of a
provincial health card as a proxy for immigration status and reported no difference in 30-day
or 1-year mortality stroke or TIA between immigrants and long-term residents66.
Immigrants are a heterogeneous group, and we were interested in assessing the impact of
acculturation on the association between immigration status and outcomes. With the

78
exception of those immigrants who arrive from Western or European countries and Latin
America, most immigrants had a higher risk of being disabled on discharge following
ischemic stroke. We found higher disability after ischemic stroke among immigrants who
were older at the time of arrival to Canada (age > 50 years), and among refugee and family
class migrants compared to long-term residents. A higher incidence of age- and sex-
standardized diabetes has been reported in refugees and family class migrants to Canada
compared to the economic class migrants.113 Mexican immigrants residing in the US for
more than 10 years were found to have higher risk of self-reported stroke compared to those
who resided less than 10 years.190 Compared to long-term residents, the incidence of stroke
among immigrants to Denmark who resided in Denmark for less than 5 years (HR 0.77; 95%
CI 0.66–0.91) was different than those residing more than 5 years (HR 0.96; 95% CI 0.88–
1.05).191 Unlike previous studies21,192, we categorized the time since immigration variable
into 3 categories (≤ 5, 6 to 10, and >10 years) which could explain why this variable did not
modify the association in our analyses. Our findings support the need for further work to
evaluate how different measures of acculturation influence stroke outcomes.
8.3 Strengths and limitations
Our study is strengthened by its use of a population-based registry to provide clinical
characteristics, linked with government data to provide detailed information on immigration-
related variables and administrative data to provide complete outcome ascertainment, and
with the use of advanced statistical methods for confounder adjustment.
However, certain limitations merit discussion. We did not have information on use of
endovascular thrombectomy as this treatment was adopted after the study timeframe. The
study was conducted in Canada where all registered residents have health coverage for
hospital and physician services, and so our finding of similar stroke care in immigrants and
long-term residents may not hold true in jurisdictions with different health care systems. We
restricted our cohort to urban dwellers to account for the fact that over 95% of immigrants

79
reside in these areas, and our findings may not be generalizable to immigrants who settle in
non-urban areas. We did not have information on undocumented immigrants who are not
eligible for provincial health care insurance. We could only assess social integration of
immigrants using proxy measures such as time in Canada and age at arrival, and other
important measures such as sense of belonging, dietary habits, and health literacy were not
available.183 Finally, we focused on stroke rather than other neurological or cardiovascular
conditions because of the importance of stroke as a cause of death and disability, and because
of the existence of well-defined evidence-based guidelines for acute stroke care. However,
we anticipate that some of our findings may be applicable to immigrants with other
conditions.
8.4 Implications
The younger age at stroke onset in immigrants suggests that improved cardiovascular risk
screening and primary prevention in these groups could be a focus of future study. The lower
frequency of presentation with TIA and the delay from symptom onset to presentation
suggests that immigrants may benefit from education to recognize the symptoms of stroke or
TIA and understand the importance of early evaluation.193 The less frequent use of palliative
care among immigrants with stroke suggests that differences exist in end-of-life approaches
between immigrants and long-term residents.187,192 Finally, there is an opportunity for further
research to confirm the finding of greater disability following ischemic stroke among
immigrants compared to long-term residents, to understand the reasons for this finding, such
as the potential mediating effects of language fluency or stroke severity, and to identify
strategies to address this, such as early identification and treatment of post-stroke
complications or by early rehabilitation.194

80
Chapter 4 Immigration status and long-term outcomes

81
1 Overview
This chapter will evaluate the outcomes of all-cause mortality and vascular event recurrence
(composite of stroke, TIA and myocardial infarction) and the quality of secondary stroke
preventive care following ischemic stroke in immigrants compared to long-term residents
using linked data from the Ontario Stroke Registry and administrative databases.
2 Research Questions
1. Do long-term outcomes (mortality and vascular event recurrence) following
ischemic stroke vary between immigrants and long-term residents?
2. Does the association between immigration status and long-term outcomes following
ischemic stroke vary based on age, ethnicity, country of origin of immigrants, and
immigration class?
3 Study population
We used the Ontario Stroke Registry (OSR) to identify patients presenting to a hospital in
Ontario with ischemic stroke between April 1, 2002 and March 31, 2013.195 The OSR is a
province-wide registry that included a population-based sample of patients with stroke seen
at any of the province’s 150 acute care institutions, with stroke determined by clinical
presentation and confirmed by brain imaging, and with data collection performed by chart
review by trained abstractors with clinical expertise. We linked these patients to population-
based provincial administrative databases including the death registry, the cause of death
register, and hospitalization and acute care or emergency room visit databases. Unlike
Chapter 3, we combined the cohorts of patients seen at stroke centres and non-stroke centres
for the purposes of this study. We did so to because a) it allowed us to increase the overall
sample size of our cohort, and b) short-term outcomes across immigration status were similar
in patients seen at stroke centres and non-stroke centres. The end of follow-up was on March
31, 2018.

82
We determined place of residence and neighbourhood-level income using linked 2006
Census and postal-code data. We obtained clinical information (history of atrial fibrillation,
dyslipidemia, cancer, dementia, kidney disease, palliative status, and smoking) from the
OSR. The OSR also provided information on care during hospitalization, stroke severity
based on the Canadian Neurological Scale (CNS)165, and disability on discharge measured
using the modified Rankin scale (mRS). We used validated databases and algorithms to
identify other variables such as hypertension126, diabetes127, and congestive heart failure129
(Table 1.1).
Inclusion and exclusion criteria
We excluded patients without a valid provincial health insurance number that permitted
linkage to administrative databases, those aged over 105 or younger than 18 years, and those
who had an acute ischemic stroke while an inpatient for another medical condition. If an
individual had more than one stroke during the study time frame, we included only the first
event. Because over 95% of immigrants resided in urban centres (population over 10,000),
we excluded individuals who resided in non-urban areas to allow for appropriate
comparisons.
4 Exposure of interest
We classified individuals as long-term residents if they were born in Canada or they were
born outside of Canada but moved to Canada before 1985 (inception year for recording
immigration data by the Ministry). Those born outside of Canada and arriving after 1985
were considered immigrants.
Using the validated surname algorithm described in Chapter 1, Section 13.3, we categorized
the entire population into three different ethnic groups: Chinese (positive predictive value
91.9%), South Asian (positive predictive value 89.3%) or other.137 The “other” category is

83
mostly comprised of those of Caucasian ethnicity in long-term residents, though not
exclusively.137
5 Outcomes of interest
Our primary outcome was all-cause mortality, determined, along with date of death, from the
provincial death registry. Cardiovascular mortality was a secondary outcome, obtained from
the provincial register that assigns cause of death based on death certificates. Those with
ICD-10 codes I20-25 or I60-69 as the most responsible cause of death were considered to
have cardiovascular mortality.
We were also interested in vascular event recurrence [a composite outcome of
stroke/transient ischemic attack (TIA) or myocardial infarction] following the index stroke,
identified based on hospitalizations and/or emergency room visits with ICD 10 codes I63.x,
H34.1 (ischemic stroke), G45.x excluding G45.4 (TIA), 161.x (intracerebral hemorrhage),
I64.x (unspecified stroke), or I21 or I22 (myocardial infarction). We elected to include MI
and stroke together because previous reports have reported a higher risk of vascular events
following an ischemic stroke196, and because we were interested in understanding the burden
of total vascular disease. If a patient had both stroke and myocardial infarction, only the
information on the first event was included for the composite end-point. We also separately
studied the risk of having another stroke or TIA using similar methodology.
We considered the date of the index stroke as time zero for mortality analyses, and the date
of discharge from either an acute care hospital or an inpatient rehabilitation centre as time
zero for the analyses of recurrent vascular events. As a result, a recurrence of vascular event
during index episode of hospitalization or rehabilitation will not be captured. This was done
due to limitation of administrative databases to disentangle between index and recurrent
event of the same type during an episode of hospitalization or rehabilitation.

84
6 Statistical Analysis
6.1 Primary analyses
We computed stabilized inverse probability treatment (IPT) weights to account for baseline
differences between immigrants and long-term residents on a set of pre-specified baseline
measures that included age, sex, neighbourhood-level income, vascular risk factors
(hypertension, diabetes, high cholesterol, atrial fibrillation, smoking history, congestive heart
failure), medical co-morbidities (dementia, chronic kidney disease requiring dialysis, cancer,
Charlson comorbidity index), and treatment at a regional stroke centre or a teaching
hospital.172 The IPT weights were obtained by fitting a logistic regression model with
immigration status as the outcome and the variables of interest as independent variables. We
applied IPT weights and assessed balance between immigrants and long-term residents by
calculating weighted standardized differences, which expresses the difference of means or
prevalence between two groups as a proportion of the pooled standard deviation, with
standardized differences of above 0.10 considered potentially meaningful (Figure 4.1).168 We
created two sets of weights. The first set of IPT weights only include age and sex whereas the
second set included all variables, allowing us to report age- and sex- and fully-adjusted
models using IPTW methodology.
We used the Kaplan-Meier method to compare adjusted long-term mortality between
immigrants and long-term residents using the weighted sample.196 The event of interest was
death from any cause during the follow-up period, and patients were censored if they were
alive at the end of follow up (March 31, 2018) or at the time of emigration (if this occurred
prior to March 31, 2018).197 We then developed Cox proportional hazards regression models
to obtain unadjusted and IPT weight-adjusted hazard ratios (HR) of death for immigrants
compared to long-term residents.

85
We reported point estimates and 95% confidence intervals for each outcome measure, and set
P < 0.005 as the threshold for statistical significance after using Bonferroni’s method to
account for multiple comparisons.170
Determining loss to follow-up
One potential explanation for an observed mortality advantage in immigrants compared to
non-immigrants is a phenomenon termed the salmon effect, whereby immigrants return to
their home countries when they are gravely ill (described in detail in Chapter 1, section
5.3).42 Thus, they are lost to follow-up in studies that calculate mortality rates in immigrants.
Previous work in both observational studies and randomized controlled trials has shown that
unbalanced loss to follow-up in two comparison groups can lead to biased estimates of
association.40,41 Thus, it is important to have appropriate and complete follow-up when
studying the association between immigration status and long-term outcomes.
We determined each person’s date of last contact with the health system by using
administrative databases to identify any contact with the health care system such as a visit to
a doctor’s office, refill of prescriptions (in those over 65 years), hospitalization or emergency
visits, receipt of home care, or admission to a rehabilitation facility (see details of this
estimation in Table 4.1) until January 31, 2020. This date was only chosen to determine
residence of cohort participants as required by the databases shown in Figure 4.2. Those alive
on March 31, 2018 (end date of follow-up) with last health system contact prior to this date
were flagged as lost to follow-up at the date of last health system contact (Figure 4.2). We
used this method to estimate loss to follow-up in this cohort because the cohort consisted of
patients with ischemic stroke and they would be expected to have some contact with health
care system for follow-up for secondary stroke prevention.

86
6.2 Secondary analyses
We performed similar analyses using cause-specific HRs for the outcome of cardiovascular
mortality, accounting for the competing risk of death from other causes, and for vascular
event recurrence and stroke recurrence, accounting for the competing risks of death.
Effect of age
We evaluated whether age at the time of stroke modified the association between
immigration status and outcomes by stratifying the analyses into two groups (≤ 75 years and
> 75 years at the time of stroke) and calculating IPT weight-adjusted hazard ratios in
immigrants compared to long-term residents in each stratum.
Ethnicity
In the full unweighted sample, we evaluated the interaction of ethnicity and immigration
status on mortality and vascular event recurrence by including an interaction between
ethnicity and immigration status in multivariable cause-specific Cox regression models,
adjusting for the same set of variables used for calculating the IPT weights.
Country of origin and acculturation factors
We divided the immigrants into seven major world regions (Africa, Caribbean, Middle East,
Latin America, East Asia, South Asia, and Europe and Western nations) based on their
country of citizenship prior to arrival as per the classification used in previous studies (Table
1.2)
In the unweighted sample, we developed multivariable cause-specific hazard regression
models using a competing event framework and calculated adjusted hazards of death and
vascular event recurrence in each of these immigrant groups with long-term residents as the
reference group. We adjusted for the same set of variables used for calculating IPT weights.
Similarly, we used the following three immigration-related variables to evaluate the effect of

87
acculturation: time since immigration (≤ 5 years, 6 to 10 years, and > 10 years), age at arrival
(≤ 50 years, and > 50 years), and immigration class (economic, refugee, family, or other). For
each of these three immigration-related variables, we conducted a separate analysis in which
long-term residents were compared to immigrants using the given immigration-related
variable, separately.
6.3 Sensitivity analyses
Stroke severity and palliative care status
In an ad-hoc exploratory analyses, we added stroke severity (measured as a continuous
variable using the Canadian Neurological Stroke Score) and palliative care status to re-
calculate IPT weights, and then obtained the IPT weight-adjusted hazard ratio of death in
immigrants compared to long-term residents, overall, and stratified by age.
6.4 Exploratory analyses
Among those who survived 30-days following ischemic stroke, we evaluated the quality of
diabetes and dyslipidemia management in the first year following ischemic stroke. We
compared the following between immigrants and long-term residents: 1) glucose and lipid
monitoring – proportion of people receiving serum tests for Hemoglobin A1c (HbA1c) (in
people with diabetes) and low-density lipoprotein (LDL) within 1 year, and 2) in those who
had these tests, proportion of people meeting target LDL level of less than 2 mg/dL and
target HbA1c level < 7% (in people with diabetes). We could not determine other important
measure of secondary prevention (hypertension control) because of lack of available data on
ambulatory blood pressure monitoring. We wanted to select stroke survivors who did not die
in the first 30-days following ischemic stroke because we wanted to study quality of diabetes
and dyslipidemia management in ambulatory care.
In a subgroup of older stroke survivors (65 years or older) who survived one year following
ischemic stroke, and were not discharged to an acute care facility or complex continuing

88
care, we evaluated the following between immigrants and long-term residents: 1) proportion
of people who filled a statin prescription; 2) among those who filled statin prescriptions,
proportion of those who were adherent to medication, defined as proportion of days covered
(PDC) over 80%198; 3) among those who were diagnosed with atrial fibrillation, proportion
of people who filled a prescription of warfarin; and 4) among those who filled warfarin
prescription, proportion of those who were adherent to warfarin, defined as PDC over 80%.
Proportion of days covered was derived by dividing the total number of days covered with
the drug of interest by the number of days in the follow-up period (set to 365 days).199 The
total number of days covered by a drug was derived by adding up all the days of supply of
drug prescriptions for each patient. A PDC over 80% has been widely considered good
adherence for any drug use when using administrative databases.200 We limited these
analyses to this specific subgroup as the drug data from Ontario Drug Benefit plan is only
available for those over 65 years, and we needed data for an entire year following ischemic
stroke to evaluate drug adherence as noted above.
We used Chi-square tests for above comparisons and obtained P values to report statistical
significance between immigrants and long-term residents. We also reported weighted
standardized differences between immigrants and long-term residents for the above
comparisons. Standardized differences express the difference of means or prevalence
between two groups as a proportion of the pooled standard deviation, with standardized
differences of above 0.10 considered meaningful difference.138
7 Results
7.1 Baseline characteristics
Our study sample included 31,918 adults with ischemic stroke, of whom 2740 (8.6%) were
immigrants (Figure 4.3). Immigrants were younger than long-term residents at the time of the
index stroke (median age 70 vs. 76 years). Other baseline characteristics are reported in
Table 4.2. Diabetes was more common in South Asian immigrants (46.9%) and South Asian

89
long-term residents (49.7%) compared to other groups (Table 4.3). Immigrants were more
likely to be discharged to an inpatient facility providing complex care (12.2% vs. 8.0%) and
less likely to be discharged to a long-term care facility (4.6% vs. 9.6%) after hospitalization
compared to long-term residents (Table 4.2).
7.2 Primary outcomes
We observed 20,048 (62.9%) deaths during 168,885 person-years follow up, of which 9,005
(44.9%) were secondary to cardiovascular disease (Table 4.4). The adjusted cumulative
mortality rates at 1, 5, 10 and 15 years were lower in immigrants compared to long-term
residents, with greater divergence after 10 years (Figure 4.4 and Table 4.5). The unadjusted
hazard of death was lower in immigrants compared to long-term residents (HR 0.65; 95%
confidence interval 0.61-0.68) but the mortality advantage in immigrants was attenuated after
accounting for age and sex (0.87; 0.82-0.92), using separate IPT weights that include only
age and sex, and other comorbid conditions applying the IPT weights (HR 0.94; 0.88-1.00)
(Table 4.6). There was no change in these estimates in sensitivity analyses where palliative
care and stroke severity were added to IPT weight calculation (HR 0.92; 0.86-0.99). The
unadjusted hazard of cardiovascular mortality was again lower in immigrants compared to
long-term residents (HR 0.70; 0.64 to 0.77), but was similar after adjustment using IPT
weights (HR 1.04; 0.93-1.17).
In the sample of patients who survived to discharge from acute care or rehabilitation (n =
28,148), 7830 (27.8%) had a recurrent vascular event (stroke or myocardial infarction) and
6,620 (23.5%) had a recurrent stroke (Table 4.6). The adjusted cumulative incidence of
vascular event recurrence at 1, 5, 10, and 15 years was similar in immigrants and long-term
residents (Table 4.5 and Figure 4.4), as was the HR of vascular event recurrence (HR 0.96;
0.89-1.04) in unadjusted models, after accounting for age and sex (HR 1.04; 0.96-1.13) and
in fully adjusted models (HR1.01; 0.92-1.11) (Table 4.6). The hazard of stroke recurrence

90
was also similar in immigrants and long-term residents in the fully adjusted models (HR
1.04; 0.94 to 1.15).
7.3 Effect of age
In the analyses stratified by age at the time of stroke, being an immigrant was associated with
a lower adjusted hazard of death in those aged 75 years and younger (HR 0.82, 0.74-0.91) in
the fully adjusted models, but not in those aged over 75 years (HR 0.99; 0.91-1.08) (Table
4.6). Age at the time of stroke did not affect the association between immigration status and
vascular event recurrence (Table 4.6).
7.4 Ethnicity and Immigration status
The adjusted hazard of death was higher among South Asian immigrants compared to South
Asian long-term residents (HR 1.30; 1.05-1.61), similar in Chinese immigrants compared to
Chinese long-term residents (HR 0.96; 0.79-1.15) and lower in immigrants of other ethnic
origin compared to the long-term residents of other ethnicity (HR 0.89; 0.83-0.95) (P
interaction for ethnicity and immigration on mortality = 0.003) (Table 4.7). There was no
difference in the risk of vascular event recurrence between immigrants and long-term
residents within ethnic groups (P interaction = 0.12) (Table 4.7).
7.5 Country of origin and acculturation
With the exception of immigrants from South Asia, point estimates for the adjusted hazard
ratio of death were below 1.00 in immigrants from all regions compared to long-term
residents, with the greatest survival advantage seen in immigrants from East Asia (HR 0.75;
0.65-0.86) (Figure 4.5). There was some variation in the adjusted hazard of all-cause
mortality based on acculturation measures, with economic migrants (HR 0.90; 0.85-0.96) and
those who arrived after the age of 50 years (HR 0.90; 0.84-0.95), having lower risk than
long-term residents. The adjusted hazard of vascular event recurrence was higher in
immigrants from Africa, the Caribbean, South Asia, and Latin America compared to long-

91
term residents (Figure 4.5). There was no variation in the association between immigration
status and vascular event recurrence based on immigration class, time since immigration or
age at arrival (Figure 4.5).
7.6 Exploratory analyses
For the monitoring of serum HbA1c and LDL, our cohort consisted of 27,896 people who
had survived 30 days following ischemic stroke, of whom 2510 (9.0%) were immigrants.
Compared to long-term residents, immigrants were more likely to have serum LDL (35.4%
vs. 27.4%, P < 0.001, standardized difference = 0.18) and serum HbA1c (28.7% vs. 22.3%, P
< 0.001, standardized difference = 0.15) tested within one year of ischemic stroke. Of those
who received these tests, compared to long-term residents with diabetes, immigrants with
diabetes were less likely to reach the target HbA1c levels (< 7%) (52.7 vs. 59.7, P = 0.01,
standardized difference = 0.14).; whereas, among everyone, immigrants and long-term
residents were equally likely to meet target LDL levels (< 2 mg/dL) (66.9 vs. 63.7, P = 0.08,
standardized difference = 0.07).
We identified 15,372 eligible older stroke survivors (65 years or over and survived for a year
following stroke) to evaluate statin use, of whom 1065 (6.9%) were immigrants. The
proportion of immigrants and long-term residents who filled a statin prescription during the
one year following ischemic stroke was similar (83.8% and 80.8%, P = 0.45, standardized
difference = 0.08) and among those who filled these prescriptions, both immigrants and long-
term residents had equal adherence to statin, defined as more than 80% days covered in a
year (66.3% vs. 67.5%, P = 0.28, standardized difference = 0.04).
We included 3,269 eligible older stroke survivors with atrial fibrillation in the analyses to
evaluate warfarin use, of whom 198 (6.1%) were immigrants. A greater proportion of
immigrants filled warfarin prescription during the one year following ischemic stroke
compared to long-term residents (81.8% vs. 76.6%, P<0.001, standardized difference =
0.13); however, among those who filled these prescriptions, both immigrants and long-term

92
residents had similar adherence to warfarin (67.3% vs. 63.1%, P = 0.24, standardized
difference = 0.08).

93
Table 4.1. Administrative databases used to determine date of last health system contact and
statistics on contact with health care system in Ontario.
Abbreviations:
NRS – National Rehabilitation Reporting System; ODB – Ontario Drug Benefit; NACRS – National Ambulatory Care Reporting System; CIHI-DAD – Canadian Institute for Health Information-Discharge Abstract Database; OHCAS – Ontario Home Care Administration System; HCD – Home Care Database; OHIP – Ontario Health Insurance Plan Claims Database; OMHRS – Ontario Mental Health Reporting System
% of eligible people with some health care contact in 2015
Age in years (grouped)
Sex 0-19 20-35 36-65 66-84 ≥ 85
Male 85% 69% 80% 95% 94%
Female 86% 85% 88% 96% 96%

94
Table 4.2. Characteristics of included patients with ischemic stroke in Ontario, Canada
between April 2002 and March 2013 (N = 31,923).
Characteristics Immigrants
(n = 2,740, 8.6%)
Long-term residents
(n = 29,178, 91.4%)
Standardized
difference
Female, n (%) 1,317 (48.0) 14,348 (49.2) 0.02
Median age in years (Q1 - Q3) 70 (57-79) 76 (65-84) 0.41
Neighbourhood-level quintile, n (%)
Lowest quintile (1st) 884 (32.2) 6,521 (22.3) 0.22
Highest quintile (5th) 281 (10.2) 5,636 (19.3) 0.26
Fluent in English and/or French, n (%) 1,843 (67.2) 26,869 (92.1) 0.20
Comorbidities, n (%)
Hypertension 1,982 (72.3) 22,011 (75.4) 0.07
Diabetes 1,033 (37.7) 9,234 (31.6) 0.13
Dyslipidemia 1,147 (41.8) 11,569 (39.6) 0.04
Current smoker 355 (12.9) 5,182 (17.8) 0.13
Coronary artery disease 511 (18.6) 7,073 (24.2) 0.14
Previous stroke/TIA 692 (25.2) 8,184 (28.0) 0.06
Atrial fibrillation 391 (14.3) 5,692 (19.5) 0.14
Cancer 135 (4.9) 2,544 (8.7) 0.15
Dialysis 119 (4.3) 1,109 (3.8) 0.03
Dementia 149 (5.4) 3,024 (10.4) 0.18
Congestive heart failure 385 (14.0) 5,652 (19.4) 0.14
Median Charlson comorbidity index,
(Q1-Q3) 2 (1-3) 2 (1-3) 0.03
Treatment at a teaching hospital, n (%) 1,402 (51.1) 18,733 (64.2) 0.27
Treatment at a regional stroke centre, n
(%) 1,845 (67.3) 20,984 (71.9) 0.10
Median NIHSS, (Q1-Q3) 5 (2-11) 5 (2-10) 0.01
Received thrombolysis, n (%) 460 (16.8) 3,879 (13.3) 0.08

95
Admitted to the hospital, n (%) 2,318 (84.5) 24,986 (85.6) 0.03
Palliative status, n (%) 175 (7.5) 3,453 (13.8) 0.20
Median days in an intensive care unit,
(Q1-Q3) 1 (1-3) 2 (1-4) 0.28
Dead on discharge, n (%) 211 (7.7) 3,269 (11.2) 0.12
Disabled on discharge (mRS 3 to 5),
n(%) 1,347 (54.8) 13,597 (53.8) 0.02
Median mRS on discharge (Q1-Q3) 3 (2-4) 3 (2-4) 0.05
Discharge destination among those alive,
n (%) 1,347 (54.8) 13,597 (53.8) 0.02
Home or retirement home 1,294 (51.1) 12,648 (48.8) 0.07
Inpatient rehabilitation centre 771 (30.5) 8,091 (31.2) 0.02
Long-term care 116 (4.6) 2,495 (9.6) 0.20
Inpatient facility providing complex
care$ 309 (12.2) 2,070 (8.0) 0.16
Median duration of follow-up in years,
(Q1-Q3) 6.0 (2.9-8.8) 5.3 (1.1-7.9) 0.23
Q1-Q3 – 1st and 3rd quartile; SD – standard deviation; n – numbers, % - proportion of total N in column TIA –
transient ischemic attack, NIHSS - National Institutes of Health Stroke Scale derived in part from the Canadian
Neurological Scale, mRS – modified Rankin Scale; Std Diff – standardized difference, which expresses the
difference between the means of two populations as a proportion of the pooled standard deviation. $includes
acute care hospital or complex continuing facilities.

96
Table 4.3. Baseline characteristics of the cohort by ethnicity.
Immigrants (n = 2,740, 8.6%) Long-term residents (n = 29,178, 91.4%)
Chinese
n=358 (13.1)
South Asian
n=288 (10.5)
Other
n=2,094 (76.4)
Chinese
n=524 (1.8)
South Asian
n=310 (1.1)
Other
n=28,348 (97.1)
Female 166 (46.4) 138 (47.9) 1,012 (48.3) 277 (52.9) 138 (44.5) 13,935 (49.2)
Median age in year 75 (63-82) 70 (58-77) 69 (56-79) 76 (66-84) 72 (62-81) 76 (65-84)
Neighbourhood-level
quintile
Lowest quintile (1st) 99 (27.7) 75 (26.0) 709 (33.9) 124 (23.7) 63 (20.3) 6,333 (22.3)
Highest quantile (5th) 41 (11.5) 20 (6.9) 220 (10.5) 102 (19.5) 60 (19.4) 5,475 (19.3)
Fluent in English or
French 183 (51.1) 211 (73.3) 1,582 (75.5) 322 (61.5) 273 (88.1) 26,691 (94.2)
Comorbidities
Hypertension 263 (73.5) 216 (75.0) 1,503 (71.8) 406 (77.5) 242 (78.1) 21,367 (75.4)
Diabetes 103 (28.8) 135 (46.9) 795 (38.0) 192 (36.6) 154 (49.7) 8,886 (31.3)
Dyslipidemia 127 (35.5) 136 (47.2) 881 (42.1) 222 (42.4) 151 (48.7) 11,190 (39.5)
Current smoker 38 (10.6) 20 (6.9) 295 (14.1) 52 (9.9) 31 (10.0) 5,103 (18.0)
CAD 48 (13.4) 64 (22.2) 399 (19.1) 75 (14.3) 80 (25.8) 6,921 (24.4)
Previous stroke or TIA 85 (23.7) 90 (31.3) 518 (24.7) 109 (20.8) 92 (29.7) 7,984 (28.2)
Atrial Fibrillation 57 (15.9) 34 (11.8) 300 (14.3) 95 (18.1) 45 (14.5) 5,553 (19.6)

97
Dementia 18 (5.0) 13 (4.5) 117 (5.6) 49 (9.4) 26 (8.4) 2,948 (10.4)
CHF 31 (8.7) 54 (18.8) 298 (14.2) 82 (15.6) 57 (18.4) 5,513 (19.4)
Cancer 23 (6.4) 6 (2.1) 107 (5.1) 30 (5.7) 16 (5.2) 2,499 (8.8)
CKD 10 (2.8) 21 (7.3) 88 (4.2) 23 (4.4) 12 (3.9) 1,080 (3.8)
Median Charlson Index 2 (1-3) 3 (1-3) 2 (1-3) 2 (1-3) 2 (1-3) 2 (1-3)
Treatment at regional
stroke centre 227 (63.4) 163 (56.6) 1,460 (69.7) 362 (69.1) 223 (71.9) 20,382 (71.9)
Treatment at teaching
hospital 196 (54.7) 100 (34.7) 1,106 (52.8) 349 (66.6) 138 (44.5) 18,248 (64.4)
Median NIHSS 5 (3-11) 6 (2-12) 5 (2-11) 6 (2-12) 5 (2-12) 5 (2-10)
Received thrombolysis 50 (14.0) 54 (18.8) 356 (17.0) 83 (15.8) 50 (16.1) 3,747 (13.2)
Admitted to a hospital 303 (84.6) 240 (83.3) 1,773 (84.7) 455 (86.8) 254 (81.9) 24,278 (85.6)
Palliative care status 27 (8.9) 22 (9.2) 126 (7.1) 55 (12.1) 22 (8.7) 3,372 (13.9)
Median days in intensive 1 (1-7) 1 (1-2) 1 (1-4) 4 (2-9) 1 (1-3) 2 (1-4)
Dead on discharge 23 (7.6) 29 (12.1) 154 (8.7) 60 (13.2) 21 (8.3) 3,151 (13.0)
Disabled on discharge
(mRS 3 to 5) 187 (68.0) 135 (65.2) 941 (59.1) 252 (64.9) 136 (59.1) 12,356 (59.5)
Discharge destination
among those alive

98
Home or retirement
home
102 (36.4) 99 (46.9) 799 (49.4) 153 (38.7) 103 (44.2) 9,284 (44.0)
Inpatient rehabilitation
centre
112 (40.0) 68 (32.2) 589 (36.4) 148 (37.5) 84 (36.1) 7,823 (37.0)
Long-term care 26 (9.3) 11 (5.2) 71 (4.4) 60 (15.2) 15 (6.4) 2,130 (10.1)
Inpatient facility
providing complex
care
29 (10.4) 29 (13.7) 135 (8.3) 27 (7.3) 28 (12.0) 8,090 (50.4)
Median duration of
follow-up in years 6.0(2.7-8.1) 5.6 (1.7-8.3) 6.0 (3.0-9.0) 5.7 (1.1-8.1) 6.0 (1.8-8.6) 5.3 (1.1-7.9)
Footnote: n (%) for categorical variables, and median (Q1-Q3) for continuous variables. Abbreviations: transient ischemic attack (TIA), coronary artery disease
(CAD), congestive heart failure (CHF), chronic kidney disease (CKD), National Institutes of Health Stroke Scale (NIHSS), modified Rankin Scale (mRS).
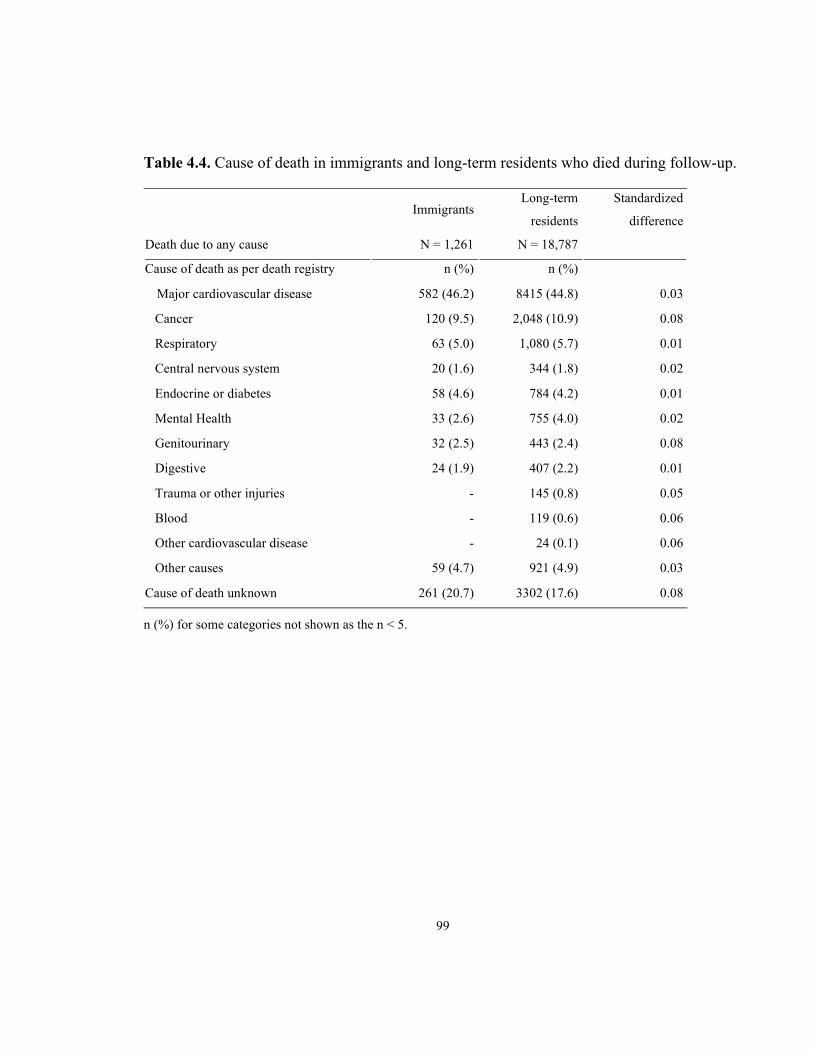
99
Table 4.4. Cause of death in immigrants and long-term residents who died during follow-up.
Immigrants Long-term
residents
Standardized
difference
Death due to any cause N = 1,261 N = 18,787
Cause of death as per death registry n (%) n (%)
Major cardiovascular disease 582 (46.2) 8415 (44.8) 0.03
Cancer 120 (9.5) 2,048 (10.9) 0.08
Respiratory 63 (5.0) 1,080 (5.7) 0.01
Central nervous system 20 (1.6) 344 (1.8) 0.02
Endocrine or diabetes 58 (4.6) 784 (4.2) 0.01
Mental Health 33 (2.6) 755 (4.0) 0.02
Genitourinary 32 (2.5) 443 (2.4) 0.08
Digestive 24 (1.9) 407 (2.2) 0.01
Trauma or other injuries - 145 (0.8) 0.05
Blood - 119 (0.6) 0.06
Other cardiovascular disease - 24 (0.1) 0.06
Other causes 59 (4.7) 921 (4.9) 0.03
Cause of death unknown 261 (20.7) 3302 (17.6) 0.08
n (%) for some categories not shown as the n < 5.

100
Table 4.5 Mortality and vascular event recurrence following ischemic stroke in immigrants
and long-term residents of Ontario
Adjusted cumulative incidence % (95% confidence interval)
All-cause mortality Vascular event recurrence
Time Immigrants Long-term residents Immigrants Long-term residents
1 year 23.1 (21.5-24.7) 23.7 (23.2-24.2) 12.8 (11.5-14.1) 12.1 (11.7-12.5)
5 years 43.7 (41.8-45.6) 45.1 (44.6-45.7) 22.1 (20.5-23.8) 23.0 (22.5-23.5)
10 years 61.2 (59.1-63.3) 65.7 (65.1-66.3) 28.3 (26.4-30.2) 28.7 (28.1-29.3)
15 years 76.8 (72.2-80.8) 81.8 (80.6-82.9) 31.3 (28.9-33.6) 31.3 (30.6-32.1)
Adjusted for age (continuous), sex (male reference), neighbourhood-income quintiles, diabetes, hypertension,
dyslipidemia, coronary artery disease, congestive heart failure, dementia, dialysis dependence, current smoking,
atrial fibrillation, prior stroke/TIA, cancer, Charlson comorbidity index, treatment at a teaching hospital, and
treatment at a regional stroke center using inverse probability inverse weights.

101
Table 4.6. The association between immigration status and long-term outcomes in patients with ischemic stroke in Ontario, Canada.
Immigrants Long-term residents Hazard ratio (95% CI) in immigrants compared to long-term
residents
Outcomes of interest Events
n (%) Total
Events
n (%) Total
Unadjusted
Age- and sex-
adjusted^£ IPTW-adjusted^
All-cause mortality& 1,261 (46.1) 2,743 18,787 (64.5) 29,185 0.65 (0.61-0.68) 0.87 (0.82-0.92) 0.94 (0.88-1.00)
≤ 75 years 532 (29.7) 1,758 6,014 (43.1) 13,965 0.67 (0.62-0.74) 0.78 (0.71-0.85) 0.83 (0.75-0.92)
> 75 years 741 (75.8) 978 12,797 (84.3) 15,179 0.87 (0.81-0.94) 0.95 (0.88-1.02) 1.00 (0.92-1.09)
Vascular event recurrence& 710 (28.4) 2,502 7,120 (27.8) 25,646 0.96 (0.89-1.04) 1.04 (0.96-1.13) 1.01 (0.92-1.11)
≤ 75 years 483 (29.2) 1,657 3,342 (28.1) 11,890 1.04 (0.94-1.14) 1.10 (1.00-1.22) 1.01 (0.91-1.10)
> 75 years 227 (26.9) 845 3,468 (27.7) 12,515 0.97 (0.85-1.11) 0.98 (0.85-1.13) 0.96 (0.83-1.10)
^Using cause specific Cox regression model; £these are obtained using IPT weights derived from models accounting for age and sex alone; &subgroups based on age at the time
of stroke: ≤ 75 years and > 75 years.
CI – confidence interval; IPTW – inverse probability treatment weights obtained after adjusting for: age (continuous), sex (male reference), income quintiles,
diabetes, hypertension, dyslipidemia, coronary artery disease, congestive heart failure, dementia, dialysis dependence, current smoking, atrial fibrillation, prior
stroke/TIA, cancer, Charlson comorbidity index, treatment at a teaching hospital, and treatment at a regional stroke centre.

102
Table 4.7. The interaction between immigration status and ethnicity on long-term
outcomes following ischemic stroke in Ontario, Canada.
Immigrants Long-term residents Adjusted
Hazard Ratio
(95% CI)&
Pinteraction^
Events, n
(%) Total
Events, n
(%) Total
All-cause
mortality 0.003
Chinese 175 (49.0) 357 290 (55.6) 522 0.96 (0.79-1.15) 0.47
South Asian 148 (51.4) 288 159 (51.5) 309 1.30 (1.05-1.61) <0.001
Other 938 (44.9) 2089 18,338 (64.8) 28,288 0.89 (0.83-0.95) -
Vascular event
recurrence 0.11
Chinese 67 (20.5) 327 125 (27.5) 454 0.77 (0.57-1.04) 0.05
South Asian 86 (33.7) 255 88 (31.3) 281 1.13 (0.84-1.53) 0.68
Other 557 (29.0) 1920 6907 (27.7) 24,911 1.06 (0.97-1.16) - &Using cause specific Cox regression model; ^test of interaction between immigration status and ethnicity
where immigration status is binary (yes vs. no) and ethnicity is categorical with ‘Other’ as the reference
group, we report P values of an overall join test, and of ethnicity-specific tests of interaction; CI –
confidence interval; IPTW – inverse probability treatment weights obtained after adjusting for: age
(continuous), sex (male reference), income quintiles, diabetes, hypertension, dyslipidemia, coronary artery
disease, congestive heart failure, dementia, dialysis dependence, current smoking, atrial fibrillation, prior
stroke/TIA, cancer, Charlson comorbidity index, treatment at a teaching hospital, and treatment at a
regional stroke centre.

103
‘Other’ category consisted mostly of those of Caucasian ethnicity.
Figure 4.1. Balance before and after application of inverse probability treatment (IPT)
weights to the cohort of patients with ischemic stroke.
Abbreviations: Teaching hosp – teaching hospital, CHF – congestive heart failure, afib – atrial fibrillation,
CAD – coronary artery disease, TIA – transient ischemic attack, Charlson – Charlson comorbidity index,
income_x – income quintiles where x represent a particular quintile.

104
Figure 4.2. Hypothetical cases to illustrate loss to follow-up using administrative database. Subject A was not to lost to follow-up, Subject
B would be considered lost to follow-up, and Subject C had the event of interest (death) and so is not considered lost to follow-up.
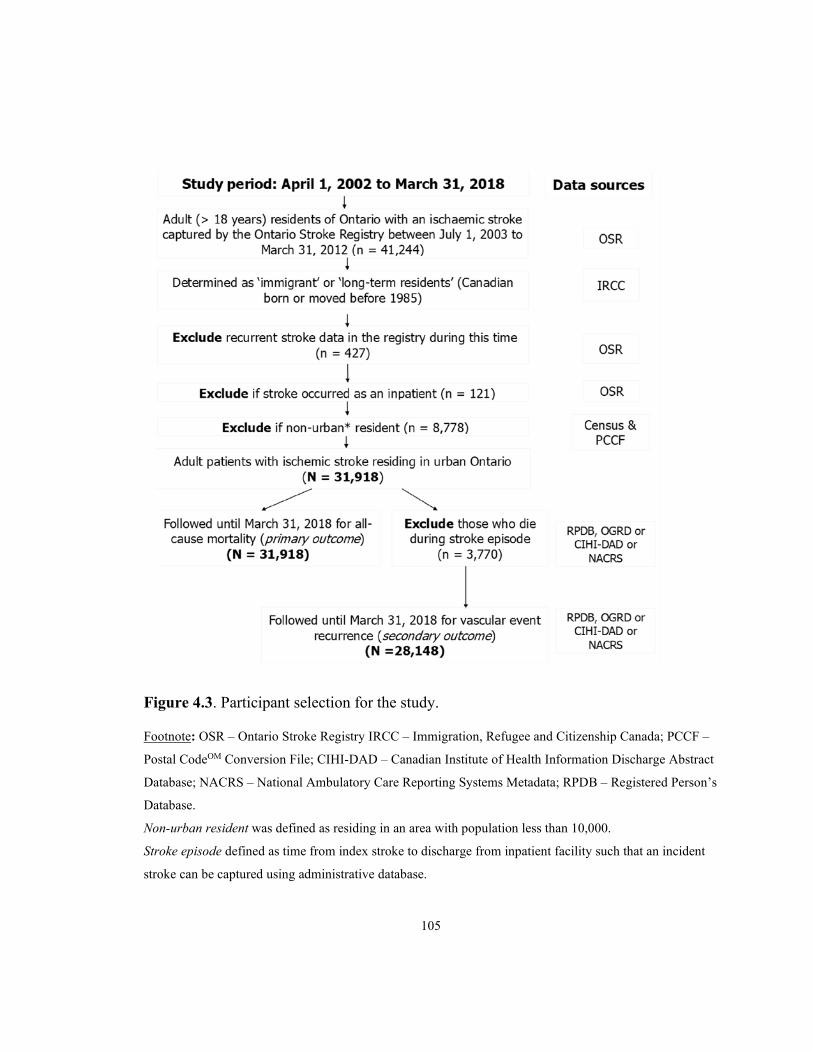
105
Figure 4.3. Participant selection for the study.
Footnote: OSR – Ontario Stroke Registry IRCC – Immigration, Refugee and Citizenship Canada; PCCF –
Postal CodeOM Conversion File; CIHI-DAD – Canadian Institute of Health Information Discharge Abstract
Database; NACRS – National Ambulatory Care Reporting Systems Metadata; RPDB – Registered Person’s
Database.
Non-urban resident was defined as residing in an area with population less than 10,000.
Stroke episode defined as time from index stroke to discharge from inpatient facility such that an incident
stroke can be captured using administrative database.

106
Figure 4.4. All-cause mortality and vascular event recurrence following ischemic stroke in
immigrants and long-term residents.
Footnote: Inverse probability treatment weight-adjusted survival curves for all-cause mortality (top) and
cumulative incidence curves for vascular event recurrence (bottom) following ischemic stroke among
immigrants (blue) and long-term residents (red) in Ontario from April 2002 to March 2018.

107
Figure 4.5. Results of multivariable proportional hazards models to evaluate effect of acculturation on mortality and vascular event
recurrence following ischemic stroke.

108
8 Discussion
8.1 Summary
Using data from over 30,000 patients with ischemic stroke, we found that immigrants had a
lower age- and sex-adjusted hazard of death, but not vascular event recurrence, compared to
long-term residents in Ontario, Canada. However, the association between immigration status
and mortality was attenuated after adjustment for comorbid conditions, and varied with age at
stroke onset, ethnicity, and region of origin.
8.2 Key findings
Our finding of a cumulative risk of death at 15 years after ischemic stroke of 81.8% in long-
term residents is consistent with previous studies.201,202 Age is an important predictor of all-
cause mortality following stroke.203 We found that immigrants were younger than long-term
residents at the time of their stroke and this suggests that primary preventative measures in
immigrants could be improved to reduce this burden of ischemic stroke at a younger age.
Despite this, immigrants had lower mortality than long-term residents in both unadjusted and
age- and sex-adjusted models suggesting the presence of a healthy immigrant effect.13 The
lower hazard of death associated with immigration status was attenuated after adjustment for
comorbid conditions and other factors, consistent with a previous Canadian study.66 It is
likely that the multivariable adjusted models adjusted for some factors (such as vascular risk
factors) in the causal pathway for the association between immigration status and mortality
following ischemic stroke. Of note, in patients who had their stroke before the age of 75
years, we found that immigrants maintained a survival advantage, even after accounting for
comorbid conditions, stroke severity, and palliative status. It is possible that the distribution
of unmeasured confounders such as life-style factors (alcohol use, body mass index, or
dietary habits) or secondary preventative care may vary between immigrants and long-term
residents depending on the age at the time of stroke. This would require further rigorous
evaluation in other populations.

109
Having a recurrent stroke is associated with a two-fold increase in 30-day mortality
compared to a first stroke, emphasizing the importance of studying stroke recurrence
risk.204,205 Our finding of a 23.0% cumulative risk of vascular event recurrence in long-term
residents at 5 years, and 28.7% at 10 years is lower than that described in previous studies,
likely because the cumulative risks in our study were adjusted for various demographic and
vascular risk factors rather than age alone.206 We found that this risk was similar in
immigrants and long-term residents both before and after adjustment for vascular risk factors,
and that this association was not modified by age at the time of stroke. Provision of health
insurance through the provincial plan may have mitigated the risk of stroke recurrence in
immigrants to Ontario, as lack of health coverage has been associated with higher
cardiovascular disease incidence in ethnic and immigrant minority groups in other
jurisdictions.207
We found that the association between immigration status and mortality was modified by
ethnicity, derived using last name algorithm, with lower mortality in immigrants compared to
long-term residents of non-South Asian, non-Chinese ethnicity, and with higher mortality in
immigrants compared to long-term residents of South Asian ethnicity. South Asian ethnicity
is associated with a high burden of vascular risk factors, especially diabetes, and a higher
burden of cardiovascular disease as a result.208 One study of people with diabetes found a
higher hazard of stroke recurrence, but a lower post-stroke mortality in South Asians
compared to non-South Asians114 similar to previous studies that have also found either a
lower or similar risk of cardiovascular mortality in South Asians compared to Caucasians, a
phenomenon sometimes known as the incidence-outcome paradox in South Asians.209 In
comparison, Chinese immigrants appear to have a lower incidence of coronary heart disease
but higher short-term mortality following acute myocardial infarction compared to
Caucasians, an incidence-outcome paradox which is the opposite of that observed in South
Asians.210 While these paradoxes could be due to index event bias, a form of collider bias,211
most previous studies have not studied immigration status and ethnicity together, and our

110
findings suggest that the interaction of immigration status and ethnicity, and not either alone,
should be considered when studying outcomes in ethnic groups following ischemic stroke.
We found that the risk of vascular event recurrence varied by region of origin, which can be
considered a proxy for ethnocultural characteristics. The hazard of vascular event recurrence
was higher in immigrants from Africa, Caribbean and Latin America compared to long-term
residents, even after accounting for differences in vascular risk factors. This is similar to
previous studies that reported higher cardiovascular recurrence in Black British181 and Latino
Hispanic groups in the US.212,213 In the US, the National Healthcare Quality Report (2018)
found that Black and Hispanic Americans received worse care than Whites for more than
35% of quality measures, including metrics like statin prescription following ischemic
stroke.214 Thus, more work is required to understand and mitigate the individual,
sociopolitical, and environmental factors that may contribute to the observed disparities
among immigrant ethnic groups in care and outcomes following ischemic stroke.207,215
The health of immigrants will be affected not only by ethnicity and ancestry but also by
immigration class and by the immigrant experience including immigration-related stress,
discrimination, and underemployment.216 One study reported better survival following stroke
in immigrants in Denmark than in Danish-born people, with a relatively better survival in
family-reunified migrants than refugees.62 In contrast to previous studies on the effect of
acculturation on immigrant health, we did not find a significant variation in the hazard of
death or vascular event recurrence based on immigration class, time since immigration or age
at arrival.156,217 However, a full understanding of the effect of the immigrant experience on
immigrant health would require future studies that employ a life-course context to better
understand the social determinants of health in immigrants.207
In a Canadian study of patients with acute ischemic stroke, ethnic differences in filling
prescriptions of statins, and warfarin were noted, with Chinese and South Asian patients
more likely to fill statin prescriptions than other Canadians (Chinese 43.5%, South Asian

111
50.8% and Other 41.9%).218 In those diagnosed with atrial fibrillation, the adjusted OR of
warfarin use was lower in Chinese compared to other Canadians (adjusted OR 0.75; 95% CI
0.59-0.95) but was similar in South Asian and other Canadians.218 Immigration status was not
studied as part of this study. A systematic review of cardiac medication adherence in South
Asians found that non-adherence to cardiac medications among South Asians was
multifaceted, and medication side effects, costs, and forgetfulness were commonly reported
reasons for non-adherence.219 Educational intervention during six months post-discharge
following an acute coronary syndrome was associated with better adherence and lower
discontinuation rates in all participants, irrespective of immigration status in a Danish study,
suggesting that secondary prevention can be improved by better knowledge and
understanding the rationale for drug adherence.220 We were not able to identify other studies
on the quality of diabetes and dyslipidemia management in immigrants following stroke. Our
findings of higher or equal monitoring of serum LDL and HbA1c levels in immigrants
compared with long-term residents, but a lower proportion of immigrants attaining target
diabetes control (HbA1c < 7%) compared to long-term residents need further evaluation to
determine whether these results are replicable and, if so, to understand what is driving these
differences.
8.3 Strengths and limitations
Key strengths of our study include the use of linked population-based administrative
databases that allowed follow-up to 16 years, and the ability to account for right-censoring
due to emigration. This is an important factor when studying long-term outcomes in
immigrants, as the healthy immigrant effect may in part be driven by late life emigration
back to home countries, resulting in a falsely low mortality rate in immigrants (a
phenomenon known as “salmon bias”).197
Certain limitations merit discussion. First, for some of the analyses, ethnicity was determined
using surname algorithms to identify those of Chinese and South Asian descent, and despite
112
the excellent positive predictive property of the algorithm, misclassification is possible and
the algorithm tends to exclude those of South Asian descent with Muslim and Christian
surnames. In addition, even within these categories, people identified as being of South Asian
or Chinese descent cannot be considered homogeneous as these groups will include
individuals from different countries of origin with differing biological and behavioural risks.
Furthermore, the ‘other’ (non-South Asian, non-Chinese) category may be more diverse for
immigrants than for long-term residents, who are more likely to be of Caucasian descent,
thus requiring a cautious interpretation of interaction between immigration status and
ethnicity for mortality outcomes.137 We were also not able to identify immigrants who
arrived to Canada prior to 1985, and so the comparison group of long-term residents will
include immigrants who have resided in Ontario for more than 18 years. While this could
partly explain the younger age of immigrants at the time of stroke, the mortality advantage in
immigrants was noted even after accounting for age, and was also noted in the subgroup of
people less than 75 years at the time of their stroke, suggesting that misclassification did not
have significant impact on the observed association. Second, data on risk factors such as diet,
physical activity, and obesity were not available, nor was information on the severity or
duration of other known risk factors such as diabetes, hypertension and hyperlipidemia.221
We also did not have information on secondary preventative measures, or the extent to which
individuals were adherent to such measures, information on the ethnic composition of
neighborhoods, or information on the lived experiences of immigrants which could include
factors like discrimination or racism.218,222,223 Further, our findings of the quality of diabetes
and dyslipidemia control and medication adherence require cautious interpretation because
these were obtained from those who survived for at least one year post-stroke and may
undercount poor adherence in those who die early. Lastly, our findings may not be
generalizable to patients residing in non-urban centres, jurisdictions with health care systems
not similar to that of Canada, or non-documented immigrants who may not be eligible for
coverage under the provincial health care plan.
113
8.4 Implications
Our finding of lower mortality after ischemic stroke supports the concept of a healthy
immigrant effect, due to a selective migration pattern whereby the healthy are more likely to
migrate224; however, the magnitude and the direction of this effect is not homogeneous across
all immigrants. Future studies should focus on understanding and addressing the factors
associated with stroke at a young age in immigrants, on studying the various
sociodemographic factors that affect immigrants’ health and on developing appropriate
screening and preventive measures to reduce the burden of ischemic stroke and its
consequences in both immigrants and long-term residents.

114
Chapter 5 Discussion
115
1 Summary
Immigration is a fundamental human behaviour, and, similar to other behaviours, it also has
implications on human health. This work aims to fill the gap in current knowledge on the
effects of immigration on health, pertaining to stroke, a leading cause of disability and death
worldwide.
In chapter 2, we studied the incidence of stroke in immigrant groups in Ontario, and two
important findings emerged: stroke incidence is lower in immigrants than long-term
residents, yet, stroke occurs at a younger age in immigrants. While the overall lower
incidence could be due to a healthy immigrant effect, evidenced by lower rates of vascular
risk factors in immigrants compared to long-term residents, the younger age at the time of
stroke could either be due to the variation in age distribution of immigrants and long-term
residents, the latter being older, or due to onset of vascular risk factors at an early age or
poorly managed vascular risk factors. Immigration status also has age-dependent effects on
stroke incidence, with similar risk of stroke at younger ages (below 30 years) and a greater
reduction in risk in immigrants at older ages (after 50 years) that requires further studies to
delineate the reasons. Further, there is variation in these associations based on immigration
class and country of origin, with African, Caribbean and Latin American immigrants having
a relative higher risk of stroke than other immigrant groups. Knowledge of this complex
relationship of immigration status and associated immigration-specific characteristics can
help develop targeted primary preventative efforts for both immigrants and long-term
residents.
In chapter 3, we evaluated the quality of acute stroke care in immigrants and long-term
residents with ischemic stroke or TIA. We found that immigrants receive similar or better
acute stroke care compared to long-term residents. However, among people with ischemic
stroke, immigrants are more likely to be disabled on discharge despite a similar mortality rate
at 30 days. A greater stroke severity and a less frequent use of palliative care services use in

116
immigrants compared to long-term residents may be some explanations for this finding.
Despite being young at the time of stroke, the greater stroke severity and higher disability in
immigrants compared to long-term residents requires further investigation.
In chapter 4, we evaluated the long-term outcomes following ischemic stroke in immigrants
and long-term residents. Immigrants have a lower all-cause mortality compared to long-term
residents, especially in those who have stroke at a younger age (below 75 years). This is
partly due to the younger age of immigrants at the time of stroke; however, the association
persists even after adjusting for age. Compared to other immigrant groups, mortality is higher
in South Asian immigrants, whereas vascular event recurrence is higher in Latin American,
African and Caribbean immigrants, suggesting the need to develop targeted secondary stroke
prevention strategies for different immigrant groups. Further, there is an interaction between
immigration status and ethnicity for our outcomes of interest, suggesting the need for further
detailed evaluation of the reasons for poor outcomes in immigrant ethnic minority groups.
2 Limitations
A major limitation of the included work is lack of a comparative non-immigrant group, for
some analyses, consisting of people of similar ethnic and cultural background as the
immigrants, other than those of South Asian or East Asian origin. This limits our ability to
definitely disentangle the immigration- and ethnicity-effects in our observed associations.
One way to get around this limitation would be to study the incidence rate of stroke and
outcomes following stroke in immigrants in Ontario based on different countries of origin,
and compare these rates to those observed in home countries. Another approach could
include a comparison group of second-generation immigrants so that when comparing them
to first-generation immigrants, one can eliminate the ethnicity effect. Unfortunately, the latter
would require accounting for secular trends in the stroke incidence and outcomes over two
generations, and also require extended follow-up. We did not have information on second
generation immigrants in Ontario.

117
Second, we could only evaluate acculturation based on time in Ontario and age at arrival.
However, acculturation is a highly nuanced concept and it varies depending on individual
circumstances. This may be one reason why we were unable to show the acculturation effect
with the two measures available to us: time since immigration and age at arrival. Measures
such as dietary change, having friends of different ethnic/cultural background, sense of
belonging, and languages spoken at home are some methods by which acculturation has been
measured in the past. We did not have access to such self-reported measures and future work
could be undertaken to evaluate this using data by linking self-reported survey data to
administrative data or by mix-methods or qualitative research to evaluate acculturation.
Third, we found that the age distribution of immigrants was significantly different than that
of long-term residents, with immigrants being generally younger than long-term residents in
cohorts of people both with and without stroke. Therefore, we specifically evaluated the
effect of this age difference on our outcomes using different methods. However, age
remained an important modifier of the association between immigration status and stroke
incidence and outcomes. Immigrants who move when they are older (60 years and above)
have a considerably different health status than that of immigrants who move at an early age,
and than that of host populations 60 years and above. Even though we allowed for long
duration of follow-up (up to 15 years), we believe that it may be inadequate to account for
the impact age on our findings. Ideally, one should be able to compare the rate of stroke
incidence and outcomes over a lifespan in young immigrants and long-term residents.
While this work highlights differences in stroke incidence and outcomes in immigrants and
long-term residents, we were unable identify the drivers of the observed effects. Qualitative
studies of immigrant groups experiencing stroke symptoms as well as health care providers
could reveal important information that can be used in the future to develop targeted
interventions.

118
We recognize that being an immigrant is closely related to various other social determinants
of health such as education, income, neighbourhood-level effects, work conditions, social
isolation and racism or discrimination, of all which have been associated with health
outcomes. Providing unadjusted and age- and sex-adjusted estimates may provide some
insights on the influence of these and other factors, and could capture the influence of lived
experiences of immigrants; however, we were unable to fully evaluate the mediating roles of
these factors in our observations, nor were we able to measure self-perceived discrimination
or racism.
3 Future projects
We have highlighted the incidence and outcomes of stroke in immigrants and long-term
residents; however, our understanding of the quality of primary and secondary prevention in
these groups is poor and deserves future study. Further, experiences prior to and upon
immigration vary between men and women, and these experiences can influence their health,
so future work should evaluate the potential for sex and gender differences in stroke care and
outcomes in immigrant groups.225,226 An interaction between immigration status and vascular
risk factors, especially that of diabetes in South Asians, and hypertension in African and
Caribbean immigrants would be another clinically meaningful interaction to evaluate in
future studies, with the goal of identifying targets for secondary prevention to reduce the risk
of mortality and vascular event recurrence in these immigrant groups.
Future qualitative studies may be helpful in understanding factors that influence stroke care
and outcomes in immigrants. Specific areas for study could include knowledge of stroke
symptoms and the necessary steps required when having these symptoms, as well as attitudes
and preferences for stroke care interventions and palliative care use in immigrant and non-
immigrant groups. Studying post-stroke care, such as out-of-pocket expenses for
rehabilitation services not covered under provincial health insurance plan, access to home
care services, and informal care giving can help understand the extent to which stroke affects

119
lives of patients and their families, and whether it is varies by immigration status. Qualitative
studies on the lived experience of immigrants with stroke may be helpful in identifying
unmet needs and designing interventions to address these.
4 Implications
The findings of this dissertation highlight the challenges in studying health outcomes of
immigrant populations because these populations are not homogeneous. However, they all
have a common element – the act of immigration and the lived experience of an immigrant.
Therefore, the principles of the association between immigration status and health outcomes
found in these projects may be applicable to other medical conditions. While the magnitude
of the association will vary based on the disease studied, we doubt that the direction of
effects will vary. This research work supports the healthy immigration effect, the return
migration (salmon effect) or higher rate of loss to follow-up in immigrants, and, to some
degree, the acculturation effect. The existence of these epidemiological phenomena has been
contentious, and this body of work offers important insights.
The dissertation also highlights the need to evaluate and improve primary stroke prevention
in immigrants by improving access to, and knowledge of preventative primary care, and by
development of culturally sensitive public health campaigns to improve knowledge of stroke
symptoms. Furthermore, the quality of secondary stroke prevention and its impact on
vascular event recurrence and mortality deserves detailed evaluation. Lastly, the variation in
observed associations based on country of origin of immigrants should stimulate further
research to evaluate biological and social factors for the observed variation based on country
of origin.

120
Curriculum Vitae
Name: Manav V. Vyas
Research training
07/2015-present PhD, Institute of Health Policy, Management and Evaluation,
University of Toronto, Canada
07/2017-present Clinician Investigator Program (CIP), University of Toronto, Toronto,
Canada
09/2010-06/2012 MSc, Epidemiology & Biostatistics, Western University, London,
Ontario, Canada
09/2010-06/2012 Canadian Institutes of Health Research Strategic Training Program in
Vascular Research, Canada
Clinical training
07/2017 EEG certification, Canadian Society of Clinical Neurophysiologists
07/2012-06/2017 Neurology, Fellow of the Royal College of Physicians of Canada
07/2003-06/2009 MBBS, Smt. NHL Municipal Medical School, Gujarat University,
India
Awards & scholarships
2019-2021 CIHR Fellowship Award, Canadian Institutes of Health Research,
Canada

121
2019-2020 Prince Mahidol Marmot Research Fellow, University College London,
United Kingdom
2018-2019 Heart & Stroke Richard Lewar Centre of Excellence/CANHEART
SPOR Studentship Award, Canada
2018 American Academy of Neurology (AAN) Future Clinical Researcher
in Neurology and Neuroscience, USA
2018 AAN Young Investigator Award (declined), USA
2015 OSOTF Unilever/Lipton Graduate Fellowships in Neurosciences,
Canada
Publications
1. Vyas MV, Laupacis A, Austin PC, Fang J, Silver FL, Kapral MK. Association between
immigration status and acute stroke care: a retrospective study. Stroke. 2020 May;
51(5):1555-1562. [PhD paper #1]
2. Vyas MV, Austin PC, Fang J, Laupacis A, Silver FL, Kapral MK. Immigration Status,
Ethnicity, and Outcomes following Ischaemic Stroke. Neurology. Accepted. October
2020 [PhD paper #2]
3. Vyas MV, Fang J, Austin PC, Cheung M, Laupacis A, Silver FL, Kapral MK.
Immigration status and mortality: the importance of accounting for lost to follow-up.
BMJ Open. Under review. June, 2020. [Comprehensive paper]
4. Vyas MV, Austin PC, Pequeno P, Fang J, Silver FL, Laupacis A, Kapral MK. Incidence
of stroke by immigration status: a retrospective study of 8 million adults. To be
Submitted. January, 2021. [PhD paper #3]
122
References
1. Nathan R, Getz WM, Revilla E, et al. A movement ecology paradigm for unifying
organismal movement research. Proc Natl Acad Sci U S A. 2008;105:19052–19059.
2. Zhu Z, Dennell R, Huang W, et al. Hominin occupation of the Chinese Loess Plateau
since about 2.1 million years ago. Nature. Nature Publishing Group; 2018;559:608–612.
3. Abubakar I, Aldridge RW, Devakumar D, et al. The UCL-Lancet Commission on
Migration and Health: the health of a world on the move. Lancet Lond Engl.
2018;392:2606–2654.
4. United Nations, Department of Economic and Social Affairs, Population Division
(2019). International Migration 2019: Report (ST/ESA/SER.A/438). 2019.
5. OECD. International Migration Outlook 2019 [online]. 2019. Accessed at:
https://www.oecd-ilibrary.org/content/publication/c3e35eec-en.
6. OECD/European Union (2015), Indicators of Immigrant Integration 2015: Settling In,
OECD Publishing, Paris.
7. United Nations, Department of Economic and Social Affairs, Population Division
(2019). [online]. International Migration 2019: Report (ST/ESA/SER.A/438).; 2019.
Accessed at:
https://www.un.org/en/development/desa/population/migration/publications/migrationre
port/docs/InternationalMigration2019_Report.pdf.
8. Canada G of CI and NA. First Nations in Canada [online]. 2011. Accessed at:
https://www.rcaanc-cirnac.gc.ca/eng/1307460755710/1536862806124. Accessed
October 13, 2020.

123
9. Government of Canada SC. 150 years of immigration in Canada [online]. 2016.
Accessed at: http://www.statcan.gc.ca/pub/11-630-x/11-630-x2016006-eng.htm.
Accessed July 12, 2017.
10. Government of Canada SC. The Daily — Immigration and ethnocultural diversity: Key
results from the 2016 Census [online]. 2017. Accessed at:
http://www.statcan.gc.ca/daily-quotidien/171025/dq171025b-eng.htm. Accessed
October 26, 2017.
11. Gushulak BD, Pottie K, Roberts JH, Torres S, DesMeules M. Migration and health in
Canada: health in the global village. CMAJ Can Med Assoc J. 2011;183:E952–E958.
12. Uninsurance I of M (US) C on the C of. Effects of Health Insurance on Health [online].
Care Cover. Too Little Too Late National Academies Press (US); 2002. Accessed at:
https://www.ncbi.nlm.nih.gov/books/NBK220636/. Accessed August 20, 2020.
13. Vang ZM, Sigouin J, Flenon A, Gagnon A. Are immigrants healthier than native-born
Canadians? A systematic review of the healthy immigrant effect in Canada. Ethn
Health. 2017;22:209–241.
14. Moullan Y, Jusot F. Why is the ‘healthy immigrant effect’ different between European
countries? Eur J Public Health. 2014;24:80–86.
15. Osypuk TL, Alonso A, Bates LM. Understanding the Healthy Immigrant Effect and
Cardiovascular Disease: Looking to Big Data and Beyond. Circulation. 2015;132:1522–
1524.
16. Lu C, Ng E. Healthy immigrant effect by immigrant category in Canada. Health Rep.
2019;30:3–11.

124
17. Gushulak BD, MacPherson DW. Health Aspects of the Pre-Departure Phase of
Migration. PLoS Med [online serial]. Public Library of Science; 2011;8. Accessed at:
http://journals.scholarsportal.info/detailsundefined. Accessed August 20, 2020.
18. Singh GK, Siahpush M. All-cause and cause-specific mortality of immigrants and
native born in the United States. Am J Public Health. 2001;91:392–399.
19. Paszat L, Sutradhar R, Liu Y, Baxter NN, Tinmouth J, Rabeneck L. Risk of colorectal
cancer among immigrants to Ontario, Canada. BMC Gastroenterol. 2017;17:85.
20. Anderson KK, Cheng J, Susser E, McKenzie KJ, Kurdyak P. Incidence of psychotic
disorders among first-generation immigrants and refugees in Ontario. CMAJ Can Med
Assoc J J Assoc Medicale Can. 2015;187:E279–E286.
21. Tu JV, Chu A, Rezai MR, et al. The Incidence of Major Cardiovascular Events in
Immigrants to Ontario, Canada: The CANHEART Immigrant Study. Circulation. Epub
2015 Aug 31.
22. Bouchardy C, Parkin DM, Wanner P, Khlat M. Cancer mortality among north African
migrants in France. Int J Epidemiol. 1996;25:5–13.
23. Okrainec K, Bell CM, Hollands S, Booth GL. Risk of cardiovascular events and
mortality among a population-based cohort of immigrants and long-term residents with
diabetes: Are all immigrants healthier and if so, for how long? Am Heart J.
2015;170:123–132.
24. Razum O. Commentary: Of salmon and time travellers—musing on the mystery of
migrant mortality. Int J Epidemiol. Oxford Academic; 2006;35:919–921.

125
25. Gotay CC, Reid MS, Dawson MY, Wang S. Acculturation and smoking in North
Americans of Chinese ancestry: A systematic review. Can J Public Health Rev Can
Sante Publique. 2015;106:e333-340.
26. Lui PP, Zamboanga BL. Acculturation and alcohol use among Asian Americans: A
meta-analytic review. Psychol Addict Behav J Soc Psychol Addict Behav.
2018;32:173–186.
27. Perez LG, Chavez A, Marquez DX, Soto SC, Haughton J, Arredondo EM. Associations
of Acculturation With Self-Report and Objective Physical Activity and Sedentary
Behaviors Among Latinas. Health Educ Behav Off Publ Soc Public Health Educ.
2017;44:431–438.
28. Lesser IA, Gasevic D, Lear SA. The association between acculturation and dietary
patterns of South Asian immigrants. PloS One. 2014;9:e88495.
29. Toselli S, Gualdi-Russo E, Marzouk D, Sundquist J, Sundquist K. Psychosocial health
among immigrants in central and southern Europe. Eur J Public Health. Oxford
Academic; 2014;24:26–30.
30. McClure HH, Snodgrass JJ, Martinez CR, Eddy JM, Jiménez RA, Isiordia LE.
Discrimination, psychosocial stress, and health among Latin American immigrants in
Oregon. Am J Hum Biol. 2010;22:421–423.
31. Jong GFD, Madamba AB. A Double Disadvantage? Minority Group, Immigrant Status,
and Underemployment in the United States. Soc Sci Q. 2001;82:117–130.
32. Harris R, Tobias M, Jeffreys M, Waldegrave K, Karlsen S, Nazroo J. Racism and
health: The relationship between experience of racial discrimination and health in New
Zealand. Soc Sci Med. 2006;63:1428–1441.

126
33. Shariff-Marco S, Klassen AC, Bowie JV. Racial/Ethnic Differences in Self-Reported
Racism and Its Association With Cancer-Related Health Behaviors. Am J Public
Health. American Public Health Association; 2010;100:364–374.
34. Vyas MV, Garg AX, Iansavichus AV, et al. Shift work and vascular events: systematic
review and meta-analysis. BMJ. 2012;345:e4800.
35. Dun A, Zhao X, Jin X, et al. Association Between Night-Shift Work and Cancer Risk:
Updated Systematic Review and Meta-Analysis. Front Oncol. 2020;10:1006.
36. Cheung BY, Chudek M, Heine SJ. Evidence for a sensitive period for acculturation:
younger immigrants report acculturating at a faster rate. Psychol Sci. 2011;22:147–152.
37. Noels KA, Berry JW. Acculturation in Canada. Camb Handb Accult Psychol. New
York, NY, US: Cambridge University Press; 2006. p. 274–293.
38. Abraído-Lanza AF, Dohrenwend BP, Ng-Mak DS, Turner JB. The Latino mortality
paradox: a test of the “salmon bias” and healthy migrant hypotheses. Am J Public
Health. 1999;89:1543–1548.
39. Lu Y, Qin L. Healthy migrant and salmon bias hypotheses: a study of health and
internal migration in China. Soc Sci Med 1982. 2014;102:41–48.
40. Akl EA, Briel M, You JJ, et al. Potential impact on estimated treatment effects of
information lost to follow-up in randomised controlled trials (LOST-IT): systematic
review. BMJ [online serial]. 2012;344. Accessed at:
https://www.bmj.com/content/344/bmj.e2809. Accessed February 22, 2020.
41. Greenland S. Response and follow-up bias in cohort studies. Am J Epidemiol.
1977;106:184–187.

127
42. Markides KS, Eschbach K. Aging, migration, and mortality: current status of research
on the Hispanic paradox. J Gerontol B Psychol Sci Soc Sci. 2005;60 Spec No 2:68–75.
43. Acciai F, Noah AJ, Firebaugh G. Pinpointing the Sources of the Asian Mortality
Advantage in the United States. J Epidemiol Community Health. 2015;69:1006–1011.
44. Feigin VL, Roth GA, Naghavi M, et al. Global burden of stroke and risk factors in 188
countries, during 1990–2013: a systematic analysis for the Global Burden of Disease
Study 2013. Lancet Neurol. 2016;15:913–924.
45. GBD 2016 Lifetime Risk of Stroke Collaborators, Feigin VL, Nguyen G, et al. Global,
Regional, and Country-Specific Lifetime Risks of Stroke, 1990 and 2016. N Engl J
Med. 2018;379:2429–2437.
46. Johnson CO, Nguyen M, Roth GA, et al. Global, regional, and national burden of
stroke, 1990–2016: a systematic analysis for the Global Burden of Disease Study 2016.
Lancet Neurol. Elsevier; 2019;18:439–458.
47. Krueger H, Koot J, Hall RE, O’Callaghan C, Bayley M, Corbett D. Prevalence of
Individuals Experiencing the Effects of Stroke in Canada: Trends and Projections.
Stroke. 2015;46:2226–2231.
48. Verma AA, Guo Y, Kwan JL, et al. Patient characteristics, resource use and outcomes
associated with general internal medicine hospital care: the General Medicine Inpatient
Initiative (GEMINI) retrospective cohort study. CMAJ Open. 2017;5:E842–E849.
49. Rajsic S, Gothe H, Borba HH, et al. Economic burden of stroke: a systematic review on
post-stroke care. Eur J Health Econ HEPAC Health Econ Prev Care. 2019;20:107–134.
50. Vyas MV, Hackam DG, Silver FL, Laporte A, Kapral MK. Lost Productivity in Stroke
Survivors: An Econometrics Analysis. Neuroepidemiology. 2016;47:164–170.

128
51. Mittmann N, Seung SJ, Hill MD, et al. Impact of disability status on ischemic stroke
costs in Canada in the first year. Can J Neurol Sci J Can Sci Neurol. 2012;39:793–800.
52. The Public Health Agency of Canada. The Economic Burden of Illness in Canada,
2010. Epub 2017.
53. Thorvaldsen P, Kuulasmaa K, Rajakangas AM, Rastenyte D, Sarti C, Wilhelmsen L.
Stroke trends in the WHO MONICA project. Stroke. 1997;28:500–506.
54. Church TR. A novel form of ascertainment bias in case-control studies of cancer
screening. J Clin Epidemiol. 1999;52:837–847.
55. Henderson C, Evans-Lacko S, Thornicroft G. Mental Illness Stigma, Help Seeking, and
Public Health Programs. Am J Public Health. 2013;103:777–780.
56. Mandelzweig L, Goldbourt U, Boyko V, Tanne D. Perceptual, social, and behavioral
factors associated with delays in seeking medical care in patients with symptoms of
acute stroke. Stroke. 2006;37:1248–1253.
57. Mc Sharry J, Baxter A, Wallace LM, Kenton A, Turner A, French DP. Delay in seeking
medical help following Transient Ischemic Attack (TIA) or “mini-stroke”: a qualitative
study. PloS One. 2014;9:e104434.
58. Boulanger JM, Lindsay MP, Gubitz G, et al. Canadian Stroke Best Practice
Recommendations for Acute Stroke Management: Prehospital, Emergency Department,
and Acute Inpatient Stroke Care, 6th Edition, Update 2018. Int J Stroke Off J Int Stroke
Soc. 2018;13:949–984.
59. Powers WJ, Rabinstein AA, Ackerson T, et al. Guidelines for the Early Management of
Patients With Acute Ischemic Stroke: 2019 Update to the 2018 Guidelines for the Early
Management of Acute Ischemic Stroke: A Guideline for Healthcare Professionals From

129
the American Heart Association/American Stroke Association. Stroke. 2019;50:e344–
e418.
60. Wein T, Lindsay MP, Côté R, et al. Canadian stroke best practice recommendations:
Secondary prevention of stroke, sixth edition practice guidelines, update 2017. Int J
Stroke Off J Int Stroke Soc. 2018;13:420–443.
61. Kernan WN, Ovbiagele B, Black HR, et al. Guidelines for the prevention of stroke in
patients with stroke and transient ischemic attack: a guideline for healthcare
professionals from the American Heart Association/American Stroke Association.
Stroke. 2014;45:2160–2236.
62. Byberg S, Agyemang C, Zwisler AD, Krasnik A, Norredam M. Cardiovascular disease
incidence and survival: Are migrants always worse off? Eur J Epidemiol. 2016;31:667–
677.
63. Khan FA, Zia E, Janzon L, Engstrom G. Incidence of stroke and stroke subtypes in
Malmö, Sweden, 1990-2000: marked differences between groups defined by birth
country. Stroke. 2004;35:2054–2058.
64. Fedeli U, Pigato M, Avossa F, et al. Large variations in stroke hospitalization rates
across immigrant groups in Italy. J Neurol. 2016;263:449–454.
65. Moon JR, Capistrant BD, Kawachi I, et al. Stroke incidence in older US Hispanics: is
foreign birth protective? Stroke. 2012;43:1224–1229.
66. Saposnik G, Redelmeier DA, Lu H, Lonn E, Fuller-Thomson E, Ray JG. Risk of
premature stroke in recent immigrants (PRESARIO) Population-based matched cohort
study. Neurology. 2010;74:451–457.

130
67. Hollenhorst CN, Gibbs R, Kim S, Agyemang C, Lisabeth L, Morgenstern LB. Mexican
American Immigrants Demonstrate Better Functional Stroke Outcomes Compared With
Mexican American Nonimmigrants. Stroke. 2020;51:3129–3132.
68. Sirutis B, Brown C, Lopez JG, et al. A Comparative Case Series of Haitian and non-
Haitian Stroke Patients at a Single Center in Miami, Florida. J Health Care Poor
Underserved. 2019;30:1560–1568.
69. Little W. Chapter 11. Race and Ethnicity. Introd Sociol - 2nd Can Ed [online]. 2nd ed.
BCcampus; 2016. Accessed at:
https://opentextbc.ca/introductiontosociology/chapter/chapter11-race-and-ethnicity/.
Accessed October 14, 2020.
70. Agyemang C, van Oeffelen AAM, Norredam M, et al. Ethnic disparities in ischemic
stroke, intracerebral hemorrhage, and subarachnoid hemorrhage incidence in the
Netherlands. Stroke J Cereb Circ. 2014;45:3236–3242.
71. Wolfe CDA, Rudd AG, Howard R, et al. Incidence and case fatality rates of stroke
subtypes in a multiethnic population: the South London Stroke Register. J Neurol
Neurosurg Psychiatry. BMJ Publishing Group Ltd; 2002;72:211–216.
72. Howard VJ. Reasons Underlying Racial Differences in Stroke Incidence and Mortality.
Stroke J Cereb Circ. 2013;44:S126.
73. Sacco RL, Boden-Albala B, Gan R, et al. Stroke incidence among white, black, and
Hispanic residents of an urban community: the Northern Manhattan Stroke Study. Am J
Epidemiol. 1998;147:259–268.

131
74. Nguyen-Huynh MN, Johnston SC. Regional variation in hospitalization for stroke
among Asians/Pacific Islanders in the United States: a nationwide retrospective cohort
study. BMC Neurol. 2005;5:21.
75. Khan NA, McAlister FA, Pilote L, et al. Temporal trends in stroke incidence in South
Asian, Chinese and white patients: A population based analysis. PLoS ONE [online
serial]. 2017;12. Accessed at: http://www.ncbi.nlm.nih.gov/pmc/articles/PMC5436629/.
Accessed July 18, 2017.
76. Coutinho JM, Klaver EC, Roos YB, Stam J, Nederkoorn PJ. Ethnicity and thrombolysis
in ischemic stroke: a hospital based study in Amsterdam. BMC Neurol. 2011;11:81.
77. Schwamm LH, Reeves MJ, Pan W, et al. Race/ethnicity, quality of care, and outcomes
in ischemic stroke. Circulation. 2010;121:1492–1501.
78. Qian F, Fonarow GC, Smith EE, et al. Racial and ethnic differences in outcomes in
older patients with acute ischemic stroke. Circ Cardiovasc Qual Outcomes. 2013;6:284–
292.
79. Song S, Liang L, Fonarow GC, et al. Comparison of Clinical Care and In-Hospital
Outcomes of Asian American and White Patients With Acute Ischemic Stroke. JAMA
Neurol. Epub 2019 Jan 22.
80. Wang Y, Rudd AG, Wolfe CDA. Trends and survival between ethnic groups after
stroke: the South London Stroke Register. Stroke. 2013;44:380–387.
81. Wolfe CDA, Smeeton NC, Coshall C, Tilling K, Rudd AG. Survival differences after
stroke in a multiethnic population: follow-up study with the South London stroke
register. BMJ. 2005;331:431.

132
82. Elfassy T, Grasset L, Glymour MM, et al. Sociodemographic Disparities in Long-Term
Mortality Among Stroke Survivors in the United States. Stroke. 2019;50:805–812.
83. Mohan KM, Crichton SL, Grieve AP, Rudd AG, Wolfe CDA, Heuschmann PU.
Frequency and predictors for the risk of stroke recurrence up to 10 years after stroke:
the South London Stroke Register. J Neurol Neurosurg Psychiatry. 2009;80:1012–1018.
84. Albright KC, Huang L, Blackburn J, et al. Racial differences in recurrent ischemic
stroke risk and recurrent stroke case fatality. Neurology. 2018;91:e1741.
85. Boehme AK, Esenwa C, Elkind MSV. Stroke Risk Factors, Genetics, and Prevention.
Circ Res. 2017;120:472–495.
86. Matsumoto K, Nohara Y, Soejima H, Yonehara T, Nakashima N, Kamouchi M. Stroke
Prognostic Scores and Data-Driven Prediction of Clinical Outcomes After Acute
Ischemic Stroke. Stroke. 2020;51:1477–1483.
87. Morgenstern LB, Smith MA, Lisabeth LD, et al. Excess Stroke in Mexican Americans
Compared with Non-Hispanic Whites: The Brain Attack Surveillance in Corpus Christi
Project. Am J Epidemiol. 2004;160:376.
88. Kissela BM, Khoury JC, Alwell K, et al. Age at stroke: temporal trends in stroke
incidence in a large, biracial population. Neurology. 2012;79:1781–1787.
89. Hamad R, Penko J, Kazi DS, et al. Association of Low Socioeconomic Status With
Premature Coronary Heart Disease in US Adults. JAMA Cardiol. Epub 2020 May 27.
90. Avendano M, Kawachi I, Van Lenthe F, et al. Socioeconomic status and stroke
incidence in the US elderly: the role of risk factors in the EPESE study. Stroke.
2006;37:1368–1373.

133
91. Chen R, McKevitt C, Rudd AG, Wolfe CDA. Socioeconomic deprivation and survival
after stroke: findings from the prospective South London Stroke Register of 1995 to
2011. Stroke. 2014;45:217–223.
92. Huang K, Khan N, Kwan A, Fang J, Yun L, Kapral MK. Socioeconomic status and care
after stroke: results from the Registry of the Canadian Stroke Network. Stroke.
2013;44:477–482.
93. Howard VJ, McClure LA, Kleindorfer DO, et al. Neighborhood socioeconomic index
and stroke incidence in a national cohort of blacks and whites. Neurology.
2016;87:2340–2347.
94. Government of Canada SC. Chronic Low Income Among Immigrants in Canada and its
Communities [online]. 2017. Accessed at:
https://www150.statcan.gc.ca/n1/pub/11f0019m/11f0019m2017397-eng.htm. Accessed
August 31, 2020.
95. O’Donnell MJ, Chin SL, Rangarajan S, et al. Global and regional effects of potentially
modifiable risk factors associated with acute stroke in 32 countries (INTERSTROKE):
a case-control study. Lancet Lond Engl. 2016;388:761–775.
96. Rodriguez Carlos J., Cai Jianwen, Swett Katrina, et al. High Cholesterol Awareness,
Treatment, and Control Among Hispanic/Latinos: Results From the Hispanic
Community Health Study/Study of Latinos. J Am Heart Assoc. American Heart
Association; 4:e001867.
97. Golub N, Seplaki C, Stockman D, Thevenet-Morrison K, Fernandez D, Fisher S. Impact
of Length of Residence in the United States on Risk of Diabetes and Hypertension in
Resettled Refugees. J Immigr Minor Health. 2018;20:296–306.

134
98. Azagba S, Shan L, Latham K. Assessing trends and healthy migrant paradox in cigarette
smoking among U.S. immigrant adults. Prev Med. 2019;129:105830.
99. Harris S, Dykxhoorn J, Hollander A-C, Dalman C, Kirkbride JB. Substance use
disorders in refugee and migrant groups in Sweden: A nationwide cohort study of 1.2
million people. PLoS Med. 2019;16:e1002944.
100. Elshahat S, Moffat T. Dietary practices among Arabic-speaking immigrants and
refugees in Western societies: A scoping review. Appetite. 2020;154:104753.
101. Marín-Guerrero AC, Rodríguez-Artalejo F, Guallar-Castillón P, López-García E,
Gutiérrez-Fisac JL. Association of the duration of residence with obesity-related eating
habits and dietary patterns among Latin-American immigrants in Spain. Br J Nutr.
2015;113:343–349.
102. Dassanayake J, Dharmage SC, Gurrin L, Sundararajan V, Payne WR. Are Australian
immigrants at a risk of being physically inactive? Int J Behav Nutr Phys Act. 2011;8:53.
103. Gallegos-Carrillo K, Belcher BR, Dunton GF, Samet JM, Baezconde-Garbanati L. A
US/Mexico Study of Joint Associations of Physical Activity and Sedentary Behavior on
Anthropometric Indicators, Migration Status, Country of Birth and Country of
Residence. Int J Environ Res Public Health. 2018;15.
104. Tu Jack V., Chu Anna, Rezai Mohammad R., et al. Incidence of Major Cardiovascular
Events in Immigrants to Ontario, Canada. Circulation. 2015;132:1549–1559.
105. Isasi CR, Ayala GX, Sotres-Alvarez D, et al. Is Acculturation Related to Obesity in
Hispanic/Latino Adults? Results from the Hispanic Community Health Study/Study of
Latinos. J Obes [online serial]. 2015;2015. Accessed at:
https://www.ncbi.nlm.nih.gov/pmc/articles/PMC4393894/. Accessed July 20, 2020.

135
106. Yoon SSS, Carroll MD, Fryar CD. Hypertension Prevalence and Control Among
Adults: United States, 2011-2014. NCHS Data Brief. Epub 2015 Nov.:1–8.
107. Yi SS, Thorpe LE, Zanowiak JM, Trinh-Shevrin C, Islam NS. Clinical Characteristics
and Lifestyle Behaviors in a Population-Based Sample of Chinese and South Asian
Immigrants With Hypertension. Am J Hypertens. 2016;29:941–947.
108. Zallman L, Himmelstein D, Woolhandler S, et al. Undiagnosed and Uncontrolled
Hypertension and Hyperlipidemia among Immigrants in the US. J Immigr Minor
Health. 2013;15:858–865.
109. Agyemang C, Nicolaou M, Boateng L, Dijkshoorn H, van de Born B-J, Stronks K.
Prevalence, awareness, treatment, and control of hypertension among Ghanaian
population in Amsterdam, The Netherlands: the GHAIA study. Eur J Prev Cardiol.
2013;20:938–946.
110. Clark D, Colantonio LD, Min Y-I, et al. Population-Attributable Risk for
Cardiovascular Disease Associated With Hypertension in Black Adults. JAMA Cardiol.
2019;4:1194–1202.
111. Agyemang C, Bhopal R. Is the blood pressure of people from African origin adults in
the UK higher or lower than that in European origin white people? A review of cross-
sectional data. J Hum Hypertens. 2003;17:523–534.
112. Jenum AK, Diep LM, Holmboe-Ottesen G, Holme IMK, Kumar BN, Birkeland KI.
Diabetes susceptibility in ethnic minority groups from Turkey, Vietnam, Sri Lanka and
Pakistan compared with Norwegians - the association with adiposity is strongest for
ethnic minority women. BMC Public Health. 2012;12:150.

136
113. Creatore MI, Moineddin R, Booth G, et al. Age- and sex-related prevalence of diabetes
mellitus among immigrants to Ontario, Canada. CMAJ. 2010;182:781–789.
114. Dhamoon MS, Zhou L, Stamplecoski M, Kapral M, Shah B. Stroke recurrence among
South Asians with diabetes in Ontario, Canada. Int J Stroke Off J Int Stroke Soc.
2016;11:890–897.
115. Montesi L, Caletti MT, Marchesini G. Diabetes in migrants and ethnic minorities in a
changing World. World J Diabetes. 2016;7:34–44.
116. Babyak MA. Understanding confounding and mediation. Evid Based Ment Health.
Royal College of Psychiatrists; 2009;12:68–71.
117. Kandula NR, Diez-Roux AV, Chan C, et al. Association of Acculturation Levels and
Prevalence of Diabetes in the Multi-Ethnic Study of Atherosclerosis (MESA). Diabetes
Care. 2008;31:1621–1628.
118. Howard G, Cushman M, Kissela BM, et al. Traditional risk factors as the underlying
cause of racial disparities in stroke: lessons from the half-full (empty?) glass. Stroke.
2011;42:3369–3375.
119. Kuussaari M, Nieminen M, Hanski I. An Experimental Study of Migration in the
Glanville Fritillary Butterfly Melitaea cinxia. J Anim Ecol. [Wiley, British Ecological
Society]; 1996;65:791–801.
120. Gibson J, Stillman S, McKenzie D, Rohorua H. Natural experiment evidence on the
effect of migration on blood pressure and hypertension. Health Econ. 2013;22:655–672.
121. Odum EP. Premigratory Hyperphagia in Birds. Am J Clin Nutr. Oxford Academic;
1960;8:621–629.

137
122. National Academies of Sciences E, Division H and M, Practice B on PH and PH, Equity
R on the P of H. Immigration and the Social Determinants of Health: Proceedings of a
Workshop [online]. Immigr. Soc. Determinant Health Proc. Workshop Washington
(DC): National Academies Press (US); 2018. Accessed at:
https://www.ncbi.nlm.nih.gov/books/NBK535940/. Accessed September 8, 2020.
123. Kokotailo RA, Hill MD. Coding of stroke and stroke risk factors using international
classification of diseases, revisions 9 and 10. Stroke. 2005;36:1776–1781.
124. Hall R, Mondor L, Porter J, Fang J, Kapral MK. Accuracy of Administrative Data for
the Coding of Acute Stroke and TIAs. Can J Neurol Sci J Can Sci Neurol.
2016;43:765–773.
125. Tu K, Wang M, Young J, et al. Validity of administrative data for identifying patients
who have had a stroke or transient ischemic attack using EMRALD as a reference
standard. Can J Cardiol. 2013;29:1388–1394.
126. Tu K, Chen Z, Lipscombe LL. Prevalence and incidence of hypertension from 1995 to
2005: a population-based study. CMAJ Can Med Assoc J. 2008;178:1429–1435.
127. Hux JE, Ivis F, Flintoft V, Bica A. Diabetes in Ontario: determination of prevalence and
incidence using a validated administrative data algorithm. Diabetes Care. 2002;25:512–
516.
128. Gershon AS, Wang C, Guan J, Vasilevska-Ristovska J, Cicutto L, To T. Identifying
individuals with physcian diagnosed COPD in health administrative databases. COPD.
2009;6:388–394.

138
129. Schultz SE, Rothwell DM, Chen Z, Tu K. Identifying cases of congestive heart failure
from administrative data: a validation study using primary care patient records. Chronic
Dis Inj Can. 2013;33:160–166.
130. Tu JV, Chu A, Donovan LR, et al. The Cardiovascular Health in Ambulatory Care
Research Team (CANHEART). Circ Cardiovasc Qual Outcomes. 2015;8:204–212.
131. Tu K, Nieuwlaat R, Cheng SY, et al. Identifying Patients With Atrial Fibrillation in
Administrative Data. Can J Cardiol. 2016;32:1561–1565.
132. Kapral MK, Hall RE, Silver FL, et al. Registry of the Canadian Stroke Network. Report
on the 2004/05 Ontario Stroke Audit [online]. Toronto: Institute for Clinical Evaluative
Sciences; 2009; Accessed at: https://www.ices.on.ca/~/media/Files/Atlases-
Reports/2009/RCSN-report-on-2004-05-Ontario-stroke-audit/Full-report.ashx.
133. Kapral MK, Fang J, Hill MD, et al. Sex differences in stroke care and outcomes: results
from the Registry of the Canadian Stroke Network. Stroke. 2005;36:809–814.
134. Finlayson O, Kapral M, Hall R, et al. Risk factors, inpatient care, and outcomes of
pneumonia after ischemic stroke. Neurology. 2011;77:1338–1345.
135. Joundi RA, Saposnik G, Martino R, Fang J, Kapral MK. Development and Validation
of a Prognostic Tool for Direct Enteral Tube Insertion After Acute Stroke. Stroke.
2020;51:1720–1726.
136. Saunders CL, Abel GA, El Turabi A, Ahmed F, Lyratzopoulos G. Accuracy of routinely
recorded ethnic group information compared with self-reported ethnicity: evidence from
the English Cancer Patient Experience survey. BMJ Open. 2013;3.

139
137. Shah BR, Chiu M, Amin S, Ramani M, Sadry S, Tu JV. Surname lists to identify South
Asian and Chinese ethnicity from secondary data in Ontario, Canada: a validation study.
BMC Med Res Methodol. 2010;10:42.
138. Lantz B. The large sample size fallacy. Scand J Caring Sci. 2013;27:487–492.
139. Korn EL, Graubard BI, Midthune D. Time-to-event analysis of longitudinal follow-up
of a survey: choice of the time-scale. Am J Epidemiol. 1997;145:72–80.
140. Austin PC, Lee DS, Fine JP. Introduction to the Analysis of Survival Data in the
Presence of Competing Risks. Circulation. 2016;133:601–609.
141. Urquia ML, Berger H, Ray JG. Risk of adverse outcomes among infants of immigrant
women according to birth-weight curves tailored to maternal world region of origin.
CMAJ Can Med Assoc J. 2015;187:E32–E40.
142. Fang J, Yuan K, Gindi RM, Ward BW, Ayala C, Loustalot F. Association of Birthplace
and Coronary Heart Disease and Stroke Among US Adults: National Health Interview
Survey, 2006 to 2014. J Am Heart Assoc. 2018;7.
143. Kennedy S, Kidd MP, McDonald JT, Biddle N. The Healthy Immigrant Effect: Patterns
and Evidence from Four Countries. J Int Migr Integr. 2015;16:317–332.
144. Hankey GJ. Stroke. Lancet Lond Engl. 2017;389:641–654.
145. Indicators of Immigrant Integration 2015: Settling In [online]. Accessed at:
https://www.oecd-ilibrary.org/social-issues-migration-health/indicators-of-immigrant-
integration-2015-settling-in_9789264234024-en. Accessed June 24, 2020.
146. Puschmann P, Donrovich R, Matthijs K. Salmon Bias or Red Herring? : Comparing
Adult Mortality Risks (Ages 30-90) between Natives and Internal Migrants: Stayers,

140
Returnees and Movers in Rotterdam, the Netherlands, 1850-1940. Hum Nat Hawthorne
N. 2017;28:481–499.
147. O’Donnell MJ, Chin SL, Rangarajan S, et al. Global and regional effects of potentially
modifiable risk factors associated with acute stroke in 32 countries (INTERSTROKE):
a case-control study. Lancet Lond Engl. 2016;388:761–775.
148. Yusuf Salim, Reddy Srinath, Ôunpuu Stephanie, Anand Sonia. Global Burden of
Cardiovascular Diseases. Circulation. American Heart Association; 2001;104:2746–
2753.
149. Graetz V, Rechel B, Groot W, Norredam M, Pavlova M. Utilization of health care
services by migrants in Europe-a systematic literature review. Br Med Bull.
2017;121:5–18.
150. Muggah E, Dahrouge S, Hogg W. Access to primary health care for immigrants: results
of a patient survey conducted in 137 primary care practices in Ontario, Canada. BMC
Fam Pract. 2012;13:128.
151. Ledoux C, Pilot E, Diaz E, Krafft T. Migrants’ access to healthcare services within the
European Union: a content analysis of policy documents in Ireland, Portugal and Spain.
Glob Health. 2018;14:57.
152. Lopez PM, Divney A, Goldfeld K, et al. Feasibility and Outcomes of an Electronic
Health Record Intervention to Improve Hypertension Management in Immigrant-
serving Primary Care Practices. Med Care. 2019;57:S164.
153. Batista R, Pottie KC, Dahrouge S, et al. Impact of health care reform on enrolment of
immigrants in primary care in Ontario, Canada. Fam Pract. 2019;36:445–451.

141
154. Pottie K, Batista R, Mayhew M, Mota L, Grant K. Improving delivery of primary care
for vulnerable migrants. Can Fam Physician. 2014;60:e32–e40.
155. Ben-Shlomo Y, Naqvi H, Baker I. Ethnic differences in healthcare-seeking behaviour
and management for acute chest pain: secondary analysis of the MINAP dataset 2002-
2003. Heart Br Card Soc. 2008;94:354–359.
156. Vyas MV, Laupacis A, Austin PC, Fang J, Silver FL, Kapral MK. Association Between
Immigration Status and Acute Stroke Care: A Retrospective Study. Stroke.
2020;51:1555–1562.
157. Krishnamurthi RV, Moran AE, Forouzanfar MH, et al. The global burden of
hemorrhagic stroke: a summary of findings from the GBD 2010 study. Glob Heart.
2014;9:101–106.
158. Daviglus ML, Talavera GA, Avilés-Santa ML, et al. Prevalence of major cardiovascular
risk factors and cardiovascular diseases among Hispanic/Latino individuals of diverse
backgrounds in the United States. JAMA. 2012;308:1775–1784.
159. Tillin T, Hughes AD, Mayet J, et al. The relationship between metabolic risk factors
and incident cardiovascular disease in Europeans, South Asians, and African
Caribbeans: SABRE (Southall and Brent Revisited) -- a prospective population-based
study. J Am Coll Cardiol. 2013;61:1777–1786.
160. Tsai C-F, Thomas B, Sudlow CLM. Epidemiology of stroke and its subtypes in Chinese
vs white populations: a systematic review. Neurology. 2013;81:264–272.
161. DesMeules M, Gold J, McDermott S, et al. Disparities in mortality patterns among
Canadian immigrants and refugees, 1980-1998: results of a national cohort study. J
Immigr Health. 2005;7:221–232.

142
162. Beiser M, Hou F. Language acquisition, unemployment and depressive disorder among
Southeast Asian refugees: a 10-year study. Soc Sci Med 1982. 2001;53:1321–1334.
163. Bhatia R, Wallace P. Experiences of refugees and asylum seekers in general practice: a
qualitative study. BMC Fam Pract. 2007;8:48.
164. Martinez CR, Schwartz SJ, Thier M, McClure HH. A Tale of Two Measures:
Concordance between the ARSMA-II and the BIQ Acculturation Scales among Latino
Immigrant Families. Psychol Assess. 2018;30:459–473.
165. Côté R, Hachinski VC, Shurvell BL, Norris JW, Wolfson C. The Canadian
Neurological Scale: a preliminary study in acute stroke. Stroke. 1986;17:731–737.
166. Nilanont Y, Komoltri C, Saposnik G, et al. The Canadian Neurological Scale and the
NIHSS: development and validation of a simple conversion model. Cerebrovasc Dis
Basel Switz. 2010;30:120–126.
167. van Swieten JC, Koudstaal PJ, Visser MC, Schouten HJ, van Gijn J. Interobserver
agreement for the assessment of handicap in stroke patients. Stroke. 1988;19:604–607.
168. Austin PC. Balance diagnostics for comparing the distribution of baseline covariates
between treatment groups in propensity-score matched samples. Stat Med.
2009;28:3083–3107.
169. Ganesh A, Luengo-Fernandez R, Wharton RM, Rothwell PM, Oxford Vascular Study.
Ordinal vs dichotomous analyses of modified Rankin Scale, 5-year outcome, and cost of
stroke. Neurology. 2018;91:e1951–e1960.
170. Streiner DL, Norman GR. Correction for multiple testing: is there a resolution? Chest.
2011;140:16–18.

143
171. Austin PC. An Introduction to Propensity Score Methods for Reducing the Effects of
Confounding in Observational Studies. Multivar Behav Res. 2011;46:399–424.
172. Austin PC, Stuart EA. Moving towards best practice when using inverse probability of
treatment weighting (IPTW) using the propensity score to estimate causal treatment
effects in observational studies. Stat Med. 2015;34:3661–3679.
173. Charlson ME, Pompei P, Ales KL, MacKenzie CR. A new method of classifying
prognostic comorbidity in longitudinal studies: development and validation. J Chronic
Dis. 1987;40:373–383.
174. Deyo RA, Cherkin DC, Ciol MA. Adapting a clinical comorbidity index for use with
ICD-9-CM administrative databases. J Clin Epidemiol. 1992;45:613–619.
175. Cepeda MS, Boston R, Farrar JT, Strom BL. Comparison of logistic regression versus
propensity score when the number of events is low and there are multiple confounders.
Am J Epidemiol. 2003;158:280–287.
176. Skov T, Deddens J, Petersen MR, Endahl L. Prevalence proportion ratios: estimation
and hypothesis testing. Int J Epidemiol. 1998;27:91–95.
177. McNutt L-A, Wu C, Xue X, Hafner JP. Estimating the Relative Risk in Cohort Studies
and Clinical Trials of Common Outcomes. Am J Epidemiol. 2003;157:940–943.
178. Marschner IC, Gillett AC. Relative risk regression: reliable and flexible methods for
log-binomial models. Biostat Oxf Engl. 2012;13:179–192.
179. Williamson T, Eliasziw M, Fick GH. Log-binomial models: exploring failed
convergence. Emerg Themes Epidemiol. 2013;10:14.

144
180. Longstreth WT, Gasca NC, Gottesman RF, Pearce JB, Sacco RL. Adjudication of
Transient Ischemic Attack and Stroke in the Multi-Ethnic Study of Atherosclerosis.
Neuroepidemiology. 2018;50:23–28.
181. Markus HS, Khan U, Birns J, et al. Differences in stroke subtypes between black and
white patients with stroke: the South London Ethnicity and Stroke Study. Circulation.
2007;116:2157–2164.
182. Khan NA, Quan H, Hill MD, et al. Risk factors, quality of care and prognosis in South
Asian, East Asian and White patients with stroke. BMC Neurol. 2013;13:74.
183. Marmot M, Friel S, Bell R, Houweling TAJ, Taylor S, Commission on Social
Determinants of Health. Closing the gap in a generation: health equity through action on
the social determinants of health. Lancet Lond Engl. 2008;372:1661–1669.
184. Quesnel-Vallée A, Setia MS, Abrahamowicz M, Tousignant P, Lynch J. Access to
health care in Canadian immigrants: a longitudinal study of the national population
health survey. Health Soc Care Community. 2011;19:70–79.
185. Kickbusch I, Pelikan JM, Apfel F, Tsouros AD, World Health Organization, editors.
Health literacy: the solid facts. Copenhagen: World Health Organization Regional
Office for Europe; 2013.
186. O’Donnell MJ, Chin SL, Rangarajan S, et al. Global and regional effects of potentially
modifiable risk factors associated with acute stroke in 32 countries (INTERSTROKE):
a case-control study. The Lancet. 2016;388:761–775.
187. Faigle R, Ziai WC, Urrutia VC, Cooper LA, Gottesman RF. Racial Differences in
Palliative Care Use After Stroke in Majority-White, Minority-Serving, and Racially
Integrated U.S. Hospitals. Crit Care Med. 2017;45:2046–2054.

145
188. Shah BR, Khan NA, O’Donnell MJ, Kapral MK. Impact of language barriers on stroke
care and outcomes. Stroke. 2015;46:813–818.
189. Wild SH, Fischbacher C, Brock A, Griffiths C, Bhopal R. Mortality from all causes and
circulatory disease by country of birth in England and Wales 2001-2003. J Public
Health Oxf Engl. 2007;29:191–198.
190. Salinas JJ, Abdelbary B, Rentfro A, Fisher-Hoch S, McCormick J. Cardiovascular
disease risk among the Mexican American population in the Texas-Mexico border
region, by age and length of residence in United States. Prev Chronic Dis. 2014;11:E58.
191. Norredam M, Agyemang C, Hoejbjerg Hansen OK, et al. Duration of residence and
disease occurrence among refugees and family reunited immigrants: test of the “healthy
migrant effect” hypothesis. Trop Med Int Health TM IH. 2014;19:958–967.
192. Yarnell CJ, Fu L, Manuel D, et al. Association Between Immigrant Status and End-of-
Life Care in Ontario, Canada. JAMA. 2017;318:1479–1488.
193. Droste DW, Safo J, Metz RJ, Osada N. Stroke Awareness in Luxemburg: Deficit
Concerning Symptoms and Risk Factors. Clin Med Insights Cardiol. 2014;8:9–13.
194. Coleman ER, Moudgal R, Lang K, et al. Early Rehabilitation After Stroke: a Narrative
Review. Curr Atheroscler Rep. 2017;19:59.
195. OSR Acute Stroke Databases [online]. Accessed at:
https://www.ices.on.ca/Research/Research-programs/Cardiovascular/Ontario-Stroke-
Registry/OSR-Acute-Stroke-Databases. Accessed October 22, 2019.
196. Makuch RW. Adjusted survival curve estimation using covariates. J Chronic Dis.
1982;35:437–443.

146
197. Teruya SA, Bazargan-Hejazi S. The Immigrant and Hispanic Paradoxes: A Systematic
Review of Their Predictions and Effects. Hisp J Behav Sci. 2013;35:486–509.
198. Ofori-Asenso R, Ilomäki J, Tacey M, et al. Patterns of statin use and long-term
adherence and persistence among older adults with diabetes. J Diabetes. 2018;10:699–
707.
199. Raebel MA, Schmittdiel J, Karter AJ, Konieczny JL, Steiner JF. Standardizing
terminology and definitions of medication adherence and persistence in research
employing electronic databases. Med Care. 2013;51:S11-21.
200. Karve S, Cleves MA, Helm M, Hudson TJ, West DS, Martin BC. Good and poor
adherence: optimal cut-point for adherence measures using administrative claims data.
Curr Med Res Opin. 2009;25:2303–2310.
201. Sacco RL, Wolf PA, Kannel WB, McNamara PM. Survival and recurrence following
stroke. The Framingham study. Stroke. 1982;13:290–295.
202. Brønnum-Hansen Henrik, Davidsen Michael, Thorvaldsen Per. Long-Term Survival
and Causes of Death After Stroke. Stroke. 2001;32:2131–2136.
203. Singh R-J, Chen S, Ganesh A, Hill MD. Long-term neurological, vascular, and
mortality outcomes after stroke. Int J Stroke Off J Int Stroke Soc. 2018;13:787–796.
204. Hardie Kate, Hankey Graeme J., Jamrozik Konrad, Broadhurst Robyn J., Anderson
Craig. Ten-Year Risk of First Recurrent Stroke and Disability After First-Ever Stroke in
the Perth Community Stroke Study. Stroke. 2004;35:731–735.
205. Jørgensen HS, Nakayama H, Reith J, Raaschou HO, Olsen TS. Stroke recurrence:
predictors, severity, and prognosis. The Copenhagen Stroke Study. Neurology.
1997;48:891–895.

147
206. Mohan Keerthi M., Wolfe Charles D.A., Rudd Anthony G., Heuschmann Peter U.,
Kolominsky-Rabas Peter L., Grieve Andrew P. Risk and Cumulative Risk of Stroke
Recurrence. Stroke. 2011;42:1489–1494.
207. Havranek Edward P., Mujahid Mahasin S., Barr Donald A., et al. Social Determinants
of Risk and Outcomes for Cardiovascular Disease. Circulation. American Heart
Association; 2015;132:873–898.
208. Fernando E, Razak F, Lear SA, Anand SS. Cardiovascular Disease in South Asian
Migrants. Can J Cardiol. 2015;31:1139–1150.
209. Ahmed E, El-Menyar A. South Asian ethnicity and cardiovascular risk: the known, the
unknown, and the paradox. Angiology. 2015;66:405–415.
210. Jin K, Ding D, Gullick J, Koo F, Neubeck L. A Chinese Immigrant Paradox? Low
Coronary Heart Disease Incidence but Higher Short-Term Mortality in Western-
Dwelling Chinese Immigrants: A Systematic Review and Meta-Analysis. J Am Heart
Assoc. 2015;4.
211. Dahabreh IJ, Kent DM. Index event bias as an explanation for the paradoxes of
recurrence risk research. JAMA. 2011;305:822–823.
212. Simpson JR, Zahuranec DB, Lisabeth LD, et al. Mexican Americans with atrial
fibrillation have more recurrent strokes than do non-Hispanic whites. Stroke.
2010;41:2132–2136.
213. Writing Group Members, Mozaffarian D, Benjamin EJ, et al. Heart Disease and Stroke
Statistics-2016 Update: A Report From the American Heart Association. Circulation.
2016;133:e38-360.

148
214. 2018 National Healthcare Quality and Disparities Report. Content last reviewed April
2020. Agency for Healthcare Research and Quality, Rockville, MD.
215. Carnethon Mercedes R., Pu Jia, Howard George, et al. Cardiovascular Health in African
Americans: A Scientific Statement From the American Heart Association. Circulation.
American Heart Association; 2017;136:e393–e423.
216. Williams DR, Mohammed SA. Discrimination and racial disparities in health: evidence
and needed research. J Behav Med. 2009;32:20–47.
217. Viruell-Fuentes EA, Miranda PY, Abdulrahim S. More than culture: structural racism,
intersectionality theory, and immigrant health. Soc Sci Med 1982. 2012;75:2099–2106.
218. Khan NA, McAlister FA, Pilote L, et al. Secondary prevention treatment after acute
stroke in older South Asian, Chinese and other Canadians: a retrospective data analysis.
CMAJ Open. 2017;5:E702–E709.
219. Ens TA, Seneviratne CC, Jones C, Green TL, King-Shier KM. South Asians’ cardiac
medication adherence. Eur J Cardiovasc Nurs J Work Group Cardiovasc Nurs Eur Soc
Cardiol. 2014;13:357–368.
220. Frederiksen HW, Zwisler A-D, Johnsen SP, Öztürk B, Lindhardt T, Norredam M.
Education of Migrant and Nonmigrant Patients Is Associated With Initiation and
Discontinuation of Preventive Medications for Acute Coronary Syndrome. J Am Heart
Assoc. 2019;8:e009528.
221. O’Donnell MJ, Chin SL, Rangarajan S, et al. Global and regional effects of potentially
modifiable risk factors associated with acute stroke in 32 countries (INTERSTROKE):
a case-control study. Lancet Lond Engl. 2016;388:761–775.

149
222. Lewis TT, Williams DR, Tamene M, Clark CR. Self-Reported Experiences of
Discrimination and Cardiovascular Disease. Curr Cardiovasc Risk Rep. 2014;8:365.
223. Lee H, Caldwell JT, Maene C, Cagney KA, Saunders MR. Racial/Ethnic Inequities in
Access to High-Quality Dialysis Treatment in Chicago: Does Neighborhood
Racial/Ethnic Composition Matter? J Racial Ethn Health Disparities. Epub 2020 Feb 5.
224. Riosmena F, Kuhn R, Jochem WC. Explaining the Immigrant Health Advantage: Self-
selection and Protection in Health-Related Factors Among Five Major National-Origin
Immigrant Groups in the United States. Demography. 2017;54:175–200.
225. Kobayashi KM, Prus SG. Examining the gender, ethnicity, and age dimensions of the
healthy immigrant effect: factors in the development of equitable health policy. Int J
Equity Health. 2012;11:8.
226. St-Pierre M, Sinclair I, Elgbeili G, Bernard P, Dancause KN. Relationships between
psychological distress and health behaviors among Canadian adults: Differences based
on gender, income, education, immigrant status, and ethnicity. SSM - Popul Health.
2019;7:100385.