immigration detention and community statistics summary 30 ... · data is sourced from several...
TRANSCRIPT

Immigration Detention and Community Statistics Summary
30 November 2018

Immigration Detention and Community Statistics Summary
Page 2 of 12
Table of Contents About this report…………………................................................................................................................3 Enquiries…………......................................................................................................................................3 Acronyms……………………………………………………………………………………………………………3 Immigration Detention And Community Statistics Summary………………………………………………… 4 In Community under Residence Determination Population By State/Territory………………………………5 Immigration Detention Population………………………………………………………………………………...6
From 1990 to 30 November 2018………….……..…………………………………………………………..6 People In Immigration Detention Facilities……………………………………………………………...……….7
Arrival Type.……………………………………………………………………………………………………..7 People In Immigration Detention……………………………………………………………………………….…7
Nationality…………………………………………………………………………………………………….....8 Children In Immigration Detention………………………………………………………………………………..9 Time In Immigration Detention Facilities……………………………………………………..………………...11 Time In Community Under Residence Determination……………………………………..………………….12
Immigration Detention and Community Statistics Summary
Page 3 of 12
About this report This report provides an overview of the number of people in immigration detention and Regional Processing Centres as at midnight on the date of the report. The report is produced on a monthly basis.
Data is sourced from several departmental processing and recording systems. Data relating to the immigration detention population is dynamic and there can be delays in transmission of information from the department's immigration detention network operations. Variations in figures between this report and previous issues can occur. Due to these issues, data from the current financial year should always be considered provisional.
Further information about immigration detention is available at:
https://www.homeaffairs.gov.au/research-and-statistics/statistics/visa-statistics/live/immigration-detention
Enquiries Comments or enquiries concerning this report should be sent using the department’s client service feedback form quoting the name and date of the report.
See: https://immi.homeaffairs.gov.au/help-support/contact-us
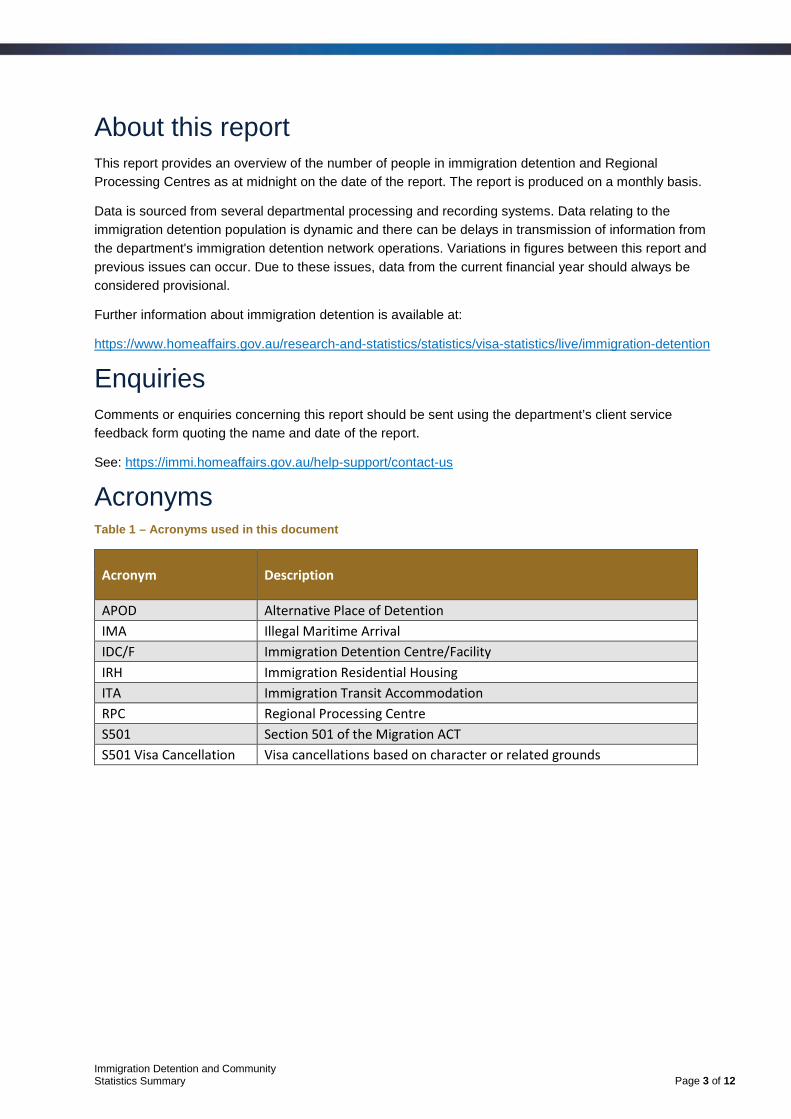
Acronyms Table 1 – Acronyms used in this document
Acronym Description
APOD Alternative Place of Detention IMA Illegal Maritime Arrival IDC/F Immigration Detention Centre/Facility IRH Immigration Residential Housing ITA Immigration Transit Accommodation RPC Regional Processing Centre S501 Section 501 of the Migration ACT S501 Visa Cancellation Visa cancellations based on character or related grounds

Immigration Detention and Community Statistics Summary
Page 4 of 12
Immigration Detention And Community Statistics Summary At 30 November 2018, there were 1327 people in immigration detention facilities, including 1327 in immigration detention on the mainland and in immigration detention on Christmas Island.
A further 599 people were living in the community after being approved for a residence determination and 16,007 were living in the community after grant of a Bridging Visa E.
The table below reflects figures based on records in Department of Home Affairs systems.
Table 2 – People in Immigration Detention Facilities (IDFs), Alternative Places of Detention (APODs), Regional Processing Centres (RPCs) and the Community at 30 November 2018
Place of immigration detention Men Women Children Total Change from
Previous Summary
31/10/18 Christmas Island IDC 0 0 0 0 0 Maribyrnong IDC 107 0 0 107 - 1 Perth IDC 21 10 0 31 - 3 Villawood IDC 450 49 0 499 + 3 Yongah Hill IDC 229 0 0 229 - 2 Mainland APODs 17 14 15 46 - 3 Total IDCs/APODs 824 73 15 912 - 6 Adelaide ITA 20 <5 <5 25 - 4 Brisbane ITA 142 19 6 167 - 30 Melbourne ITA 208 14 <5 223 + 1 Total in ITA 370 35 10 415 - 33 Total in IDC/F 1,194 108 25 1,327 - 39
Total in Community under Residence Determination 175 166 258 599 + 114
Total IMA in Community on Bridging Visa E (Including people in a re-grant process)
11,445 1,955 2,607 16,007 - 209
Republic of Nauru (RPC) 27 0 0 27 - 72 Manus Province, Papua New Guinea (RPC) 0 0 0 0 0
Total IMA in RPCs 27 0 0 27 - 72
Detention Group
S501 Visa Cancellation 383 22 0 405 - 16 Illegal Maritime Arrival 355 48 24 427 - 26 Other 456 38 <5 495 + 3 Total 1,194 108 25 1,327 - 39
Immigration Detention and Community Statistics Summary
Page 5 of 12
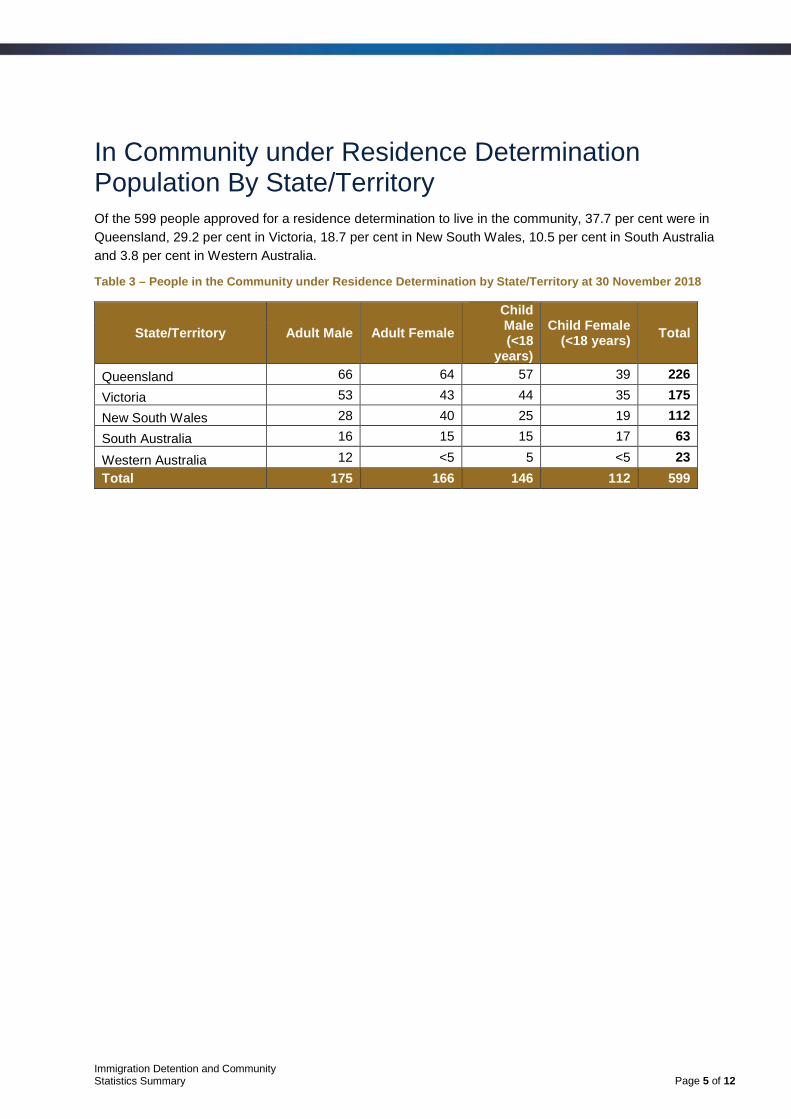
In Community under Residence Determination Population By State/Territory Of the 599 people approved for a residence determination to live in the community, 37.7 per cent were in Queensland, 29.2 per cent in Victoria, 18.7 per cent in New South Wales, 10.5 per cent in South Australia and 3.8 per cent in Western Australia.
Table 3 – People in the Community under Residence Determination by State/Territory at 30 November 2018
State/Territory Adult Male Adult Female Child Male (<18
years)
Child Female (<18 years) Total
Queensland 66 64 57 39 226 Victoria 53 43 44 35 175 New South Wales 28 40 25 19 112 South Australia 16 15 15 17 63
Western Australia 12 <5 5 <5 23 Total 175 166 146 112 599

Immigration Detention and Community Statistics Summary
Page 6 of 12
Immigration Detention Population From January 1990 to 30 November 2018 The overall number of people in immigration detention including in the community under residence determination has increased by 171 to 1926 compared with 1755 at the end of November 2017. This number takes into account releases of detainees into the community under residence determination and detainees who were held in immigration detention facilities as at 30 November 2018.
Figure 1 – Population in Immigration Detention
Figure 1 above, shows the number of people in immigration detention from 1990 to the date of this report. The trend had a consistent rise of people in immigration detention from January 2009 to January 2013, but has since had consistent decline.

Immigration Detention and Community Statistics Summary
Page 7 of 12
People In Immigration Detention Facilities Arrival Type There were 475 people who arrived unlawfully by air or boat, in held immigration detention facilities at 30 November 2018 representing 35.8 per cent of the total immigration detention population.
There were also 852 people (64.2 per cent of the total immigration population) who arrived in Australia lawfully and were subsequently taken into immigration detention for either overstaying or having their visas cancelled for breaching visa conditions.
Figure 2 – People in Held Immigration Detention Facilities by Detention Group
Figure 2 above, shows the number of people in held immigration detention facilities by detention group, including Overstayers, S501 and Other Visa Cancellations, Foreign Fishers, Illegal Maritime Arrivals, Unauthorised Air Arrivals, and if applicable – Inadequately Documented Crew Members and Others such as stowaways and ship deserters.
Table 4 – People in Held Immigration Detention Facilities by Detention Group at 30 November 2018
Place of immigration detention
S501 Visa Cancellation IMA
Other Detention
Group Total
Change from Previous Summary
31/10/18 Christmas Island IDC 0 0 0 0 0 Maribyrnong IDC 46 25 36 107 - 1 Perth IDC 8 5 18 31 - 3 Villawood IDC 174 129 196 499 + 3 Yongah Hill IDC 100 58 71 229 - 2 Mainland APODs 0 42 <5 46 - 3 Total IDCs/APODs 328 259 325 912 - 6 Adelaide ITA <5 15 6 25 - 4 Brisbane ITA 27 73 67 167 - 30 Melbourne ITA 46 80 97 223 + 1 Total in IRH and ITA 77 168 170 415 - 33 Total in IDC/F 405 427 495 1,327 - 39

Immigration Detention and Community Statistics Summary
Page 8 of 12
People In Immigration Detention Nationality At 30 November 2018, there were 1327 people in held immigration detention facilities. Of these 1327 people, 12.7 per cent were from Iran, 11.6 per cent were from New Zealand, 7.6 per cent were from Vietnam, 7.2 per cent were from Sri Lanka and 4.3 per cent were from United Kingdom.
Table 5 – People in Held Immigration Detention Facilities by Nationality at 30 November 2018
Nationalities Adult Male Adult Female Child Male (<18 years)
Child Female (<18 years) Total
Iran 134 27 5 <5 168 New Zealand 139 15 0 0 154 Vietnam 91 10 0 0 101 Sri Lanka 81 9 <5 <5 96 United Kingdom 54 <5 0 0 57 India 54 0 <5 <5 56 Afghanistan 52 <5 <5 0 54 Sudan 52 <5 0 0 54 Iraq 44 <5 0 0 46 Stateless 37 <5 <5 <5 44 Other 456 36 <5 <5 497 Total 1,194 108 14 11 1,327
At 30 November 2018, 599 were people living in the community after being approved for a residence determination. Of these 599 people, 53.1 per cent were from Iran, 12.4 per cent were Stateless, 10.7 per cent were from Sri Lanka, 7 per cent were from Somalia and 2.3 per cent were from Iraq.
Table 6 – People in the Community under Residence Determination by Nationality at 30 November 2018
Nationalities Adult Male Adult Female Child Male (<18 years)
Child Female (<18 years) Total
Iran 94 94 74 56 318 Stateless 24 16 15 19 74 Sri Lanka 18 15 20 11 64 Somalia 12 16 9 5 42 Iraq 5 <5 <5 <5 14 Other 22 22 24 19 87 Total 175 166 146 112 599
Immigration Detention and Community Statistics Summary
Page 9 of 12
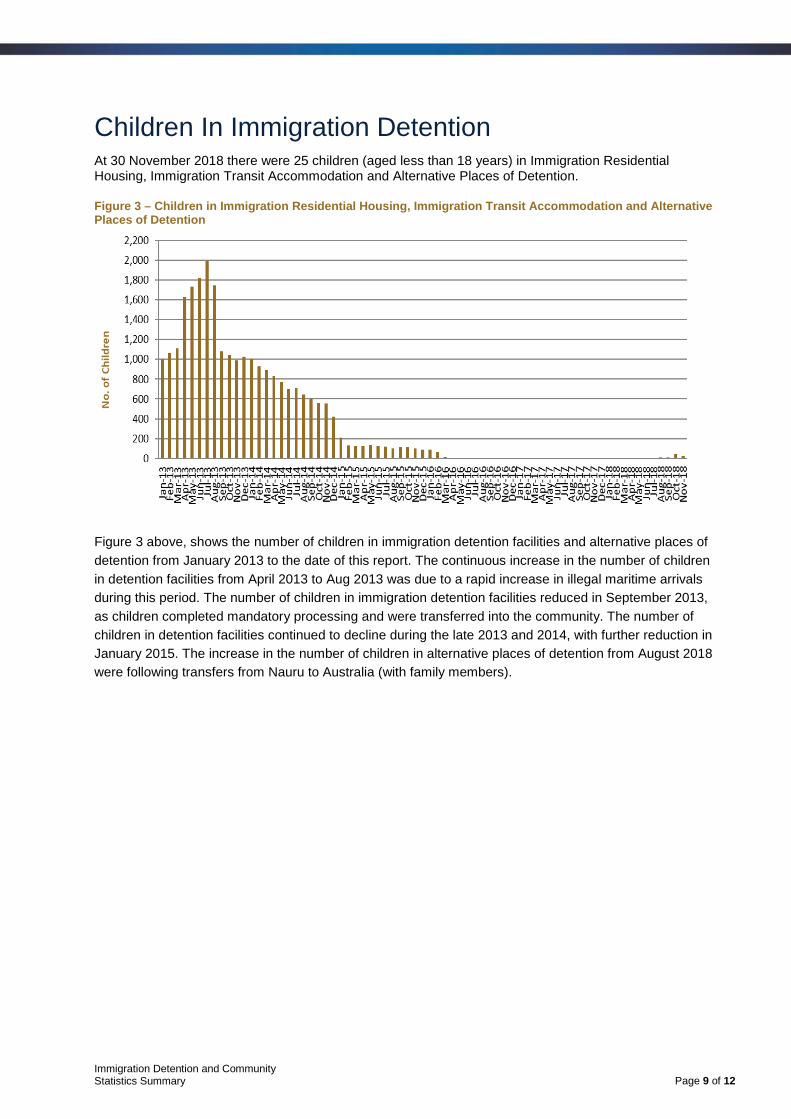
Children In Immigration Detention At 30 November 2018 there were 25 children (aged less than 18 years) in Immigration Residential Housing, Immigration Transit Accommodation and Alternative Places of Detention.
Figure 3 – Children in Immigration Residential Housing, Immigration Transit Accommodation and Alternative Places of Detention
Figure 3 above, shows the number of children in immigration detention facilities and alternative places of detention from January 2013 to the date of this report. The continuous increase in the number of children in detention facilities from April 2013 to Aug 2013 was due to a rapid increase in illegal maritime arrivals during this period. The number of children in immigration detention facilities reduced in September 2013, as children completed mandatory processing and were transferred into the community. The number of children in detention facilities continued to decline during the late 2013 and 2014, with further reduction in January 2015. The increase in the number of children in alternative places of detention from August 2018 were following transfers from Nauru to Australia (with family members).

Immigration Detention and Community Statistics Summary
Page 10 of 12
At 30 November 2018, the number of children living in the community after being approved for a residence determination increased by 46 to 258 from 212 in the previous report.
Figure 4 – Children in the Community under Residence Determination
Figure 4 above, shows the number of children in the community under residence determination from January 2012 to the date of this report. The number of children in the community under residence determination, has levelled off at its lowest number since the peak in November 2013, as a result of releases into the community on Bridging E visas.
Table 7 – Children in Immigration Detention and IMA Children in the Community on a Bridging E Visa at 30 November 2018
Placement Type Children
Immigration Residential Housing 0
Immigration Transit Accommodation 10
Alternative Places of Detention 15
Total Children in Immigration Detention Facilities 25
Total Children in the Community under a Residence Determination 258 Total IMA Children in the Community on a Bridging E visa (including in re-grant process) 2,607

Immigration Detention and Community Statistics Summary
Page 11 of 12
Time In Immigration Detention Facilities At 30 November 2018, there were 1327 people in immigration detention facilities. Of these 1327 people, 27 per cent had been detained for 91 days or less and 59 per cent had been detained for 365 days or less.
Table 8 – Length of Time of People in Held Immigration Detention Facilities at 30 November 2018
Period Detained Total % of Total 7 days or less 56 4.2%
8 days - 31 days 121 9.1% 32 days - 91 days 181 13.6% 92 days - 182 days 179 13.5%
183 days - 365 days 246 18.5% 366 days - 547 days 164 12.4% 548 days - 730 days 99 7.5%
Greater than 730 days 281 21.2% Total 1,327 100%
At 30 November 2018, the average period of time for people held in detention facilities was 496 days.
Figure 5 – Average Number of Days of People in Held Immigration Detention Facilities only
Figure 5 above, shows the average days in held immigration detention at the end of each month from January 2013 to the date of this report. The average period of time for people held in detention facilities steadily increased from July 2013 to January 2015.

Immigration Detention and Community Statistics Summary
Page 12 of 12
Time In Community Under Residence Determination Of the 599 people in the community under residence determination, as at 30 November 2018, 32.6 per cent had been in the community for 91 days or less and 47.4 per cent had been in the community for 365 days or less.
Table 9 – Length of Time of People in Community under Residence Determination at 30 November 2018
Period Detained Total % of Total 7 days or less 43 7.2%
8 days - 31 days 80 13.4% 32 days - 91 days 72 12.0% 92 days - 182 days 51 8.5%
183 days - 365 days 38 6.3% 366 days - 547 days 27 4.5% 548 days - 730 days 32 5.3%
Greater than 730 days 256 42.7% Total 599 100%