immigration and house prices in the ukftp.iza.org/dp5893.pdf · immigration and house prices in the...
TRANSCRIPT

DI
SC
US
SI
ON
P
AP
ER
S
ER
IE
S
Forschungsinstitut zur Zukunft der ArbeitInstitute for the Study of Labor
Immigration and House Prices in the UK
IZA DP No. 5893
July 2011
Filipa Sá

Immigration and House Prices
in the UK
Filipa Sá Trinity College, University of Cambridge
and IZA
Discussion Paper No. 5893 July 2011
IZA
P.O. Box 7240 53072 Bonn
Germany
Phone: +49-228-3894-0 Fax: +49-228-3894-180
E-mail: [email protected]
Any opinions expressed here are those of the author(s) and not those of IZA. Research published in this series may include views on policy, but the institute itself takes no institutional policy positions. The Institute for the Study of Labor (IZA) in Bonn is a local and virtual international research center and a place of communication between science, politics and business. IZA is an independent nonprofit organization supported by Deutsche Post Foundation. The center is associated with the University of Bonn and offers a stimulating research environment through its international network, workshops and conferences, data service, project support, research visits and doctoral program. IZA engages in (i) original and internationally competitive research in all fields of labor economics, (ii) development of policy concepts, and (iii) dissemination of research results and concepts to the interested public. IZA Discussion Papers often represent preliminary work and are circulated to encourage discussion. Citation of such a paper should account for its provisional character. A revised version may be available directly from the author.

IZA Discussion Paper No. 5893 July 2011
ABSTRACT
Immigration and House Prices in the UK* This article studies the effect of immigration on house prices in the UK. It finds that immigration has a negative effect on house prices and presents evidence that this negative effect is due to the mobility response of the native population. Natives respond to immigration by moving to different areas and those who leave are at the top of the wage distribution. This generates a negative income effect on housing demand and pushes down house prices. The negative effect of immigration on house prices is driven by local areas where immigrants have lower education. JEL Classification: J61, R21 Keywords: immigration, house prices Corresponding author: Filipa Sá Trinity College University of Cambridge Trinity Street CB2 1 TQ Cambridge United Kingdom E-mail: [email protected]
* The special license access version of the LFS used in this article was made available by the UK Data Archive and was originally collected by the ONS.

1 Introduction
The UK has experienced a steady increase in immigration in recent years. Until the mid-1990s
immigrants accounted for less than 8% of the working age population in the UK. Today they
account for more than 12% (Figure 1)1. There is considerable heterogeneity in the geographic
distribution of immigrants. Table 1 lists the local authorities with the largest share of immigrants
in the working age population in 2010. Not surprisingly, this share is largest in some London
boroughs where immigrants account for the majority of the population. Outside London, there are
several local authorities where over 20% of the population is foreign born. These large immigration
�ows could have signi�cant e¤ects on the economies of the areas where immigrants cluster. This is
the subject of an intense political debate � see, for example, House of Lords report (2008) � and
was one of the dominant issues in the 2010 election.
There is a large literature looking at the labour market impact of immigration2. The general
conclusion is that immigration has only small adverse e¤ects on employment and wages. For
the UK this result is con�rmed by Dustmann, Fabbri and Preston (2005), who �nd no strong
evidence that immigration has overall e¤ects on employment, participation and wages. This article
takes a di¤erent perspective and looks at the e¤ect of immigration on the housing market. It
follows the dominant methodology in the literature and uses spatial correlations between immigrant
in�ows and changes in house prices in di¤erent geographic areas. To avoid the possible endogeneity
resulting from the fact that immigrant in�ows are themselves the outcome of economic decisions,
an instrumental variable based on the settlement pattern of immigrants in an earlier period is used.
This identi�cation strategy is based on the tendency of newly arriving immigrants to settle in places
where previous immigrants from the same country already live.
The sign and magnitude of the e¤ect of immigration on house prices is theoretically ambigu-
ous. In principle, immigrant in�ows would increase the demand for housing. Combined with an
upward-sloping housing supply, this would lead to an increase in house prices and rents. However,
immigration may be associated with o¤setting native out-migration. If the o¤set is complete, local
population would remain constant. In this case housing demand may still be a¤ected if the change
in composition of the local population leads to a change in local income. This would a¤ect housing
demand and house prices and rents via an income e¤ect.
Studies of the impact of immigration on house prices and rents generally �nd a positive e¤ect.
Saiz (2007) looks at house prices and rents across cities in the US. He �nds that an immigration
in�ow equal to 1% of a city�s population is associated with an increase in average rents of about
1% and an increase in average prices of 2:9 to 3:4%. For Switzerland, Degen and Fischer (2009)
�nd that an immigration in�ow equal to 1% of an area�s population increases prices of single family
homes by about 2:7%. For Spain, Gonzalez and Ortega (2009) �nd a coe¢ cient of 3:2% for house
prices. In contrast to these studies, Akbari and Aydede (2009) and Stillman and Maré (2008) �nd
1The de�nition of immigrants adopted in this article is based on country of birth.2See Dustmann and Glitz (2005) for a survey of this literature.
2

that immigration has only small e¤ects on house prices in Canada and New Zealand. These two
studies use Census data and thus examine long-run e¤ects. Because housing supply is likely to be
more elastic in the long-run, it is not surprising that immigration would have a smaller impact on
house prices and rents between Census dates than between consecutive years.
This article studies the e¤ect of immigration on house prices in the UK. It is the �rst to study
the e¤ects of immigration in the UK using data disaggregated by local authority. Previous studies
work with a broader classi�cation of regions to match government o¢ ce regions. This is the only
level of disaggregation possible with the standard publicly-available version of the UK Labour Force
Survey (LFS). The immigration data used in this article are from the special license access version
of the UK LFS, obtained via an agreement with the O¢ ce of National Statistics (ONS). The �nal
data set used in the estimations covers 159 local authorities in England and Wales, including all 32
London boroughs, in the period from 2003 to 2010.
In contrast to what has been found for other countries, my results suggest that immigration
has a negative e¤ect on house prices at the local level. Speci�cally, an immigration in�ow equal
to 1% of the local initial population leads to a reduction of 1:6% in house prices. To explore the
channels through which this e¤ect is likely to take place, I look at the e¤ect of immigration on native
population growth and mobility and �nd that immigration leads to native out�ows. I then look at
how this change in the composition of the local population a¤ects the local wage distribution. I
�nd a positive correlation between immigration and the fraction of the local population in the �rst
quartile of the wage distribution. This is mostly due to the fact that the native population tends
to have lower wages in high immigration cities. Two factors are behind this result. First, there is
some evidence that immigration reduces native wages at the lower end of the wage distribution.
Second, natives who move to a di¤erent local authority tend to be at the higher end of the wage
distribution.
To study whether the e¤ect of immigration on house prices depends on the characteristics of
the local immigrant population, I divide local authorities into four groups according to the level
of education of the immigrant population. I �nd that the negative e¤ect of immigration on house
prices is driven by local authorities where immigrants have lower education. This is consistent with
immigration having a positive income e¤ect on housing demand in regions where immigrants have
higher education (and higher wages), counteracting the negative income e¤ect generated by native
out-mobility.
The �nal section of this article looks at results with more aggregated regions. To match previous
studies, I divide England and Wales into ten government o¢ ce regions and repeat the analysis of
the e¤ects of immigration on house prices using this de�nition of local market. The estimates are
more imprecise because the sample is smaller and show no evidence that immigration has any e¤ect
on house prices once regions are aggregated to this level. This is consistent with the analysis in
Borjas (2006) and suggests that native mobility may di¤use the e¤ects of immigration throughout
these broad regions. Immigration may have important economic e¤ects at the local level which are
only captured when the labour market is de�ned at a su¢ ciently disaggregated level.
3
The rest of the paper is organized as follows. Section 2 presents a model that studies the
e¤ect of immigration on house prices. The model allows for mobility by natives and includes an
income e¤ect on the demand for housing. Section 3 discusses the empirical methodology. Section 4
describe the data and descriptive statistics. Empirical results are reported and discussed in Section
5. Section 6 reports results with more aggregated regions and Section 7 presents conclusions.
2 The Model
A simple model is introduced to illustrate the link between immigration, native mobility and house
prices. It follows closely the model in Saiz (2007) and extends it to include income e¤ects in housing
consumption and the preference of natives for immigration. The model focuses on the e¤ects of
immigration on a given city C.
There are two types of workers in the city: natives (N) and immigrants (I). While immigrants
are homogeneous, natives are heterogeneous both in wages and in their preference for local ameni-
ties. We assume that there are two types of natives in the city: high income natives (NH) and low
income natives (NL). Due to mobility costs only high income natives can move from city C to an
another city. Low income natives cannot move and their supply is treated as exogenous.
The preferences of high income native resident i is given by:
UiC = ViC + h12 � x
12 � � � I (1)
ViC is the value of the local amenities of city C for native i. The second term is a Cobb-
Douglas utility function on consumption of housing services (h) and consumption of other goods
(x). The last term captures the preference of natives for immigration. If natives have a distaste
for immigration the coe¢ cient � is positive. If natives like to live in cities with high immigration
� for example, because they value cultural diversity � the coe¢ cient � is negative.
Individuals maximize utility subject to the following budget constraint:
R � h+ x =WH
where R denotes housing rents and WH is the wage of high income native workers. The price
of other goods x has been normalized to one.
The utility maximization problem delivers the following demand functions for housing and other
goods:
h =1
2� W
H
R(2)
x =1
2�WH
Following Saiz (2007), I order high income natives according to their preference for local ameni-
4

ties, i 2 f1; 2; :::; Ng, and assume that the preferences for each individual are given by ViC = A�a�i.Wages of high and low income natives are allowed to depend on the number of immigrants in
the city according to a linear functionWH =WH��H �I andWL =W
L��L �I. No restrictions areimposed on the sign of �H and �L. If immigrants are substitutes to native workers, then � would be
positive and immigration would depress the wage of natives. On the other hand, if immigrants are
complements to native workers, � would be negative and immigration would have a positive e¤ect
on the wage of natives. This captures the mechanism described in Ottaviano and Peri (2007), where
immigration has a positive e¤ect on the wages of highly educated natives due to complementarities
in production and has a negative e¤ect on the wages of less educated natives due to substitution
in production. In our model this would imply �H < 0 and �L > 0. To simplify the analysis, we do
not consider complementarity or substitutability among native workers.
To model the mobility decision of high income natives, assume that the utility level that can
be attained outside the city is U . Native resident i decides to stay in the city if UiC > U . The
marginal native is indi¤erent between staying and leaving. Substituting the demand functions (2)
into the utility function (1) gives the following indi¤erence condition for the marginal native NH :
A� a �NH +1
2�WH �R�
12 � � � I = U
This condition determines the number of high income native residents in the city:
NH =1
a[A� U + 1
2�WH �R�
12 � � � I] (3)
The supply of immigrants I is treated as exogenous and immigrants are assumed to always
prefer to stay in city C. We further assume that the demand of housing services by low income
natives and by immigrants is identical to that of high income natives. Immigrants are homogeneous
and have wage WI .
The total demand for housing services equals the sum of the demand by natives and by immi-
grants:
HD =1
2� 1R[NH �WH +NL �WL + I �W I ]
The term in square brackets is total wealth in the city. Taking logs of this equation:
lnHD = � ln 2� lnR+ lnWealth (4)
The response of housing costs to immigration and native mobility depends on the elasticity
of supply. In areas where housing supply is more elastic, housing costs should increase by less in
response to an increase in demand. The link between house prices and supply elasticity is studied
in Glaeser, Gyourko and Saiz (2008). Their model predicts that places with more elastic housing
supply have fewer and shorter housing bubbles, with smaller price increases. This prediction is
supported by data for US metropolitan areas. Favara and Imbs (2010) study the e¤ect of branching
5

deregulation in the US in 1994. Deregulation relaxes access to mortgage credit and increases demand
for house ownership. Their evidence suggests that house prices rise with branching deregulation,
particularly in metropolitan areas where construction is inelastic for topographic reasons.
To capture the e¤ect of the elasticity of housing supply on the response of housing costs to
immigration and native mobility, I follow Saiz (2007) and adopt the following speci�cation for
housing supply:
lnHS = �0 + �1 lnP (5)
where �1is the price elasticity of housing supply and P is the price of housing, which equals the
present value of housing rents discounted at rate d: P = Rd or lnP = lnR� ln d.
In equilibrium housing demand equals supply. Combining equations (4) and (5) gives:
lnP =1
1 + �1� [� ln 2� ln d� �0 + lnWealth] (6)
We are interested in the e¤ect of immigration on house prices dPdI . From the equation (6), we
have:
dP
dI= P � 1
1 + �1� 1
Wealth� dWealth
dI(7)
Using the de�nition of wealth we obtain:
dWealth
dI=dNH
dI�WH �NH � �H �NL � �L +W I (8)
If immigrant in�ows are completely o¤set by native out�ows (dNH
dI = �1), there may still bean e¤ect on wealth and house prices even if native wages are not a¤ected (i.e., �H = �L = 0). This
happens if the wages of natives who leave are di¤erent from the wages of immigrants who come
into the city (i.e., WH 6= W I). In this case, the level of wealth in the city will change and house
prices will be a¤ected via the income e¤ect.
It can also be seen that, even if immigration has no impact on the mobility decisions of natives
(dNH
dI = 0), it can still have an e¤ect on house prices. This e¤ect is unambiguously positive if
immigration has no e¤ect on native wages (�H = �L = 0). Otherwise, the sign of the e¤ect depends
on how immigrant wages compare with the change in native wages.
The mobility response of natives to immigration (dNH
dI ) can be derived from equation (3):
dNH
dI= �1
a� [12� �H � (P � d)�
12 +
1
4�WH � (P � d)�
32 � d � dP
dI+ �] (9)
Natives respond to immigration by moving out of the city if immigration has a negative e¤ect
on native wages (positive �H), if it has a positive e¤ect on house prices (positivedPdI ) and if natives
have a distaste for immigration (positive �).
Combining equations (7), (8) and (9) gives:
6

dP
dI= �
P � [ 1a � [12 � �H � (P � d)
� 12 + �] �WH +NH � �H +NL � �L �W I ]
(1 + �1) �Wealth+ 1a �
14 �WH � (P � d)� 1
2
(10)
The sign of the e¤ect of immigration on house prices is ambiguous. The e¤ect will tend to be
negative if immigration leads to a reduction in native wages (�H > 0 and �L > 0) and if natives
dislike immigration (� > 0). In this case, high income natives will leave the city and house prices
will be depressed. On the other hand, the e¤ect will tend to be positive if complementarities in
production lead to a positive e¤ect of immigration on native wages (�H < 0 and �L < 0), if natives
have a positive preference for immigration (� < 0) or if the wage of immigrants is large.
This result contrasts with Saiz (2007), where immigration has an unambiguously positive e¤ect
on house prices. There are two di¤erences between his model and the one used here. First, I
introduce a parameter that captures the preference of natives for immigration (�). If this parameter
is large and positive, natives dislike immigration. In this case, more natives will leave the city in
response to immigration and house prices will decrease as a result. In addition, I extend the model
in Saiz (2007) to introduce income e¤ects in the demand for housing. This ampli�es the negative
e¤ect of native out-migration on house prices, especially if natives who leave the city are the ones
with higher income.
This equation also shows that the response of house prices to immigration is smaller in cities
where supply is more elastic, i.e.@j dPdI j@�1
< 0. This is intuitive and consistent with the �ndings in
Glaeser, Gyourko and Saiz (2008) and Favara and Imbs (2010). If housing supply is more elastic, it
will respond to demand conditions: an increase in demand will lead to more housing construction
and a smaller increase in house prices, while a reduction in demand will lead to less construction
and a smaller reduction in prices.
With this theoretical framework in mind, I now turn to the empirical evidence. I �rst look at
the e¤ect of immigration on house prices and then explore the channels that the model indicates to
be important in determining this e¤ect. In particular, I study the e¤ect of immigration on native
mobility and wages.
3 Methodology
The following model is used to estimate the e¤ect of immigration on house prices:
� ln(Pit) = ��FBitPopit�1
+ Xit + �t + �i + "it (11)
where � ln(Pit) is the change in the log of the house price index in local authority i between
years t� 1 and t. The main independent variable is the annual in�ow of immigrants divided by theinitial population. The coe¢ cient � can be interpreted as the percentage change in house prices
corresponding to an annual in�ow of immigrants equal to 1% of the local initial population. Xit is
7

the change in employment to population ratio at the local level, which controls for macroeconomic
conditions. Year dummies (�t) capture national trends in in�ation and other economic variables.
Since the model is written in �rst-di¤erences, time-invariant factors that are speci�c to each local
authority and that a¤ect the level of house prices have been di¤erenced out. However, results will
also be reported including local authority dummies (�i) to capture di¤erent trends in house prices
at the local level.
The e¤ect of immigration on house prices is identi�ed from spatial correlations between immi-
grant in�ows and changes in house prices across local authorities. There are two potential problems
in interpreting these correlations as causal e¤ects. First, immigrant in�ows and house prices may be
spatially correlated because of common �xed in�uences, for example, the climate or local amenities.
This would lead to a correlation between immigrant in�ows and house prices, even in the absence of
any genuine e¤ects of immigration. The second problem is that the direction of causality between
immigrant in�ows and house prices is not clear because immigrants are not randomly allocated
across geographic areas. The sign of the bias is di¢ cult to predict ex ante. On the one hand,
immigrants may locate in more prosperous areas where house prices are growing faster. On the
other hand, it is reasonable to expect that, controlling for economic conditions, immigrants would
choose to locate in areas where house prices are growing more slowly.
To address the �rst problem the model is estimated with the dependent variable in �rst-
di¤erences. This eliminates time-invariant, area-speci�c factors that a¤ect immigration and the
level of house prices. To address the second problem I construct an instrument for the recent
distribution of the immigrant population based on the historical settlement patterns of immigrants
by country of origin. This instrument is commonly used in the literature and is supported by
the �ndings of Bartel (1989) who argues that immigrants in the US tend to locate in areas where
immigrant settlement is already strong. It is based on the notion that immigrant networks are an
important determinant of the locational choices of new immigrants because they facilitate the job
search process and assimilation into a new culture (Munshi 2003).
Speci�cally, the instrument for the annual in�ow of immigrants into local authority i as a share
of the population is de�ned as: Xc
�cit0�FBct
Popit�1(12)
where �cit0 is the share of individuals born in foreign region c that live in local authority i in the
base year t0. This provides a measure of the size of the network from foreign region c in each local
authority i. �FBct is the in�ow of immigrants born in foreign region c to the UK as a whole in year
t. The predicted number of new immigrants from foreign region c in year t that choose to locate
in local authority i is �cit0�FBct. Summing across all regions of origin we obtain a measure of the
predicted total immigrant in�ow to local authority i in year t. I consider nine foreign regions of
8

origin: India, EU, Americas and Caribbean, Africa, Other Middle East and Indian sub-continent,
Asian, Antarctica and Oceania, Republic of Ireland and other countries.
The validity of this instrument relies on two identi�cation assumptions. First, I assume that
the historical settlement pattern of immigrants is uncorrelated with recent changes in the economic
performance of di¤erent geographic areas. In that case, lagged values of immigrant stocks are
correlated with changes in house prices only through their relation with immigrant in�ows. The
second identifying assumption is the exogeneity of annual changes in the national immigration
in�ows to the economic conditions of immigrant cities. This is a plausible assumption because
the overall number of legal immigrants in the UK should depend on political and administrative
decisions.
4 Data and Descriptive Statistics
Information on foreign born population by local authority and year is from the UK Labour Force
Survey (LFS). The LFS is a household survey, conducted by the O¢ ce for National Statistics
(ONS) and provides a wide range of data on labour market statistics. It was introduced in 1973
on a biennial basis and has been carried out as a rotating quarterly panel since 1992 with each
household being interviewed for �ve consecutive quarters. Each quarter about 60,000 households are
interviewed. Since I do not exploit quarterly variation and to increase the number of observations,
I pool all quarters for each year. The standard version of the UK LFS provides regional data
by government o¢ ce region (ten regions in England, plus Wales, Scotland and Northern Ireland).
Under an agreement with the ONS, I was granted access to the special license version of the LFS
which contains data at the local authority level. This is only available from the �rst quarter of 2003.
To construct the instrument for immigrant in�ows I need information on the historical settlement
pattern of immigrants with a su¢ cient time lag. Because the version of the LFS disaggregated by
local authority only starts in 2003, I rely on 1991 Census data to construct the historical geographic
distribution of immigrants used to build the instrument.
House price data at the local authority level are from the Land Registry. This data set is
based on a record of all residential property transactions made in England and Wales since January
1995, whether with cash or with a mortgage. It contains details on over 15 million sales. An
index is constructed from these sales data, which is seasonally adjusted and corrects for changes
in the quality of housing by using repeated sales. Out of the 15 million sales for which data are
collected, just over �ve million are identi�able matched pairs, providing the basis for the repeated
sales regression analysis used to compile the index. This index is then used to construct seasonally
adjusted standardized (i.e. corrected for quality) average house prices across local authorities.
Standardized average prices are calculated by taking the geometric mean price for each area in
April 2000 and using the seasonally adjusted price index to compute average prices back to 1995
and forward to the present day. After combining LFS data with the house price index from the
Land Registry, the data set used for the regression analysis covers the period from the �rst quarter
9

of 2003 to the fourth quarter of 2010 and includes 159 local authorities in England and Wales,
including all 32 London boroughs. In all estimations I work with a sample of population of working
age (16 to 65).
Figure 2 shows the evolution of standardized average house prices in England and Wales since
1995. There was a steady increase in average house prices until the recent �nancial crisis, from
just over £ 60,000 in 1995 to nearly £ 180,000 in 2007. Average house prices have then declined in
2008 and 2009 and started recovering in 2010. Behind this overall evolution there is substantial
variation across local authorities. Table 2 shows the local authorities with the highest average
house prices in 2010. The highest prices are registered in London boroughs, with Kensington and
Chelsea registering an average price well above £ 800,000.
Table 3 contains summary statistics for the main variables used in the analysis. On average,
house prices increased 3:7% per year in England and Wales in the period from 2003 to 2010. There is
signi�cant time series and regional variation behind this average. The largest increase in house price
was registered in 2004 in Liverpool, Middlesbrough (in North East England) and Carmarthenshire
(Wales), where house prices increased by more than 30%. The largest reduction in house prices
was registered in 2009, at the height of the �nancial crisis, in Barking and Dagenham (a borough of
London), Knowsley (in Merseyside, North West England) and Neath Port Talbot (Wales). These
three regions saw house prices fall by more than 17% in 2009.
Turning to immigration �ows (the main explanatory variable), the average annual in�ow of
immigrants across local authorities equals 0:5% of the initial local population. The largest in�ows
are registered in London boroughs, where in some years the in�ow of immigrants is well above
10% of the initial local population. Interestingly, the largest out�ows are also registered in London
boroughs3.
5 Results
5.1 Immigration and House Prices
Table 4 reports the results of estimating equation (11). The dependent variable is the change
in the log of the house price index and the main independent variable is the change in the for-
eign born population relative to the total population in the previous year. Standard errors are
heteroskedasticity-robust and are clustered by local authority to account for correlation within
groups. The regressions include year �xed e¤ects to capture national trends in in�ation and other
economic variables. Results are reported with and without local authority �xed e¤ects. Because
the model is estimated in �rst-di¤erences, time-invariant factors that are speci�c to each local au-
thority and that a¤ect the level of house prices have been di¤erenced out. The inclusion of local
authority �xed e¤ects in the model captures di¤erent trends in house prices at the local authority
level.3The maximum value (28:2%) was registered in Islington in 2004. The minimun value (an out�ow of 18:3% of the
initial local population) was registered in Harrow in 2010.
10

The OLS coe¢ cient is negative and statistically signi�cant. This coe¢ cient cannot be inter-
preted as the causal e¤ect of immigration on house prices because the locational choice of immigrants
is not random. To overcome this problem, I use the settlement pattern of immigrants from the
1991 Census to predict the geographic distribution of immigrants in the current period. Table 5
reports the �rst stage regression where the dependent variable is the change in the foreign-born
population in a local authority over the local population in the previous year. The main explana-
tory variable is the instrument: the change in the predicted foreign-born population relative to the
total initial population. The coe¢ cient is 0:866 and is signi�cant at the 1% level. This suggests
a strong correlation between the current geographic distribution of immigrants and the predicted
geographic distribution based on their historical settlement pattern.
The IV estimates are reported in columns 3 and 4 of Table 4. The results are very similar with
and without local authority �xed e¤ects. They suggest that an immigrant in�ow equal to 1% of
a local authority�s initial population leads to a reduction of 1:6 to 1:7% in house prices. These
estimates are more negative than the ones obtained by OLS suggesting a positive bias in the OLS
results. This can be explained by a tendency for immigrants to locate in prosperous areas where
house prices are growing faster.
The �nding that an immigrant in�ow equal to 1% of a local authority�s population reduces
house prices by 1:6% contrasts sharply with studies for other countries which tend to �nd a positive
e¤ect. For example, for the US Saiz (2007) �nds that an immigration in�ow equal to 1% of a city�s
population is associated with an increase in average average prices of 2:9 to 3:4%. For Switzerland
Degen and Fischer (2009) �nd a positive e¤ect of about 2:7% and for Spain Gonzalez and Ortega
(2009) �nd a positive e¤ect of 3:2%. The underlying model in these studies is one where immigrant
in�ows increase the demand for housing. Combined with an upward-sloping supply of housing, this
would lead to an increase in house prices.
The theoretical model described in Section 2 outlines some channels through which immigration
may lead to a reduction in house prices. First, immigration may be associated with o¤setting native
out-migration. If the o¤set is complete there would be no change in the size of the local population.
Even in this case, house prices may still decrease if the wage of natives who leave is higher than
the wage of immigrants who come into the city. For example, suppose that for each immigrant
that enters a region one native moves out and that natives who move out have higher wages. In
this case, even though the size of the local population does not change, there is a reduction in
local wealth which would lead to a reduction in housing demand and house prices in areas where
immigrants settle.
A second reason why immigration may generate a negative e¤ect on house prices is if immigrants
and natives are substitutes in production. In this case, an immigrant in�ow would lead to a
reduction in native wages. Provided immigrant wages are not large enough to compensate for the
reduction in native wages, local wealth would decrease generating a reduction in house prices.
To understand the mechanism behind the negative e¤ect of immigration on local house prices,
I look at how immigration a¤ects native population growth and mobility and the wages of the local
11
population.
5.2 Immigration and Native Population Growth and Mobility
Since the UK-born have very low emigration rates, at the national level each additional immi-
grant adds one person to the total population. At the local level, however, there are substantial
movements of population that can potentially o¤set immigrant in�ows.
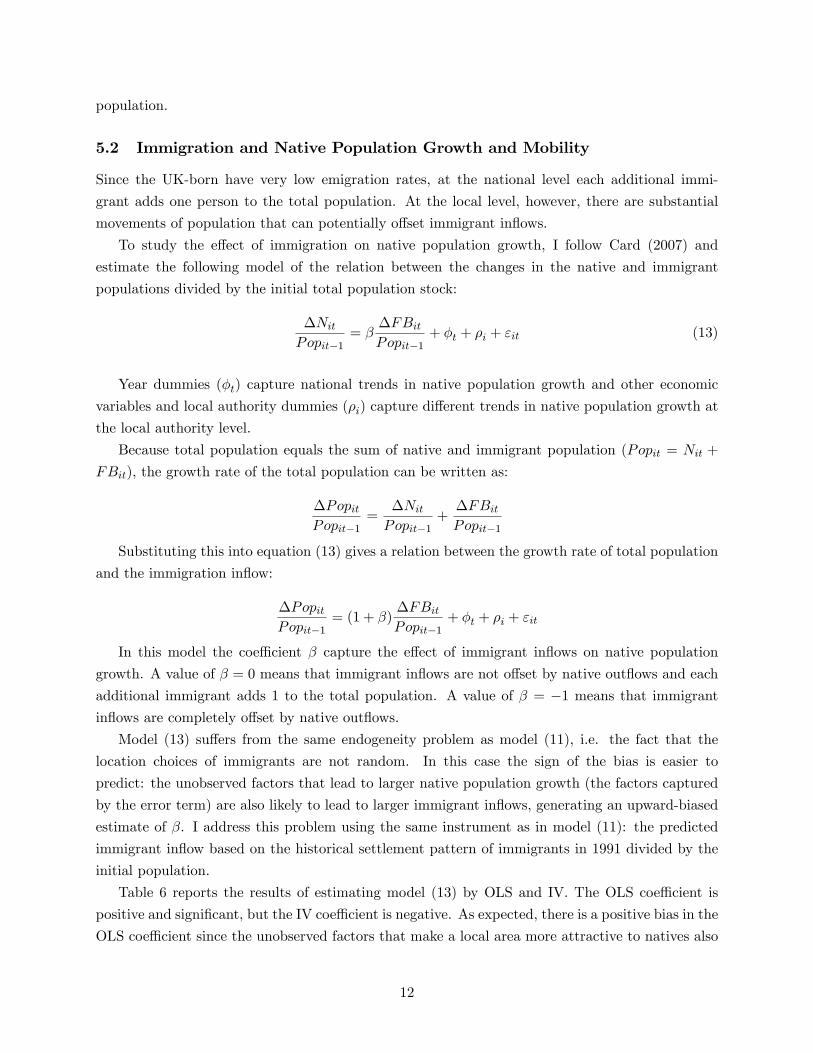
To study the e¤ect of immigration on native population growth, I follow Card (2007) and
estimate the following model of the relation between the changes in the native and immigrant
populations divided by the initial total population stock:
�NitPopit�1
= ��FBitPopit�1
+ �t + �i + "it (13)
Year dummies (�t) capture national trends in native population growth and other economic
variables and local authority dummies (�i) capture di¤erent trends in native population growth at
the local authority level.
Because total population equals the sum of native and immigrant population (Popit = Nit +
FBit), the growth rate of the total population can be written as:
�PopitPopit�1
=�NitPopit�1
+�FBitPopit�1
Substituting this into equation (13) gives a relation between the growth rate of total population
and the immigration in�ow:
�PopitPopit�1
= (1 + �)�FBitPopit�1
+ �t + �i + "it
In this model the coe¢ cient � capture the e¤ect of immigrant in�ows on native population
growth. A value of � = 0 means that immigrant in�ows are not o¤set by native out�ows and each
additional immigrant adds 1 to the total population. A value of � = �1 means that immigrantin�ows are completely o¤set by native out�ows.
Model (13) su¤ers from the same endogeneity problem as model (11), i.e. the fact that the
location choices of immigrants are not random. In this case the sign of the bias is easier to
predict: the unobserved factors that lead to larger native population growth (the factors captured
by the error term) are also likely to lead to larger immigrant in�ows, generating an upward-biased
estimate of �. I address this problem using the same instrument as in model (11): the predicted
immigrant in�ow based on the historical settlement pattern of immigrants in 1991 divided by the
initial population.
Table 6 reports the results of estimating model (13) by OLS and IV. The OLS coe¢ cient is
positive and signi�cant, but the IV coe¢ cient is negative. As expected, there is a positive bias in the
OLS coe¢ cient since the unobserved factors that make a local area more attractive to natives also
12
make it more attractive to immigrants. Once this endogeneity is taken into account, the coe¢ cient
becomes negative and suggests that an immigrant in�ow equal to 1% of an area�s initial population
leads to a native out�ow equal to 0:849% of the area�s initial population. Hence, total population
in the area would increase by only 0:151% in response to a 1% immigrant in�ow.
Another way to study the response of the native population to immigration is to look at in-
migration and out-migration rates. Using information on net migration between 11 government
o¢ ce regions in the UK from National Health Service registration �ow data, Hatton and Tani
(2005) show that there is a negative correlation between immigration to one region from abroad
and in-migration from other regions. But this is only signi�cant for the southern regions where
immigration of foreign citizens is most concentrated.
The LFS contains information on the region of residence one year ago at the local authority
level. Using this information, I compute in-migration, out-migration and net migration rates for
the native population. A native is classi�ed as having moved out of local authority i if he lived in
that local authority in year t�1 and lives in a di¤erent local authority in year t. The out-migrationrate is de�ned as the number of natives who moved out of local authority i between years t � 1and t divided by the native population of local authority i in year t � 1. Similarly, a native isclassi�ed as having moved into local authority i if he lives there in year t and lived in a di¤erent
local authority in t� 1. The in-migration rate is obtained by dividing the number of natives whomoved into local authority i by the population of i in t � 1. The net out-migration rate is simplythe di¤erence between the out-migration and the in-migration rates.
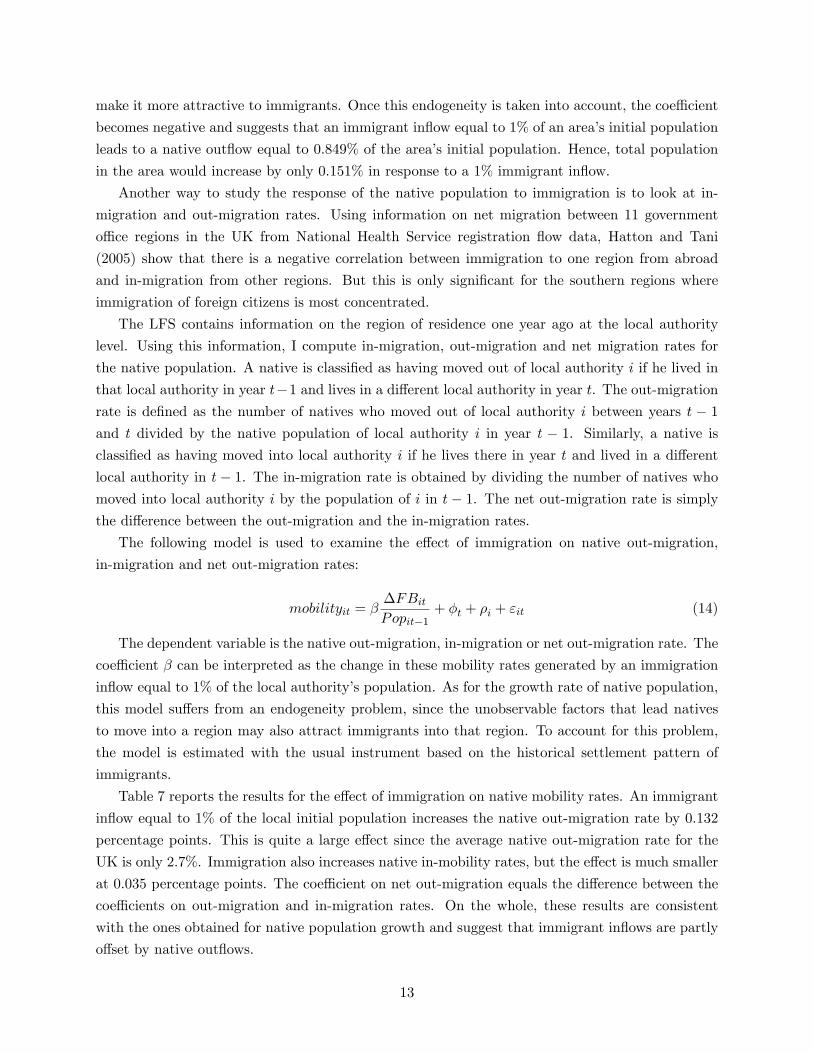
The following model is used to examine the e¤ect of immigration on native out-migration,
in-migration and net out-migration rates:
mobilityit = ��FBitPopit�1
+ �t + �i + "it (14)
The dependent variable is the native out-migration, in-migration or net out-migration rate. The
coe¢ cient � can be interpreted as the change in these mobility rates generated by an immigration
in�ow equal to 1% of the local authority�s population. As for the growth rate of native population,
this model su¤ers from an endogeneity problem, since the unobservable factors that lead natives
to move into a region may also attract immigrants into that region. To account for this problem,
the model is estimated with the usual instrument based on the historical settlement pattern of
immigrants.
Table 7 reports the results for the e¤ect of immigration on native mobility rates. An immigrant
in�ow equal to 1% of the local initial population increases the native out-migration rate by 0:132
percentage points. This is quite a large e¤ect since the average native out-migration rate for the
UK is only 2:7%. Immigration also increases native in-mobility rates, but the e¤ect is much smaller
at 0:035 percentage points. The coe¢ cient on net out-migration equals the di¤erence between the
coe¢ cients on out-migration and in-migration rates. On the whole, these results are consistent
with the ones obtained for native population growth and suggest that immigrant in�ows are partly
o¤set by native out�ows.
13

5.3 Immigration and Native Wages
Another channel highlighted by the model in Section 2 through which immigration may a¤ect
house prices is via its e¤ect on native wages. If immigrants and natives are substitutes in produc-
tion, immigration should have a negative e¤ect on native wages. On the other hand, if they are
complements immigration should have a positive e¤ect on native wages.
Using an approach similar to Dustmann, Frattini and Preston (2008), I study the e¤ect of
immigration on native wages at di¤erent points in the native wage distribution. This study shows
that if immigrants are placed in the wage distribution according to predicted wages based on their
age and education, they would be located at the upper and middle part of the wage distribution.
However, if they are placed in the wage distribution according to their observed wage, they are at
the lower end of this distribution. It is then plausible that immigration depresses native wages at
the lower end of the wage distribution because immigrants and lower wage natives are substitutes
in production.
To test this in my data, I use information on gross hourly wages from the LFS. To reduce
the impact of outliers, the sample is trimmed to include observations between the 1st and 99th
percentiles of the wage distribution in each year. I then regress �rst di¤erences in the log of the
percentile p of native wages across di¤erent local authorities in the UK on the fraction of new
immigrants in the initial population, year �xed e¤ects and local authority �xed e¤ects:
� ln(wipt) = �p�FBitPopit�1
+ �t + �i + "it (15)
The model is estimated separately for the 25th, 50th and 75th percentiles of the native wage
distribution. To overcome the problem of endogenous allocation of immigrants into particular
regional labour markets, I use the instrument given in equation (12) based on the settlement
pattern of previous immigrants.
The results, reported in Table 8, suggest that immigration has a negative but largely insigni�cant
e¤ect on native wages. The e¤ect is only signi�cant in the IV regression for the 25th percentile,
suggesting that an immigration in�ow equal to 1% of the region�s initial population reduces the
25th percentile of native wages by 0:26%. This e¤ect is similar to the one found in Dustmann,
Frattini and Preston (2008).
5.4 Immigration and the Wage Distribution of the Local Population
The �ndings on native population growth and mobility suggest that immigration into a local area
is partly o¤set by native out�ows. This change in the composition of the local population may have
implications for the income distribution and hence for house prices. For example, if immigrants
have lower income than natives, an in�ow of immigrants and an out�ow of natives would depress
income in the local area and should lead to a reduction in demand for housing and in house prices.
To look at the e¤ect of immigration on the income distribution of the local population, I
compute the four quartiles of the national wage distribution for the total population (immigrants
14

and natives) in each year4. In 2010 the 25th percentile of the national wage distribution was $7:2
per hour, the median was $10:2 and the 75th percentile was $15:5. Following Card (2007), I de�ne
the following fractions:
� �iqt, q = 1; 2; 3; 4 is the fraction of all residents (natives and immigrants) in local authority ithat have wages in each of the four quartiles of the national wage distribution in year t.
� pUKqt , q = 1; 2; 3; 4 is the fraction of all natives at the national level that have wages in eachof the four quartiles of the national wage distribution in year t. Because the large majority
of the population is UK-born, pUKqt should be close to 0:25.
� piqt, q = 1; 2; 3; 4 is the fraction of all native residents in local authority i that have wages ineach of the four quartiles of the national wage distribution in year t.
� qUKqt , q = 1; 2; 3; 4 is the fraction of all immigrants at the national level that have wages in
each of the four quartiles of the national wage distribution in year t.
� qiqt, q = 1; 2; 3; 4 is the fraction of all immigrant residents in local authority i that have wagesin each of the four quartiles of the national wage distribution in year t.
In the absence of immigration or any di¤erential sorting of the native population across local
authorities, the fraction of all residents in each quartile should be similar to the fraction of natives
at the national level in each quartile, i.e., �iqt ' pUKjt ' 0:25. Letting fit denote the share of
immigrants in the population in local authority i in year t, the deviation from this counterfactual
can be written as the sum of three terms:
�iqt � pUKqt = fit(qUKqt � pUKqt ) + fit(qiqt � qUKqt ) + (1� fit)(piqt � pUKqt ) (16)
The �rst term is a composition e¤ect: if the national fraction of immigrants in each skill group (
qUKqt ) di¤ers from the national fraction of natives (pUKqt ), regions with more immigrants will tend to
be further away from the counterfactual share pUKjt . The second term captures the local selectivity
of the immigrant population: if region i has more immigrants in wage group q than the national
average, the fraction of the total population in wage group q in region i (�iqt) will also be larger.
The third term is similar and captures the local selectivity of the native population.
To see how immigration a¤ects the wage distribution of the local population, I regress each
component in equation (16) on the share of immigrants in the population at the local level (fit =FBitPopit
) and a set of local authority and year �xed e¤ects. This is done separately for each quartile
of the wage distribution. The results are reported in Table 9. Note that, because equation (16)
holds identically, the coe¢ cients in columns 2 to 4 add up to the coe¢ cient in column 1.
Overall, there is a strong positive relation between the fraction of immigrants in a local authority
and the fraction of residents in the lowest wage quartile, attributable mainly to the native selectivity
4As before, the sample is trimmed to include observations between the 1st and 99th percentiles of the wagedistribution in each year. This reduces the impact of outliers.
15

e¤ect. Speci�cally, a 10 percentage point increase in the local fraction of immigrants is associated
with a 2 percentage points increase in the fraction of the population in wage quartile 1, of which 0:4
percentage points is attributable to the pure composition e¤ect, 0:3 percentage points is attributable
to the fact that the immigrant population tends to be have smaller wages in high immigration
cities, and 1:3 percentage points is attributable to the fact that the native population tends to
have smaller wages in high immigration cities. Similarly, there is a negative relation between the
fraction of immigrants in a local authority and the fraction of residents in the highest wage quartile.
Again, this is mostly due to the fact that the native population tends to have smaller wages in high
immigration cities.
These results could be driven by two factors. First, immigration could be driving down native
wages. Second, natives who leave high immigration cities could be the ones at the top of the wage
distribution. I have already presented some evidence that immigration has a negative e¤ect on
native wages at the lower end of the wage distribution. To test whether natives who leave the city
are at the top of the wage distribution, I work with individual-level data for natives and look at
whether the probability of being in each of the four quartiles of the wage distribution is di¤erent for
those who leave the city and those who stay. In particular, the following logit model is estimated
separately for each quartile q of the native wage distribution (q = 1; 2; 3; 4):
Djqt = �[�qmovedjt + �t + �i] + "it (17)
The dependent variable Djqt is an indicator equal to 1 if native j earns a gross hourly wage
in quartile q of the wage distribution and 0 otherwise. The independent variable of interest is
movedjt, which is an indicator equal to 1 if native j moved to a di¤erent local authority between
periods t� 1 and t. This variable is constructed using the LFS and is based on the local authorityof residence at the time of the survey and one year ago (the same data used to construct mobility
rates). The model includes year and local authority �xed e¤ects.
Table 10 reports the results of estimating this model for each quartile of the wage distribution.
There is some evidence that natives who move to a di¤erent local authority are more likely to
be in the upper quartiles of the wage distribution, Speci�cally, natives who move to a di¤erent
local authority have a probability of being in the �rst quartile of the wage distribution that is 9:6
percentage points lower than that of natives who do not move. The probability of being in the
third quartile of the wage distribution is 12:4 percentage points higher for natives who move than
for those who stay. This suggests that native out-mobility leads to a reduction in income at the
local level which pushes down house prices via the income e¤ect.
The �nding that natives who move to a di¤erent local authority tend to be at the top half of
the wage distribution combined with the �nding that immigration does not depress wages in that
part of the wage distribution suggests that native out-mobility is not being driven by a reduction
in wages. Looking at the determinants of native out-mobility in equation (9), the empirical results
suggest that immigration has no e¤ect on wages of natives at the top of the wage distribution
(�H = 0) and has a negative e¤ect on house prices (dPdI < 0). This implies that native out-mobility
16

is driven by other factors which are captured by a negative preference for immigration (� > 0).
5.5 Immigrant Education and the E¤ect of Immigration on House Prices
The model in Section 2 predicts that immigration is more likely to have a negative e¤ect on house
prices in regions where immigrant wages are low. This is because high immigrant wages would
push up housing demand via the income e¤ect.
To test this hypothesis, I use information on the highest quali�cation attained by immigrants
from the LFS. I focus on education rather than wages to avoid potential endogeneity between house
prices and wages. There could be unobserved factors which simultaneously a¤ect house prices and
wages. Also, if immigrants work in the construction sector, a boom in house prices may lead to
an increase in immigrant wages generating reverse causality. Working with education gets around
these problems.
For each year and local authority, I calculate the percentage of immigrants with a level of
education below the General Certi�cate of Secondary Education (GCSE) or equivalent. In 2010,
46:4% of immigrants in England and Wales had a level of education lower than GCSE or equivalent.
For natives this percentage is lower at 20:5%. Local authorities are divided in four groups based
on the quartiles of the regional distribution of the share of immigrants with lower education (below
GCSE). To test whether the negative e¤ect of immigration on house prices is larger in regions where
immigrants have lower education, model (11) is estimated separately for each of these four groups
of local authorities. Table 11 reports OLS and IV results with the usual instrument based on the
historical settlement pattern of immigrants.
The results support the hypothesis that immigration has a more negative e¤ect on house prices
in regions where immigrants have lower education. For regions where the share of immigrants
with lower education is low (quartiles 1 and 2), immigration has no signi�cant e¤ect on house
prices. The e¤ect becomes negative and signi�cant as the share of immigrants with lower education
increases. The IV results suggest that an in�ow of immigrants equal to 1% of the initial local
population reduces house prices by 1:4% for local authorities in quartile 3 and by 1:8% for local
authorities in quartile 4. Consistent with the intuition of the model in Section 2, the negative e¤ect
of immigration on house prices is driven by regions where immigrants have lower education.
6 Results with aggregated regions
The mobility response of natives presents challenges when trying to derive implications of our
results for the national economy. Native out-migration has a negative income e¤ect on housing
demand in local areas. However, natives who move push up housing demand in the local areas that
they move into. An analysis of the e¤ects of immigration with broader regions is likely to point
to a small e¤ect of immigration on house prices because the e¤ects of immigration are di¤used
throughout the region.
The consequences of the mobility response of natives for the validity of the spatial correlations
17

approach are discussed in Borjas (2006). He points out that natives may respond to the entry
of immigrants into a local labor market by moving to other localities until native wages are again
equalized across areas. An inter-region comparison of the wage of native workers might show little or
no di¤erence because the e¤ects of immigration are di¤used throughout the region, and not because
immigration had no economic e¤ects. Using data from the US 1960-2000 decennial censuses, Borjas
�nds that immigration is associated with lower in-migration rates, higher out-migration rates, and
a decline in the growth rate of the native workforce. The native migration response attenuates
the measured impact of immigration on wages in a local labor market, particularly when the labor
market is de�ned at a more aggregated level, such as the state rather than metropolitan area.
To test whether this is also the case in my analysis, I estimate equation (11) using broader
regions. Instead of considering 159 local authorities across England and Wales, I work with only
10 government o¢ ce regions: North East, North West, Yorkshire and Humberside, East Midlands,
West Midlands, East, London, South East, South West and Wales. As before, immigration data
are from the LFS and house price data are from the Land Registry. The data set covers the period
from 1996 to 2009. To overcome endogeneity in the locational choices of immigrants, the usual
instrument based on their historical settlement pattern is used. Table 12 reports OLS and IV
results. The �rst stage results are reported in Table 13 and con�rm the validity of the instrument
with this broader de�nition of regions.
The estimates are more imprecise because the sample is much smaller. There is no evidence
that immigration has any e¤ect on house prices once regions are aggregated to this level. This
is consistent with the analysis in Borjas (2006) and suggests that native mobility may di¤use the
e¤ects of immigration throughout these broad regions. Immigration may have important economic
e¤ects at the local level which are only captured when the labour market is de�ned at a su¢ ciently
disaggregated level.
7 Conclusion
There is a growing body of literature looking at the e¤ect of immigration on house prices in di¤erent
countries. This is an important dimension of the economic e¤ects of immigration given the large
weight that housing consumption has on the household budget. This article contributes to the
immigration literature by estimating the e¤ect of immigration on house prices in the UK and
highlighting the channels through which this e¤ect takes place.
Using data on immigration and house prices for 159 local authorities in England and Wales, I
�nd that immigration has a negative e¤ect on house prices. An in�ow of immigrants equal to 1%
of the local population reduces house prices by 1:6%. A simple theoretical model and my empirical
estimates on native population growth and mobility suggest that one explanation for this negative
e¤ect is the mobility response of natives. The estimates show that an immigrant in�ow equal to
1% of the local population leads to a native out�ow equal to 0:849% of the local population and
increases the native out-migration rate by 0:132 percentage points.
18

Looking at the wage distribution of the local population, I �nd that local areas with high
immigration tend to be at the bottom of the wage distribution. This is mostly due to the fact
that natives have lower wages in high immigration cities. This �nding can be explained by two
factors. First, there is some evidence that immigration has a negative e¤ect on native natives at
the lower end of the wage distribution. Second, natives who leave the city are at the top of the
wage distribution. This generates a negative income e¤ect on housing demand and pushes down
house prices in local areas where immigrants cluster.
Behind these overall e¤ects, there are some important di¤erences depending on the level of
education of the local immigrant population. The negative e¤ect of immigration on house prices
is driven by areas where the share of immigrants with lower education is high. This is consistent
with the intuition from the theoretical model which suggests that, in local areas where immigrants
are more educated (and hence have higher wages), immigration exerts a positive income e¤ect on
housing demand which counteracts the negative income e¤ect from native out-mobility.
19

References
[1] Akbari, A and Aydede, Y (2009), �E¤ects of Immigration on Housing Prices in Canada�,Atlantic Metropolis Centre Working Paper 24-2009.
[2] Bartel, A (1989), �Where do the New U.S. Immigrants Live?�, Journal of Labor Economics,vol. 7, pp. 371�91.
[3] Borjas, G (2006), �Native Internal Migration and the Labor Market Impact of Immigration�,The Journal of Human Resources, vol. 41, no. 2 pp. 221-258.
[4] Card, D (2007), �How Immigration A¤ects US Cities�, CReAM Discussion Paper 11/07.
[5] Degen, K and Fischer, A (2009), �Immigration and Swiss House Prices�, CEPR DiscussionPaper 7583.
[6] Dustmann, C, Fabbri, F and Preston, I (2005), �The Impact of Immigration on theBritish Labour Market�, The Economic Journal, vol. 115 (November), pp. F324-F341.
[7] Dustmann, C, Frattini, T and Preston, I (2008), �The E¤ect of Immigration along theDistribution of Wages�, CReAM Discussion Paper 03/08.
[8] Dustmann, C and Glitz, A (2005), �Immigration, Jobs and Wages: Theory, Evidence andOpinion�, CEPR/CReAM publication, London.
[9] Favara, G and Imbs, J (2010), �Credit Supply and the Price of Housing�, CEPR DiscussionPaper 8129.
[10] Glaeser, E, Gyourko, J and Saiz, A (2008), �Housing Supply and Housing Bubbles�,Harvard Institute of Economic Research Discussion Paper 2158.
[11] Gonzalez, L and Ortega, F (2009), �Immigration and Housing Booms: Evidence fromSpain�, CReAM Discussion Paper 19/09.
[12] Hatton, T and Tani, M (2005), �Immigration and Inter-regional Mobility in the UK:1982�2000�, The Economic Journal, vol. 115 (November), pp. F342�F358.
[13] House of Lords report (2008), �The Economic Impact of Immigration�.
[14] Munshi, K (2003), �Networks in the Modern Economy: Mexican Migrants in the US LaborMarket�, Quarterly Journal of Economics, vol. 118, pp. 549-99.
[15] Ottaviano, G and Peri, G (2007), �The E¤ects of Immigration on U.S. Wages and Rents:a General Equilibrium Approach�, CReAM Discussion Paper 13/07.
[16] Saiz, A (2007), �Immigration and Housing Rents in American Cities�, Journal of UrbanEconomics, vol. 61, pp. 345-371.
20

[17] Stillman, S and Maré, D (2008), �Housing Markets and Migration: Evidence from New
Zealand�, Motu Working Paper 08-06.
21

Figure 1. Percentage of immigrants in the population
68
1012
14%
imm
igra
nts
in p
opu
latio
n
1980 1990 2000 2010year
Source: UK Labour Force Survey Figure 2. Average house prices in England and Wales
5000
010
0000
1500
0020
0000
ave
rage
sta
ndar
dise
d s.
a. h
ous
e pr
ice
s (£
)
1994 1996 1998 2000 2002 2004 2006 2008 2010year
Source: Land Registry

Table 1. Local authorities with the largest concentration of immigrants in 2010 Percentage of immigrants in the population London Outside London Westminster 63.7 Leicester 40.8 Newham 62.4 Luton 35.3 Brent 58.6 Slough 33.6 Ealing 52.7 Milton Keynes 29.7 Kensington and Chelsea 51.3 Manchester 29.1 Tower Hamlets 50.6 Birmingham 24.9 Hounslow 50.5 Reading 23.3 Haringey 48.5 Coventry 22.3 Merton 47.0 Peterborough 22.0 Harrow 46.3 Rochdale 21.1
Source: UK Labour Force Survey Table 2. Local authorities with highest house prices in 2010 Average standardised house prices (£)
London Outside London
Kensington and Chelsea 873,071.3 Windsor and Maidenhead 322,359.1
Westminster 623,542.4 Surrey 296,963.9
Camden 546,056.3 Wokingham 271,856.9
Hammersmith and Fulham 495,451.0 Buckinghamshire 256,757.1
Richmond upon Thames 439,709.9 Hertfordshire 239,770.9
Islington 430,073.3 Oxfordshire 238,796.5
Wandsworth 381,705.1 Bath and North East Somerset 229,258.3
Southwark 367,191.2 West Berkshire 226,932.1
Hackney 365,235.3 Brighton and Hove 221,496.2
Barnet 346,038.8 Dorset 215,243.6
Source: Land Registry Table 3. Descriptive statistics (2003-2010)
Variable Observations Mean Std. Dev. Min Max ∆log house price index 1113 0.037 0.088 -0.178 0.312∆FBit/Popit-1 1113 0.005 0.037 -0.183 0.282 ∆Nit/Popit-1 1113 -0.001 0.093 -0.316 0.377Native out-migration rate 1360 0.027 0.045 0.000 0.683Native in-migration rate 1360 0.025 0.030 0.000 0.259Native net out-migration rate 1360 0.002 0.041 -0.174 0.587Share of immigrants with low education (below GCSE) 1341 0.467 0.153 0 1 ∆(Employmentit/Populationit) 1113 -0.003 0.032 -0.138 0.115

Table 4. Immigrant inflows and annual log house price changes – 2004-2010
∆log house price index (1) (2) (3) (4) OLS IV ∆FBit/Popit-1 -0.184*** -0.172*** -1.717** -1.627*** (0.032) (0.036) (0.829) (0.366) ∆(Employmentit/Populationit) 0.121*** 0.115*** 0.044 0.053 (0.042) (0.044) (0.077) (0.073) Observations 1113 1113 1113 1113 R-squared 0.790 0.814 0.397 0.499 Local authority fixed effects No Yes No Yes
Notes: Robust standard errors clustered by local authority in parentheses. ∆ indicates first difference. Regressions include year fixed effects. *** significant at 1% ** significant at 5% * significant at 10%
Table 5. First stage regression
∆FBit/Popit-1 instrument 0.866***
(0.284) Observations 1113
Notes: Robust standard errors clustered by local authority in parentheses. ∆ indicates first difference. Regressions include year and local authority fixed effects and the change in the employment to population ratio. The instrument is the change in the predicted foreign-born population relative to the total initial population. It uses the settlement pattern of immigrants in the 1991 Census to predict the number of foreign-born in each local authority in the current period. *** significant at 1% ** significant at 5% * significant at 10%

Table 6. Immigrant inflows and change in native population
∆Nit/Popit-1 (1) (2) OLS IV ∆FBit/Popit-1 0.229*** -0.849* (0.079) (0.469) Observations 1113 1113 R-squared 0.341 0.188
Notes: Robust standard errors clustered by local authority in parentheses. ∆ indicates first difference. Regressions include year and local authority fixed effects. *** significant at 1% ** significant at 5% * significant at 10%
Table 7. Immigrant inflows and native mobility
Native out-migration rate Native in-migration rate Native net out-migration rate (1) (2) (3) (4) (5) (6) OLS IV OLS IV OLS IV ∆FBit/Popit-1 0.111*** 0.132*** 0.032** 0.035* 0.080*** 0.097*** (0.024) (0.021) (0.014) (0.020) (0.025) (0.021) Observations 1360 1256 1360 1256 1360 1256 R-squared 0.637 0.646 0.627 0.639 0.388 0.408
Notes: Robust standard errors clustered by local authority in parentheses. ∆ indicates first difference. Regressions include year and local authority fixed effects. *** significant at 1% ** significant at 5% * significant at 10%

Table 8. Immigration and native wages
25.0
)ln(
percentile
wage
5.0
)ln(
percentile
wage
75.0
)ln(
percentile
wage
(1) (2) (3) (4) (5) (6) OLS IV OLS IV OLS IV ∆FBit/Popit-1 -0.079 -0.260* -0.059 -0.190 -0.070 -0.020 (0.082) (0.155) (0.070) (0.150) (0.092) (0.222) Observations 1113 1113 1113 1113 1113 1113 R-squared 0.067 0.051 0.063 0.054 0.047 0.046
Notes: Coefficients reported are from regressions of the first difference in the log of native wages at the indicated percentiles of the distribution of native wages on the change in foreign-born population relative to the local initial population. Robust standard errors clustered by local authority in parentheses. Regressions include year and local authority fixed effects. *** significant at 1% ** significant at 5% * significant at 10%
Table 9. Immigration and wage distribution of the local population
(1) (2) (3) (4) Excess fraction in
wage group Composition effect Selectivity of
immigrants Selectivity of
natives UK
qtiqt p ) ( UKqtiqtit qqf ( UK
qtUK
qtit pqf ) )(1( UKqtiqtit ppf )
Quartile 1 0.204*** 0.042*** 0.033 0.130*** (0.044) (0.008) (0.027) (0.041) R-squared 0.825 0.647 0.606 0.798 Quartile 2 -0.054 -0.016*** -0.033 -0.005 (0.046) (0.002) (0.025) (0.041) R-squared 0.666 0.825 0.415 0.616 Quartile 3 -0.066 -0.024*** 0.004 -0.045 (0.048) (0.004) (0.022) (0.053) R-squared 0.411 0.744 0.352 0.365 Quartile 4 -0.085** -0.001 -0.004 -0.080 (0.043) (0.005) (0.041) (0.059) R-squared 0.910 0.602 0.727 0.888 Observations 1321 1321 1321 1321
Notes: Coefficients reported are from regressions of the variable indicated in the column heading for each quartile of the wage distribution on the share of immigrants in the local population. Robust standard errors clustered by local authority in parentheses. Regressions include year and local authority fixed effects. *** significant at 1% ** significant at 5% * significant at 10%

Table 10. Native mobility and wage distribution
(1) (2) (3) (4) wage in quartile 1 wage in quartile 2 wage in quartile 3 wage in quartile 4 Moved -0.096* 0.028 0.124** -0.063 (0.055) (0.055) (0.052) (0.061) Observations 86129 86129 86129 86129
Notes: Coefficients reported are from logit regressions for each quartile of the native wage distribution. The dependent variable is an indicator equal to one if the native earns a wage in the indicated quartile of the distribution. The independent variable of interest is an indicator equal to one if the native has moved to a different local authority between consecutive years. Robust standard errors clustered by local authority in parentheses. Regressions include year and local authority fixed effects. *** significant at 1% ** significant at 5% * significant at 10%
Table 11. Immigrant education and the effect of immigration on house prices
∆log house price index (1) (2) (1) (2) (1) (2) (1) (2) Quartile 1 Quartile 2 Quartile 3 Quartile 4 OLS IV OLS IV OLS IV OLS IV ∆FBit/Popit-1 -0.004 0.632 -0.126 -0.880 -0.155 -1.358*** -0.184** -1.784*** (0.124) (1.159) (0.136) (0.601) (0.109) (0.448) (0.071) (0.409) Observations 268 268 282 282 286 286 276 276 R-squared 0.924 0.902 0.895 0.827 0.891 0.742 0.879 0.489
Notes: Coefficients reported are from regressions of first-differences in the log of the house price index on the inflow of immigrants as a share of the initial population. Local authorities are divided into four groups according to the quartiles of the distribution of the share of immigrants with lower education (below GCSE). Separate regressions are estimated for each of these four groups of local authorities. Robust standard errors clustered by local authority in parentheses. Regressions include year and local authority fixed effects and the change in the employment to population ratio. *** significant at 1% ** significant at 5% * significant at 10%

Table 12. Immigrant inflows and annual log house price changes – broad regions, 1996-2009
∆log house price index (1) (2) (3) (4) OLS IV ∆FBit/Popit-1 0.859 1.095* 2.347 -0.338 (0.679) (0.621) (3.094) (2.346) ∆(Employmentit/Populationit) 1.023* 1.036** 0.752 1.297** (0.540) (0.501) (0.680) (0.521) Observations 140 140 140 140 R-squared 0.834 0.850 0.826 0.842 Region fixed effects No Yes No Yes
Notes: Robust standard errors. ∆ indicates first difference. Regressions include year fixed effects. *** significant at 1% ** significant at 5% * significant at 10%
Table 13. First stage regression – broad regions
∆FBit/Popit-1 instrument 0.709** (0.326) Observations 140
Notes: Robust standard errors in parentheses. ∆ indicates first difference. Regressions include year and region fixed effects and the change in the employment to population ratio. The instrument is the change in the predicted foreign-born population relative to the total initial population. It uses the settlement pattern of immigrants in the 1991 Census to predict the number of foreign-born in each region in the current period. *** significant at 1% ** significant at 5% * significant at 10%