imf country report no. 19/134 republic of armenia · molsa ministry of labor and social affairs ....
TRANSCRIPT

© 2019 International Monetary Fund
IMF Country Report No. 19/134
REPUBLIC OF ARMENIA
FISCAL TRANSPARENCY EVALUATION
This Fiscal Transparency evaluation on the Republic of Armenia was prepared by a staff
team of the International Monetary Fund. It is based on the information available at the
time it was completed in January 2019.
Copies of this report are available to the public from
International Monetary Fund • Publication Services
PO Box 92780 • Washington, D.C. 20090
Telephone: (202) 623-7430 • Fax: (202) 623-7201
E-mail: [email protected] Web: http://www.imf.org
Price: $18.00 per printed copy
International Monetary Fund
Washington, D.C.
May 2019


F I S C A L A F F A I R S D E P A R T M E N T
Republic of Armenia Fiscal Transparency Evaluation
Johann Seiwald, Fazeer Sheik Rahim, Viera Karolova, John Zohrab, Vahram Janvelyan, and Eivind Tandberg
January 2019


3
CONTENTS
GLOSSARY _______________________________________________________________________________________ 6
PREFACE _________________________________________________________________________________________ 7
EXECUTIVE SUMMARY __________________________________________________________________________ 8
I. FISCAL REPORTING __________________________________________________________________________ 12 1.1. Coverage of Fiscal Reports __________________________________________________________________ 15 1.2. Frequency and Timeliness of Fiscal Reporting _______________________________________________ 21 1.3. Quality of Fiscal Reports _____________________________________________________________________ 23 1.4. Integrity of Fiscal Reports ____________________________________________________________________ 25 Recommendations _______________________________________________________________________________ 27
II. FISCAL FORECASTING AND BUDGETING _________________________________________________ 31 2.1. Comprehensiveness of Budget Documentation _____________________________________________ 32 2.2. Orderliness __________________________________________________________________________________ 38 2.3 Policy Orientation ____________________________________________________________________________ 39 2.4 Credibility ____________________________________________________________________________________ 44 Recommendations _______________________________________________________________________________ 49
III. FISCAL RISKS _______________________________________________________________________________ 52 3.1. Risk Disclosure and Analysis _________________________________________________________________ 53 3.2. Fiscal Risk Management _____________________________________________________________________ 57 3.3. Fiscal Coordination __________________________________________________________________________ 68 Recommendations _______________________________________________________________________________ 72 BOXES 1.1. Good Practices for Statistical Revisions ______________________________________________________ 25 2.1. Ministry of Labor and Social Affairs Employment Services Program _________________________ 42 2.2. The Swedish Fiscal Policy Council – Effective Despite a Low Budget _________________________ 44 2.3. Forecast Reconciliation ______________________________________________________________________ 48 3.1. Determining a Robust Budget Reserve Framework __________________________________________ 58 FIGURES 1.1. Coverage of Public Sector Institutions in Fiscal Reports _____________________________________ 16 1.2. Public Sector Balance Sheet Coverage in Fiscal Reports, 2016 _______________________________ 19 1.3. Public Sector Gross Liabilities in Selected Countries _________________________________________ 19 1.4. Public Sector Net Worth in Selected Countries ______________________________________________ 20 1.5. Tax Expenditures in Selected Countries ______________________________________________________ 21 1.6. Periodicity and Timeliness of Budgetary Reports by SDDS Subscribers ______________________ 22 1.7. Timeliness of Annual Fiscal Reports in Selected Countries ___________________________________ 22

4
1.8. Stock-flow Adjustment, 2016 ________________________________________________________________ 24 1.9. Net Lending/Borrowing for the General Government as Reported in GFMS 2001 and SNA 2008 ___________________________________________________________________________________ 27 2.1. Composition of Revenue of EBAs ____________________________________________________________ 33 2.2. Own-Source Revenues in Selected Countries ________________________________________________ 33 2.3. Real GDP Forecasts __________________________________________________________________________ 34 2.4. Inflation Forecasts ___________________________________________________________________________ 34 2.5. Forecast Errors for Real GDP by Forecasters _________________________________________________ 34 2.6. Budget Ceiling vs. Ceiling in Same Year MTEF _______________________________________________ 35 2.7. Cross-Country Comparison: Average Medium-Term Fiscal Forecast Error in Selected Countries, 2007–16 ______________________________________________________________________________ 36 2.8. Public Investment in Selected Countries _____________________________________________________ 38 2.9. The Evolution of Fiscal Rules _________________________________________________________________ 40 2.10. Deficits and the Deficit Rules _______________________________________________________________ 41 2.11. Debt and the Debt Rules ___________________________________________________________________ 41 2.12. Forecast Comparison for Real GDP _________________________________________________________ 45 2.13. Revisions to Budget (excluding EBAs) ______________________________________________________ 46 2.14. Spending Authorized Outside of the Budget Law __________________________________________ 46 2.15. Average Number of Supplementary Budgets in Selected Countries ________________________ 47 3.1. Cross-Country Comparison: Volatility of Nominal GDP, Exchange Rate and Government Revenue in Selected Countries ___________________________________________________________________ 54 3.2. Factors Behind the Change in Public Sector Debt ____________________________________________ 55 3.3. Macro-Sensitivity Analysis of Public Debt ____________________________________________________ 55 3.4. Projected Health Care Costs in Selected Countries __________________________________________ 57 3.5. Projected Pension Costs in Selected Countries ______________________________________________ 57 3.6. Cumulative Use of Reserve Fund ____________________________________________________________ 58 3.7. Reserves - Large vs. Small Spending Items __________________________________________________ 58 3.8. Exchange Rate Volatility and Foreign Exchange Denominated Debt in Selected Countries __ 59 3.9. Government Guarantees in Selected Countries (2014) _______________________________________ 61 3.10. PPP Capital Stock in Selected Countries ____________________________________________________ 62 3.11. Cross Country Comparison: Non-equity Liabilities of the Financial Sector in Selected Countries ________________________________________________________________________________________ 65 3.12. Banking Stability Map ______________________________________________________________________ 65 3.13. NPLs in Market Segments __________________________________________________________________ 65 3.14. Average Annual Loss (AAL) and Probable Maximum Loss (PML) from Natural Disasters in Selected Countries _______________________________________________________________________________ 68 3.15. Size and Self-Reliance of Sub-National Governments in Selected Countries________________ 69 3.16. Profits of Public Corporations (2016) _______________________________________________________ 71 3.17. Government Support to Public Corporations _______________________________________________ 71 3.18. Liabilities of Armenian Public Corporations ________________________________________________ 71 3.19. Liabilities of Public Corporations in Selected Countries _____________________________________ 71

5
TABLES 0.1. Summary Assessment Against the Fiscal Transparency Code ________________________________ 11 0.2. Public Sector Financial Overview, 2016 ______________________________________________________ 12 1.1. List of Fiscal Reports _________________________________________________________________________ 14 1.2. Public Sector Institutions and Finances, 2016 ________________________________________________ 15 1.3. Spending by Economic Type, including and excluding SNCOs _______________________________ 23 1.4. Summary Evaluation: Fiscal Reporting _______________________________________________________ 30 2.1. Major Laws Related to Budgeting ___________________________________________________________ 32 2.2. Reports Related to Budgeting _______________________________________________________________ 32 2.3. Dates for Draft Budget Submission and Approval 2014 – 18 ________________________________ 39 2.4. Summary Evaluation: Fiscal Forecasting and Budgeting _____________________________________ 51 3.1. Reports Related to Fiscal Risks _______________________________________________________________ 53 3.2. Specific Fiscal Risks __________________________________________________________________________ 56 3.3. Financial Assets and Liabilities Central Government _________________________________________ 60 3.4. Current PPP Contracts _______________________________________________________________________ 62 3.5. Financial Indicators for the Financial Sector__________________________________________________ 64 3.6. Summary Evaluation: Fiscal Risks ____________________________________________________________ 74 APPENDICES I. Government Fiscal Transparency Action Plan (2018–21) _______________________________________ 75 II. Technical Note on Table 0.2 ___________________________________________________________________ 83 III. Estimation of Specific Fiscal Risks _____________________________________________________________ 87

6
GLOSSARY ABL Annual Budget Law ADS Armenia Development Strategy AMD Armenian Dram APSAS Armenian Public Sector Accounting Standards BSL Budget System Law CBA Central Bank of Armenia CJSC Closed Joint Stock Company CoA Chamber of Audit CoC Chamber of Control COFOG Classification of Functions of Government DEG Deutsche Investitions-und Entwicklungsgesellschaft DMOSB Department for the Management of Obligations to the State Budget DSA Debt Sustainability Report EBRD European Bank of Reconstruction and Development EIB European Investment Bank EITI Extractive Industries Transparency Initiative FAD Fiscal Affairs Department FRAD Fiscal Risk Assessment Division FRS Fiscal Risk Statement FTC Fiscal Transparency Code FTE Fiscal Transparency Evaluation GDP Gross Domestic Product GFSM 2001 Government Finance Statistics Manual 2001 GIZ Gesellschaft für Internationale Zusammenarbeit INTOSAI International Organization of State Audit Institutions IPSAS International Public Sector Accrual Standard ISA International Standards of Audit LPD Law on Public Debt MoF Ministry of Finance MoLSA Ministry of Labor and Social Affairs MNCO Municipal Non-Commercial Organizations MTEF Medium-Term Expenditure Framework NPL Non-Performing loans NSS National Statistics Services PFM Public Financial Management PPP Public-Private Partnership SNA Standards of National Accounts SNCO State Non-Commercial Organizations SPMD State Property Management Department TSA Treasury State Account UNISDR United Nations Office for Disaster Risk Reduction

7
PREFACE A technical mission from the Fiscal Affairs Department (FAD) of the International Monetary Fund (IMF) visited Yerevan, Armenia during the period March 28-April 10, 2018 to conduct a Fiscal Transparency Evaluation (FTE). The mission was led by Mr. Johann Seiwald (FAD), and consisted of Mr. Fazeer Sheik Rahim (FAD), Ms. Viera Karolova (STA), Mr. John Zohrab (Regional Advisor), Mr. Vahram Janvelyan (local IMF Office), and Mr. Eivind Tandberg (short-term expert). The mission met with Mr. Vardan Aramyan, Minister of Finance, Mr. Atom Janjughazyan, First Deputy Minister; and Mr. Armen Hayrapetyan, Deputy Minister; and other senior officials from the Ministry of Finance, including the Macroeconomic Policy Department; the Budget Block; the Department for Financial Planning of Budget Expenditures; the Fiscal Risk Assessment Division (FRAD); the Department for Monitoring Obligations to the State Budget (DMOSB); the Budget Execution Reporting Department; the Public Debt Management Department; and the Public Sector Accounting Methodology and Reporting Monitoring Department. The mission also met with: Mr. G. Minasyan, Committee Chair, Financial-Credit and Budgetary Affairs, Parliamentary office/committee; the Chamber of Control; the Ministry of Labor and Social Affairs (MoLSA); the Department of Financial System Stability and Development, the Central Bank of Armenia (CBA); the Ministry of Energy and Natural Resources; the State Property Management Department; the National Statistics Service (NSS); the State Revenue Committee; the Department of Investment Attraction and Coordination; and the Ministry of Economy. The mission briefed representatives from the World Bank, the Gesellschaft für Internationale Zusammenarbeit (GIZ), Asian Development Bank (ADB), and USAID on the findings and recommendations of the mission. The mission would like to express its appreciation for the open discussions and courtesy extended by the authorities, in particular Mr. Eduard Hakobyan for his support throughout the mission. The mission also thanks Ms. Yulia Ustyugova, IMF Resident Representative in Armenia; and Resident Representative Office staff members, in particular Ms. Marina Aleksanyan, office manager, for their substantive input into the work of the mission and much appreciated logistical support. The mission would also like to express its appreciation to Mr. Khachatur Adumyan and Ms. Lilit Simonyan for their excellent interpretation and translation services.

8
EXECUTIVE SUMMARY Armenia’s fiscal transparency practices have benefitted from public financial management reforms over the last decade, and several planned reforms will bring further progress. Fiscal forecasts and budgets have become more forward looking and policy oriented, with the introduction of a medium-term expenditure framework (MTEF), improved fiscal objectives, and a performance budgeting system. Fiscal risk disclosure, though fragmented, has gradually improved, in particular, in macrofiscal risk assessment, and a PPP law is being drafted. The accrual accounting reform will significantly improve the coverage and quality of the budget execution reports and fiscal statistics that already provide timely and frequent information about the financial position of the government.
Many elements of sound fiscal transparency practices are therefore in place. The report presents the assessment of fiscal transparency practices against the IMF’s Fiscal Transparency Code (FTC). Armenia meets the standard of good or advanced practice on 16 of the 36 principles, and of basic practice on a further 14 principles (Table 0.1). Armenia’s fiscal transparency practices have strengths and weaknesses in all areas of FTC: fiscal reporting, fiscal forecasting and budgeting, and fiscal risk disclosure and management. Some of the main strengths are:
• Publication of a monthly budget execution report within a month comprising multipleclassifications, and financial statistics within 4 months for general government;
• The presentation of a medium-term expenditure framework and annual budget, withcomprehensive macro-economic forecasts, fiscal objectives, and performance information,submitted to parliament in a timely manner in accordance with provisions of the BudgetSystem Law;
• Analysis of the impact of alternative macroeconomic scenarios of public finances and a fiscalrisk disclosure on specific fiscal risks in the different documents; and
• Semiannual monitoring reports on the financial performance of public corporations provideaggregate and company-level data for most public corporations, and individual transfersbetween government and public corporations are disclosed in budget documents. SOEs arean important area of fiscal risks given that liabilities (15 percent of GDP) are high andprofitability of the sector is weak.
At the same time, the evaluation highlights a number of areas where Armenia’s fiscal transparency practices could be further improved:
• No individual fiscal report provides a complete picture of the general government activity,and a number of loss-making public corporations (representing about 2 percent of GDP) maylikely have to be reclassified into the general government sector but currently nomarket/non-market test is undertaken.
9
• Differences between fiscal balances reported in the statistical reports based on the GFSM 2014 and SNA 2008 are sizeable at 2.5 percent and deviations are not explained.
• The recent changes to the fiscal rules framework, which aimed at making them more flexible, require efforts to strengthen credibility and ensure compliance. The Parliamentary Budget Office does not have the function to conduct independent evaluation on compliance of government fiscal forecasts and fiscal policy objectives. The large differences between same year MTEFs and annual budgets (0.6 percent of GDP) are not well explained and properly documented in the form of a reconciliation table.
• Current practices for extensive in-year changes to budget appropriations, can also undermine the credibility of the budget. An average 8.6 percent of expenditure does not undergo explicit legislative approval. This includes spending from extra-budgetary accounts that is not budgeted for, the use of the Government Reserve Fund, and in-year revisions to budget appropriations.
• Information on specific fiscal risks is fragmented, presented in various sections of the MTEF, the annual budget documentation, and in several other documents. While comprehensive risk analysis is published on financial liabilities (65 percent for general government), for financial assets there is no published risk analysis though on-lending, inter-state loans, and budgetary loans (26 percent) are subject to significant risks, in particular valuation risks.
• Risk assessment are only provided for two out of the four public-private partnerships (PPPs) amounting to a capital stock of 10.2 percent of GDP a risk assessment, though important information such as total rights and obligations are missing. A PPP law is under preparation which should guide the management of the many projects planned.
Based on this evaluation, this report provides ten recommendations aimed at further enhancing fiscal transparency in the areas prioritized. Specifically, these are:
1. Expand the institutional coverage of the budget execution to central government, and statistical reports to general government by including non-market public corporations and municipal non-commercial organizations;
2. Publish a balance sheet for central government, and expand its coverage to general government;
3. Enhance consistency, comparability, and integrity of fiscal reporting by providing reconciliation of key fiscal aggregates;
4. Ensure that introduction of the new accounting system improves comprehensiveness, quality, and compatibility of fiscal reports;
5. Strengthen the MTEF and budget documentation by including a statement of compliance to fiscal rules and reconciliation tables for revenue and expenditure in the MTEF and budget message;

10
6. Strengthen independent evaluation by ensuring ex post compliance audit to fiscal rules by the Chamber of Audit; and building technical capacity at the Parliamentary Budget Office, to prepare for the medium-term role of the PBO to assess ex ante compliance in the draft budget;
7. Reduce in-year revisions to the budget by including extra-budgetary accounts in the annual budget; and introduce clear access criteria for the Government Reserve Fund;
8. Provide a consolidated fiscal risk summary (FRS) in the budget documentation, and assign the responsibility for coordinating the FRS to a unit of the MoF;
9. Ensure that the legal framework for PPPs provides for a clear and comprehensive definition of PPPs; and establish a legal limit on accumulated PPP obligations consistent with Armenia’s fiscal rule; and
10. Extend reporting on public corporations to provide a more complete picture of their financial performance, any conflicts of interest, and budgetary impacts.
The implementation of the recommendations will require some effort and the government could benefit from capacity building from IMF and other TA providers. Annex I prioritized and translates the recommendations into an action plan, sequenced over the period 2018–21.
The fiscal transparency evaluation also estimates Armenia’s public sector financial position, in order to provide a more comprehensive view of public finances. It estimates consolidated public sector expenditures of 45.7 percent of GDP, public sector asset holdings and liabilities of around 108.8 and 109.1 percent of GDP, and a public sector net worth of 0.3 percent of GDP in 2016 (Table 0.2). While the government sector deficit and net worth do not differ substantially from the reported central government aggregates, overall public sector activities, numbers are much higher.
The remainder of this report provides a detailed evaluation of Armenia’s fiscal transparency practices against the standards of the FTC, and provides a set of recommendations to address the main weaknesses. It is organized as follows:
• Chapter I evaluates the coverage, timeliness, quality, and integrity of fiscal reporting;
• Chapter II evaluates the comprehensiveness, orderliness, policy orientation, and credibility of fiscal forecasting and budgeting;
• Chapter III evaluates arrangements for disclosure and management of fiscal risks.
Table 0.1 represents a summary of the Armenia’s performance against the FTC; Table 0.2 presents a preliminary and partial estimate of the Armenia public sector financial overview for 2016.

11
Table 0.1. Armenia: Summary Assessment Against the Fiscal Transparency Code
I. Fiscal Reporting II. Fiscal Forecasting & Budgeting
III. Fiscal Risk Analysis & Management
Coverage of Institutions Budget Unity Macroeconomic Risks
Coverage of Stocks Macroeconomic Forecasts Specific Fiscal Risks
Coverage of Flows Medium-term Budget Framework Long-term Fiscal Sustainability
Coverage of Tax Expenditures Investment Projects Budgetary Contingencies Frequency of In-Year Reporting Fiscal Legislation Asset and Liability Management Timeliness of Annual Accounts Timeliness of Budget
Documentation Guarantees Classification Fiscal Policy Objectives Public-Private Partnerships
Internal Consistency Performance Information Financial Sector Historical Revisions Public Participation Natural Resources Statistical Integrity Independent Evaluation Environmental Risks
External Audit Supplementary Budget Subnational Governments Comparability of Fiscal Data Forecast Reconciliation Public Corporations
LEVEL OF
PRACTICE
RATING
Not Met Basic Good Advanced
LEVEL OF
IMPORTANCE
RATING
High Medium Low

12
Table 0.2. Armenia: Public Sector Financial Overview, 2016 (Percent of GDP)
Source: GFSM 2014 report, Armenian authorities (Treasury, MoF’s Debt Department; State Property Management, Department of Shares, Department of Obligations), financial statements of 207 public non-financial corporations, Central Bank including its 10 subsidiaries, Armenia's Development and Investment Corporation, Export Insurance Agency of Armenia, and IMF staff estimates. Notes: Central Government covers consolidated data for the budgetary central government including social security activities, and extra-budgetary units. Central government data include estimated non-financial assets and liabilities from PPPs of 10.2 percent of GDP and estimated explicit military pension liability of 6.1 percent of GDP. Estimated implicit liabilities from the ‘pay as you go’-pension scheme of 51.5 percent of GDP are not included in data on liabilities but are reflected under the memo item “Net financial worth including pension liabilities.” Appendix II provides more details on data sources and methods used.
These estimates attempt to present a broad overview of Armenia’s public sector finances, by complementing data published in the various fiscal reports with IMF staff estimates for the most material data gaps, in reference to the GFSM 2014 framework. GFSM 2014 and the public sector accounting standards are not implemented by all public sector units yet. Given the limitations in data sources and time available for their compilation, this exercise must be considered as an approximate picture of Armenia’s public sector finance.
I. FISCAL REPORTING 1. Fiscal reports should provide a comprehensive, timely, reliable, comparable, and accessible summary of the government’s financial performance, financial position, and cash flows. This chapter assesses the quality of Armenia’s fiscal reporting practices against the standards set by the IMF’s Fiscal Transparency Code for the following dimensions:
• Coverage of public sector institutions, stocks, and flows;
Armenia: Public Sector Financial Overview, 2016 (Percent of GDP) General Government Public corporations
Consoli- dation
Public Sector
Central
Government
Local
Government Consolidation
Gen. Govt. Consolidated
Gen. Govt.
Nonfinancial Financial Central
bank
o / w: State
Budget Transactions
Revenue 23.5 23.1 2.6 -1.2 24.9 3.8 0.0 0.6 -1.2 28.1 Expenditure 28.9 28.5 2.5 -1.2 30.3 5.0 0.0 0.7 -1.2 34.8
Expense 25.6 25.2 2.5 -1.2 27.0 4.0 0.0 0.6 -1.2 30.4 Investment in NFA 3.3 3.3 0.0 0.0 3.3 1.0 0.0 0.1 0.0 4.4
Net operating balance -2.2 -2.2 0.1 0.0 -2.1 -0.2 0.0 -0.1 0.0 -2.3 Net lending/borrowing -5.5 -5.5 0.1 0.0 -5.4 -1.2 0.0 -0.1 0.0 -6.8
Stocks
Assets 60.6 56.8 10.8 0.0 71.4 12.8 0.3 32.3 -14.5 102.3 Nonfinancial 34.2 31.7 10.8 0.0 45.0 9.8 0.0 2.0 0.0 56.8 Financial 26.4 25.2 0.0 0.0 26.4 3.1 0.3 30.3 -14.5 45.5
Liabilities 71.1 68.1 0.0 0.0 71.1 12.8 0.3 32.3 -14.5 101.9 Liabilities, other than
equity 71.1 68.1 0.0 0.0 71.1 8.5 0.2 32.2 -10.0 101.9 Equity 0.0 0.0 0.0 0.0 0.0 4.4 0.1 0.1 -4.5 0.0
Net worth -10.4 -11.3 10.8 0.0 0.3 0.0 0.0 0.0 0.0 0.3 Net financial worth -44.7 -42.9 0.0 0.0 -44.7 -9.8 0.0 -2.0 0.0 -56.5 Net fin.worth incl. pension liabilities -96.2 -94.5 -96.2
-108.0

13
• Frequency and timeliness of reporting;
• Quality, accessibility, and comparability of fiscal reports; and
• Reliability and integrity of reported fiscal data.
2. Armenia has taken substantial steps over the past decade to improve budget execution reporting and fiscal statistics. Some important advancements include the:
• Adoption of the Government Finance Statistics Manual 2001 (GFSM 2001) for the economic classification of the budget in 2008;
• Publication of monthly and quarterly reports on budget execution on a cash basis;
• Adoption of the System of National Accounts (SNA) 2008 and publication of annual national accounts for the general government sector; and
• Launching a new national accounting system at the ministry level based on International Public Sector Accrual Standards (IPSAS) to be completed in 2025.
3. Armenia’s main summary fiscal reports comprise the following:
• Monthly and quarterly budget execution reports produced by the Budget Execution Department of the Treasury. The monthly reports present state budget cash-based outturns for revenue, expenditure, and financing. The quarterly reports provide more detailed data by economic categories of revenue, expenditure, and financing for the state budget and local governments;
• State debt data and bulletins are prepared by the Debt Department of the MoF on a monthly, quarterly, and annual basis. The reports provide details on the state debt by residence, currency, maturity, and type of interest rate;
• Annual budget execution report produced by the Budget Execution Department of the Treasury classification and presents consolidated outturns for cash revenues and expenditures, and financing covering the state budget and local governments. Data on SNCOs, which use an accrual accounting system, will only be consolidated in the budget execution reports once the accounting reform is implemented.
• Fiscal statistics are produced by the MoF’s Debt Department according to the GFSM 2014, and by the National Statistical Service (NSS) according to the SNA 2008 methodology. Both reports cover most of the general government sector. While the non-cash annual SNA based national accounts are published on a regular basis, the cash based GFSM 2014 data are only provided to the IMF and are not published at the national basis.
4. While Armenia reports a large volume of fiscal data, reporting is fragmented and not always publicly available. The most comprehensive reports, budget execution reports and fiscal statistics, cover only flows. Some data on stocks are also available but spread across reports of various central and local government agencies. Reports for state non-commercial

14
organizations (SNCOs) and most public corporations are not published. Data on municipal non-commercial organizations (MNCOs) are only available to local governments.
5. Currently, Armenia does not prepare financial statements for the government sector based on international standards. The Soviet-era standard will continue to be used, until the full implementation of the new accounting system based on accrual IPSAS. Current accounting reports are not presented in the form of financial statements that link revenue and expenditure flows with changes in financial assets and liabilities. The available consolidated balance sheet only reflects a small fraction of the government net worth as only assets and liabilities related to the operational activities of the line ministries are covered.
6. The main fiscal reports produced by Armenia are presented in Table 1.1:
Table 1.1. Armenia: List of Fiscal Reports
REPORT Author COVERAGE ACCOUNTING PUBLICATION
Inst. Flows Stocks Basis Class. Freq. Lag IN-YEAR REPORTS
Monthly Budget Execution Reports
MoF BCG R, E, Fin
… Cash Nat. Monthly 30d
State Budget Indicators MoF BCG R, E, Fin
… Cash Nat.
Monthly 30d
State Debt Data MoF BCG Fin Debt Non-cash
Nat. Monthly 30d
Quarterly Budget Execution Reports
MoF CG; LG R, E, Fin
… Cash
Nat. Quarterl
y 30d
Consolidated Budget MoF CG; LG R, E, Fin
… Cash Nat. Quarterl
y 30d
Local Government Budget
MoF LG R, E, Fin
… Cash Nat. Quarterl
y 30d
State Debt Indicators MoF BCG … Debt
Non-cash
Nat. Quarterly
30d
YEAR-END REPORTS Annual Budget
Execution Report MoF CG; LG
R, E, Fin
… Cash Nat. Annual 4m
Annual Debt Report MoF BCG Debt,
Deposits Non-cash
Nat. Annual 5m
Annual Government Finance Statistics
(not published) MoF
BCG; NSCOs; LG
R, E, Fin
… Cash GFSM 2014
… …
National Accounts NSS BCG; NSCOs; LG
R, E … Non-cash
SNA 2008
Annual 18m
Note: BCG: Budgetary Central Government; CG: Central Government; LG: Local Government; GG: General Government; NFPS: Nonfinancial Public Sector; PS: Public Sector; R: Revenue; E: Expenditure; Fin: Financing; NFA: Nonfinancial Assets; FA: Financial Assets; L: Liabilities.

15
1.1. Coverage of Fiscal Reports
1.1.1. Coverage of Institutions (Basic)
7. Armenia’s public sector comprises at least 3,464 units of various legal forms. The precise number is not known since a comprehensive list of public units doesn’t exist. As shown in Table 1.2 the units are distributed in the following subsectors:
• Central government, which comprises 1,961 units in total, including 66 central government budgetary units1, and 1,895 SNCOs2 which are classified as extra-budgetary funds (EBFs). Social security revenues and expenditure are integrated in the state budget.
• Local government, which comprises at least 1,201 units, including 502 municipalities and several thousands3 of EBFS - MNCOs, of which 699 units conduct some limited commercial activities in addition to non-market activities;
• Public nonfinancial corporations, which comprise around 288 corporations controlled by the central government, of which 241 are joint-stock companies. The number of corporations controlled by local government is not known; and
• Public financial corporations, which comprise 14 units, including the National Central Bank (NCB) and its 10 subsidiaries, and three state corporations controlled by the state (Armenia's Development and Investment Corporation, Deposit Guarantee Fund of Armenia, and Export Insurance Agency of Armenia).
Table 1.2. Armenia: Public Sector Institutions and Finances, 2016 (Percent of GDP, unless otherwise stated)
Source: GFSM 2014 report, Armenian authorities. Financial statements of public corporations (data for Central Bank include its 10 subsidiaries), and IMF staff estimates. Note: Numbers for “Revenue” and “Expenditure” don’t add up due to consolidation of inter-sectoral transactions.
1 The number refers to the General Budget Mangers. 2 SNCOs and MNCOs – are state and municipal non-commercial organizations are typically involved in non-profit activities such as education, research, and culture. 3 Precise number of MNCOs is not available.
Number of entities Revenue Expenditure Balance Intra-PS
expenditureNet
expenditure
Public Sector 3,464 28.1 34.8 -6.8 0.0 34.8General government 3,162 24.9 30.3 -5.4 -1.1 29.2
Central government (consolidated) 1,961 23.5 28.9 -5.5 -2.3 26.7State Budget 66 23.1 28.5 -5.5 -5.2 23.4State Non-Commercial Organizations 1,895 3.3 3.3 0.0 0.0 3.3
Local government (consolidated) 1,201 2.6 2.5 0.1 0.0 2.5Marzes, towns, and villages 502 2.4 2.3 0.1 0.0 2.3Municipal Non-Commercial Organizati 699 0.2 0.2 0.0 0.0 0.2
Nonfinancial public corporations 288 3.8 5.0 -1.2 -0.1 4.9Central Bank 1 0.6 0.7 -0.1 0.0 0.7Other financial public corporations 13 0.0 0.0 0.0 0.0 0.0

16
8. Armenia’s public sector expenditures amount to 34.8 percent of GDP in 2016. Table 1.2 summarizes the distribution of public resources across the different subsectors of the public sector in 2016 and shows that:
• General government net expenditure accounted for 29.2 percent of GDP, of which around 91 percent was spent by the central government and 1 percent through local governments. Expenditures of non-commercial organizations of around 3.5 percent of GDP are almost entirely financed through government transfers;
• Public corporation net expenditure accounted for additional 5.6 percent of GDP, the vast majority of which was spent by nonfinancial corporations.
9. There is no single report that provides complete coverage of either general government or public sector activity. The budget execution reports consolidate budgetary central and local governments, however the activities of EBFs (SNCOs and MNCOs) are not covered. While the annual GFSM 2014 statistical reports present a more comprehensive sector coverage because they also include SNCOs, they do no capture MNCOs whose reports are not published. The NSS compiles and publishes annual SNA 2008 based on national accounts for general government, though the approach applied for sector definition is not fully compliant with international statistical standards.
Figure 1.1. Coverage of Public Sector Institutions in Fiscal Reports (Percent of expenditure at each level)
Current sectorization Including loss-making SOEs in the General Government
Source: Armenian authorities and IMF staff estimates. Note: “Not Reported” refers to expenditures of units not consolidated in summary fiscal (budget execution) reports.
10. Expanding the institutional coverage of Armenia’s fiscal reports to the entire public sector would increase the deficit by 1.3 percent of GDP and would have a material impact

17
on revenue and expenditure. Including SNCOs and MNCOs will add 3.5 percent of GDP to both revenue and expenditure but will not change the deficit. Further expanding the coverage to the public sector by including public corporations, will add 4.4 percent of GDP to revenue and 5.7 percent of GDP to expenditure on an accrual basis, resulting in an overall public sector deficit of 6.8 percent of GDP.
11. A number of loss-making public corporations in Armenia would likely be classified in the general government sector. Out of 199 public corporations monitored by the government, 49 units have cumulated losses (negative retained earnings) of 2.8 percent of GDP. These are mainly corporations in the energy and water sectors and to a lesser extent in transport, defense, sport, and agriculture sectors. Their expenditures amounted to 3.7 percent of GDP (including net investment in non-financial assets of 1.8 percent of GDP) and their deficit to 1.9 percent of GDP in 2016 on an accrual basis. Figure 1.1 illustrates the coverage of government and public sector expenditure based on the current sectorization, and indicates the magnitude of unreported government expenditure if the loss-making corporations were consolidated within the government.4
1.1.2. Coverage of Stocks (Basic)
12. Armenia publishes data on stocks of the state budget deposits and debt. The annual State Debt Report provides comprehensive data on the state debt by residency, currency, maturity, and type of interest rate. It also provides data on the state budget cash deposits as reported in the Treasury State Account (TSA).
13. There is no single report subsector that provides an overview on all types of government assets and liabilities for any public subsector. As explained above, data on most state financial assets and liabilities of 25.2 and 51.8 percent of GDP respectively, are spread across various government agencies and their departments, but no comprehensive statement exists. Adding liabilities related to PPPs and pensions (as described below) will increase state liabilities to 68.1 percent of GDP. Single SNCOs report balance sheet data, but individual data on assets and debt of 3.8 and 2.9 percent of GDP respectively are not aggregated in any report. According to the authorities, the scope of local governments financial assets and liabilities is limited. They do not provide loans and have not incurred any debt due to strict borrowing rules.
4 According to GFSM 2014, public enterprises which do not operate on a market basis should be classified in the general government sector despite of their “commercial” legal status. The presence of losses is one of the important indicators suggesting that the enterprise does not operate on a commercial basis and further examination should be done to confirm if the units should be reclassified into the government sector (e.g., financial results for several preceding years, financial dependency on the government, autonomy of decision).

18
14. Significant gaps are observed in data availability for non-financial assets and liabilities and their valuation:
• Only partial data on the state non-financial assets subject to privatization (2.8 percent of GDP) are available from the State Property Management Department (SPMD);
• Another portion of the state non-financial assets (17.4 percent of GDP) is reported by individual line ministries in their balance sheets,5 mostly assets used for operational activities;
• Data on the main government non-financial assets, such as infrastructure assets, natural resources, historical buildings, land, etc., are not available. A noticeable portion of these assets are deemed to be owned by local governments and operated by MNCOs (land, roads, water walls, pipelines, bridges, and agriculture assets). Ministry of Territorial Administration plans to introduce an inventory of non-financial assets for municipalities.
• Non-financial assets held by SNCOs (0.8 percent of GDP) and public corporations (11.8 percent of GDP) are reported in the financial statements of individual units but an aggregated report is not available.
• Non-financial assets and liabilities related to PPPs contracts (10.2 percent of GDP), explicit liabilities of the military pension scheme (6.1 percent of GDP) and implicit liabilities of the pay-as-you go social security pension scheme (51.5 percent of GDP)6 are not reported by the government.
15. Addressing these gaps would provide a more comprehensive view of the public fiscal stance. As shown in Table 0.1 and Figure 1.2, consolidated public sector asset holdings and liabilities, excluding implicit pension liabilities, are estimated to have been at least 102.3 percent of GDP and 101.9 percent of GDP, respectively, in 2016. Public sector net worth and net financial worth are estimated to have been 0.3 percent of GDP and -56.5 percent of GDP, respectively. Considering the estimated implicit pension liabilities,7 public sector net financial worth will account for –108 percent of GDP. These figures, however, do not reflect the government owned infrastructure assets, land, subsoil assets, and historical buildings as not even indicative data on their value are available to the Armenian government. In addition, the valuation of non-financial assets most probably does not reflect market prices. A proper valuation and adding the missing non-financial assets would likely have a noticeable positive impact on the government and public net worth.
5 The balance sheets are not publicly available. 6 Pension liabilities calculated via extrapolation. More in-depth analysis to be undertaken to also reflect demographic and policy changes. 7 While according to GFSM 2014, implicit liabilities/ obligations for future social security benefits of a pay-as-you-go pension scheme are not explicitly included in the government debt, but they should be, presented as a memorandum item to the balance sheet,

19
Figure 1.2. Public Sector Balance Sheet Coverage in Fiscal Reports, 2016 (percent of GDP)
Source: GFSM 2014 report, Armenian authorities. Financial statements of public corporations, and IMF staff estimates.
16. Armenia’s net worth sits in the mid-range of other countries and gross liabilities are relatively low (Figure 1.3 and 1.4). This in part reflects the fact that Armenia does not have any state-owned banks and does not have a government controlled defined contribution pension scheme.
Figure 1.3. Public Sector Gross Liabilities in Selected Countries (Percent of GDP)
Source: IMF staff estimates, Fiscal Transparency Evaluations (Portugal 2012, Ireland 2012, UK 2013, Finland 2015, Brazil 2016, Tunisia 2015, Romania 2014, Albania 2015, Peru 2015, Philippines 2014, Tanzania 2015, Russia 2014, Turkey 2013, Kenya 2014, Uganda 2016, Georgia 2016, Mozambique 2015, and Guatemala 2016).
-120 -60 0 60 120
NFW incl. implicit pension liab.
Net Financial Worth
Net Worth
Public Sector
Central Bank
Financial Public Corp
Non-Fin Public Corp
GG implicit pension liab.
General Government
Reported
Unreported
Implicit pensionliabilities
Liabilities Assets
0
100
200
300
400
500
Portu
gal
Irela
nd UK
Finl
and
Braz
il
Tuni
sia
Rom
ania
Alba
nia
Peru
Phili
ppin
es
Tanz
ania
Russ
ia
Turk
ey
Arm
enia
Keny
a
Ugan
da
Geor
gia
Moz
ambi
que
Guat
emal
a
General Government Public Enterprises

20
Figure 1.4. Public Sector Net Worth in Selected Countries (percent of GDP)
Source: IMF staff estimates, Fiscal Transparency Evaluations
1.1.3. Coverage of Flows (Basic)
17. Fiscal budget execution reports and GFSM 2014 based statistical reports cover cash revenues, expenditures, and financing, but do not include accrued transactions and other economic flows. The most comprehensive picture of the general government flows is presented in the annual statistical reports for consolidated general government sector. While the GFSM 2014 reports are on a cash basis, the national accounts include a few accrual elements such as consumption of fixed capital.
18. Some government operations are not recorded in line with international standards resulting in underestimating the government deficit. The current national rules do not reflect the economic substance of some transactions as required by international statistical standards. For example, capital injections to loss-making public corporations should be treated as an expenditure and not as an acquisition of shares and equities. Dividends are treated as a revenue in the budget execution reports, but it should only be the case if they are paid out of the profit coming from the operational activities of the corporation and not from revaluation gains or reserves.
19. Recognizing of non-cash transactions not covered in the reports may have a noticeable impact on the general government deficit on an accrual basis. While delayed payments in trade credits and other payables seems to be insignificant, other non-monetary operations that would need to be included will affect government’s fiscal results. For example, inclusion of the capital investments performed through PPPs where the government is bearing most of the associated risks, need to be counted as a government investment in non-financial assets. This will significantly increase the government deficit at the time the construction and other related works are performed. Also, capturing of the net accrual pension entitlements of public military employees will impact the deficit as well as financing.
Portu
gal
UK
Tuni
sia
Irela
nd
Moz
ambi
que
Alba
nia
Guat
emal
a
Keny
a
Rom
ania
Arm
enia
Phili
ppin
es
Geor
gia
Peru
Finl
and
Russ
ia
-200
-100
0
100
200
300

21
1.1.4 Coverage of Tax Expenditures (Good)
20. Armenia publishes regular estimates of the revenue loss from tax in the annual budget documentation. Since 2015, estimated tax expenditures are published in the explanatory note of the annual budget documentation including estimates for the three main taxes, VAT, corporate income tax and personal income tax (70 percent of total taxes). VAT expenditures with around 40 lines of exemptions in the tax code are presented by sectors (e.g. health, education, financial and insurance sectors) and by other broad categories of exemptions, but the breakdown of PIT and CIT expenditures includes only privileges on agriculture, dividends, and VAT thresholds. The State Revenue Committee plans to expand its reporting on individual tax exemptions in 2019.
Figure 1.5. Tax Expenditures in Selected Countries (Percent of GDP)
Source: IMF staff estimates, Fiscal Transparency Evaluations.
21. There is no control on, or budgetary objectives for, the size of tax expenditures -such controls or objectives could help strengthen the revenue base. Legislation does not include a requirement to report tax expenditures nor to assess the quantitative impact of new legislation on tax exemptions. Tax expenditure accounts for almost 7 percent of GDP (Figure 1.5) and one third of total collected taxes and are among the highest compared with other countries. The government plans to reduce the size of tax expenditure. This could be done through a budgetary objective or limit on its size, and reporting on its implementation.
1.2. Frequency and Timeliness of Fiscal Reporting
1.2.1. Frequency of In-Year Fiscal Reporting (Advanced)
22. In-year state budget and local government reports are published monthly, within a month. These budget execution reports present revenues, expenditure, and financing data and are published within 30 days of the end of month. Also, monthly data on the state budget debt are published within a month. Quarterly budget execution reports are published within one month at the end of each quarter. These reports provide more detailed revenue, expenditure, and financing data by economic categories, and expenditure data according to the functional
0
2
4
6
8
10
Portu
gal
Kore
aGe
rman
ySw
itzer
land
Turk
eyN
ethe
rland
sCa
nada
Arge
ntin
aPe
ruFr
ance
Nor
way
Den
mar
kAu
stria
Braz
ilGr
eece
Spai
nM
exic
oPo
land
Urug
uay
Geor
gia
Chile
Dom
inic
an R
ep.
UK (F
Y14/
15)
Arm
enia
(201
8)Un
ited
Stat
esGu
atem
ala
(200
9)Ita
lyAu
stra
lia

22
classification. Armenia is among the half of the countries that publish monthly reports within a month (Figure 1.6).
Figure 1.6. Periodicity and Timeliness of Budgetary Reports by SDDS Subscribers (Percent of Countries)
Periodicity
Timeliness
Source: Special Data Dissemination Standards (SDDS) Database; General Data Dissemination Standards (GDDS) Database (2017)
1.2.2 Timeliness of Annual Financial Statements (Advanced)
23. Annual budget execution reports are published within 4 months of the following year. They are subject to an audit opinion of the Chamber of Audit (Indicator 1.4.2). The annual report provides data for the state and local government and some indicators on the performance of SNCOs based on different classifications (Indicator 1.3.1). The report also presents further details on grants and subsides, comparative tables by sectors, specific projects, detailed information of the government debt and loans, and other details. As explained above, annual financial statements are not yet fully developed. Armenia is among the group of countries that publish their annual fiscal report within 6 months (Figure 1.7). The sectoral national accounts for the general government compiled by the NSS are published with a delay of 18 months.
Figure 1.7. Timeliness of Annual Fiscal Reports in Selected Countries
(Number of countries)
Source: PEFA Scores Data Set (2005–16).
Monthly67%
Quarterly17%
Semi-annually
1%
Annually15% Armenia
1 month or less50%1-6
months40%
6-12 months7%
Over 12 months3%
Armenia
50
24
14
19Six months
Ten months
Fifteen months
More than 15 Months
Armenia

23
1.3. Quality of Fiscal Reports
1.3.1. Classification (Advanced)
24. Fiscal reports provide information on revenue and expenditure by administrative, economic, functional, and program classification in line with international standards. The MoF’s quarterly budget execution reports, covering State Budget entities and extra-budgetary accounts, includes administrative, functional, and economic classification of spending. The annual execution report, which consolidates State Budget entities, extra-budgetary accounts and local governments, extends reporting by programs, defined at the sublevel of functions. Functional classification follows the United Nations’ Classification of Functions of Government (COFOG), while economic classification is in accordance with GFSM 2014. Revenues are aggregated over three types: tax revenues and state duties, official grants, and other income. The same revenue and spending data are published in the NSS fiscal statistics and presented by economic and functional categories.
25. Some current practices limit the usefulness of these reports:
• Actual expenditure from the Government Reserve Fund is classified into an eleventh category alongside the ten COFOG categories, instead of being classified by purpose. This constitutes a non-trivial proportion of spending (2.5 percent of total spending in the past three years) that is not properly classified.
• With the exclusion of SNCOs, the composition of spending by economic type for central government is distorted. Wages and salaries—the SNCOs’ main expenditure items—are paid through subsidies, goods and services, and grants from the state budget, and classified as such. As a result, central government compensation of employees is largely underestimated in these reports (by 47 percent in 2016—see Table 1.3).
1.3.2. Internal Consistency (Basic)
26. Armenia reliably publishes one of the three internal consistency checks of fiscal data required under the Code. It publishes reconciled above-the-line fiscal deficits with below-the-line financing. While data on holdings of state debt by creditors are reported in the monthly debt bulletin and annual debt report, a reconciliation of the debt issued with the stock of debt by
Table 1.3. Armenia: Spending by Economic Type, including and excluding SNCOs (AMD, billion in 2016)
State Budget
Central Government
Compensation of employees 142 270 Use of goods and services 162 136 Interest 98 98 Subsidies 121 61 Grants 158 133 Social benefits 405 407 Other expense 195 198 Net/gross investment in nonfinancial assets
167 167
Total 1,449 1,470
Source: GFS data

24
counterparties based on a security-by-security database or on sectoral national accounts, as envisaged by the FTC, is not available. Importantly, there is no reconciliation available between the net financing and the change in the stock of debt.
27. The absence of a balance sheet makes it difficult to present a comprehensive stock-flow reconciliation. Data on other economic flows, such as revaluations (e.g. due to exchange rates or market prices) and other changes in the volume of assets and liabilities (e.g. changes in the sector coverage) are to be integrated with balance sheets. Figure 1.8. presents the reconciliation of the change in the state debt and the individual elements contributing to the increase in the debt - the deficit and net acquisition of financial assets. While the major part of the debt increase in 2016 can be explained by the financing of the deficit and net acquisition of financial assets, in particular loans, in 2014 and 2015 0.7 and 0.2 percent of GDP, respectively, remain unexplained. The unexplained residuals could result from currency deterioration but may also include other unidentified factors or possible errors.
Figure 1.8. Stock-flow Adjustment, 2016 (Percent of GDP)
Source: GFS and debt data.
1.3.3. Historical Revisions (Not met)
28. Fiscal statistics are not systematically revised to reflect new information. Data based on the GFSM 2001/2014 submitted for the IMF’s Government Finance Statistics Yearbook have never been revised. A major one-off methodological revision was done by the NSS in 2015 to the national accounts when moving from SNA 1993 to SNA 2008 and updated numbers were published in the National Accounts of Armenia Statistical handbook. However, revisions to fiscal statistics to reflect updated source data, and corrections of errors and omissions are not regularly published and do not indicate whether the numbers are provisional, revised, updated, or final. The implementation of some recommendations of this report would result in meaningful revisions to GFS and SNA data, which should be disclosed. Box 1 gives examples for required historical revisions.
-2
0
2
4
6
8
10
2014 2015 2016
Residual
Net acquisition of financial assets
Deficit

25
Box 1.1. Good Practices for Statistical Revisions Revisions are defined broadly as any change in a value of a statistic released to the public by an official national statistical agency (NSS or MoF). The IMF Working Paper “Revisions Policy for Official Statistics: A Matter of Governance” proposes a set of good practices for the revision of macroeconomic data.
While frequent material revisions of statistical data may indicate potential risks in reliability of fiscal data, the absence of revisions indicates a likelihood that data may not be fully compliant with the international statistical methodology and that time series are not consistent.
To provide data aligned with the principles and methodological rules of international standards, statistical revisions are inevitable. Revisions are a routine part of disseminating quality data and are made for various reasons. Therefore, statistical authorities should have explicit and transparent revision policies. Revisions of statistical data should be done due to the following reasons:
• Incorporation of improved and more comprehensive source data. (e.g. preliminary estimates to be replaced by actual data from final or audited accounts, or by more complete or otherwise better reporting by government units).
• Amending the treatment of operations based on new information which became available at a later stage (e.g. to asses if capital injections or dividends should be treated above or below the line based on a new data form financial statements of corporations).
• Adoption of new or revised statistical methodologies (e.g. when moving from GFSM 2001 to GFSM 2014; or incorporation of non-monetary transaction such as acquisition of military equipment via borrowing in kind)
• Correction of errors and omissions in initially reported data.
This practice is followed by large majority of countries. Based on the Fiscal Transparency Evaluations conducted in other countries, only 3 (including Armenia) out of 24 counties, do not revise statistical reports.
1.4. Integrity of Fiscal Reports
1.4.1. Statistical Integrity (Good)
29. Fiscal statistics are compiled by a specific government agency and disseminated in accordance with international standards. Official fiscal statistics are compiled and disseminated by the Statistical Committee on the SNA 2008 basis. The Statistical Committee is a state body under the Government of the Republic of Armenia. The President of the Statistical Committee is appointed by the government of the Republic of Armenia upon nomination by the Prime Minister of the Republic of Armenia for a term of six years. The Law stipulates that statistics compiled by the NSS should follow best statistical practice and meet the principle of objectivity, reliability, accuracy, confidentially with respect to individual data, comparability with international norms and standards, and accessibility of statistical information to public. The website of the NSS provides user-friendly access to the statistical information. The MoF compiles statistical reports based on GFSM 2014 which are not published or reconciled with the national accounts. Capacity constraints, at both the NSS and MoF, may constrain full implementation of international statistical standards.

26
1.4.2. External Audit (Basic)
30. The Chamber of Control (CoC) has published an opinion on the annual budget execution report of the state budget. The opinion is a review of the compliance of the report with financial legislation and includes an assessment of the reliability of some of the financial data. However, it is not a financial audit per se, as it does not include: (i) a complete assessment of the report’s compliance with the relevant cash accounting standards; and (ii) a statement that the report presents a true and fair view of central government’s financial position.
31. Pursuant to a new Audit Law, the Chamber of Audit (CoA) was established in April 2018 to supersede the CoC with a view to strengthening the integrity of Armenia’s public finances. The new Law follows more closely the legal framework for supreme audit institutions recommended by the International Organization of State Audit Institutions (INTOSAI). The CoA will be responsible for conducting financial audits of central government financial statements according to international standards of auditing (ISAs). The independence of the CoA is enshrined in the Constitution as well as in the respective laws. Its independence has been strengthened in the new law, with its annual workplan being determined at its own discretion.
32. The CoA plans to start conducting financial audits according to ISAs for the central government budget execution report in 2018, gradually increasing the coverage. For this purpose, the CoA should review whether the cash accounting standards are sufficiently well defined to enable financial audits according to ISAs, and to the extent they are not, advise the MoF on improvements. It is also piloting financial audits of the separate financial statements of budget institutions in terms of the new IPSAS-based Armenian Public Sector Accounting Standards (APSAS).
1.4.3 Comparability of Fiscal Data (Basic)
33. Budget execution reports are prepared on the same economic basis as the budget and forecasts. The high-level as well as detailed levels of fiscal aggregates are based on the same classification and methodology. Transactions of extra-budgetary accounts are not included in the approved budget, but they are incorporated ex-post in the budget revisions to ensure comparable data with the actuals.
34. The differences between statistical reports based on the GFSM 2014 and SNA 2008 are significant, and no reconciliation is available. In principle, both methodologies should provide consistent data. However, the difference between the general government deficit (net lending/borrowing) figures are on average 0.6 percent of GDP (Figure 1.9). Much of these differences are likely to be explained by differences in the sector coverage, which in the national accounts is based on the type of activity (distinguishing commercial and non-commercial activities), rather than on the institutional units. Further elements impacting the differences are different source data used to compile statistics, and possible accrual elements in the SNA based accounts.

27
Figure 1.9. Net Lending/Borrowing for the General Government as reported in GFSM2001
and SNA 2008 (Percent of GDP)
Source: GFSM 2014 and SNA 2008 data.
Recommendations
Issue: The current fiscal reports provide an incomplete picture on the fiscal performance of general government as not all institutional units are covered in the budget execution and statistical reports. Including all non-market bodies in the reports will provide a more realistic picture on the government performance.
Recommendation 1.1: Expand the institutional coverage of the budget execution and statistical reports.
• Ensure proper sectorization of public entities into the general government sector or public sector by applying the “market/non-market test” (as defined in the GFSM 2014 and SNA 2008);
• Prepare and maintain a comprehensive and up-to-date list of general government units and public corporations;
• Expand consolidated general government statistical reports by including municipal NCOs, and non-market public corporations according to the GFSM 2014 and SNA 2008 methodology; and
• Include state SNCOs in the consolidated central government budget execution reports.
Issue: Fiscal reports do not provide a comprehensive view of government net worth due to the absence of integrated balance sheet data. Fiscal policy can only be done thoroughly with knowledge of government overall wealth, the value and composition of its assets including their quality, and all explicit and implicit obligations.
-6
-4
-2
0
2
4
2012 2013 2014 2015
GFSM 2001/2014 SNA 2008

28
Recommendation 1.2: Publish balance sheet for central government and expand coverage to general government.
• Collect and consolidate fragmented data on the general government assets and liabilities from the SPMD, ministerial balance sheet; Treasury, Public Debt Management, Department of Shares, Department of State Obligations, SNCOs, and other government bodies as relevant;
• Publish a consolidated central government balance sheet (including SNCOs) based on the GFSM 2014 methodology, initially with available information and gradually expand coverage of stocks and institutions to general government; and
• Present a state financial balance sheet covering all financial assets and liabilities and publish in a relevant report or bulletin on a monthly and annual basis.
Issue: The credibility of data on fiscal performance is undermined by unexplained differences in fiscal reports. To provide policy makers and the public with reliable data on public finances, performing regular quality checks via reconciliation of different indicators and datasets, and stocks and flows, is inevitable.
Recommendation 1.3: Enhance consistency, comparability, and integrity of fiscal reporting.
• Compile and publish the following tables which reconcile (i) the change in stocks and related flows by individual categories of financial assets and liabilities; (ii) the deficit/surplus and the change in in debt; and (iii) the differences between the main aggregates based on the GFSM 2014 and SNA 2008 methodology (including an explanatory note).
• Ensure that material government operations, as for example capital injections to loss-making corporations, are properly classified as above the line or, when relevant as below the line transactions, to reflect the economic substance rather than the nationally based legal form.
• Conduct systematic review of fiscal statistics with respect to compliance with international standards, incorporate new information and methodology (e.g. on sectorization) when relevant, and revise time series to ensure their consistency. Publish an accompanying note explaining revisions.
• Assign clear responsibilities on GFS in the Ministry of Finance and ensure adequate capacity.
Issue: Comprehensiveness and quality of fiscal reports will benefit from the new accounting system based on international standards.
Recommendation 1.4: Ensure that implementation of the new accounting system improves comprehensiveness, quality, and compatibility of fiscal reports.
• Enforce IPSAS-based national accounting standards and publish financial statements;
• Integrate cash-based budget execution reports and accrual-based accounting, and ensure reconcilability between the budget execution data, fiscal statistics, and financial statements;
29
• Provide comprehensive balance sheet data covering all general government assets and liabilities integrated with the flow data; and
• Ensure that the accounting information is designed to deliver information according to international statistical standards (GFSM 2014 and SNA 2008), including information on intra and inter public sector flows and stocks and counterpart sectors.

30
Table 1.4. Armenia: Summary Evaluation: Fiscal Reporting Principle Assessment Importance Recs
1.1.1 Coverage of Institutions
Basic: Fiscal reports consolidate most of the central government units and budgetary local government but exclude municipal non-commercial organizations and public corporations.
High: Public corporations with net expenditures of 5.6 % of GDP and non-equity liabilities of 40.9 % of GDP are outside fiscal statistics. A number of loss-making SOEs are likely to fall in the general government sector.
1.1
1.1.2 Coverage of Stocks
Basic: Fiscal reports cover state cash and deposits and debt data. No balance sheet is published.
High: Unreported public sector assets of 82.6 percent of GDP and liabilities of 34.1 percent of GDP.
1.2, 1.4
1.1.3 Coverage of Flows
Basic: Fiscal reports cover cash revenue and expenditure, no accrual information is published.
Medium: Misclassification of capital injections to loss-making SOEs and unreported non-monetary expenditure undermines reliability of the fiscal balances.
1.4
1.1.4 Coverage of
Tax Expenditures
Good: Estimated revenue loss from tax expenditures is published annually by broad sectors and exemption categories, but no limits or objectives
Medium: Tax expenditures of 7 percent of GDP are relatively high, but the MoF has started to reduce them. 2.1
1.2.1 Frequency of
In-Year Reporting
Advanced: In-year budget execution reports are published monthly, within a month.
Low: The government updates the budget at least monthly.
1.2.2
Timeliness of Annual
Financial Statements
Advanced: Annual state budget execution reports are published within 4 months after the reporting period.
Low: Introduction of the new accounting system may delay availability of annual results.
1.3.1 Classification
Advanced: Information on revenue and expenditure by administrative, economic, functional, and program classification provided, in line with international standards.
Medium: 3 percent of spending not classified by purpose and exclusion of SNCOs distorts composition of spending by economic type
1.1
1.3.2 Internal Consistency
Basic: Fiscal reports provide only reconciled above-the-line fiscal deficit with below-the-line financing.
High: Unexplained residuals in stock-flow adjustments up to 0.7 percent of GDP.
1.3
1.3.3 Historical Revisions
Not met: Fiscal statistics are not systematically revised to reflect new information.
Medium: Fiscal statistics do not reflect updated information that may potentially impact the fiscal results.
1.4.1 Statistical Integrity
Good: Fiscal statistics are compiled by the NSS and disseminated in accordance with SDDS.
Medium: Limited capacity may affect quality of statistics.
1.4.2 External Audit
Basic: The CoC has published an opinion on the annual budget execution report, but does not provide an overall assessment regarding true and fair view of the financial position.
Medium: CoA established in April 2018 with strengthened independence and updated methodology.
1.4.3 Comparability of Fiscal Data
Basic: Budget execution reports are prepared on the same economic basis as the budget, but no reconciliation between different reports.
High: Unexplained differences between the fiscal balance based on national accounts and GFSM 2014 vary up to 2.5 percent of GDP.
1.3.

31
II. FISCAL FORECASTING AND BUDGETING 35. This section assesses the quality of fiscal forecasting and budgeting practices relative to standards set by the Code. It focuses on four main areas:
• The comprehensiveness of the budget and associated documentation;
• The orderliness and timeliness of the budget process;
• The policy orientation of budget documentation; and
• The credibility of the fiscal forecasts and budget proposals.
36. Armenia meets good or advanced practices in six out of the 12 indicators, with a well-articulated budget process, underpinned by a comprehensive set of fiscal objectives, and high-quality budget documents. The legal and regulatory framework provides a modern and well-defined framework for budget preparation. The budget proposal is submitted to Parliament 90 days ahead of the budget year and one month before. Fiscal policy is guided by a modern system of fiscal rules, set forth in legislation. Budget documentation contains detailed macroeconomic forecasts that underlie budget planning. Table 2.1 lists the main pieces of legislation guiding budgeting in Armenia, and table 2.2 contains the main publicly available budget documents.
37. In a number of these areas, Armenia’s current practice falls short of the basic practice under the Code. Particular features discussed in this chapter that limit their contribution to budget transparency include:
• Lack of independent evaluation of the government’s fiscal forecasts and compliance with fiscal policy objectives;
• The extensive in-year changes to budget appropriations, without specific parliamentary approval;
• The large differences across successive MTEFs and annual budgets that are not well explained and properly documented; and
• Limited public participation in the budget process, except at the local level.

32
Table 2.1. Armenia: Major Laws Related to Budgeting
Document Role Last major
revision
Budget System Law (BSL) Determines the budget process, defines fiscal policy objectives;
and its execution January 2018
Law on Public Debt (LPD) Guides borrowing; defines state debt January 2018 Annual Budget Law (ABL) Determines budget appropriations Annual
Table 2.2. Armenia: Reports Related to Budgeting
Document Agency Coverage Submitted to Parliament
Publication Date
Medium Term Expenditure
Framework (MTEF) Government State budget institutions For information July
Draft Annual Budget Law
Government CG (exc. extrabudgetary
accounts) For approval October
Budget Message (Explanation to the
Budget) Government
CG (extrabudgetary accounts); SNCOs
For information November
Quarterly Budget Execution Reports
Treasury Central Government; Local
Government For information Quarterly
Annual Budget Execution Reports
Treasury Central Government and Local
Government (annual consolidated only)
For approval Annually
Report on Consolidated Local
Governments Ministry of Finance
Consolidated Local Governments
No Quarterly; Annually
Summary Budget Guide MoF State budget institutions No
December 2017 (1st time)
2.1. Comprehensiveness of Budget Documentation
2.1.1. Budget Unity (Basic)
38. The annual budget documentation provides information on revenue, spending, and financing activities of budgetary central government and SNCOs. The budget documents cover projected revenue, and planned expenditure of state budget institutions, by administrative, functional, economic, and program classification. An annex to the budget presents projected gross revenue (i.e., budget transfers, and own source revenue), and planned spending of SNCOs, aggregated by line ministries.
39. Revenues from extra-budgetary accounts of budgetary entities are not included in the budget. Unlike SNCOs, which are off budget, extra-budgetary accounts are sub-accounts of budget institutions, such as the Police, and the State Revenue Committee, for earmarked non-tax

33
revenues (e.g. fines), external grants, and sales income. Spending from extra-budgetary accounts are not part of the budget but authorized by government decree during the year. In 2018, extra -budgetary accounts amounted to AMD 33.8bn in 2016 - 2.8 percent of total revenue (Figure 2.1). These, together with the SNCOs own-source revenue, represented 4.7 percent of total state revenue (Figure 2.2), which is comparable to peers.
Figure 2.1. Composition of Revenue of EBAs (percent of total EBA revenue, 2016)
Figure 2.2. Own-Source Revenues in Selected Countries
(percent of total CG revenue)
Source: IMF staff estimates.
40. The exclusion of extra-budgetary accounts will complicate the implementation of the current fiscal rules. As part of the revamp of the system of fiscal rules, the Budget System Law has been recently revised and it requires the government to commit to a cap on current expenditure when debt exceeds 50 percent of GDP (indicator 2.3.1). Ex ante expenditure does not include extra-budgetary accounts, while ex-post it does. An ex ante cap on expenditure may be violated ex post, as extra-budgetary revenue and spending materialize. Such violation may only be visible during budget execution. While currently extra-budgetary accounts remain small, this issue may gain more importance if reliance on extra-budgetary accounts were to increase to circumvent the cap on current expenditure.
2.1.2. Macroeconomic Forecasts (Advanced)
41. Budget documentation contains detailed macroeconomic forecasts that underlie budget planning. Three year-ahead forecasts of key macroeconomic variables (such as GDP, and inflation) are provided, their demand and supply determinants, as well as the assumptions on the external and domestic environment underpinning them. The recent performance of these variables, and their impact on fiscal aggregates are also comprehensively discussed. In a first round, forecasts are provided in the Medium-Term Expenditure Framework (MTEF) submitted to Parliament in June. These are updated and presented in the annual budget document.
Tax revenues
4%
External Grants
9%Sale of
goods and services
53%
Penalties and Fines
32%
Other 2%
AMD 33.8bn
0 5 10 15 20
Romania
Austria
Georgia
Russia
Armenia
Albania
Ireland
UK
Portugal
Iceland

34
42. Medium-term forecasts have been optimistic in recent years, but have not substantially differed from those made by external agencies. Between 2001-08, outturns for real GDP have exceeded forecast, while between 2011-2016, real GDP has underperformed (Figure 2.3). The same is true for inflation (Figure 2.4). Over the period 2011-16, real GDP has underperformed compared to the authorities’ forecasts, but this has been the case for forecasts made by other agencies. (Figure 2.5).
Figure 2.3. Real GDP Forecasts (year on year, percentage change)
Figure 2.4. Inflation Forecasts (year on year, percentage change)
Source: Ministry of Finance
Figure 2.5. Forecast Errors for Real GDP by Forecasters (Actual minus projected, average 2011-2016)
Source: Ministry of Finance; IMF data are from the April vintages of the WEO.
2.1.3. Medium-Term Budget Framework (Good)
43. The medium-term budget framework provides medium-term projections by ministries, functions, and programs, but is not fully transparent on the economic
-20
-15
-10
-5
0
5
10
15
20
2001
2003
2005
2007
2009
2011
2013
2015
2017
2019
2021
Actual
Forecasts
-2
0
2
4
6
8
10
2001
2003
2005
2007
2009
2011
2013
2015
2017
2019
2021
Actual
Forecasts
-3.0-2.5-2.0-1.5-1.0-0.50.00.5
One year ahead Two years ahead Three years ahead
Fitch Government IMF

35
classification. Armenia introduced a medium-term expenditure framework (MTEF) in 2003. The annual MTEF document is published in July, three months before the draft budget is presented to Parliament in October. It includes:
• Forecasts for state budget revenues for the next three years, disaggregated by the first level of the economic classification;
• Outturns for state budget revenues, actual for the previous year and estimated for the current year, and in some parts for earlier years, but not disaggregated by the economic classification;
• Forecasts for state budget expenditures for the next three years, disaggregated by the functional, administrative, and program classification, as well as the capital/current distinction of the economic classification; and
• Outturns for state budget expenditures, actual for the previous year, and estimate for the current year, and in some parts for earlier years, disaggregated by the functional classification and in some parts by the capital/current distinction of the economic classification.
44. The deviations across MTEFs and with budget allocations highlight their loose relationship. The annual budget, which is approved less than six months after the MTEF, has differed markedly from the latter in recent years (Figure 2.6). The change in macro-fiscal forecasts during this period may explain part of this deviation. For instance, in 2017 the annual budget had to be tabled on a substantially lower deficit target than the MTEF as debt numbers gradually revealed that the debt brake would have to be applied. However, it is also the result of two weakly related processes, whereby ministries and agencies provide separate bids for the MTEF and the annual budget. Referring the MTEF to the Debt Sustainability Analysis (DSA) would improve consistency of fiscal planning.
Figure 2.6. Budget Ceiling vs. Ceiling in Same Year MTEF (budget minus MTEF, in percent of GDP)
Source: Budget documents
-2.0
-1.0
0.0
1.0
2.0
3.0
4.0
2,012 2,013 2,014 2,015 2,016 2,017 Absoluteaverage
Budget outturn (excluding EBAs) minus approved budgetApproved budget minus same year MTEF

36
45. Fiscal outturns have deviated significantly from the forecasts in the MTEFs over the past decade, although less than for many comparable countries. Expenditure outturns have exceeded what was envisaged in the MTEF, particularly for the second outer year, when it represented around 1 percent of GDP (Figure 2.7a). This has been balanced with the conservative revenue projections (Figure 2.7b). As a result, the MTEF has provided more accurate estimates of the fiscal balance.
Figure 2.7. Cross-Country Comparison: Average Medium-Term Fiscal Forecast Error in Selected Countries, 2007–16
a. Expenditure Forecast Bias – Average Forecast Error (Percent of GDP)
b. Revenue Forecast Bias – Average Forecast Error (percent of GDP)
Source: MoF, IMF staff estimates.
-3-2-10123456
Czec
h Re
p
Esto
nia
Bulg
aria
Lith
uani
a
Latv
ia
Pola
nd
Denm
ark
Rom
ania
Arm
enia
Hun
gary
Slov
enia
Slov
ak R
ep
Cypr
us
Geor
gia
BY BY+1 BY+2
Overspending
Underspending
-5-4-3-2-10123
Pola
nd
Czec
h Re
p
Bulg
aria
Lith
uani
a
Rom
ania
Latv
ia
Esto
nia
Slov
enia
Hun
gary
Slov
ak R
ep
Arm
enia
Geor
gia
BY BY+1 BY+2Pessimistic
Optimistic

37
2.1.4. Investment Projects (Basic)
46. The government’s total multi-annual obligations under investment projects are not disclosed in a comprehensive way, although substantial information is provided, especially in relation to external loans that finance them. All major projects are at present financed by loans from donors. Information on these projects is contained in several publications:
• The MTEF document includes forecasts of externally-financed capital expenditure projects for the following three years, by individual project and ministry, together with donor financing and government’s co-financing;
• The annual budget documentation further details this information;
• The annual and quarterly budget execution reports compare the budgeted amounts with actuals; and
• Two data sheets on the MoF’s website include information on the total value of projects as per loan agreements, actual loan disbursements and undisbursed amounts for individual projects, their deadlines, and their terms; one of the data sheets is on financial indicators of the government’s external loans and credits as of the year end, and the other is on the terms of the government’s external loans and credits as of the year end.
However, none of this information discloses the total obligations from the projects, and undisbursed amounts pursuant to loan agreements are not generally equal to commitments arising from construction contracts.
47. Cost-benefit analyses for major investment projects are not required prior to their approval according to a uniform methodology and are not always published. For donor-financed investment projects, cost-benefit analyses are usually undertaken according to the individual donors’ approved methodologies, but typically not published. There is no requirement for cost-benefit analyses for projects financed from general budget resources.
48. Major investment projects are generally required to be subject to open and competitive tender. Projects financed from general budget resources are subject to the procurement law, which requires competitive and open procurement, but projects financed by donors are exempt from the procurement law because of international agreements. The donors who are financing major projects in Armenia generally require open and competitive tendering.
49. General government investment in Armenia is not particularly high in comparison with other countries, but increased pressure on public investment could arise. General government public investment amounts to 3.3 percent of GDP (Figure 2.8). The authorities are planning to almost double nominal general government capital expenditure over the next four years. Given Armenia’s relatively high state debt of 53.6 percent of GDP in 2017, there is a need to ensure efficiency in public investment as fiscal space is limited.

38
Figure 2.8. Public Investment in Selected Countries (General Government, percent of GDP in 2016)
Source: Armenian authorities for Armenia, OECD for other countries.
50. Efforts are underway to further strengthen public investment management practices in Armenia. A new PPP Law is being drafted, and the government is expected to develop a reform agenda for public investment management in the near future. A Public Investment Management Assessment (PIMA) will be undertaken by the IMF later this year, which will provide recommendations to support this agenda.
2.2. Orderliness
2.2.1. Fiscal Legislation (Advanced)
51. The Budget System law (BSL) regulates the contents of the budget proposal, the budget preparation calendar, and a constitutional law regulates the legislature’s budget amendment rights.8 Article 15 of the BSL contains detailed provisions for the contents of the MTEF document, and article 16 provides similar requirements for the annual budget document. Article 21 gives detailed directions for how the MTEF and budget preparation processes shall be structured. This includes the deadlines for MTEF submission to Parliament (by July 20 each year) and for budget submission (90 days before the budget year). The BSL also regulates the preparation, approval and execution of municipal budgets (articles 27 – 36). The law on parliamentary procedures stipulates that Parliament can propose changes to the draft budget, and that the government must provide a revised budget proposal containing the changes that they accept. Parliament must accept or reject the revised budget in its totality, it is not possible to vote on individual items.
52. The legal and regulatory framework provides a transparent framework for budget preparation. The BSL was adopted in 1997 and has been amended regularly, most recently in 8 Law No. 137 of June 1997, with subsequent amendments.
0
2
4
6
8
Irela
ndPo
rtuga
lGe
rman
yIta
lySp
ain UK
Icel
and
Switz
erla
ndAu
stria
Aust
ralia
Japa
nAr
men
iaFr
ance
Net
herla
nds
Denm
ark
NZ
Luxe
mbo
urg
Cana
daFi
nlan
dSw
eden
Pola
ndLa
tvia
Esto
nia
Hun
gary
Kore
aSl
ovak
iaN
orw
ayGr
eece
Slov
enia

39
2017, to reflect innovations and improvements in the budget process. The BSL is supported by a series of annual decrees and regulations, which provide further guidance on the budget process. Each year, the Government issues a decree providing a detailed program and timetable for the MTEF and budget preparation process.9 Following budget approval, another decree is issued to regulate the budget execution process.10 This decree provides a quarterly breakdown of budget allocations and gives further directions for budgetary amendments, including for transactions through the extrabudgetary accounts of ministries and agencies.
2.2.2. Timeliness of Budget Documents (Good)
53. The budget proposal is submitted to Parliament 90 days before the budget year and approved by early December. The deadline for budget submission is prescribed in the BSL and is always complied with, according to the Ministry of Finance. Parliament has ample time for budget deliberations and budget approval is generally well before the budget year. Table 2.3 demonstrates that over the last five years the annual budgets have been submitted in time and approved before the end of the financial year.
Table 2.3. Armenia: Dates for Draft Budget Submission and Approval 2014 –18
Budget year Date of budget submission Date of budget approval Draft State budget 2014 October 2, 2013 December 12, 2013
Draft State budget 2015 October 2, 2014 December 4, 2014
Draft State budget 2016 October 2, 2015 December 9, 2015
Draft State budget 2017 September 30, 2016 December 8, 2016
Draft State budget 2018 October 2, 2017 December 8, 2017
Source: Ministry of Finance
2.3 Policy Orientation
2.3.1. Fiscal Policy Objectives (Good)
54. Fiscal policy is currently guided by an upgraded set of fiscal rules, as set in the Budget System Law:
• The state deficit proposed for the budget year (t+1) cannot exceed 7.5 percent of GDP envisaged in the coming year budget (t+1) ;
• If state debt exceeds 40 percent of GDP, capital expenditures (t+1) should not be below the level of planned state budget deficit;
9 See Decree No. 1559 of December 29, 2017 On starting the 2019 Budget process in the Republic of Armenia. 10 See Decree No. 1717 of December 28, 2017 On measures ensuring the execution of the 2018 state budget of the Republic of Armenia.

40
• If state debt is between 50 and 60 percent of GDP, the above still applies, and, in addition, the growth rate of primary current expenditure is capped by the historical (average of the last 7 years) growth rate of GDP;
• If state debt exceeds 60 percent of GDP, the government must, in addition to the above (but the growth rate of primary current expenditure will be capped at 0.5 percent lower of the average growth rate of GDP), total current expenditure cannot exceed the total amount of tax revenues for the upcoming year;
• When state debt exceeds 50 percent of GDP, the government is also required to present a corrective action plan in the MTEF to bring debt below 50 percent of GDP within 5 years; and
• When state debt exceeds 60 percent of GDP, the government must submit a program of measures to the National Assembly to bring debt below 60 percent within 5 years.
An escape clause in the Budget System Law allows the government to suspend the set of measures prescribed above in exceptional cases such as disasters, war, and negative economic shocks. This does not apply to the deficit limit of 7.5 percent of GDP.
Figure 2.9. The Evolution of Fiscal Rules
Source: Relevant legislation.
55. These rules have evolved over time. The timeline in Figure 2.9 summarizes the changes. A debt rule was first introduced in the Law on Public Debt (LPD) in 2008 limiting public debt to 50 percent of GDP – no further debt could be issued once this limit is reached. At the same time, a deficit limit of 5 percent of GDP was introduced in the BSL. In 2009, these laws were amended to increase the deficit limit to 7.5 percent of GDP, and the debt ceiling to 60 percent of
2002- 5% deficit
ceiling
2009- Debt ceiling
increased to 60%- 50% debt brake
introduced, with 3% deficit correction
mechanism
2008- Deficit ceiling increased to
7.5%
2015- Definition of
state debt changed to
exclude central bank debt
2018- Automatic correction at 50% and 60% debt removed. Government to present an corrective
action plan instead- Escape clause
introduced- Cap on expenditure to
be set by gvt decree

41
GDP, and introduce a debt brake of 50 percent, that requires the deficit not to exceed 3 percent of GDP. In 2015, the definition of debt in the debt rules was changed from state debt (government and the central bank debt) to government debt. In 2018, the debt and deficit rules were changed as described in the previous paragraph, and an escape clause was added.
56. The deficit rule has not been binding in recent years, but the debt brake was applied in 2017 (Figures 2.10 and 2.11). Since the deficit ceiling was increased from 5 to 7.5 percent of GDP in 2009 in response to the Global Financial Crisis, it has since not been binding. The lower ceilings set within consecutive IMF programs has instead provided guidance to fiscal policy. Following the economic shock in 2014, debt rose above 50 percent of GDP, and the government was required to comply with the 3 percent deficit correction mechanism in preparing the 2017 budget. Debt is still above 50 percent of GDP, but the new fiscal rules framework adopted at the end of 2017 no longer requires the 3 percent deficit correction. The government is however expected to present a corrective action plan in the 2019-2021 MTEF, and set a cap on current spending by decree.
Figure 2.10. Deficits and the Deficit Rules (in percent of GDP)
Figure 2.11. Debt and the Debt Rules (in percent of GDP)
Source: World Economic Outlook database.
57. The recent amendments aim at making the rules more flexible, while maintaining their credibility. The debt rules now contain an escape clause to allow the government to suspend their application in exceptional circumstances. In an effort to maintain the credibility of the rules-based framework, and following IMF advice, the authorities decided to keep the numerical limits unchanged, and complement them with an additional constraint at 40 percent. However, the 50 percent debt brake no longer requires an automatic adjustment and the 60 percent debt ceiling does not make new debt null and void.
58. Increased flexibility requires enhanced transparency. To be credible, the corrective action plan in the MTEF needs to be tightly linked with the budget, and consistent over time (see indicator 2.1.3). Systematically reconciling the MTEF with the budget, and the successive MTEFs
-10
-8
-6
-4
-2
0
2002
2003
2004
2005
2006
2007
2008
2009
2010
2011
2012
2013
2014
2015
2016
2017
Deficit Deficit Rule
0
10
20
30
40
50
60
70
80
2002
2003
2004
2005
2006
2007
2008
2009
2010
2011
2012
2013
2014
2015
2016
2017
Debt Debt Brake Debt Ceiling

42
would enhance credibility (see indicator 2.4.3). A comparison of government’s forecasts with other forecasters’ will also show a commitment to transparency, and can pave the way for better and more credible forecasts (see indicator 2.4.1).
59. Implementation of the rules will require strong external scrutiny. 11 Ex-ante scrutiny on fiscal projections and compliance to fiscal rules can be provided by an independent fiscal institution, such as the Parliamentary Budget Office, once it is granted with relevant functions and builds sufficient capacity. Ex-post verification of compliance is equally important. This can be provided by the Chamber of Audit, which has, as per the 2015 Constitution, the mandate to perform external audit on the use of state funds covered in the Annual Budget Law. Inclusion of the government fiscal objectives, including the corrective action plan, in the Annual Budget Law will give it the required mandate to undertake ex-post compliance.
2.3.2. Performance Information (Advanced)
60. The state budget documentation includes ex ante and ex post performance information for all programs and their sub-programs. A program classification has been in use since 2008 for budget presentation and reporting. An annex of the budget message has detailed information on objectives, outputs, and outcomes for all programs and sub-programs. All programs have outcome descriptions and about half have some outcome indicators. Quantitative indicators are used comprehensively for outputs. The annual budget execution report includes a detailed discussion on performance against the targets and give reasons for the deviations. Box 2.1 shows an example of a current program of the Ministry of Labor and Social Affairs, which has 16 sub-programs, and the description in the 2018 budget of one of its sub-programs.
Box 2.1 Ministry of Labor and Social Affairs Employment Services Program
Program Outcome Description - Unemployment rate reduced; sustainable employment provided; temporary employment indicator
Sub-program Name - Providing support to job-seeking owners of agricultural land by promoting seasonal employment
Non-financial Indicators Quantitative: cumulative number of programs: Q1: 270; Q2: 1,100; Q3: 2,200; year: 2,710 Qualitative: compliance of programs and beneficiaries with selection criteria defined by legislation: year 100% Timeliness: average duration of program implementation: year up to 180 days Financial indicators (AMD million) Q1: 13.6; Q2: 55.5; Q3: 111.0; Q4: 13.699
Source: Budget documentation.
11 The IMF technical report entitled ”Armenia: Upgrading Fiscal Rules,” (Dabla-Norris et al, June 2017) discusses this issue in more detail.

43
61. Reforms to improve the quality and presentation of performance information will be implemented for the 2019 state budget.12 These will be associated with the introduction of appropriation by programs, replacing the current appropriations of a combination of administrative unit, function, and economic item. The 2019 budget documentation will also include quantitative outcome and output indicators in the annex to the budget message. The introduction of appropriation by programs will give additional stimulus to improve the performance budgeting system in the near future, including potentially a more homogenous presentation of programs and subprograms with improved, aligned performance indicators, more detailed information by adding a third level to the current program classification, and a more transparent link of outcome information to appropriations.
2.3.3. Public participation (Basic)
62. Armenia has recently published a short document entitled the budget guide. It includes a description of the budget system and the budget process, as well as a summary of the main budget aggregates and underlying economic indicators. The guide has the merit of being comprehensive, but its readability can be improved. The budget guide is detailed, with useful information on major government initiatives, but does not present detailed information on its practical implication for the lives of typical citizens.
63. The public’s opportunity to participate in budget deliberations is limited, but some new initiatives are taking place at the level of municipalities. The public is able to comment on the draft budget after it is submitted to Parliament through a website.13 However, neither citizens, nor NGOs, and business groups can formally attend parliamentary committee’s hearings, or submit written comments to the various committees on the draft budget. At the local government levels, some initiatives within large municipalities have taken place, such as live broadcasting of local budget discussions, and the allocation of one percent of the local budget directly by citizens, but these remain small in relation to overall spending. International evidence suggests that participatory budgeting can enhance the quality of spending and improve tax compliance,14 which is an issue of particular importance for Armenia.
12 Notably, the elimination of all programs that cross ministries and grouping of all programs under the ministries responsible for the relevant policies, e.g. elimination of the regional bodies of central government (marzes) as first level budget entities responsible for programs. 13 http://www.e-draft.am 14 See Torgler, B. (2005) “Tax morale and Direct Democracy.” European Journal of Political Economy 21, pp. 525 – 531, for a survey. Recent experimental evidence in Russia shows that participatory budgeting can increase local revenue collection, and increase satisfaction levels with public services (“Does Participatory Budgeting Improve Decentralized Public Service Delivery?”, Beurmann et al., IDB Working Paper #547, 2014).

44
2.4 Credibility
2.4.1. Independent Evaluation (Not Met)
64. The government does not publish a comparison of its forecasts with those of independent forecasters and they are not subject to independent evaluation. Neither the MTEF nor the annual budget documentation compare the government’s economic and fiscal forecasts with those of independent institutions. An official statement of the Central Bank of Armenia to Parliament validates the government’s proposed budget, but it does not contain an evaluation of its forecasts.
65. The Budget Office of the Parliament does not evaluate the government’s forecasts and policies, including compliance with the fiscal rule. It has been granted functional independence in 2016, with a mandate to support the Parliament on budgeting issues. It is currently lightly staffed (three technical staff in total), and its main role is to help Parliamentarians understand budget propositions and their implications. Going forward, for the Budget Office to play a role as an independent fiscal watchdog, it will need a stronger mandate and will require capacity building.15 The example of Sweden illustrates how an institution with a limited budget can succeed (Box 2.2).
Box 2.2. The Swedish Fiscal Policy Council – Effective Despite a low Budget The role of the Swedish Fiscal Policy Council (SFPC) is to focus on providing independent evaluation of the Swedish government's fiscal policy. This role complements that of three other independent institutions responsible for producing forecasts, and scrutinizing budget execution. The council’s resources are limited (approximately US$ 1 million in 2011) and is staffed by a handful of part-time staff and consultants.
One of the main tasks of the SFPC is to review the Government’s plan against its fiscal rule, designed in Sweden as a surplus objective, and an expenditure ceiling. The SFPC has offered both favorable and unfavorable assessments in that regard. While in 2012, it endorsed the government’s policy, stating that “fiscal policy pursued in 2011 and 2012 has complied with the current fiscal framework…and there is little risk of expenditures exceeding the expenditure ceiling in the next few years”, in 2013, it declared that “the indicators reported by the government suggest that the surplus target will not be met” and that “the government should present a clear plan for meeting the surplus target during the relevant business cycle.”
The government’s forecast error of the real sector has declined (Table 2.4). While this could be due to a host of other factors, it is in line with the experience of other countries, where the creation of an independent fiscal council has helped reduce some of the bias in projections.
Sweden: Forecast Errors for Real GDP (in percent)
2000-2005 2006-2010 2011-2015 Root mean square error 0.58 1.87 0.47
Source: Case Studies of Fiscal Councils – Functions and Impact, Curristine et al, IMF Policy Paper 2013; Forecast errors were computed from data in the Sweden Convergence Plans 2000-2015 and IMF WEO.
15 The IMF technical report entitled “Armenia: Upgrading Fiscal Rules”, Dabla-Norris et al., June 2017, provides further discussion on how the Budget Office can play a more important role in ensuring compliance to the upgraded set of fiscal rules.
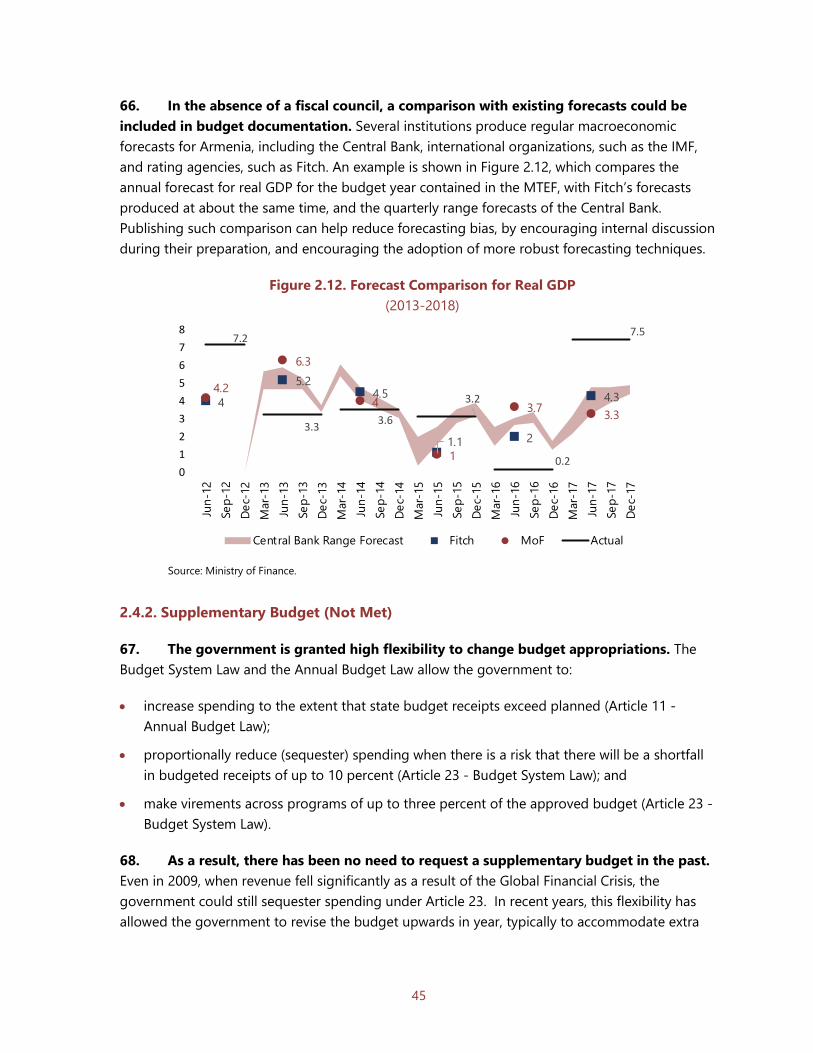
45
66. In the absence of a fiscal council, a comparison with existing forecasts could be included in budget documentation. Several institutions produce regular macroeconomic forecasts for Armenia, including the Central Bank, international organizations, such as the IMF, and rating agencies, such as Fitch. An example is shown in Figure 2.12, which compares the annual forecast for real GDP for the budget year contained in the MTEF, with Fitch’s forecasts produced at about the same time, and the quarterly range forecasts of the Central Bank. Publishing such comparison can help reduce forecasting bias, by encouraging internal discussion during their preparation, and encouraging the adoption of more robust forecasting techniques.
Figure 2.12. Forecast Comparison for Real GDP (2013-2018)
Source: Ministry of Finance.
2.4.2. Supplementary Budget (Not Met)
67. The government is granted high flexibility to change budget appropriations. The Budget System Law and the Annual Budget Law allow the government to:
• increase spending to the extent that state budget receipts exceed planned (Article 11 - Annual Budget Law);
• proportionally reduce (sequester) spending when there is a risk that there will be a shortfall in budgeted receipts of up to 10 percent (Article 23 - Budget System Law); and
• make virements across programs of up to three percent of the approved budget (Article 23 - Budget System Law).
68. As a result, there has been no need to request a supplementary budget in the past. Even in 2009, when revenue fell significantly as a result of the Global Financial Crisis, the government could still sequester spending under Article 23. In recent years, this flexibility has allowed the government to revise the budget upwards in year, typically to accommodate extra
4
5.24.5
1.1 2
4.34.2
6.3
4
1
3.7 3.3
7.2
3.3 3.6
3.2
0.2
7.5
012345678
Jun-
12Se
p-12
Dec-
12M
ar-1
3Ju
n-13
Sep-
13De
c-13
Mar
-14
Jun-
14Se
p-14
Dec-
14M
ar-1
5Ju
n-15
Sep-
15De
c-15
Mar
-16
Jun-
16Se
p-16
Dec-
16M
ar-1
7Ju
n-17
Sep-
17De
c-17
Central Bank Range Forecast Fitch MoF Actual
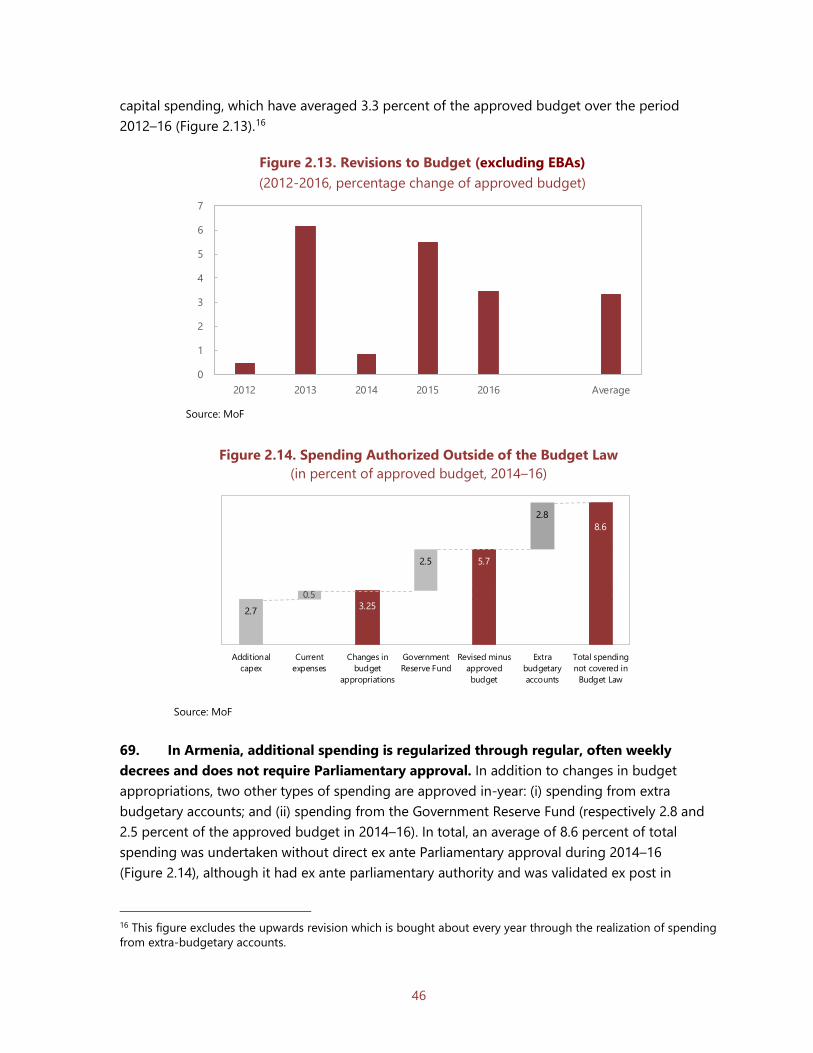
46
capital spending, which have averaged 3.3 percent of the approved budget over the period 2012–16 (Figure 2.13).16
Figure 2.13. Revisions to Budget (excluding EBAs) (2012-2016, percentage change of approved budget)
Source: MoF
Figure 2.14. Spending Authorized Outside of the Budget Law
(in percent of approved budget, 2014–16)
Source: MoF
69. In Armenia, additional spending is regularized through regular, often weekly decrees and does not require Parliamentary approval. In addition to changes in budget appropriations, two other types of spending are approved in-year: (i) spending from extra budgetary accounts; and (ii) spending from the Government Reserve Fund (respectively 2.8 and 2.5 percent of the approved budget in 2014–16). In total, an average of 8.6 percent of total spending was undertaken without direct ex ante Parliamentary approval during 2014–16 (Figure 2.14), although it had ex ante parliamentary authority and was validated ex post in
16 This figure excludes the upwards revision which is bought about every year through the realization of spending from extra-budgetary accounts.
0
1
2
3
4
5
6
7
2012 2013 2014 2015 2016 Average
2.70.5
3.25
2.5 5.7
2.88.6
Additionalcapex
Currentexpenses
Changes inbudget
appropriations
GovernmentReserve Fund
Revised minusapprovedbudget
Extrabudgetaryaccounts
Total spendingnot covered in
Budget Law

47
Parliament’s approval of the annual budget execution report. In many countries, particularly in the OECD, material changes to the budget are made through supplementary budgets, with Parliamentary approval. This occurs on average one to three times a year (Figure 2.15). These supplementary budgets are made necessary when the economic situation requires a change in the fiscal stance, or when new policy initiatives are proposed.
Figure 2.15. Average Number of Supplementary Budgets in Selected Countries (between 2009–11)
Source: OECD 2.4.3. Forecast Reconciliation (Not Met)
70. The budget documentation does not provide a comparison of current fiscal forecasts with previous forecasts. Fiscal forecasts have changed significantly from the budget-year ceiling in MTEF to the annual budget—which is approved six months later—averaging 0.61 percent of GDP in absolute terms between 2012-2017 and have deviated from outturns (net of extrabudgetary accounts) by an average 0.96 percent of GDP over the same period. Neither the MTEF nor the annual budget document forecasts refer to previous macroeconomic and fiscal forecasts, and explain how and why these differences arise.
71. The new fiscal rules require stronger transparency on fiscal forecasts. The corrective mechanism embedded in the debt rules gives flexibility to the government to propose a credible medium-term fiscal path to bring debt down when it exceeds 50 percent of GDP (see section 2.3.1). When it subsequently updates the path, it will need to explain the underlying reasons for doing so. These could be related to changes in economic factors, new policies required since the last update, and other one-off factors that may justify the adjustment. This could be usefully represented in the form of a reconciliation table. Box 2.3 provides an illustration of a reconciliation table that can be included in the next MTEF.17
17 The UK’s Office for Budget Responsibility publishes an excellent annual Forecast evaluation report (FER) each autumn, which examines how its forecasts compare to subsequent outturn data and distills lessons for future forecasts.
0
2
4
6
8
10
12
CHL
GRC
HUN ISR
LUX
MEX TU
RKO
RPO
LCZ
EDE
USV
KDN
K ISL
AUS
PRT
SVN
USA
EST
NZL
GBR
SWE
JPN
AUT
CHE
CAN
FIN
NLD
FRA
BEL
ESP
IRL

48
Box 2.3. Forecast Reconciliation
Table 2.5 shows how a reconciliation table that can be presented in the forthcoming MTEF for 2019-2021:
I. The starting point is the MTEF 2017-2019: the outturn for 2017 can be reconciled with (i) the plan in the MTEF 2017-2019; (ii) the proposed budget for 2017; and (iii) the revised budget for 2017, and the ceilings for 2018 and 2019 can be reconciled with the ceilings for the same year in the MTEF 2018-2020. The differences can be decomposed into policy, economic factors, one-offs, and accounting changes. There will be a difference between actual and plan, but attempts should to be made to minimize this residual.
II. The same process can be applied to reconcile the MTEF 2018-2020 with (i) the approved and revised budget for 2018; (ii) the proposed ceilings for 2019 and 2020 in the MTEF 2019-2021
III. The table can be extended to reconcile the MTEF 2019-2021 with the proposed budget for 2019.
A more granular (bottom-up) decomposition of outturn vs. approved budget can also be presented (see table 2.6).
Indicative Reconciliation Table for Aggregate Expenditure across MTEFs and Annual Budgets (AMD billion)
2017 2018 2019 2020 2021
MTEF 2017-2019 Budget year First outer year Second outer year
Total expenditure x x x
Changes in macro forecasts x x x
Policy measures x x x
One-offs x x x
Approved Budget 2017 x
Extrabudgetary accounts x
In-year policy measures x
Revised Budget 2017 x
Changes in macro economic factors x
Accounting or one-offs x
Residual (unexplained) x
Total variation x x x
MTEF 2018-2020 Actual Budget year First outer year Second outer year
Total expenditure x x x x
Changes in macro forecasts x x x
In-year policy measures x x x
One-offs x x x
Approved Budget 2018 x
Extrabudgetary accounts x
In-year policy measures x
Revised Budget 2018 x
Changes in macro economic factors x
Accounting or one-offs x
Residual (unexplained) x
Total variation x x x
MTEF 2019-2021 Estimated actual Budget year First outer year Second outer year
Total expenditure x x x x
Changes in macro forecasts x
Policy measures x
One-offs x
Draft Budget 2019 x
II.
III.
I.

49
Box 2.3. Forecast Reconciliation (concluded)
Breakdown of Forecast Errors for 2018 (billion AMD)
Source: IMF
Recommendations
Issue: The upgraded fiscal rule framework relies on a credible medium-term expenditure framework to deliver fiscal adjustment. Large revisions of the MTEF and budget to previous plans do not give planning security.
Recommendation 2.1. Strengthen the MTEF and budget documentation by
• Including a statement of compliance to fiscal rules in MTEF and Annual Budget Law, including a justification on the reasons for triggering the escape clause.
• Streamlining the MTEF document and presenting information in the MTEF, corrective action plan, and budget message in a comparable format.
• Including a breakdown of revenue and expenditure by full economic classification in the MTEF.
2017 forecast Outturn Difference of which:
Policy changesEconomic
factors Residual
Taxes and duties x x x x x x
value added tax x x x x x x
profit tax x x x x x x
income tax x x x x x x
excise tax x x x x x x
customs duty x x x x x x
income tax x x x x x x
other taxes and duties x x x x x x
Other income x x x
Official transfers x x x
Expense x x x x x x
wages x x x x x x
goods and services x x x x x x
interest payment x x x x x x
subsidies x x x x x x
transfers x x x x x x
pensions and allowances x x x x x x
other x x x x x xAcquisition of non-financial assets x x x

50
• Presenting MTEF and annual budget as stages of a rolling baseline process by include reconciliation tables for total revenue and expenditure in MTEFs and budget message;
• Report on all tax expenditure.
Issue: The upgraded fiscal rule framework requires enhanced transparency. The granted flexibility to policy makers has to be combined with a mechanism to ensure that the flexibility is implemented in a credible way.
Recommendation 2.2: Strengthen independent evaluation by
• Including comparison of government forecasts with those of other agencies in the MTEF and budget documentation;
• Including a statement of compliance to fiscal rules in the Annual Budget Law to ensure that the Chamber of Audit has a mandate to undertake an ex post compliance audit; and
• Building technical capacity at the Parliamentary Budget Office, to prepare for it to play a role in assessing fiscal forecasts, and the ex-ante compliance to fiscal rules.
Issue: The current practice of regular in-year changes to the budget undermine its credibility and impact the implementation of the new set of fiscal rules. High variation between approved budget, revised budget, and outturns makes it more difficult to monitor and control the expenditure cap.
Recommendation 2.3. Reduce in year revisions to the budget by
• Projecting revenue and spending of extra budgetary accounts and including them in the annual budget;
• Introducing a limit in Article 11 of the Annual Budget Law, which currently allows the government to increase spending when revenues exceed forecasts without any limit; and
• Separate the Government Reserve Fund into a provision for implementing ongoing initiatives which cannot be budgeted for; and a provision for genuine contingencies.

51
Table 2.4. Armenia: Summary Evaluation: Fiscal Forecasting and Budgeting Principle Assessment Importance Rec
2.1.1 Budget Unity Basic: Own revenues (from non-tax and external grants) of extra budgetary accounts and spending are not presented in approved budget.
High: Extra budgetary accounts are 2.8 percent of revenues, and contribute to high in-year revisions.
2.3
2.1.2 Macroeconomic Forecasts
Advanced: Budget documentation includes forecasts of main macro variables, their components and underlying assumptions.
Medium: Forecast have tended to be optimistic in recent years but bias is comparable with other forecasters.
2.1.3 Medium-term Budget
Framework
Good: The MTEF includes outturns for two previous years and revenue and spending projections for next three years by ministry, function and program, but only by high level economic category.
High: There have been large variations between MTEF forecasts and outturns, with an optimistic bias.
2.1
2.1.4 Investment Projects
Basic: Major projects are required to be contracted via open and competitive tender. Government does not disclose total multi-year obligations. Cost benefit analyses not systematically undertaken or published.
High: Plan is to double capital expenditure in next 4 years, under tight fiscal space. A forthcoming PIMA will provide specific recommendations to improve management of public investment.
2.2.1 Fiscal Legislation
Advanced: The Budget System law regulates budget calendar and budget contents. Legislature’s amendment rights are defined in a Constitutional law.
Low: The legal framework provides a well-defined framework for budget preparation.
2.2.2 Timeliness of Budget
Documents
Good: The budget proposal is submitted to Parliament 90 days before the budget year and approved by early December.
Low: Budget submission and approval deadlines have been met in the last 5 years.
2.3.1 Fiscal Policy Objectives
Good: Fiscal rules are precise and time-bound, but have been revised several times (change in 2008: to deficit rule; 2015: of debt definition; 2017: new rules)
High: 50 percent debt brake is being applied since 2017 and a corrective action plan is required.
2.1-2.3
2.3.2 Performance Advanced: Budget documentation reports targets for, and performance against, the outcomes to be achieved in each major government policy area.
Medium: There is scope to improve performance information and its links to appropriations to improve decision making.
2.3.3 Public Participation
Basic: Budget guide with summary of budget aggregates. Participatory initiatives taking place at the level of municipalities.
Low: Budget documents are very comprehensive and include also non-financial program indicators.
2.4.1 Independent Evaluation
Not met: No comparison with independent forecasters is provided. Budget Office does not evaluate government’s forecasts.
High: Fiscal rule revision brings more flexibility, but requires stronger monitoring.
2.2
2.4.2 Supplementary Budget
Not met: Legislation gives government wide mandate to change budgetary allocations. As such, no supplementary budget required.
High: In-year budget revisions without Parliamentary approval of 8.6 percent of spending.
2.3
2.4.3 Forecast Reconciliation
Not met: Differences between fiscal forecasts from one year to the next is not shown and discussed.
Medium: Absolute differences between budget and same year MTEF, and between outturns (excluding EBAs) and budget averaged 0.6 and 0.96 percent of GDP respectively in last five years.
2.1

52
III. FISCAL RISKS 72. Governments should disclose, analyze, and manage risks to the public finances and ensure effective coordination of fiscal decision-making across the public sector. This chapter assesses the quality of Armenia’s fiscal risk analysis, management, and reporting practices against the standards set by three dimensions of the IMF’s Fiscal Transparency Code:
• General arrangements for the disclosure and analysis of fiscal risks;
• The reporting and management of risks arising from specific sources, such as government guarantees, public-private partnerships, and the financial sector; and
• Coordination of fiscal decision-making between central government, local governments, and PCs.
73. Armenia faces several significant fiscal risks that are discussed in different reports, however, their presentation is fragmented. Some fiscal risks are discussed individually, in separate documents or separate parts of the medium-term expenditure framework and budget documents. Other risks are not discussed at all or are only mentioned cursorily. No consolidated summary analysis of key fiscal risks is presented in the budget documentation. The quantification of fiscal risks and valuation of their potential impacts is not comprehensive, and there is no assessment of the potential impacts of different risks materializing simultaneously. Table 3.1 provides an overview of documents related to fiscal risks in Armenia.
74. The Ministry of Finance has established a Fiscal Risk Assessment Division (FRAD, but its mandate is limited. It was established in late 2014 as a division inside the budget block, however, after reorganization of departments within the Ministry of Finance in accordance with the Ministry’s new charter approved in June 2018, its status is unclear. It produces a fiscal risk statement (FRS) twice a year published in the MTEF and annual budget documentation which assesses the likelihood of financial distress of 22 corporations in the energy, transport, and water sectors (including 2 concessionaires).

53
Table 3.1. Armenia: Reports Related to Fiscal Risks Report Related Risks and Issues Author Frequency
Medium-term expenditure framework
Macroeconomic risks to the budget. Risks related to selected public corporations, private regulated companies and PPPs in infrastructure.
Government Annual
Annual budget message/budget explanatory note
Macroeconomic risks to the budget. Risks related to selected public corporations, private companies and PPPs in infrastructure sectors.
Government Annual
Armenia Development Strategy
Risks related to 10-year macroeconomic projections
Government
Last ADS 2014 New ADS under preparation
Debt sustainability analysis
Risks related to public debt Ministry of Finance 2012, 2017
Three-year debt strategy Exchange rate risks to debt; refinancing risks; interest rate risk Ministry of Finance Part of MTEF
Report on public debt
Debt management outturns, changes in risk assessments. Guarantees and on-lending in annexes.
Ministry of Finance Annual
Monthly statistical bulletin Debt indicators, consolidated data on guarantees and on-lending. Ministry of Finance Monthly
Website disclosure on guarantees
Guarantees granted by the government, detailed information guarantees.
Ministry of Finance Annual
Website disclosure on PPPs Summary of PPP contracts
Ministry of Economic Development and Investments
Updated periodically
Financial stability report Risks related to financial sector entities. Central Bank of Armenia Semiannual
Public corporations monitoring report Risks related to public corporations
State property Management Department
Semiannual
3.1. Risk disclosure and Analysis
3.1.1. Macroeconomic risks (Advanced)
75. Budget documents contain sensitivity analysis of macroeconomic and fiscal scenarios. An annex to the MTEF entitled “Budget Macro Risks” discusses and quantifies the

54
impact of alternative scenarios for GDP growth, inflation, exchange rates, imports, and external resource disbursements on revenue, expenditure, and financing. It also includes probabilistic forecasts for GDP and tax revenue growth, prepared from a model that considers sectoral interlinkages and behavioral responses to policy. The forthcoming version will extend this analysis to other key fiscal aggregates. The debt sustainability report, last published in 2012 and 2017, presents a baseline scenario and assesses in different scenarios the impact of shocks to growth, exchange rate, primary deficit and combined shocks on debt sustainability, a more regular publication could be considered. The medium-term debt strategy—published annually— assess various risks to the debt portfolio related to its maturity and composition.
76. In recent years, macroeconomic shocks have contributed to the deterioration in public finances in Armenia. Historically, macroeconomic volatility in Armenia has not been different from peers (Figure 3.1). But in the last decade, two waves of external shocks buffeted the Armenian economy: the global financial crisis in 2008, followed by the slow-down in Russia in 2014, with the ensuing sharp currency depreciation and fall in remittances, brought public debt/GDP from 16 percent in 2008 to 59 percent in 2017. Figure 3.2 identifies the main components of this increase: of the 43 percentage point increase in the debt to GDP ratio from 2008 to 2017, 37 is attributable to the primary deficit, and 13 to the exchange rate depreciation, while strong growth has contributed to reducing the debt to GDP ratio by 12 percentage points, and a remaining 10 percentage point is unexplained. With growth starting to pick up, this ratio is projected to decline after 2019 (Figure 3.3). But downside risks remain. Stochastic projections based on the historical volatilities of the determinants of debt (growth, interest rate, exchange rate and the primary balance) show that there is a non-trivial probability of debt rising beyond 60 percent of GDP.
Figure 3.1. Cross-Country Comparison: Volatility of Nominal GDP, Exchange Rate and Government Revenue in Selected Countries (all nominal variables, in percent, 2006-2016)
Source: IMF World Economic Outlook. Comparators are Commonwealth of Independent States (CIS)
0
10
20
30
40
50
Bela
rus
Turk
men
istan
Azer
baija
n
Mon
golia
Ukra
ine
Kaza
khst
an
Tajik
istan
Russ
ia
Kyrg
yz R
epub
lic
Arm
enia
Geor
gia
Mol
dova
Uzbe
kist
an
GDP Exchange rate Government Revenue

55
Figure 3.2. Factors Behind the Change in Public Sector Debt (Percent of GDP)
Source: Staff calculations.
Figure 3.3. Macro-Sensitivity Analysis of Public Debt
(Percent of GDP)
Source: Staff calculations. The baseline debt projection reflects the latest debt sustainability analysis carried out for Armenia by the IMF in July 2017 (IMF Country Report). The stochastic debt projections are based on the historical variance-covariance matrix of the main determinants of debt (GDP growth, the effective interest rate on debt, the real exchange rate, and the primary balance) during 2006-2016.
3.1.2. Specific fiscal risks (Basic)
77. Information on specific fiscal risks, which are those not directly related to macroeconomic factors, is fragmented. Various sections of the MTEF and the annual budget documents discuss risks associated with
• selected public corporations, regulated private corporations, and two PPPs in three key infrastructure sectors;
• tax performance and disbursement of loans and grants; and
• tax expenditure.
-10
0
10
20
30
2007 2008 2009 2010 2011 2012 2013 2014 2015 2016 2017
Primary deficitReal GDP growthReal interest rateExchange rate depreciationOther debt-creating flowsResidualChange in gross public sector debt
10
30
50
70
90
110
2006 2008 2010 2012 2014 2016 2018 2020 2022
5th-10th10th-25th 25th-50th50th-75th 75th-90th90th-95th Baseline

56
78. There are significant fiscal risks, both explicit and implicit, that go unreported. Table 3.2 below identifies what appear currently to be the most important specific fiscal risks and, where possible, provides indications of their magnitude. The table shows that the aggregate, maximum exposure to explicit fiscal risks may be as high as 70 percent of GDP, and that maximum exposure to implicit risks may be about 125 percent of GDP. Most explicit risks are subject to reporting, but there is no disclosure of implicit risks in government documents. While coordination of disclosure and oversight of fiscal risks is the responsibility of the MoF, managing the risks within the portfolio of a line ministry or agency is their responsibility; this is good international practice on the basis that there are clearly-defined accountabilities for the line ministry or agency.
Table 3.2. Armenia: Specific Fiscal Risks1 Magnitude Measure % GDP Reported
Explicit risks Guarantees Debt guarantees 1.4 Yes
Underwriting of Deposit Guarantee Scheme 5.8 No Promissory note to CBA 1.5 Yes
PPPs Total investment 10.2 Yes Total risk exposure N.A. No
Financial sector Liabilities of FPC except equity (including CBA) 32.4 Yes PCs (exc. CBA) On-lending
Liabilities of public non-financial corporations except equity2
8.5 Yes
Outstanding loans arising from on-lending 9.6
No
Implicit risks Financial sector Liabilities of commercial banks 66 Natural resources Contribution of mineral sector to GDP volatility 2 No Natural disasters Average annual loss 1.3 No
Probable maximum loss earthquake (50 year) 2.6 No Long term risks
Pension costs Unfunded pension liabilities 51.5 No Health care costs Expected increase in annual health care costs in percent
of GDP (2020-2050) 3.7 No
1/ Definitions, estimation methods and sources are provided in Appendix III. 2/ These liabilities include on-lending from the budget and lending from banks that is guaranteed by the government.
3.1.3. Long-term sustainability of public finances (Basic)
79. The government publishes debt projections for the next 20 years and macro-fiscal projections for the next ten years. The debt sustainability report, last published in 2012 and 2017, provides external and public debt projections for 2017–37, and assesses the risk of debt distress over this period. The 2014-25 Armenia Development Strategy (ADS) provides macro-fiscal projections for 10 years.

57
80. Health and pension costs are expected to increase significantly over the next decades, but this is not reported. Based on projected demographic trends, overall health care costs as a share of GDP may increase by 65 percent from 2015 to 2050 and reach a level that is considerably higher than in comparator countries (Figure 3.4). Figure 3.5 indicates a similar, but less dramatic, development in total pension costs (public and private), although the fiscal impact is likely small after the recent reform to Armenia’s pension system. These types of analysis – which the government intends to include in the forthcoming ADS - can support the elaboration of strategies to address and mitigate the risks.
Figure 3.4. Projected Health Care Costs in Selected Countries (in percent of GDP)
Figure 3.5. Projected Pension Costs in Selected Countries
(in percent of GDP)
Source: IMF staff calculations, based on UN demographic projections. 2015 data are from the World Bank.
3.2. Fiscal Risk Management
3.2.1. Budgetary contingencies (Basic)
81. The law requires a budgetary reserve, and reporting on its use, but does not define the access criteria. Article 19 of the BSL requires that a separate expenditure line for the reserve fund not exceeding 5 percent of budgeted total expenditure be appropriated in the annual budget law. It also states that a government decree is required to access the reserve (Article 19), and that the justification of such spending needs to be provided at the end of the year (Article 25). It does not, however, define the purposes for which it can be used.
82. In practice, an appropriate reserve margin is set aside, but is not always used to fund genuine contingencies. The size of the reserve fund averaged 2.5 percent of total budget in recent years. Authorized by decree, its use is evenly spread over the year (Figure 3.6) and reported—but not justified—in the annual budget execution report. More than 90 percent was for items below 500 million AMD, roughly 0.03 percent of total budget (Figure 3.7), which can be deemed absorbable within existing budgetary allocations. In recent years, there were several
0 5 10 15
AzerbaijanTajikistan
KazakhstanLatvia
EstoniaUzbekistan
Russian FederationBelarusUkraine
LithuaniaKyrgyzstan
ArmeniaMoldova
2015
2050
0 10 20 30
KyrgyzstanLatvia
TajikistanKazakhstan
EstoniaLithuania
Russian Fed.ArmeniaBelarus
AzerbaijanUzbekistan
MoldovaUkraine
2015
2050

58
clear cases that could have either been foreseen or delayed. These include the renovation of buildings, the purchase of computer licenses, and spending on ongoing infrastructure projects. Such practice can undermine the ability of the government to respond effectively to large genuine contingencies. Box 3.1 provides examples of good practice on the use of contingency reserves.
Figure 3.6. Cumulative Use of Reserve Fund (percentage use of total, 2014-2016)
Figure 3.7. Reserves - Large vs. Small Spending items
Sources: Budget Execution Reports
Box 3.1. Determining a Robust Budget Reserve Framework
In the course of a year, it is natural for economic, social, environmental, and security challenges to arise. The role of a budget reserve is to ensure the necessary flexibility in budget execution in the face of uncertainty. The size of the reserve and access conditions to it matter. When reserves are too small, they can be inadequate to respond to large events, but when they are too generous, they can create the expectation that funding will be available during the year and, as a result. discourage expenditure prioritization during the budget phase. When access is not limited, the risk is that they are not used for genuine contingencies, particularly if PFM institutions are weak.
Several countries have carefully ring-fenced the use of a contingency reserve. Australia has adopted stringent restrictions on its reserve, which can be used only to deal with unexpected variations in forecast parameters and not to fund new policies. The United Kingdom and South Africa have developed a more flexible approach, that requires be used for events that satisfy the three Us: unforeseeable, unavoidable, and un-absorbable. When they can be foreseen, they should be budgeted for. When they can be avoided, their funding should be deferred for later years. When their fiscal costs are small enough, they should be absorbed within existing budgetary allocations.
Events satisfying the three Us include the repair of infrastructure damaged by disasters, the impact of a depreciation of the domestic currency, and the response to emergency national interventions. Others that do not qualify include the cost overrun of an infrastructure project due to underbudgeting, wage increases, or non-emergency maintenance of public assets.
Finland has created two types of reserves: the first for unexpected spending (true contingencies) and the second to allow spending on-ongoing long-term initiatives, which cannot be well foreseen at the time of budget preparation.
0
0.2
0.4
0.6
0.8
1
Jan Feb Mar Apr May Jun Jul Aug Sep Oct Nov Dec0
50
100
150
200
250
0.00.51.01.52.02.53.03.54.04.5
Large spending items (above AMD 500Mn)
Small spending items (below AMD 500Mn)
Reserve Fund in percent of total budget - right axis

59
3.2.2. Management of assets and liabilities (Basic)
83. All borrowing is authorized by law and public debt management is extensively described and analyzed in different publications. Borrowing is governed by the Law on Public Debt of 2008, and annual borrowing limits are set in the annual budget law. The MoF publishes three-year debt management strategies updated each year, monthly debt bulletins and annual debt management reports, as well as periodic debt sustainability analyses, most recently in 2017. The publications provide detailed information about the government debt portfolio, as well as in-depth risk analysis.
84. Armenian public debt is subject to exchange rate, refinancing, and interest rate risks, of which exchange rate risk is the most important. According to the 2018–20 debt management strategy, 80.7 percent of the debt is in foreign currency (40.5 percent of GDP), reflecting the prevalence of multilateral and bilateral loans in the portfolio (Figure 3.8). Refinancing risk is moderate, with only 6.2 percent of the debt maturing within one year and average time to maturity 9.3 years. However, the redemption of two large Eurobonds in 2020 and 2025 will increase refinancing risks in the coming years. Interest rate risk is also limited, as 87.5 percent of debt is with fixed interest rates. Exchange rate risk is slightly above average of peer countries with an exchange rate volatility.
Figure 3.8. Exchange Rate Volatility and Foreign Exchange Denominated Debt in Selected Countries (2016)
Source: IMF estimates Note: exchange rate volatility is standard deviation/average exchange rate 2000-2015. Euro area in blue.
85. Main financial assets are disclosed in different documents, but there is no published risk analysis for these assets and no comprehensive statement of financial assets and liabilities. Financial assets comprise on-lending of external loans and grants, budgetary lending, inter-state loans (to Nagorno-Karabakh), the government’s cash balance in the TSA and the government’s shares in joint stock companies and other public corporations, as well as its equity in the CBA. The monthly debt bulletin provides summary data on the balances of on-lending, inter-state loans, and budgetary lending. Disbursements related to individual on-lending and budgetary lending operations are disclosed in the annual budgets and in separate decrees, but there is no consolidated statement for these operations. CBA equity and the TSA balance are
05
1015202530354045
0 10 20 30 40Exchange rate volatility
Fore
x GG
deb
t (pe
rcen
t of G
DP) ARM
GEO
HUN
AZB PAK
Eurozone
ROM
TUR
RUS
ISR
UK AUS

60
disclosed in the CBA annual financial statement. Shares in joint-stock companies are disclosed in the annual monitoring report from the SPMD.
86. The government’s financial assets are subject to significant risks, in particular valuation risks. On-lending, inter-state loans, and budgetary loans as well as shares in public corporations are listed at book value. Depending on the borrowers’ abilities to repay, the actual value of these assets may be considerably less; some of them may have zero value. The actual values of these risks are not independent; in addition to the uncertain value of their shares, public corporations are also among the main recipients of government on-lending and budgetary loans. The CBA balance sheet includes an accumulated deficit of 95 billion AMD, largely related to currency operations. In accordance with article 11 of the CBA law, the government has issued promissory notes, currently amounting to 73 billion AMD, to compensate for these losses and ensure that CBA equity remains positive.18
87. The lack of a consolidated report on financial assets and liabilities makes it more difficult to understand and analyze the government’s overall financial position. The financial assets disclosed in different documents are significant compared to the stock of debt, and there may be additional assets that are not disclosed. A consolidated report (“balance sheet”) for government financial assets and liabilities would be an important starting point for further assessment and analysis, although it would not give a complete picture of the government’s financial position. This report would also facilitate reconciliation of financial flows and stocks and enhance the credibility of government reporting. Table 3.3 provides an illustrative compilation of existing information about financial assets and liabilities into a balance sheet.19
Table 3.3. Armenia: Financial Assets and Liabilities Central Government (share of GDP) Assets Liabilities
TSA balance 3,6 Domestic debt 10,8
On-lending external funds 9,4 External debt 45,8
Budgetary loans 0,2 Other liabilities
Inter-state loans 9,3
Shares in JSCs 4,4
CBA equity 0,1
Other assets
Total financial assets 27,1 Total financial liabilities 56,7 Financial net worth -29,6
Sources: MoF monthly debt bulletin 2016, CBA financial statement 2016, SPMD monitoring report 2016.
18 The promissory note is treated as an asset in the computation of CBA equity, but there is no corresponding liability in government accounts. The promissory note is more similar to a guarantee than a capital injection. The true value of CBA’s equity is therefore uncertain. Recognition of the promissory note, either as a government liability, or a reduction in CBA equity, would reduce financial net worth by 85 billion AMD. 19 The data in this table are taken from different government reports and net financial worth is a residual. This number differs from the mission’s estimate of net financial worth in table 0.2, which also contains mission estimates and adjustments.

61
3.2.3. Guarantees (Good)
88. The stock of guarantees is small, at 1.4 percent of GDP, and is disclosed in monthly and annual debt reports. A consolidated report on individual outstanding guarantees and the beneficiaries is provided as an annex to the annual debt report. Most guarantees are issued for loans from development partners to the CBA to fund development loan programs operated by the CBA, directly or through financial intermediaries. At end-2016 these constituted 1.35 percent of GDP. The only domestic loan guarantee at end-2016 was for a loan from a domestic bank to the Agarak Copper-Molybdenum factory, amounting to 0.05 percent of GDP.
89. Guarantees are limited by law and are low compared to many other countries, but there is no assessment of the risk that guarantees are called. The total amount of liabilities guaranteed in the given fiscal year (except for guarantees provided by international treaties) cannot exceed 10 percent of the state budget tax revenues of the previous fiscal year. This guarantee limit is provided in article 11 of the BSL. The aggregate of state guarantees provided and outstanding at a certain date shall not exceed 20 percent of previous year’s GDP. In addition, article 23 in the State Debt Law stipulates that the amount of any state guarantee shall not exceed 20 percent of the entity receiving the guarantee. Decree 380 of June 1998 defines the procedures for guarantee applications, assessment and approval, and each guarantee is issued through a government decree.
Figure 3.9. Government Guarantees in Selected Countries (2014) (Percent of GDP)
Source: Eurostat, staff estimates.
3.2.4. Public-private partnerships (Basic)
90. Considerable risk relevant information is published for two of the three major PPP, but obligations under PPP contracts are not systematically disclosed. For two PPPs, the Veolia water/sewerage and Armenian Railways concessions, the SFR in the 2018 annual budget documentation assessed the concession companies’ recent financial performance, likelihood of financial distress, and the risks of shortfalls in concession fees payable to the government; and reached a conclusion as to the likelihood of government bailouts and fiscal risks materializing.
0
5
10
15
20
25
30
Geor
gia
Slov
akia
Czec
h Re
publ
icBu
lgar
iaLi
thua
nia
Latv
iaAr
men
iaEs
toni
aRo
man
iaCr
oatia
Italy
Net
herla
nds
Fran
cePo
land
Port
ugal
Luxe
mbo
urg
Hun
gary
Unite
d Ki
ngdo
mDe
nmar
kSw
eden
Belg
ium
Slov
enia
Spai
nIre
land
Cypr
usGe
rman
yM
alta
Finl
and
Aust
riaGr
eece

62
However, this disclosure did not include the total rights, obligations, and other exposures under PPP contracts, nor disclosures on two airport concessions. The Ministry of Economic Development and Investments (MoEDI) publishes the size of the investment commitments provided for by PPPs.
91. PPP commitments represent a sizeable proportion of GDP. There are currently four public-private partnerships (PPPs) operating in Armenia (Table 3.4), with a size of the investment commitments of 10.2 percent of GDP (Figure 3.10):
Figure 3.10. PPP Capital Stock in Selected Countries (2014)
Source: IMF public investment database, mission estimates. Data for Armenia for 2016.
Table 3.4. Armenia: Current PPP Contracts
Project Type of PPP Percentage
Private
Total investment
(USD million)
Financial Closure
Year
Contract Period (Years)
Main revenue source
Type of direct
government support
Armenian Railways
Build, rehabilitate, operate and
transfer 100 575 2008
30 + 10
(option) User fees
Revenue subsidy. 30 % specific
service loss.
Zwartnots Airport, Yerevan
Build, rehabilitate, operate, and
transfer 100 294 2001
30 + extension to reach 20 % IRR User fees N/A
Veolia Water/Sewerage Services
Management and lease 100 200 2016 15 User fees N/A
Shirak airport
Rehabilitate, operate and
transfer 100 10 2007 15 User fees N/A Source: World Bank; IRR is Internal Rate of Return.
0 5 10 15
Kyrgyz RepublicIran
UzbekistanKazakhstanAzerbaijan
GeorgiaAlbania
Macedonia, FYRHungary
GreecePakistanBulgariaArmenia
Jordan

63
• The Armenia Railways concession (or South Caucasus Railway), reached financial closure in 2008, with total investments amounting to USD 575 million. This is a build, rehabilitate, operate, and transfer project for 805 kilometers of railroad covering all of Armenia. with a duration of 30 years, with a possible 10-year extension. The government provides a revenue guarantee, equivalent to 30 percent of the losses related to specifically defined services; but also receives a concession fee from the project, equivalent to 2 percent of total revenue. In 2016 government support amounted to 350 million AMD, whereas the concession fee was 377 million AMD.
• In 2001, the government negotiated a concession agreement for Yerevan International airport with Corporacion America from Argentina for 30 years, with a contracted extension to ensure a 20 percent internal rate of return on the project. Corporacion America transferred the concession rights to its affiliate, AIA, which is a special-purpose Armenian company. Total investments under this concession amount to 294 million USD, and were partly financed by loans from ADB (40 million USD), EBRD (60 million USD) and Deutsche Investitions-und Entwicklungsgesellschaft (DEG) (10 million USD).
• In 2016, the Armenian government entered into a 15-year contract with Veolia on lease of water systems and sewage used by several regional water and sewerage companies. The tariffs for water supply and wastewater treatment shall be regulated and approved by the Public Services Regulatory Commission, and Veolia shall pay semi-annual fees, expected to amount to 89.7 billion AMD over the contract period. The project is expected to involve investments for 200 million USD, with loans provided by EBRD, EIB, and KfW. The contract was awarded after competitive bidding among four bidders.
• The Shirak airport concession was negotiated in 2007. The concessionaire is the same as for the Zwartnots airport and this contract was also based on an unsolicited proposal. The 15-year contract involves rehabilitation, operation, and transfer of a regional airport, with expected investments amounting to 10 million USD.
92. Efforts are underway to strengthen the PPP framework, including a draft PPP law in preparation, which would facilitate further PPPs on a sound basis. This is of particular importance as line ministries have already identified further possible PPP projects mainly in health and road sector pending approval of the new government. The key transparency issues in the strengthened PPP framework include: a clear and comprehensive definition of PPPs; the establishment of a database of PPPs; the annual publication of the total rights, obligations, and other exposures under PPP contracts and the expected annual receipts and payments under the contracts; and the establishment of a legal limit on accumulated PPP obligations consistent with Armenia’s fiscal rule.

64
3.2.5. Financial sector (Good)
93. The CBA prepares a semiannual financial stability report with in-depth assessment of financial sector risks. The financial sector is dominated by banks, with 17 commercial banks controlling approximately 90 percent of financial market assets. There is no government ownership in the banking sector. A development bank fully owned by the CBA was recently transformed into an investment fund.
94. Financial indicators of the banking system show an improvement in recent years. The financial sector is relatively small, at 91 percent of GDP in 2017, and well capitalized compared to other countries (Table 3.5). In the CBA’s assessment, the risks remain manageable and do not entail any significant financial stability issues.20 Figure 3.12 provides a banking sector stability map. It shows that at end-2016, capital adequacy and asset quality risks were most important. Figure 3.13 illustrates the issue of asset quality. It describes the share of non-performing loans (NPLs) in different market segments and their contribution to overall NPLs. It shows that in some market segments NPLs are still significant, although they were generally reduced from 2015 to 2016.
Table 3.5. Armenia: Financial Indicators for the Financial Sector
Source: IMF financial soundness indicators (2016)
20 CBA Financial stability report, 2017-1.
Loan Quality ProfitabilityTier 1
Capital to Assets
Capital to Assets
NPLDeposits to Loans
Liquid Assets
Return on Assets
Armenia 20,0 16,2 6,7 115,0 32,5 1,1Austria 13,2 7,4 3,4 85,3 24,8 0,5Georgia 11,7 3,6 8,1 96,3 24,9 3,1Germany 15,7 5,9 n.a 85,0 42,8 0,4Kazakhstan 13,1 10,5 8,0 100,5 21,2 1,6Lithuania 24,3 13,0 5,8 110,9 n.a 1,2Netherlands 16,2 5,6 2,7 n.a 22,8 0,6Russia 8,5 8,9 8,3 76,2 26,5 0,2Slovakia 16,5 11,1 4,9 111,0 34,2 1,3
Capital Liquidity

65
Figure 3.11. Cross Country Comparison: Non-equity Liabilities of the Financial Sector in Selected Countries
(Percent of GDP)
Source: Eurostat, other FTEs, CBA.
Figure 3.12. Banking Stability Map
Figure 3.13. NPLs in Market Segments
Source: CBA financial stability report 2017-1
95. Current government support to the financial sector is limited to guarantees for development loans and is disclosed in debt reports. There are currently no direct government payments to the financial sector and there is no history of such payments. Government guarantees for concessional loans, used to finance development credits from the CBA or financial intermediaries to specific borrowers, is the only government support to the sector. During the banking crisis in 2009, such guarantees were used actively to ensure adequate liquidity to commercial banks. In addition, in 2009 the CBA provided two types of long-term loans in close coordination with the government:
0
200
400
600
800
1000
1200
Geor
gia
Rom
ania
Lith
uani
aAr
men
iaPo
land
Slov
akia
Esto
nia
Hun
gary
Slov
enia
Bulg
aria
Czec
h Re
pLa
tvia
Croa
tiaGr
eece
Italy
Nor
way
Spai
nAu
stria
Portu
gal
Finl
and
Germ
any
Fran
ceSw
eden
Belg
ium
Denm
ark
Cypr
usN
ethe
rland
sUK
Irela
nd
66
• Subordinated loans with five years maturity were provided to the banks, which replenished capital by the matching amount. Ten banks took the subordinated loans in total amount of 30.3 billion AMD.
• A three-year loan of 7.3 billion AMD was provided to banks that acquired a distressed bank.
96. The bank deposit guarantee scheme provides guarantees amounting to 522 billion AMD at end-2016, and the government underwrites this guarantee. The Deposit Guarantee fund of Armenia was established by the CBA in 2005 as a non-profit legal entity. Its operations are regulated by law.21 According to article 11.1 of the BSL, the government can issue a guarantee to cover any shortfall in the Deposit Guarantee Fund, and this guarantee is not constrained by the general guarantee limit equivalent to 10 percent of previous year’s revenues. The government’s responsibility for supporting the guarantee fund is also formalized in a memorandum of understanding between the Deposit Guarantee Fund, the CBA and the government.
97. There is no explicit discussion of fiscal risks from the financial sector in any official documents. Regardless of the perceived magnitude of financial sector fiscal risks, it is important that the assessment of these risks and the underlying analysis is clearly presented. International experience clearly shows that financial instability can have major fiscal impacts, and an indication of the magnitude of these risks in Armenia will strengthen the credibility of fiscal policies, as well as the financial stability policies of the CBA. This assessment should be reported both in the CBA Financial Stability report and in fiscal risk statements in budget documentation.
3.2.6. Natural resources (Not met)
98. There is no systematic government reporting on either mining reserves or asset values, although the mining sector is one of the largest contributors to GDP and exports. In 2016, the mineral industry made up 17.9 percent of total industrial production and exports were valued at USD 480 million, 25 percent of the country’s export revenue. The Armenian Geological Fund provides data on individual deposits, but there is no consolidated assessment of reserves and values.
99. Mineral resources amount to 2.5 percent of revenue in 2016, exposing the budget to some risks as world market prices and production volumes vary. In addition to the direct impacts on budget revenues, these risks also impact foreign investment, employment and GDP growth. During the economic crisis in 2009 prices of copper and molybdenum fell by two thirds, the value of Armenian exports fell by 47 percent and foreign direct investment by 250 million USD. Even in normal times metal prices are subject to significant deviations.
21 Law on Guarantee of remuneration of banking deposits of physical persons.

67
100. Armenia’s recent commitment to participate in the Extractive Industries Transparency Initiative (EITI) is expected to improve transparency in the mining sector.22 Through EITI implementation, governments commit to transparently disclose information about the country’s extractive sector, including the legal framework, production and exports statistics, licenses, state participation in the sector, the amount of revenue collected, the beneficial owners of companies and how these revenues are allocated. The publication supports understanding how the sector is managed, and contributes to reducing mismanagement, corruption and conflict.
3.2.7. Environmental risks (Not met)
101. There is no analysis of environmental risks and their potential fiscal impacts in budget documents. The discussion of macroeconomic risks in the MTEF documents mentions inclement weather conditions as a possible source of reduced agricultural output, but there is no specific analysis or quantification of the impacts. There is no discussion of the risks related to other natural hazards such as earthquakes or of technological risks such as those related to the operations of the Soviet-era nuclear power plant. There is no contingency fund dedicated to natural disasters and no dedicated allocation of funds for this purpose in the general contingency fund.
102. The average annual loss from natural disasters23 is moderate. It is estimated to be 1.3 percent of GDP, whereas the probable maximum loss from a large earthquake, which could occur every 50 years, is estimated to be 2.6 percent of GDP (see Figure 3.14). These estimates reflect historical data for losses from a wide range of natural calamities, including drought, earthquakes, extreme temperatures, flooding and storms. They do not reflect potential costs related to the nuclear power plant.
22 The EITI Board admitted the Republic of Armenia as an EITI candidate country on March 9, 2017. Armenia is required to publish its first EITI Report by September 9, 2018. The EITI Board expects Armenia to publish a beneficial ownership roadmap by January 1, 2018. 23 Armenia has historically been prone to earthquakes. The last devastating earthquake in 1988 killed 25,000 people and injured 19,000, severely damaging 517,000 homes and causing an estimated economic loss of USD 15-20 billion in northern parts of the country. Floods in the country also pose serious danger. For instance, flooding in 2010 caused an estimated USD 10 million in damage. Armenia also faces other natural hazards such as droughts, hail storms, and landslides. The Metsamor Nuclear Power Plant, which is near the end of its life even after refits and safety improvements, and the only Chernobyl-type reactor still in operation globally, is only 36 kilometers from Yerevan, in the midst of a strong seismic zone that stretches from Turkey to the Arabian Sea near India. (https://www.unisdr.org/partners/countries/arm). A project to build a new nuclear plant and decommission the old plant is estimated to cost 5 billion USD (http://www.world-nuclear.org/information-library/country-profiles/countries-a-f/armenia.aspx).

68
Figure 3.14. Average Annual Loss (AAL) and Probable Maximum Loss (PML) from Natural Disasters in Selected Countries
(in percentage of GDP)
Source: UNISDR disaster data and statistics.
103. A World Bank National Disaster Risk Management Program is aimed at supporting the Government of Armenia to strengthen disaster resilience.24 The program includes improving disaster risk information, enhancing disaster risk reduction, strengthening disaster preparedness and improving understanding of fiscal disaster risks and risk financing options. The last component aims at increasing financial capacity and preparedness, while protecting fiscal balances, to help reduce the economic burden of disasters on the government, businesses and households. The program will support the government by carrying out an assessment to better understand the fiscal impacts of disasters and to provide the government with analysis and policy options for disaster risk financing and insurance using international best practices.
3.3. Fiscal Coordination
3.3.1. Subnational governments (Advanced)
104. The Treasury publishes quarterly and annual reports on consolidated budget execution for municipalities.25 The annual state budget includes an annex with aggregate data on the consolidated municipality budgets. In addition, individual municipalities (502 as of 2017), publish their annual budgets and quarterly budget execution reports and the Ministry of Territorial administration and development publishes a consolidated report. Budget execution is on cash basis and there are no published or audited accrual-based financial statements according to the national accounting framework. Budget execution reports do not include the
24 https://www.gfdrr.org/sites/default/files/publication/armenia-national-disaster-risk-management-program.pdf. 25 Municipalities are the self-governing units of local government, unlike marzes which are the regional entities of central government.
0%
2%
4%
6%
8%
10%
AAL/GDP PML/GDP

69
own revenues of MNCOs or commercial companies controlled by municipalities and debt of municipalities which is close to zero. Consolidated municipality budget expenditure in 2016 was 8.6 percent of general government budget expenditure, equivalent to 2.6 percent of GDP.
105. Municipality borrowing limits are defined in the Budget System Law. This includes:
• Municipality borrowing from outside general government is subject to MoF approval and limited to infrastructure development. Total debt servicing, principal and interest, may not exceed 20 percent of the revenues earmarked for capital expenditure in any year.
• Borrowing to finance current expenditure is also subject to the approval of the MoF and is limited to borrowing from the central government or other municipalities, to ensure timely execution of its budget. Such borrowing is normally repaid within the year.
106. The fiscal risks arising from sub-national government appear low at present. Municipality expenditures are below 3 percent of GDP, one of the lowest compared to other selected countries. Local governments are highly reliant on central government transfers, with own source revenues making up only 20 percent of their funding (Figure 3.15). Municipal debt is close to zero and comprises only loans from central government.one of the lowest compared to other countries. However, Yerevan City is intending to borrow and to engage in PPPs from which potential fiscal risks could arise.
107. MNCOs are currently not a major source for risks. Even though there is no central oversight, they are tightly controlled by the municipalities. Assets used by MNCOs are on the balance sheets of local governments, and some revenues, including for kindergartens and waste management, are included in local government budgets. The number of MNCOs are reduced as municipalities are merged, and there are expectations that MNCO bank accounts will be transferred to the Treasury, as is happening for the SNCOs.
Figure 3.15. Size and Self-Reliance of Sub-National Governments in Selected Countries (2014)
0
20
40
60
80
100
0
5
10
15
20
25
30
Mal
taCy
prus
Arm
enia
Gree
ceIre
land
Croa
tiaLu
xem
bour
gGe
orgi
aSl
ovak
iaPo
rtug
alBu
lgar
iaCz
ech
Rep
Hung
ary
Rom
ania
Slov
enia
Lith
uani
aU
KFr
ance
Pola
ndLa
tvia
Net
herla
nds
Nor
way
Italy
Aust
riaGe
rman
ySp
ain
Finl
and
Belg
ium
Swed
en
LG Exp (LHS) Self reliance (RHS)
Percent of GDP Percent of Expenditure

70
3.3.2. Public corporations (Good)
108. The semiannual monitoring report on the financial performance of public corporations provides aggregate and company-level data for most public corporations. SPMD collects data regarding financial performance of all corporations, assesses management quality and publishes a semiannual report. This report includes detailed data for the whole portfolio and for the companies belonging to each sector ministry. As indicated in
109. Individual transfers between government and public corporations are disclosed separately in different budget documents, but there is no consolidated presentation of transfers to public corporations and no disclosure of quasi-fiscal activities. Transfers to public corporations, whether subsidies, capital injections, loans or other forms of payments, will show up under the budget lines of the responsible ministries and are not consolidated anywhere in budget documents. There are summary tables for loans and guarantees in debt management reports, but these are not compared to other transfers to the corporations in question. Many public corporations operate in regulated markets and may be required to provide services at prices that do not cover costs, but there is no disclosure of any quasi-fiscal activities in official documents.
110. Successive governments have had clear policies to reduce the number of public corporations significantly over several years, through privatization, restructuring and liquidation. There is no separate ownership policy for the public corporations, but the policies have been embodied in successive documents regarding privatization and restructuring. The government program for 2017-2022 sets out several objectives for state property management, including the intention to reorganize unprofitable commercial organizations with 100 percent state participation into non-commercial organizations.26 At end-2017 the government owned 50 percent or more in 211 joint stock companies. 54 of these are slated for privatization and the ownership is transferred to SPMD. The remaining 157 companies are owned and managed by sector line ministries, subject to monitoring by SPMD.
111. Budget documents include an assessment of fiscal risks related to 20 major corporations in the energy, transport and water sectors, both public and private. The assessment provides aggregate data for the corporations’ financial performance and position, as well as average financial indicators, by sector. Some of the public corporations are identified in the text, but there is no listing of which corporations are covered, nor any data for individual corporations. There is no specification of transfers from the budget to the corporations, but the text provides numbers for dividend payments from the corporations to the budget. It also
26 Program of the Government of the Republic of Armenia 2017–22.

71
mentions some of the structural measures undertaken to contain fiscal risks from the sector and concludes that the aggregate fiscal risk is “medium,” without specifying the implication of this.27
112. Profitability is weak in the sector; combined operating losses of 12 billion AMD (0.24 percent of GDP) far exceeded the 2.3 billion AMD (0.05 percent of GDP) generated by the profitable corporations (figure 3.16). Two corporations (High-voltage Electric Networks and Yerevan TPP) are responsible for most profits, whereas there are six loss makers with losses exceeding 500 million (0.01 percent of GDP) each. One public corporation (Armgazard) has very significant negative equity. Figure 3.17 indicates that annual budget support to public corporations is quite sizable, including both equity injections and subsidies. Figures 3.18 and 3.19 show the list of public corporations with the highest liabilities, and lowest profitability respectively. Figure 3.20 shows that public corporation liabilities are medium in Armenia to other countries.
Figure 3.16. Profits of Public Corporations (2016) (Billion AMD)
Figure 3.17. Government Support to Public Corporations (Percent of GDP)
Source: SPMD monitoring report 2016, Annual budget reports, staff estimates.
Figure 3.18. Liabilities of Armenian Public Corporations (Percent of GDP, 2016)
Figure 3.19. Liabilities of Public Corporations in Selected Countries (Percent of GDP, 2016)
Source: SPMD monitoring report 2016, IMF public investment database, staff estimates.
27 Because risks are diversified across companies, a combined assessment of different companies will in most cases return a “medium” assessment for company-specific risks. A through risk assessment must rate each individual company.
-3.5
-3
-2.5
-2
-1.5
-1
-0.5
0
0.5
1
-0.5 0.5 1.5 2.5
Vorotan HPPS CJSC
Tsakhkadzor Sportcomplex
High-Voltage EN CJSC
Armenian NPP CJSC
Armgazard CJSC
Yerevan TPP CJSC
Profit/loss
Total Liabilities
0 5 10 15 20 25 30 35
LithuaniaEstonia
ArmeniaRomania
CroatiaBulgariaGreece
GeorgiaHungaryAlbania
LatviaPoland
Tajikistan

72
Recommendations
Issue: Armenia has made good progress in transparent fiscal risk management in some areas, but the approach to risk management is often fragmented, undermining prioritization of risks and consistent risk management. Recommendation 3.1: Provide a consolidated fiscal risk summary (FRS) in the budget documentation:
• Include a summary table indicating key fiscal risks, their probability, and potential fiscal impact;
• Assign to a unit of the MoF the responsibility for coordinating the FRS, with inputs from other departments dealing with fiscal risk management;
• Ensure that all risks are described in a consistent manner, to allow for comparison and prioritization;
• Establish a FRS timetable that ensures that risk analysis informs MTEF and budget policy making; and
• Provide a more detailed analysis of fiscal risks, including risk mitigation strategies, in relevant parts of MTEF and budget documents.
• Include projections for future health and pension spending in the new Armenia Development Strategy 2018 – 2030, with analysis of long-term fiscal sustainability;
• Provide information about all outstanding guarantees in budget documentation, with information about the strategic rationale behind each guarantee, the risk that the guarantees will be called, and any payments related to government guarantees over the last five years;
• Provide a similar presentation for all government on-lending operations;
• Describe any government support to the financial sector over the last 10 years, including guarantees as well as direct payments;
• Describe the government’s responsibilities under the bank deposit guarantee scheme; and
• Provide an estimate of the volume and value of current mineral resources, and the expected government share of this. Describe the variation in budget revenue streams from mineral extraction over the last 10 years.
Issue: There is currently no clear legal framework for PPPs. This undermines the potential use of PPPs as an instrument for procurement of public infrastructure and creates possible fiscal risks.

73
Recommendation 3.2: Ensure that legal framework for PPPs provides for:
• a clear and comprehensive definition of PPPs;
• the establishment of a database of PPPs;
• the annual publication of the total rights, obligations, and other exposures under PPP contracts;
• the expected annual receipts and payments under the contracts; and
• the establishment of a legal limit on accumulated PPP obligations consistent with Armenia’s fiscal rule.
Issue: Monitoring of public corporations is not fully comprehensive, as it does not specify the government’s objectives for each corporation, identify minority shareholders, or disclose the corporations’ interactions with the budget. This undermines the efficiency of public corporation governance and increases risks to the budget from loss-making public corporations.
Recommendation 3.3: Extend the bi-annual monitoring report published by SPMD on public corporations to provide a more complete picture of their financial performance, any conflicts of interest, and budgetary impacts:
• Indicate the government’s objective for each corporation (primarily policy objective, primarily financial objective, to remain under public ownership, to be privatized, to be restructured or liquidated);
• Identify minority shareholders in each public corporation, to ensure transparency regarding any shareholdings by government officials or politicians; and
• Identify all interactions with the budget, including capital injections, loans, subsidies, dividends, and guarantees.

74
Table 3.6. Armenia: Summary Evaluation: Fiscal Risks
Principle Rating Importance Rec
3.1.1 Macroeconomic Risks
Advanced: Budget document contains sensitivity and probabilistic analyses of various macroeconomic and fiscal scenarios.
High: Recent external shocks have led to sharp increase in public debt from 16 in 2008 to 59 percent in 2017 (2008: 16).
3.1.2 Specific Fiscal Risks
Basic: Extensive disclosure on selected specific fiscal risks, but no summary reporting and limited quantification.
High: Explicit fiscal risks may be as high as 70 percent of GDP.
3.1
3.1.3 Long-term Fiscal
Sustainability
Basic: Armenia Development Strategy includes macroeconomic projections, but no analysis of longer-term impact.
Medium: Long-term health and pension costs may increase from 15 to 23 percent of GDP, most of this occurring after 2030
3.4
3.2.1 Budgetary Contingencies
Basic: Law requires a budgetary reserve, and reporting, but does not define access criteria.
Medium: Reserve fund well managed, but extensive use for non-contingency spending may impair response to genuine contingencies.
3.2.2 Asset and Liability
Management
Basic: Government debt and main financial assets disclosed, but no comprehensive risk analysis and balance sheet.
High: Net financial worth (based on disclosed information) -30 percent of GDP. Gross liabilities 57 percent of GDP.
1.2
3.4
3.2.3 Guarantees
Good: Loan guarantees disclosed in debt report and authorized by government decrees, within annual limit, but no assessment of probability to be called.
Low: Guarantees are limited (1.4 percent of GDP) and transparently managed.
3.4
3.2.4 Public-Private Partnerships
Basic: Total rights, obligations, and other exposures under PPP contracts not published, assessment of the fiscal risks not systematic, only for 2 projects.
High: High PPP capital stock of 10.2 percent of GDP, several PPPs under planning.
3.3
3.2.5 Financial Sector Exposure
Good: No direct financial support since 2009 and government guarantees for loans to banks reported. CBA prepares financial stability report, but potential fiscal exposure not explicitly discussed.
Medium: Financial soundness indicators are strong and improving. Lack of explicit disclosure may create uncertainty.
3.4
3.2.6 Natural Resources
Not met: No systematic reporting on natural resource asset values in government documents.
Medium: Resource prices are volatile, and GDP may fluctuate by 2 percent. Ongoing EITI process will improve disclosure.
3.4
3.2.7 Environmental Risks
Not met: No explicit analysis and disclosure of environmental risks in government documents.
Medium: Medium risk of natural disasters, expected average annual loss of 1.3 percent of GDP.
3.3.1 Sub-national Governments
Advanced: Quarterly reports on consolidated municipality budget execution, and limits for borrowing of municipalities subject to MoF approval.
Low: Municipality expenditure is 8.6 percent of general government expenditure, limited loans only from central government.
3.3.2 Public Corporations
Good: Transfers disclosed in different documents, and monitoring report provides some aggregate performance data, but no analysis of quasi-fiscal activities.
High: Liabilities of 15.4 and aggregate recorded loss of 0.2 percent of GDP in 2016.
3.2

Appendix I. Government Fiscal Transparency Action Plan (2018–21)
I. FISCAL REPORTING Recommendation 2018 2019 2020 2021 Responsibility
1.1: Expand the institutional coverage of reports
a. Improve GFSM reporting by institution
Prepare and maintain a comprehensive list of the general government units and public corporations
Include state SNCOs in the consolidated central government budget execution reports.
MoF, NSS
Ensure proper sectorization of public entities into the general government sector or public corporation sector
Expand the consolidated general government statistical reports by including municipal NCOs, and relevant public corporations
MoF, NSS
75

I. FISCAL REPORTING Recommendation 2018 2019 2020 2021 Responsibility
1.2: Publish balance sheet for central government
b. Publish interim balance sheet information
Collect and consolidate data on general government assets and liabilities held by the various units of the MoF, the State Property Management Department, SNCOs, and ministries
Publish the state balance sheet covering all financial assets and liabilities in a relevant bulletin/report on a monthly and annual basis
Compile a consolidated central government balance sheet (including SNCOs) based on the GFSM 2014 methodology with available information
Expand coverage to general government
Government, MoF
1.3: Enhance consistency, comparability, and integrity of fiscal reporting
a. Improve classification and reconciliation
Ensure that material government operations, e.g. capital injections to loss-making corporations, are properly classified as above the line
Compile and publish the following tables which reconcile:
I. the change in stocks and related flows by individual categories of financial assets and liabilities;
MoF
76

77
I. FISCAL REPORTING Recommendation 2018 2019 2020 2021 Responsibility
II. the deficit/surplus and the change in in debt; and
III. the differences between the main aggregates based on the GFSM 2014 and SNA 2008 methodology (including an explanatory note).
1.4: Ensure full implementation of IPSAS-based accounting
a. Ensure comprehensive and integrated accounting reform
Ensure that the accounting information is designed to deliver information according to international statistical standards (GFSM 2014 and SNA 2008) Ensure that cash-based budget execution reports and accrual-based financial statements will be integrated
Ensure reconcilability between the budget execution data, fiscal statistics, and financial statements
Enforce the IPSAS-based national accounting standards and publish financial statements
Provide comprehensive balance sheet data covering all general government assets and liabilities integrated with the flow data
MoF, CoA

II. FORECASTING AND BUDGETING
Recommendation 2018 2019 2020 2021 Responsibility
2.1 Strengthen the MTEF and budget documentation
Optimize the medium-term and annual budget processes
Include a statement of compliance to fiscal rules in the 2019-2021 MTEF and 2019 annual budget Include reconciliation tables in the 2019 annual budget (See Box 2.3 in FTE report), and subsequent MTEFs and annual budgets.
Include a statement of compliance to fiscal rules in the 2019 budget execution report Include a high-level breakdown of revenue and expenditure by the economic classification in the 2020-2022 MTEF Prepare and approve a plan to streamline and restructure the MTEF and annual budget as stages of a rolling baseline process Conduct training in the new MTEF and annual budget processes
Commence implementation of the restructuring of the MTEF and annual budget as a rolling baseline process
Government, MoF, SRC
2.2 Strengthen independent evaluation
78

II. FORECASTING AND BUDGETING Recommendation 2018 2019 2020 2021 Responsibility
a. Disclose alternative forecasts
Include in the 2019-2021 MTEF and 2019 budget comparisons of official forecasts with those of other agencies
2.3 Improve budget coverage, and reduce budget revisions
a. Ensure that the annual and revised budgets are credible
Include a statement of fiscal objectives in the corrective action plan in the 2019-2012 MTEF and in the 2019 budget law to ensure compliance audit by CoA
Include projected revenue and spending of extra budgetary accounts in the 2020 budget Conduct compliance audit
Amend Art 11 of BSL to: (i) limit increases in spend, and (ii) require Parliamentary approval for increases beyond this limit. Amend Art 19 of BSL to include clear access criteria to Government Reserve Fund for genuine contingencies (see Box 3.1 in FTE report for country examples)
Parliament, Government, MoF, CoA
79
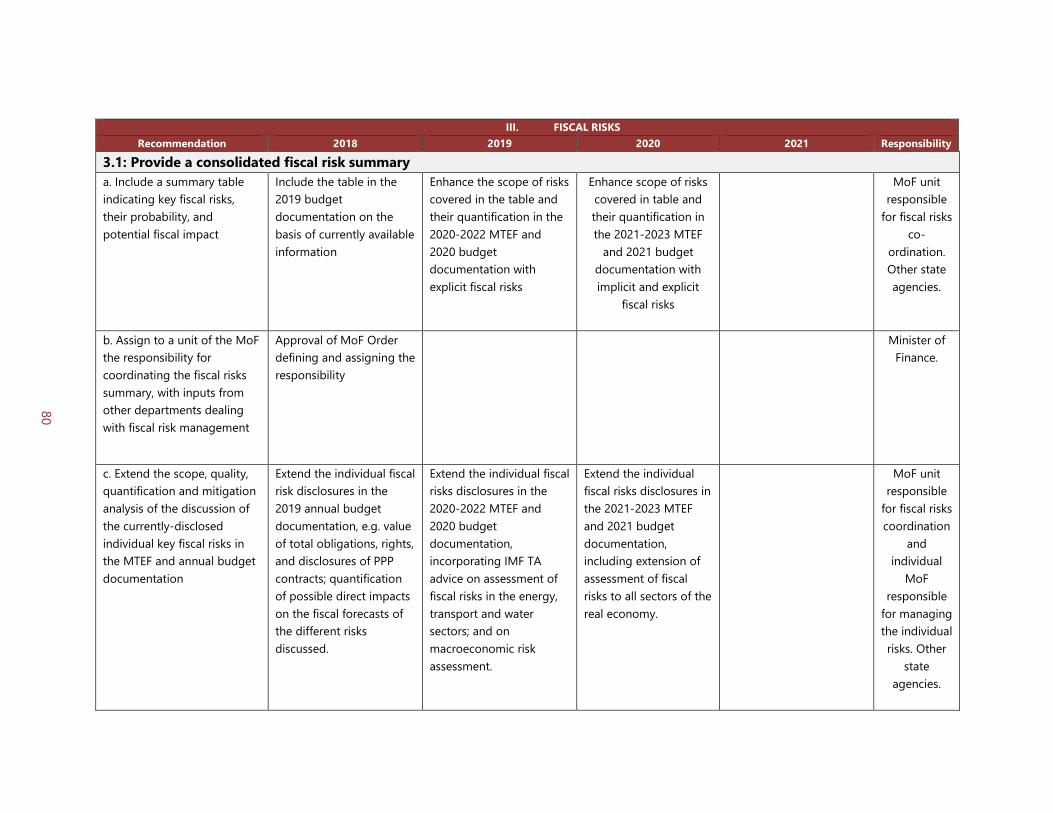
III. FISCAL RISKS Recommendation 2018 2019 2020 2021 Responsibility
3.1: Provide a consolidated fiscal risk summary a. Include a summary table indicating key fiscal risks, their probability, and potential fiscal impact
Include the table in the 2019 budget documentation on the basis of currently available information
Enhance the scope of risks covered in the table and their quantification in the 2020-2022 MTEF and 2020 budget documentation with explicit fiscal risks
Enhance scope of risks covered in table and their quantification in the 2021-2023 MTEF
and 2021 budget documentation with implicit and explicit
fiscal risks
MoF unit responsible
for fiscal risks co-
ordination. Other state agencies.
b. Assign to a unit of the MoF the responsibility for coordinating the fiscal risks summary, with inputs from other departments dealing with fiscal risk management
Approval of MoF Order defining and assigning the responsibility
Minister of Finance.
c. Extend the scope, quality, quantification and mitigation analysis of the discussion of the currently-disclosed individual key fiscal risks in the MTEF and annual budget documentation
Extend the individual fiscal risk disclosures in the 2019 annual budget documentation, e.g. value of total obligations, rights, and disclosures of PPP contracts; quantification of possible direct impacts on the fiscal forecasts of the different risks discussed.
Extend the individual fiscal risks disclosures in the 2020-2022 MTEF and 2020 budget documentation, incorporating IMF TA advice on assessment of fiscal risks in the energy, transport and water sectors; and on macroeconomic risk assessment.
Extend the individual fiscal risks disclosures in the 2021-2023 MTEF and 2021 budget documentation, including extension of assessment of fiscal risks to all sectors of the real economy.
MoF unit responsible
for fiscal risks coordination
and individual
MoF responsible
for managing the individual risks. Other
state agencies.
80

III. FISCAL RISKS Recommendation 2018 2019 2020 2021 Responsibility
d. Disclose information on additional specific fiscal risks
Provide specific information about each outstanding guarantee in 2019 budget documentation Disclose an analysis of outstanding loans in 2019 annual budget documentation
Describe in annual budget documentation any government support to the financial sector over the last 10 years
Describe in annual budget documentation the government’s responsibilities under the bank deposit guarantee scheme
Provide an estimate of the volume and value of current mineral resources, and the expected government share of this in the 2020-2022 MTEF.
Include an assessment of climate change and other environmental fiscal risks in the 2022-2024 MTEF. Include an assessment of natural disaster fiscal risks in the 2021-2023 MTEF.
MoF. Other state agencies
3.2 Improve the legal framework for PPPs a. Ensure: a clear and comprehensive definition of PPPs; the establishment of a database of PPPs; the annual publication of the total rights, obligations, and other exposures under PPP contracts and the expected annual receipts and payments under the contracts; and the establishment of a legal limit on accumulated PPP obligations consistent with Armenia’s fiscal rule
Approve a PPP Law that incorporates these provisions Collect relevant data
Approve a government decree implementing the PPP Law Approve methodological guidelines to provide detailed guidance on implementing the Law
Conduct training of MoF, MoEDI, PPP Unit and line ministries in implementation of the methodological guidelines
Parliament, Government, MoF, MoEDI
81

III. FISCAL RISKS Recommendation 2018 2019 2020 2021 Responsibility
3.3 Extend the bi-annual monitoring report published by SPMD on public corporations a. Indicate the government’s objective for each public corporation, identify minority shareholders in each corporation, and identify all interactions between each corporation and the budget, including capital injections, loans, subsidies, dividends, and guarantees.
Include this information in the SPMD’s reports for the largest third of the public corporations
Include this information in the SPMD’s reports for the next largest third of the public corporations
Include this information in the SPMD’s reports for the final third of the public corporations
SPMD
82

83
Appendix II. Technical Note on Table 0.2
Methodological Framework Table 0.2 presents estimates compiled in accordance with the GFSM 2014. These estimates attempt to present a broad overview of Armenia’s public sector finances, by complementing data published in the various fiscal reports with IMF staff estimates for the most material data gaps, in reference to the GFSM 2014 framework. Given the limitations in data sources and time available for their compilation, this exercise must be considered as an approximate picture of Armenia’s public sector finances. In terms of institutional coverage, the “public sector consists of all resident institutional units controlled directly, or indirectly, by resident government units—that is, all units of the general government sector and resident public corporations.1” Public corporations include units engaged in both nonfinancial and financial activities. Figure A.1 below shows the relationship between the general government sector, the public sector, and the other main sectors of the domestic economy.
Figure A.1 The Public Sector and other Sectors of the Economy
In the GFSM presentation, transactions that increase net worth are recorded as revenue, while transactions that decrease net worth are recorded as expense. The net operating balance, which provides a measure of the sustainability of the policies of each group of units, corresponds to the difference between revenue and expense, and, as such, excludes transactions in nonfinancial assets. Total expenditure can be derived as the sum of expense and net investment in nonfinancial assets (acquisitions less disposals less consumption of fixed capital). The net investment in nonfinancial assets does not change the net worth of the public sector, but affects the financial resources available to it, so it must be deducted from the net operating balance, when
1 GFSM 2014, paragraph 2.63

84
calculating the net lending/borrowing (also referred to as fiscal balance). This represents the amount that the public sector has available to lend or must borrow to finance its expenditure. Sources and Methods General government The primary data source for general government (GG) transactions were the annual cash based GFS data compiled by the MoF for the IMF’s GFS yearbook. The only adjustment to these data was the addition to local government revenue and expenditure of the estimated value of operations of the extra-budgetary units (Municipal Non-Commercial Organizations), which are currently not covered by any fiscal report. The magnitude of amended flows after consolidation is insignificant and it doesn’t impact the net lending/borrowing of the GG sector. The estimation was done by IMF staff based on information collected in the context of discussions with the Department of Local Self–Government. Estimates on the GG´s stock positions for non-financial assets, financial assets, and liabilities are based on accounting data supplemented by further information coming from various government agencies and IMF’s Capital Stock Database. In addition, IMF staff estimates have been added to reflect the value of fixed assets and related liabilities from PPPs, and liabilities of the pension scheme for military personnel.
Table A.1 below specifies individual elements of stocks of GG assets and liabilities to estimate an approximation of GFSM 2014-compliant stock data as reported in Table 0.2.
Table A.2 Estimated Balance Sheet of the General Government
Sub-sector Source of information bn AMD Budgetary Central Government
Non-financial assets 1,609 • Assets owned by Ministries, source: MoF, aggregated
financial statement / balance sheet of the line Ministries 886
• Public infrastructure assets and military equipment, source: State Property Management and MoF
205
• PPPs, source: IMF staff estimate based on the Private Participation in Infrastructure (PPI) Project Database
518
Financial Assets 1,279 • Currency and deposits, source: Monetary and Financial
Statistics (also include local government) 184
• Debt securities and loans, source: MoF data and MFS, International Investment Position (IIP), and accounting data on loans granted to public corporations
347

85
Sub-sector Source of information bn AMD • Equities and shares, source: State Property Management
and Department of Debt Obligations 747
Liabilities 3,460 • Debt securities and loans, sources; MoF debt data • Loans from PPPs, source: MF staff estimate, see above • Employment related pension entitlements, source: IMF
staff estimate of the stock of pension entitlements accrued -to-date of the pension scheme for military personnel;1 it refers to the net present value of future flows and was estimated via extrapolation (estimated annual pension cash flow 210 bn, 20 years with interest rate 5 percent)
2,631 518 312
EBFs (SNCOs) Non-financial assets, source: Property Management Department data based on financial statements
130
Financial assets, source: Property Management Department data based on financial statements
62
Liabilities, source: Property Management Department data based on financial statements (the figure only refers to non-equity liabilities as these are government non-commercial organizations)
150
Local Government
Non-financial assets source: IMF staff estimate based on the IMF’s Capital Stock Database
547
1/ International statistical and accounting standards require a liability to be recognized on the government’s balance sheet in relation to employment-related defined-benefit pension schemes. In the case of Armenia, (see footnote 5) this includes the unfunded scheme covering military personnel (whose pensions are paid out of the general budget resources, rather than from accumulated reserves).
Regarding the implicit pension entitlements from PAYG pension scheme which are shown as a memo item in Table 0.2, the estimated net present value of liabilities was calculated by IMF staff via extrapolation, similarly to the pension scheme for military personnel. This estimate doesn’t consider potential demographic and policy changes. Contrary to the employment related pension schemes, pension entitlements from PAYG schemes are according to GFSM 2014 methodology not included in the government balance sheet, but rather treated as off-balance sheet (implicit) liabilities.

86
Public corporations
Non-financial corporations
The main data source for estimates were accrual based financial statements for 188 SOEs available from the State Property Management. Data on revenue and expense were derived from the profit and loss account. The net investment in non-financial assets, which is not captured in the profit and loss account, was estimated based on the cash-flow statements of four biggest corporations (High Voltage, ANPP, Yerevan TPP, and Vorotan TPP). Due to unavailability of direct flow data for the remaining SOEs, the net investment in non-financial assets was estimated as a change in stocks of non-financial assets reported in balance sheets. The latter estimate is to be considered as a proxy to transactions in non-financial assets as it may include possible other economic flows (e.g. changes in stocks due to revaluation, liquidation of assets, etc.). Data on stocks of assets and liabilities are based exclusively on the primary source - accounting balance sheets.
Financial corporations
Transaction and balance sheet data of public financial corporations are based on the Annual report of the National Central Bank (including its 10 subsidiaries), and annual financial statements of Armenia's Development and Investment Corporation, and Export Insurance Agency of Armenia. Financial statements of Deposit Guarantee Fund of Armenia were not available for the mission team and no estimates are included in Table 0.2.
Elimination of intra-public-sector transactions and stock positions
Material reciprocal transactions and stock positions between the general government and the public sector were eliminated to the extent allowed by available data sources. The main eliminations on transactions referred to subsidies and dividends (available in the annual GFS report). On the stock side, the main element was the government holding of public corporation’s equity (corresponding to the value of capital reported by public corporations), loans granted by state to public corporations, and government deposits in the central bank.

Appendix III. Estimation of Specific Fiscal Risks
Magnitude Measure % GDP Estimation method Source Explicit risks
Guarantees Debt guarantees 1.4 - Annual debt report 2016 Underwriting of Deposit Guarantee Scheme
5.8 - Information provided by CBA
Promissory note to CBA 1.5 - CBA financial statement 2017 PPPs Total investment 10.2 Derived from published data Ministry of Economy website
Total risk exposure N.A. Financial sector
Liabilities of FPC (including CBA) 32.6 As reported in the balance sheet by units Annual financial statements and Monetary Financial Statistics
Public Corp (exc. CBA)
Liabilities of non-financial public corporations
15.4 As reported by the units SPED annual monitoring report
On-lending Outstanding loans arising from on-lending 9.6 Derived from published data Monthly bulletin on public debt
Financial sector
Liabilities of commercial banks 66
Natural resources
Contribution of mineral sector to GDP volatility
2? 0,5
2,5 % of revenues (2016) is 0,5 % of GDP. 2016 prices less than half of 2012.
Source 2% Source prices: London metal exchange website.
Natural disasters
Average annual loss 1.3 UNISDR estimates based on reported annual costs
UNISDR
Probable maximum loss earthquake (50 year)
2.6 UNISDR estimates based on reported annual costs
UNISDR
Long-term risks Pension costs
Unfunded pension liabilities 51.5 Net present value of pension liabilities calculated (see Appendix II)
IMF staff calculations
Health care costs
Expected increase in annual health care costs in percent of GDP (2020-2050)
3.7 Methodology described in FAD: Fiscal Policy: How to Assess Fiscal Implications of Demographic Shifts: A Granular Approach, 2016
IMF staff calculations, based on UN demographic projections
87

Fiscal Affairs Department
International Monetary Fund700 19th Street NWWashington, DC 20431USAhttp://www.imf.org/capacitydevelopment