imf country report no. 16/24 rwanda · pdf filepress release no. 16/09 for immediate release ....
TRANSCRIPT

© 2016 International Monetary Fund
IMF Country Report No. 16/24
RWANDA FOURTH REVIEW UNDER THE POLICY SUPPORT INSTRUMENT—PRESS RELEASE; STAFF REPORT; AND STATEMENT BY THE EXECUTIVE DIRECTOR FOR RWANDA
In the context of the Fourth Review Under the Policy Support Instrument, the following
documents have been released and are included in this package:
A Press Release including a statement by the Chair of the Executive Board.
The Staff Report prepared by a staff team of the IMF for the Executive Board’s
consideration on January 15, 2016, following discussions that ended on
November 4, 2015, with the officials of Rwanda on economic developments and
policies. Based on information available at the time of these discussions, the staff
report was completed on December 17, 2015.
A Debt Sustainability Analysis prepared by the staffs of the IMF and the World Bank.
A Statement by the Executive Director for Kenya.
The documents listed below have been or will be separately released:
Letter of Intent sent to the IMF by the authorities of Rwanda*
Memorandum of Economic and Financial Policies by the authorities of Rwanda*
Technical Memorandum of Understanding*
*Also included in Staff Report
The IMF’s transparency policy allows for the deletion of market-sensitive information and
premature disclosure of the authorities’ policy intentions in published staff reports and
other documents.
Copies of this report are available to the public from
International Monetary Fund Publication Services
PO Box 92780 Washington, D.C. 20090
Telephone: (202) 623-7430 Fax: (202) 623-7201
E-mail: [email protected] Web: http://www.imf.org
Price: $18.00 per printed copy
International Monetary Fund
Washington, D.C.
January 2016

Press Release No. 16/09
FOR IMMEDIATE RELEASE
January 15, 2016
IMF Executive Board Completes Fourth PSI Review for Rwanda
The Executive Board of the International Monetary Fund (IMF) today completed the fourth
review of Rwanda’s economic performance under a three-year program supported by the
IMF’s Policy Support Instrument (PSI)1.
The PSI for Rwanda was approved on December 2, 2013 (see Press Release No.13/483).
Following the Executive Board discussion, Mr. Min Zhu Deputy Managing Director and
Acting Chair, made the following statement:
“Rwanda has a track record of strong policy performance that has led to sustained high
growth, progress in reducing poverty, and a stable macroeconomic situation. Growth in 2015
was slightly stronger than expected and inflation remained contained. Revenue collection and
budget execution were broadly in line with expectations.
“However, the growth outlook for 2016–17 has become more uncertain, due to recent
declines in international commodity prices. These have already reduced Rwanda’s export
receipts and, combined with appreciation of the U.S. dollar, has created strong downward
pressure on the exchange rate.
“The authorities’ planned policy response is to continue to allow exchange rate flexibility to
function as the central tool for adjustment, supported by modest tightening of the monetary
stance, with frontloaded provision of donor assistance and some additional use of
international reserves to cushion the immediate impact. However, the authorities should
consider contingency plans for further fiscal and monetary adjustment, should the shock
1 The PSI is an instrument of the IMF designed for countries that do not need balance of payments financial
support. The PSI helps countries design effective economic programs that, once approved by the IMF's
Executive Board, signal to donors, multilateral development banks, and markets the Fund's endorsement of a
member's policies (see http://www.imf.org/external/np/exr/facts/psi.htm). Details on Rwanda’s current PSI are
available at www.imf.org/rwanda.
International Monetary Fund
Washington, D.C. 20431 USA
2
persist longer or intensify more than expected. Careful monitoring will be needed over the
next months to determine whether additional tightening may be needed, including to avoid
undue pressure on the exchange rate or depleting reserve buffers. Re-building reserve buffers
will be critical to enhance the country’s resilience to future shocks.
“Over the medium term, policies should remain focused on sustaining high growth through
growth-enhancing public investment, encouraging private investment, and diversifying
exports. The authorities plan to restore fiscal buffers by reducing the deficit via higher
revenue collection, improved public spending efficiency and cautious borrowing,
underpinned by medium-term fiscal consolidation. In addition, reforms to expand access to
financial services and deepen financial markets will provide needed capital for private sector-
led growth and enable Rwanda’s integration in larger markets within the East African
Community.”

RWANDA FOURTH REVIEW UNDER THE POLICY SUPPORT INSTRUMENT
KEY ISSUES Growth in 2015 has been stronger than expected. Growth was driven by strong activity in agriculture, construction, and services, with the projection for the year increased from 6.5 to 7.0 percent. Inflation remains well contained, although the monetary stance remains accommodative, with higher than expected credit growth. Fiscal policy has been broadly in line with expectations. Recent household survey results show good progress in poverty reduction.
However, the outlook for 2016 is darker. An external shock is currently unfolding: mining exports have been almost halved in recent months, due to lower prices and demand in export markets. Combined with US dollar appreciation, this has put strong downward pressure on the Rwandan franc, and prompted a drawdown of international reserves by the banking system. Deterioration of the current account in 2015 is expected to continue in 2016, including due to public infrastructure imports for the Kigali convention center and expansion of RwandAir’s fleet.
Policy discussions focused on the near term policy response. The principal tool for responding to the shock is continued exchange rate flexibility, accompanied by modest tightening of the monetary stance. Frontloaded budget support and some additional use of reserve buffers will help cushion the level of adjustment required. The fiscal stance will remain unchanged in FY15/16 and tightened in FY16/17, with additional adjustment if the impact of the shock is greater than anticipated, once the authorities have a better sense of the depth and duration of the shock. In the coming 6-12 months, careful monitoring of the external situation and reserve levels will be needed to assess whether more fiscal and monetary adjustment is needed.
Medium-term policies are geared toward sustained high and inclusive growth while strengthening resilience. Export diversification, improved revenue mobilization, and better public financial management will ease the foreign exchange constraints, rebuild buffers, and further reduce reliance on donors. Reforms to deepen financial markets, broaden access to financial services will help facilitate private sector-led growth and EAC integration.
December 17, 2015

RWANDA
2 INTERNATIONAL MONETARY FUND
Approved By Roger Nord (AFR) and Masato Miyazaki (SPR)
Discussions were held in Kigali during October 21-November 4, 2015. The mission comprised Laure Redifer (head), Tobias Roy, Vimal Thakoor, and Samba Mbaye (all AFR), and Myrvin Anthony (SPR). Alun Thomas, resident representative, assisted the mission. The mission met with Minister of Finance and Economic Planning Gatete; National Bank of Rwanda Governor Rwangombwa; Minister of Trade and Industry Kanimba and other senior officials; and representatives of the private sector and development partners.
CONTENTS
RECENT DEVELOPMENTS AND OUTLOOK ______________________________________________________ 4
PROGRAM PERFORMANCE ______________________________________________________________________ 5
POLICY DISCUSSIONS ___________________________________________________________________________ 6
A. Fiscal Policy ______________________________________________________________________________________7
B. Debt Sustainability _______________________________________________________________________________9
C. Monetary Policy and Financial Sector Issues ____________________________________________________9
D. External policies _______________________________________________________________________________ 10
PROGRAM RISKS ________________________________________________________________________________ 12
PROGRAM MODALITIES ________________________________________________________________________ 12
STAFF APPRAISAL ______________________________________________________________________________ 13
BOXES 1. Rwanda Revenue Authority Efforts to Recoup Tax Arrear ________________________________________8 2. Rwanda’s Export Diversification Strategy and the "Northern Corridor" ________________________ 11
FIGURES 1. Recent Economic Performance ________________________________________________________________ 14 2. Selected High Frequency Indicators of Economic Activity _____________________________________ 15 3. Monetary Developments ______________________________________________________________________ 16 4. External Sector Developments _________________________________________________________________ 17

RWANDA
INTERNATIONAL MONETARY FUND 3
TABLES 1. Selected Economic and Financial Indicators, 2012-2018 _______________________________________ 18 2a. Operations of the Central Government, Fiscal-Year Basis, 2012/13–17/18 (Billions of Rwanda francs) ____________________________________________________________________ 19 2b. Operations of the Central Government, Fiscal-Year Basis, 2012/13–17/18 (Percent of GDP) ______________________________________________________________________________ 20 2c. Operations of the Central Government, Semi-Annual Basis, 2014/15–16/17 (Billions of Rwanda francs) ____________________________________________________________________ 21 2d. Operations of the Central Government, Calendar-Year Basis, 2015-17 (Billions of Rwanda francs) ____________________________________________________________________ 22 2e. Operations of the Central Government, Calendar-Year Basis, 2015-17 (Percent of GDP) _____ 23 3. Monetary Survey, 2012–18 ____________________________________________________________________ 24 4. Balance of Payments, 2012–18 _________________________________________________________________ 25 5. Financial Soundness Indicators for Banking Sector, 2012–15 __________________________________ 26 6. Quantitative Assessment Criteria and Indicative Targets as of end-June 2015 ________________ 27 7. Status of Structural Benchmarks for 4th Review _______________________________________________ 28 APPENDIX Letter of Intent ___________________________________________________________________________________ 29 Attachment I. Memorandum of Economic and Financial Policies—Update ______________________ 31 Attachment II. Technical Memorandum of Understanding ______________________________________ 46

RWANDA
4 INTERNATIONAL MONETARY FUND
2005/06 2010/11 2013/14
Poverty Rate1
56.7 44.9 39.1
Extreme Poverty Rate1
35.8 24.1 16.3
GINI coefficient 0.522 0.49 0.448
Literacy Rate 15-24 76.9 83.1 86.2
Secondary school attendance 10.4 17.8 23.0
Households with metal roof 43.7 54.4 61.1
Electricity for lighting 4.3 10.8 19.8
Households with savings account 18.9 36.1 54.1
Source: EICV4 household survey
1There was a change in methodology in the 2013/14 survey;
comparability is being assessed.
Selected Rwanda Household Survey Indicators
(in percent)
RECENT DEVELOPMENTS AND OUTLOOK 1. The Rwandan Parliament unanimously approved that the Constitution be amended to permit President Kagame the option to seek another term. When his current term ends in 2017, the amendment would allow the President to seek a third seven-year term, and then make the rule going forward two five-year terms (including for the President). The amendment is likely to garner strong support in a forthcoming domestic referendum.
2. Rwanda’s latest household survey showed a strong improvement in poverty reduction indicators over the past 3 years. Survey results, released in August, showed that poverty reduction, health/education, and living standards indicators improved considerably. Inequality has also maintained its downward trend.
3. Growth was robust in the first half of 2015, and inflation was contained (Figures 1 and 2). Real GDP grew by 7.3 percent in the first half and high-frequency indicators suggest that strong activity was maintained through the third quarter. Growth was driven by strong activity in agriculture, construction, and services. Headline inflation (y/y) stood at 2.9 percent in October, reflecting an increase in utility prices, mitigated partly by lower retail fuel prices.
4. The fiscal outturn in FY2014/15 was in line with expectations (Tables 2a and 2b). Compared to 5.3 percent targeted, the fiscal deficit was 5.2 percent. Resources were 1.1 percentage points of GDP higher than expected; these financed an increase in spending of 1.3 percentage points of GDP (offset by more spending committed but not yet executed). About half of the higher revenues and spending were for self-financed peacekeeping operations. Collection of direct taxes and VAT was also higher than expected, continuing a gradual trend upward of domestic revenue collection.
5. Through end-June, broad money grew much faster than programmed (Table 3, Figure 3). Although reserve money growth was broadly in line with expectations, broad money growth was 16.7 percent (y/y), compared to 8.7 percent in the program. Notwithstanding still-high real lending rates, private sector credit growth was higher than expected, at 27.6 percent (y/y). Although partly mitigated by a reduction in credit from the banking system to the public sector, net domestic assets grew well beyond levels anticipated in the program. At the same time, banking

RWANDA
INTERNATIONAL MONETARY FUND 5
600
625
650
675
700
725
750
Jan
-12
Ap
r-1
2
Jul-
12
Oct
-12
Jan
-13
Ap
r-1
3
Jul-
13
Oct
-13
Jan
-14
Ap
r-1
4
Jul-
14
Oct
-14
Jan
-15
Ap
r-1
5
Jul-
15
Oct
-15
Rwandan Franc/US$ Exchange RateDepreciation since January 2012
4.6%
11.5%
15.8%
21.7%
system net foreign assets (NFA) contracted more than envisaged in the program. Financial sector indicators have, on aggregate, continued to improve, with non-performing loans continuing to decline (Table 5).
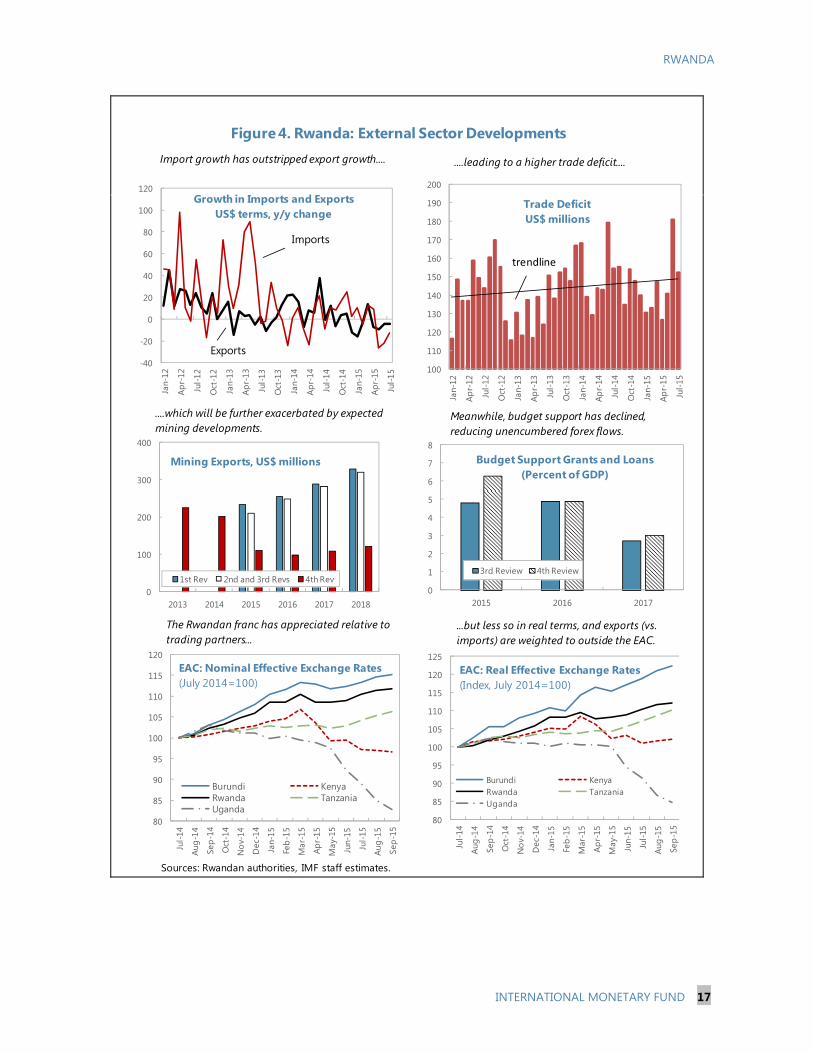
6. The trade deficit for the first 3 quarters of 2015 worsened significantly, due to weak mining activity (Table 4 and Figure 4). The main contributing factor was a sharp drop in mining exports due to both lower prices and production (by 18 percent and 34 percent, respectively), resulting in a near halving of mining exports (from US$203 million in 2014 to US$110 million in 2015). While mining accounts for less than 2 percent of GDP, mining exports were more than 25 percent of total goods exports in 2014. At the same time, strong growth, particularly in construction, led to higher-than-expected capital and consumer goods imports. This should result in a larger current account deficit, increasing to 14.5 percent in 2015.
7. The Rwandan franc depreciated by roughly 6 percent in the first three quarters of 2015. While depreciation against the US$ was less than other EAC countries, it is the highest rate of depreciation in a decade. Cumulatively, the Rwandan franc has depreciated by 21.7 percent since January 2012, compared to 4.2 percent in the previous 7 years. Demand for the US dollar has increased in recent years due to growing import demand, a relatively narrow export base, and a move by development partners away from budget support. However, needs were particularly acute this year, reflecting developments in the mining sector, putting strong downward pressure on the value of the franc, and resulting in a sharp drawdown of commercial banks’ foreign exchange holdings. The authorities emphasized that some of the demand pressures were speculative. Depreciation of the franc so far has not had a profound effect on inflation, since Rwanda’s imports, relative to exports, are skewed toward intra-regional trade and the franc has appreciated against neighboring countries, which saw greater depreciation still against the US$.
8. The growth outlook for 2016-18 is somewhat weaker, with growth reverting back to potential thereafter. The authorities and the mission agreed on a revised baseline with somewhat lower growth in 2016-18, as a result of lower mining activity, with projections for 2016 revised to 6.3 percent. Inflation is expected to pick up somewhat, responding to currency depreciation and higher import commodity prices, but should remain at or below the BNR’s target of 5 percent.
PROGRAM PERFORMANCE 9. All quantitative targets of the program, except one, were met through end-June (Table 6). The indicative ceiling on accrual of consolidated domestic debt of the public sector was exceeded by a minor margin, owing to temporary bridge financing for peacekeeping operations (which has

RWANDA
6 INTERNATIONAL MONETARY FUND
now been added as a program adjustor). All other fiscal and monetary ceilings/floors were respected.
10. Performance in implementing structural benchmarks through end-September was satisfactory (Table 7). Of four structural measures to be implemented through end-September, three were completed. Publication of quarterly budget execution was delayed due to difficulties in reconciling donor project financing and spending. The measure has been revised to allow for a longer time period to produce the report, which will initially exclude foreign-financed project financing and spending, with the first report based on Q4 2015 budget execution.
POLICY DISCUSSIONS 11. Discussions focused on balancing the short-term policy response to an unfolding shock with policies to support long-term development goals. Balance of payments pressures are expected to persist in 2016 as a result of a combination of reduced forex inflows and strong import demand, mitigated partly by accelerated budget support by the World Bank and the AfDB. In response, it was agreed that:
continued exchange rate flexibility should restrain import demand; reserve money targets will be tightened modestly to reign in demand, including for imports;
the fiscal stance will be left unchanged in FY15/16 relative to FY14/15, as the extent and duration of the shock are being assessed, and tightened starting in FY16/17, in line with the already-agreed program; and
some use of central bank forex reserves would avoid sharp adjustment for now, but efforts should be made to rebuild buffers over the medium term.
The authorities and the mission agreed to keep a close eye on mining sector developments and adjust the policy mix if needed. The mission emphasized that, should the shock intensify or be prolonged, more fiscal and exchange rate adjustment would be warranted.
12. For the medium term, in line with their Economic Development and Poverty Reduction Strategy (EDPRS) II and EAC integration, the authorities will continue to:
continue public investment spending (at somewhat lower levels, following large one-off infrastructure projects in FY15/16), while mitigating fiscal risks and safeguarding debt sustainability, including by bolstering domestic revenue mobilization;
improve resilience to external shocks and encourage more private-sector led growth, encourage more private sector investment, including to diversify the export base and foster more import substitution;

RWANDA
INTERNATIONAL MONETARY FUND 7
MEFP ¶25-29
MEFP ¶30-31
0
10
20
30
40
50
60
70
80
90
100
Dec-11 Jun-12 Dec-12 Jun-13 Dec-13 Jun-14 Dec-14 Jun-15
Tax Revenue, RWF billions
Goods & services Income Trade
strengthen monetary transmission mechanisms for more reliance on indirect monetary policy instruments, encourage deeper financial markets and better price signals in the forex market.
A. Fiscal Policy
13. A revised FY15/16 budget law will maintain the fiscal deficit at 5.3 percent of GDP. The deficit reflects a broadly neutral fiscal stance compared to FY14/15, but is expansionary compared to the original program projection of 4.6 percent of GDP. This reflects mainly higher spending in the second half of the year, financed roughly equally by higher domestic and external financing. The increased spending is for numerous priority projects (e.g. hiring more teachers for training programs, voter registration and equipment purchases, power projects, and extension of the one-cow-per-family program).
14. The authorities plan to continue boosting domestic revenue collection. A number of tax policy and tax administration measures are underway to enhance revenue collection in line with EAC convergence targets. These include the rollout of
a new road fund levy, an excise tax for strategic reserve, higher taxes on tobacco, and changes to the mining tax regime – as well as measures to improve compliance, including the use of electronic billing machines for VAT collection. FAD’s Tax Administration Diagnostic Tool (TADAT) recently identified strengths (e.g. information, external audit, dispute resolution, annual reporting), as well as areas for improvement (e.g. taxpayer databases, risk-management practices, and tax arrears), which the authorities are heeding closely (Box 1). Most of these measures should bear fruit by FY16/17, but in the absence of firm estimates of their impact the authorities prefer to keep conservative projections for the medium term.

RWANDA
8 INTERNATIONAL MONETARY FUND
MEFP ¶25
MEFP ¶6
MEFP ¶32
Box 1: Rwanda Revenue Authority (RRA) Efforts to Recoup Tax Arrears
From December 2014-June 2015, the RRA temporarily reassigned tax auditors to bolster the enforcement division six-fold to address tax arrears by small and medium taxpayers. The task included: cataloguing tax arrears of small and medium taxpayers; negotiating installment payments; profiling taxpayers’ immovable assets as collateral for future payments; and analyzing and categorizing arrears cases for litigation based on the probability of successful recovery. Various enforcement actions were taken, including: garnishing wages; publishing names of tax evaders in the newspaper; and blacklisting evaders from public tendering. As a result of these measures, the monthly average collection rate from this group of taxpayers has increased from RWF 0.4 billion to RWF 1.1 billion. Moreover, the RRA has begun taking action on taxpayers that file returns but do not pay the tax due, to ensure that arrears do not accumulate going forward.
15. The authorities are also reinforcing efforts to mitigate fiscal risks from state-owned enterprises. To improve operational efficiency, the water and electricity companies were split into two separate entities, to be run on a more commercial basis. To cover costs of the operational reforms and ensure full cost recovery going forward, tariffs for water and electricity were increased by 19 and 35 percent respectively, effective September 1, 2015. Energy subsidies in Rwanda previously amounted to about 0.5 percent of GDP. The new entities are now expected to begin generating operating surpluses in the coming months, which will be used to improve service delivery and expand investment.
16. Recent reforms also aim at improving public financial management and value-for-money in public investment. This includes developing a roadmap to implement the latest public accounting standards, required for EAC integration, but also capable of accounting for fixed assets, a development area identified by past assessments. The authorities are putting in place an “e-procurement” system to make bidding processes more transparent and link functions to IFMIS. Two years ago, a Public Investment Committee (PIC) was established at the Ministerial level to consult on investment projects at the budget planning stage—the PIC reviews and prioritizes investment projects, according to a strict set of criteria applied for projects throughout the country. Planning, monitoring, and evaluation functions for public investment have recently been consolidated to enhance coordination across the stages and improve feedback between project evaluation and future planning.
17. On the basis of these measures, the authorities plan to reduce the deficit in the medium term along the lines agreed in the 3rd review, however, with larger adjustment in FY 16/17 and FY 17/18. The mission welcomed the aforementioned measures, but questioned whether the pace of deficit reduction over the medium-term was sufficiently ambitious, and suggested that more would be needed if the mining shock proved more profound than currently assumed. As information about the extent of the shock

RWANDA
INTERNATIONAL MONETARY FUND 9
MEFP ¶34
MEFP ¶33
MEFP ¶19-20, 40
MEFP ¶18
becomes clearer in the coming months, the authorities agreed to prepare a downside scenario, to be discussed in the 5th review mission, which would spell out potential additional adjustment policies over the medium term.
B. Debt Sustainability
18. Rwanda remains at low risk of external debt distress (Annex 2). External public debt has increased in recent years, rising from around 17 percent of GDP in 2012 to 24 percent in 2014. The increase reflects a shift from donors’ provision of grants toward concessional lending, as well as several non-concessional loans incurred to finance the purchase and lease of new aircraft for RwandAir and the completion of the long-awaited Kigali Convention Center. Following this borrowing, the authorities are aware that careful debt management will be needed to maintain the low risk of debt distress rating. Thus, the medium-term debt profile anticipates borrowing exclusively on concessional terms through 2020, with a reduction in donor reliance thereafter. To achieve this, the authorities have therefore developed new more rigorous processes for the issuance of guarantees, along with the aforementioned framework to prioritize investment projects. Domestic debt has increased from 0.2 percent of GDP in 2012 to 6.2 percent in 2014, reflecting efforts to establish a longer yield curve and stronger secondary markets to help bolster the monetary transmission mechanism (paragraph 21).
C. Monetary Policy and Financial Sector Issues 19. Reserve money targets have been kept in line with the program at end-December and in 2016, despite stronger growth in 2015. This should help contain inflation and overall demand, including for imports, in 2016. Consequently, broad money growth of 14.7 percent is expected in 2016, relative to 15.8 in 2015 and private sector credit growth is expected to moderate to 16.2 percent in 2016, relative to 24.6 percent this year. The mission emphasized that strong domestic credit and import growth could be difficult to contain and lead to larger foreign exchange shortages next year. The authorities concurred with the mission that the monetary policy stance would need to be reassessed should external developments worsen.
20. Financial sector indicators have, on aggregate, continued to improve, with non-performing loans continuing to decline. Staff inquired about possible signals of overheating indicated by the pace of credit growth, particularly in the construction and hotel sectors. The NBR responded that it is in the process of reinforcing financial supervision, including macro-prudential analysis, but emphasized that a significant part of the construction boom was being financed from external sources and not by domestic banks.
21. Reforms are ongoing to bolster the operational and supervisory frameworks. The NBR is continuing efforts to develop the interbank and secondary markets to improve the monetary transmission mechanism and to bolster financial inclusion and deepening. One new private bank has started operations, but rigid lending rates remain an ongoing concern. The authorities are finalizing the plans to consolidate savings and credit cooperatives (SACCOs), and to strengthen the AML/CFT framework. Draft laws to

RWANDA
10 INTERNATIONAL MONETARY FUND
MEFP ¶37-39
improve central bank oversight over non-banks are underway, as is a law to allow establishment of private pensions. A revised deposit insurance law will extend protection to smaller depositors.
D. External policies 22. The current account deficit is projected to increase further in 2016, to over 15 percent of GDP, following recent trends and cyclical developments (Figure 4). Due to imports growing faster than exports both trade and current account deficits have increased gradually, exacerbated by a trend from external grants to loans. Recent trends in mining contributed to weak exports in 2015 and should continue to do so in 2016, before the situation is expected to stabilize. Monetary and exchange rate policies should help contain private import demand, but the purchases and leases of aircraft by RwandAir and imports for the Kigali Convention Center (KCC) will lead to a temporary spike in imports in 2016. Financing for government imports will be provided by donors’ agreement to accelerate 2017 budget support into the second half of 2016, and non-concessional loans for RwandAir and KCC.
23. The authorities agreed that continued flexible exchange rate policies will be the principal tool for alleviating external pressures. The authorities agreed that continued exchange rate flexibility would be needed to restrain import demand, given the drop in projected inflows. The mission expressed concerns that modest adjustment of the monetary stance, combined with the projected fiscal stance, might be inadequate to moderate still-strong import demand. The authorities felt that some use of reserve buffers in 2016 would be appropriate to cushion adjustment while the effects and duration of the shock are still being evaluated.
3rd PSI Rev. Proj. change
3rd PSI Rev. Proj. change
Current account (incl. grants) -947 -1197 -249 -957 -1308 -351
Mineral exports 211 110 -100 248 99 -149
Fuel imports -256 -232 24 -309 -242 68
RwandAir imports -28 -31 -3 0 -176 -176
Net Services1 -45 -183 -139 0 -117 -117
Capital/Financial Account 808 1139 331 1229 1248 19
Public sector borrowing 377 524 146 448 680 232
Amortization2 -36 -36 0 -40 -121 -81
Other capital3 -115 -23 92 321 138 -184
Overall balance -139 -103 36 272 -61 -332
1Mainly reflecting accelerated construction of Kigali Convention Center2Including refinancing of aircraft purchases. 3Including NFA of commercial banks.
Summary of Main Changes to External Projections
2015
(US$ millions)
2016

RWANDA
INTERNATIONAL MONETARY FUND 11
24. Over the medium term, the authorities are taking numerous measures to support export diversification and private sector investment. The Rwandan Development Board and the Ministry for Trade and Industry are engaged in a number of activities to attract investors and encourage exports (Box 2). In particular, tourism is a central aspect of the export strategy, with an already-evident increasing attractiveness for business tourism.
Box 2: Rwanda’s Export Diversification Strategy and the “Northern Corridor” Rwanda’s ambitious development goals give rise to forex needs that have necessitated a strong focus on expansion and diversification of the export sector and reducing the costs of trade. Elements of the strategy include: The MICE (meetings, incentives, conferences, events) strategy, which aims to accommodate more
and larger-scale business events/tourism. The Kigali Convention Center is a key ingredient and is anticipated to be finished for the May 2016 World Economic Forum (Africa), as well as numerous other high-level conferences scheduled in 2016. Four new executive hotels are under construction and RwandAir is scaling up, including new routes (e.g. India and China). It is hoped that growth of tourism-related receipts will increase to 20 percent per year in 2017-18.
Development of Special Economic Zones (SEZs), recognizing the need to broaden and increase the value-added of Rwanda’s exports. The SEZs provide needed business infrastructure in a single location (“plug and play”), e.g. electricity, internet, proximity to the airport, and benefit from preferential tax treatment. In the first phase of Kigali’s SEZ, 61 businesses have been established in the space of two years, exporting, for example, garments, baby food, airline food, and green beans.
Trade with DRC, which has increased significantly in recent years, arising mainly from the export of non-traditional crops and re-exporting goods initially intended for the Rwandan market. Re-exports have increased as a share of total goods exports to 26 percent, up 15 points from 5 years ago. The World Bank recently initiated new project financing, shared between DRC, Rwanda and Uganda, to provide logistical support at the Lake Kivu border crossings.
Opening up the “Northern Corridor”—in negotiations with Uganda and Kenya—to reduce the costs of transport and increase operational efficiency. Achievements so far include: a single network area with reduced roaming charges; use of national IDs for travel; a single tourist visa; reduced intra-country airfares; waiver of work permit fees; single custom-cargo tracking system; reduced days of transport for cargo trucks from Mombasa (from 16 to 4-5 days from Mombasa to Kampala, and from 22 to 8 days to Kigali). Construction of a long-awaited railway line is underway between Mombasa and Nairobi.

RWANDA
12 INTERNATIONAL MONETARY FUND
PROGRAM RISKS 25. The growth and external outlook is subject to downside risks. The authorities and staff agreed on a growth projection of 6.3 percent for 2016. This reflects continued implementation of accommodative fiscal policies and strong performance in construction and business tourism, with the long-delayed Kigali Convention Centre coming into operation as well as progress on various power projects. However, a more profound impact on mining than expected, more fiscal and monetary adjustment than currently foreseen, or a shock affecting business tourism could result in lower growth. Another risk is that the mix of agreed policies may prove insufficient should the shock intensify.
26. A worsening of the situation in Burundi could have implications for Rwanda. About 75,000 of the estimated 200,000 refugees have crossed into Rwanda. The government, with support from development partners, has set up camps to accommodate and provide for the refugees. Notwithstanding higher government spending for humanitarian and peacekeeping operations, this has also increased the demand for imports and foreign exchange.
PROGRAM MODALITIES 27. Table 1 of the MEFP contains minor revisions to end-December 2015 quantitative targets and sets new targets for end-June 2016. All modifications to end-December targets represent more stringent program targets as compared to the 3rd review of the program, except for the target on accrual of general government domestic debt. This was increased somewhat to allow for bridge financing of Q4 expenditures, which will ultimately be covered by donor support that tends to come very late in the year. The NDF target is tightened substantially, reflecting a shift in the mix between domestic and more frontloaded external financing.
28. Proposed program monitoring has been altered to reflect the IMF’s new debt limit policy. A new QAC has been introduced on the overall fiscal deficit. However, given difficulties in reconciling external-financed project spending and financing, for an initial period the deficit will be measured on a commitment basis with an adjustor added to account for discrepancies in externally-financed investment spending. Limits on net domestic financing and non-concessional borrowing will be retained as indicative targets. The authorities favored retaining a modified version of the latter target, noting that it has historically been relevant only for state-owned enterprises, which are not captured under a central government fiscal deficit criterion. Since all concessional borrowing takes place via the central government, the new QAC and IT provide universal coverage of accrual of new external debt.
29. Forward-looking structural benchmarks are contained in MEFP table 2. These include rephasing of some reforms that were scheduled for end-December 2015, notably a study on agricultural taxes (which has faced delays in identifying an expert). The end-December measure to migrate one district of Kigali to the new system for real estate taxes has been removed since the

RWANDA
INTERNATIONAL MONETARY FUND 13
new fixed asset law will require all districts to migrate concurrently in early 2016. New proposed structural reforms were agreed through the end of the program period, including in the aforementioned areas of increasing tax revenues, strengthening public financial management and deepening financial markets.
STAFF APPRAISAL 30. Progress in stimulating high growth, reducing poverty, and maintaining macroeconomic stability has continued. As evidenced in growth rates and improved household survey indicators, Rwanda’s performance continues to be strong. Forward-looking policies to sustain growth, create jobs, and improve resilience to external shocks over the medium term should continue these trends. The public investment program is focused on growth-enhancing infrastructure and productivity-enhancing education and health programs. The government’s active efforts to encourage private investment, diversify exports, and develop niche tourism should help shift the balance of growth towards the private sector and make the country less vulnerable to commodity price movements and trends in external development assistance.
31. Ongoing structural reforms will reinforce the foundation for sustained and inclusive medium-term growth, while strengthening resilience. Continued efforts to boost domestic revenue collection should yield fruit, while better investment planning, more transparent budget execution and improved public financial accounting should make public spending more efficient. NBR efforts to expand access to financial services and deepen financial markets can help provide needed capital for more private sector-led growth, and prepare the country for integration with larger markets within the EAC and beyond. The authorities’ focus on a conservative external borrowing strategy is appropriate to maintain a low-risk debt position. With the change in program debt limits, attention to rigorous debt sustainability analysis and tracking public sector contingent liabilities become even more critical.
32. The current shock to mineral exports requires continued exchange rate flexibility. The decline in mineral exports underscores the importance of the authorities’ efforts already underway to diversify and expand the export base. Continued exchange rate flexibility will help cushion the shock, while some use of reserve buffers will avoid sharp adjustment for the time being, although efforts to rebuild buffers over the medium term will be needed.
33. In the short term, downside risks remain. The external position remains vulnerable to further shocks to mineral exports, and the front-loading of donor support in 2015/16 will put pressure on financing in the subsequent year. Hence, the authorities should be prepared to act quickly if additional fiscal and monetary policy adjustment is needed. Notably, the NBR should stand ready to tighten the monetary stance if external circumstances and/or the foreign exchange constraint worsen. Reserve levels, while declining, remain adequate for now, but will eventually need to be buttressed to restore buffers and improve external resilience.
34. Staff recommends completion of the fourth review under the PSI and revision of
end-December quantitative and structural program targets.

RWANDA
14 INTERNATIONAL MONETARY FUND
Figure 1. Rwanda: Recent Economic Performance
Sources: Rwandan authorities, IMF staff estimates.
Exports have not kept up with import demand.
Services remain an important driver for growth.
While aid flows have trended away from budget grants.
The tax effort, while improving, remains
below EAC objectives.
-40
-30
-20
-10
0
10
20
30
40
2000 2002 2004 2006 2008 2010 2012 2014
Imports of G&SExports of G&STrade Balance
Trade Balance(Percent of GDP)
Investment spending has increased
gradually.
0
2
4
6
8
2009 2010 2011 2012 2013 2014 2015
BNR Gross Reserves (in months of next year G& S imports)
Official reserves have been gradually declining.
0
5
10
15
20
25
30
35
2009 2010 2011 2012 2013 2014 2015
Expenditure(Percent of GDP)
Capital expenditureCurrent expenditure
0
2
4
6
8
10
12
14
16
18
2009 2010 2011 2012 2013 2014 2015
Aid Flows(Percent of GDP)
Budget grants Budget loansProject Grants Project loans0
2
4
6
8
10
2009 2010 2011 2012 2013 2014 2015
Contributions to Real GDP,(Percent)
Services AgricultureIndustry Real GDP growth
0
5
10
15
20
25
30
35
2009 2010 2011 2012 2013 2014 2015
Resources(Percent of GDP) Nontax revenue
Other Taxes
Tax on goods and services

RWANDA
INTERNATIONAL MONETARY FUND 15
Figure 2. Rwanda: Selected High Frequency Indicators of Economic Activity
Source: Rwandan authorities' estimates.
-2
0
2
4
6
8
10
12
Q1
Q2
Q3
Q4
Q1
Q2
Q3
Q4
Q1
Q2
Q3
Q4
Q1
Q2
2012 2013 2014 2015
Real GDP
Composite indicator
Real GDP Growth(percent, y/y)
1015202530354045505560
Jan-
12
May
-12
Sep-
12
Jan-
13
May
-13
Sep-
13
Jan-
14
May
-14
Sep-
14
Jan-
15
May
-15
Sep-
15
Cement Production and Imports, (thousand of tons)
10
15
20
25
30
35
40
45
50
Jan-
12
May
-12
Sep-
12
Jan-
13
May
-13
Sep-
13
Jan-
14
May
-14
Sep-
14
Jan-
15
May
-15
Sep-
15
Electricity Production (GWH)
60
110
160
210
260
310Ja
n-12
May
-12
Sep-
12
Jan-
13
May
-13
Sep-
13
Jan-
14
May
-14
Sep-
14
Jan-
15
May
-15
Sep-
15
VAT Receipts(constant price, Feb, 2009=100)
0
50
100
150
200
250
300
Jan-
12
May
-12
Sep-
12
Jan-
13
May
-13
Sep-
13
Jan-
14
May
-14
Sep-
14
Jan-
15
May
-15
Sep-
15
Mining Exports (tons)
0
50
100
150
200
250
300
350
400
Jan-
12
May
-12
Sep-
12
Jan-
13
May
-13
Sep-
13
Jan-
14
May
-14
Sep-
14
Jan-
15
May
-15
Sep-
15
Consumption imports(constant price, RWF millions)

RWANDA
16 INTERNATIONAL MONETARY FUND
Figure 3. Rwanda: Monetary Developments
Sources: Rwandan authorities, IMF staff estimates.
-4
0
4
8
12
16
20
24
28
Jan-
12
Apr-
12
Jul-1
2
Oct
-12
Jan-
13
A pr-
13
Jul-1
3
Oct
-13
Jan-
14
Apr-
14
Jul-1
4
Oct
-14
Jan-
15
A pr-
15
Jul-1
5
Oct
-15
Policy rate Saving Lending
Real Interest Rates(Based on projected 12 month inflation)
Real lending rates remain high...
-5
0
5
10
15
20
25
Feb-
12
Jun-
12
Oct
-12
Feb-
13
Jun-
13
Oct
-13
Feb-
14
Jun-
14
Oct
-14
Feb-
15
Jun-
15
Oct
-15
HeadlineCoreFoodEAC excl. Rwanda
Inflation (y/y)
... in a context of mostly stable inflation
0
15
30
45
60
Jan-
12
May
-12
Sep-
12
Jan-
13
May
-13
Sep-
13
Jan-
14
May
-14
Sep-
14
Jan-
15
May
-15
Sep-
15
Broad money
Reserve money
Broad Money and Reserve Money(percent y/y)
Money growth reflects strong domestic activity..
0
10
20
30
40
50
60
Jan-
12
May
-12
Sep-
12
Jan-
13
May
-13
Sep-
13
Jan-
14
May
-14
Sep-
14
Jan-
15
May
-15
Sep-
15
Credit to the Private Sector(percent y/y)
....and credit growth remains buoyant.
-300
-225
-150
-75
0
75
150
225
300
0
200
400
600
800
1000
1200
Jan-
12
May
-12
Sep-
12
Jan-
13
May
-13
Sep-
13
Jan-
14
May
-14
Sep-
14
Jan-
15
May
-15
Sep-
15
Change in NFA (RHS)
Net foreign assets
NFA of Central Bank (US$ millions)
Notwithstanding NFA draw down by the central bank....
-80
-40
0
40
80
120
0
50
100
150
200
250
300
350
Jan-
12
May
-12
Sep-
12
Jan-
13
May
-13
Sep-
13
Jan-
14
May
-14
Sep-
14
Jan-
15
May
-15
Sep-
15
Change in NFA (RHS)
Net foreign assets
NFA of Commercial Banks(US$ millions)
...a tight forex situation has resulted in large NFA use by commercial banks.
RWANDA
INTERNATIONAL MONETARY FUND 17
Figure 4. Rwanda: External Sector Developments
Sources: Rwandan authorities, IMF staff estimates.
-40
-20
0
20
40
60
80
100
120
Jan-
12
Apr-
12
Jul-1
2
Oct
-12
Jan-
13
Apr-
13
Jul-1
3
Oct
-13
Jan-
14
Apr-
14
Jul-1
4
Oct
-14
Jan-
15
Apr-
15
Jul-1
5
Growth in Imports and ExportsUS$ terms, y/y change
Imports
Exports
80
85
90
95
100
105
110
115
120
125
Jul-1
4
Aug-
14
Sep-
14
Oct
-14
Nov
-14
Dec
-14
Jan-
15
Feb-
15
Mar
-15
Apr-
15
May
-15
Jun-
15
Jul-1
5
Aug-
15
Sep-
15
Burundi Kenya Rwanda Tanzania Uganda
EAC: Real Effective Exchange Rates (Index, July 2014=100)
80
85
90
95
100
105
110
115
120
Jul-1
4
Aug-
14
Sep-
14
Oct
-14
Nov
-14
Dec
-14
Jan-
15
Feb-
15
Mar
-15
Apr-
15
May
-15
Jun-
15
Jul-1
5
Aug-
15
Sep-
15
Burundi Kenya Rwanda Tanzania Uganda
EAC: Nominal Effective Exchange Rates(July 2014=100)
100
110
120
130
140
150
160
170
180
190
200
Jan-
12
Apr-
12
Jul-1
2
Oct
-12
Jan-
13
Apr-
13
Jul-1
3
Oct
-13
Jan-
14
Apr-
14
Jul-1
4
Oct
-14
Jan-
15
Apr-
15
Jul-1
5
Trade DeficitUS$ millions
trendline
0
100
200
300
400
2013 2014 2015 2016 2017 2018
Mining Exports, US$ millions
1st Rev 2nd and 3rd Revs 4th Rev0
1
2
3
4
5
6
7
8
2015 2016 2017
Budget Support Grants and Loans(Percent of GDP)
3rd Review 4th Review
Import growth has outstripped export growth.... ....leading to a higher trade deficit....
....which will be further exacerbated by expected mining developments.
Meanwhile, budget support has declined, reducing unencumbered forex flows.
The Rwandan franc has appreciated relative to trading partners...
...but less so in real terms, and exports (vs. imports) are weighted to outside the EAC.

RWANDA
18 INTERNATIONAL MONETARY FUND
Table 1. Rwanda: Selected Economic and Financial Indicators, 2012–18
2012 2013 2014 2018
3rd PSI Rev. Proj.
3rd PSI Rev. Proj. Proj. Proj.
Output, prices, and exchange rate
Real GDP 8.8 4.7 6.9 6.5 7.0 7.0 6.3 6.7 6.8
GDP deflator 6.1 4.7 3.6 4.1 3.3 4.8 4.1 5.1 5.0
CPI (period average) 6.3 4.2 1.8 2.8 2.4 4.3 4.5 5.0 5.0
CPI (end of period) 3.9 3.6 2.1 3.5 4.0 5.0 5.0 5.0 5.0
Core inflation (end of period)12.5 3.8 2.9 … … … … … …
Terms of trade (deterioration, -) -6.1 19.3 -3.4 2.0 4.6 2.5 -2.7 8.9 0.4
Exchange rate (Rwanda franc/US$) 614.3 646.6 682.4 … … … … … …
Real effective exchange rate (depreciation, -) 2.1 -0.5 -3.0 … … … … … …
Money and credit
Broad money (M3) 14.0 15.5 19.0 15.9 15.8 13.1 14.7 16.1 16.1
Credit to non-government sector 35.0 11.1 19.6 19.7 24.6 14.0 14.9 15.0 15.8
Policy Rate (end of period) 7.5 7.0 6.5 6.5 6.5 … … … …
M3/GDP (percent) 20.1 21.1 22.7 23.7 23.8 23.9 24.7 25.5 26.5
NPLs (percent of total loans) 6.0 7.0 6.0 … … … … … …
General government budget
Revenue and grants 24.2 25.1 24.1 22.5 24.3 21.0 24.1 22.0 23.0
of which : tax revenue 13.6 14.5 15.0 … 15.2 … 16.0 15.7 16.2
of which : grants 9.3 8.6 7.4 7.4 6.8 5.7 5.4 3.7 4.3
Expenditure 25.9 27.6 27.7 25.7 27.2 24.0 27.2 24.9 25.2
Current 14.1 14.5 15.1 13.5 14.2 12.9 14.6 14.3 14.3
Capital 11.8 13.1 12.6 12.2 12.9 11.2 12.7 10.6 11.0
Primary balance -2.7 -3.7 -4.2 -3.9 -4.0 -3.9 -3.9 -3.6 -2.9
Overall balance -3.2 -4.5 -4.9 -4.6 -4.9 -4.6 -4.8 -4.6 -3.8
Public debt
Total public debt 17.0 27.1 29.9 33.1 35.1 35.0 41.9 43.6 43.9
of which : external public debt 16.8 22.1 23.7 26.6 28.6 27.7 36.0 37.6 38.2
Investment and savings
Investment 25.1 25.5 25.3 25.3 24.2 25.4 24.7 25.1 25.3
Public 11.8 13.1 12.6 … 12.9 … 12.7 10.6 11.0
Private 13.3 12.4 12.7 … 11.2 … 12.0 14.5 14.3
Savings26.3 9.3 8.7 9.8 5.3 11.0 4.7 8.4 10.6
External sector
Exports (goods and services) 14.0 15.6 16.9 16.6 15.8 16.9 16.8 17.1 17.6
Imports (goods and services)3
34.3 32.5 33.7 32.3 34.3 31.2 36.2 33.6 32.1
Current account balance (including grants) -11.3 -7.4 -11.5 -11.2 -14.5 -10.4 -15.4 -14.0 -11.5
Current account balance (excluding grants) -18.7 -16.3 -16.6 -15.5 -18.9 -14.4 -20.0 -16.7 -14.6
Gross international reserves
In billions of US$ 0.8 1.1 1.0 0.9 0.9 1.2 0.8 0.8 0.9
In months of next year's imports 4.1 5.1 4.2 3.7 3.4 4.0 3.1 3.0 3.0
Memorandum items:
GDP at current market prices
Rwanda francs (billion) 4,437 4,864 5,389 5,974 5,955 6,697 6,589 7,389 8,287
US$ (billion) 7.2 7.5 7.9 … 8.3 … … … …
GDP per capita (US$) 688 696 712 … … … … … …
Population (million) 10.5 10.8 11.1 … 11.4 … 11.7 12.0 12.3
Sources: Rwandan authorities and IMF staff estimates.1 Defined as excluding food and fuel.
2 The savings rate excludes grants.
3 Imports for 2016 reflect purchases of two aircrafts.
(Annual percentage change, unless otherwise indicated)
(Percent of GDP, unless otherwise indicated)
Act.
2015 2016 2017

RWANDA
INTERNATIONAL MONETARY FUND 19
Table 2a. Rwanda: Operations of the Central Government, Fiscal-Year Basis,1 2012/13–2017/18
2012/13 2013/14
3rd PSI Rev. Prel.
3rd PSI Rev. Proj. Proj. Proj.
Revenue and grants 1,101.3 1,338.8 1,355.5 1,418.8 1,462.5 1,478.9 1,598.9 1,767.9
Total revenue 736.4 864.5 948.5 1,002.9 1,104.2 1,104.1 1,271.0 1,434.9 Tax revenue 651.9 763.4 845.6 871.7 975.3 975.3 1,086.5 1,234.6 Direct taxes 282.0 311.6 351.8 375.8 413.7 413.7 469.6 526.9 Taxes on goods and services 315.1 387.0 435.9 432.4 486.4 486.4 539.8 621.3 Taxes on international trade 54.8 64.8 57.9 63.5 75.2 75.2 77.1 86.5 Non-tax revenue 84.5 101.0 102.9 131.2 128.9 128.9 184.5 200.3 Of which : PKO 61.9 81.5 62.3 89.0 70.8 70.8 119.0 129.3
Grants 364.9 474.3 407.0 415.9 358.3 374.7 327.9 332.9 Budget grants 190.0 171.0 166.0 174.9 189.9 205.8 184.4 166.0 Project grants 174.9 303.3 241.0 241.0 168.4 168.9 143.5 166.9
Total expenditure and net lending 1,335.6 1,538.9 1,647.0 1,720.1 1,741.1 1,784.9 1,887.7 2,083.6
Current expenditure 633.9 776.7 794.4 834.1 865.5 899.9 1,009.0 1,121.8 Wages and salaries 168.9 187.9 207.0 203.9 222.0 226.3 248.1 275.2 Purchases of goods and services 123.1 142.5 151.2 159.5 159.8 179.8 187.3 212.3 Interest payments 30.7 40.4 42.9 45.6 54.3 56.1 65.1 71.1 Domestic debt 15.7 14.8 15.6 18.0 24.6 26.4 28.6 31.5 External debt 15.0 25.6 27.3 27.6 29.7 29.7 36.5 39.7
Transfers 230.8 286.8 301.0 304.0 328.7 336.9 357.9 386.1 Exceptional social expenditure2 80.4 119.1 92.3 121.1 100.8 100.8 150.7 177.1
Capital expenditure 564.5 712.0 749.9 769.8 747.3 776.3 767.7 834.7 Domestic 239.4 320.2 400.2 388.5 467.1 488.5 432.1 427.8 Foreign 325.1 391.9 349.7 381.3 280.2 287.8 335.6 406.8
Net lending and privatization receipts 137.2 50.2 79.7 93.2 128.3 108.8 111.0 127.1
Agaciro Development Fund3 23.0 23.0
Primary balance4 -203.6 -159.8 -248.5 -255.7 -224.4 -250.0 -223.7 -244.6
Overall deficit (including grants) -234.3 -200.2 -291.5 -301.3 -278.7 -306.1 -288.8 -315.7
Change in float/arrears5 -9.1 -16.1 -10.0 5.0 -11.4 -26.4 -20.0 -13.2
Overall deficit (incl. grants, cash basis) -243.4 -216.3 -301.5 -296.3 -290.1 -332.5 -308.8 -328.9
Financing 243.4 216.3 301.5 296.3 290.1 332.5 308.8 328.9
Foreign financing (net) 338.6 104.7 183.1 188.2 215.2 239.7 315.0 275.2 Drawings 354.1 115.8 197.7 202.8 233.2 258.7 337.3 299.9 Budgetary loans 16.2 49.5 104.9 103.6 121.4 139.8 145.2 59.9 Project loans 337.9 66.3 92.8 99.2 111.8 118.9 192.1 239.9 Amortization -15.5 -11.0 -14.6 -14.6 -18.0 -19.0 -22.3 -24.7 Net domestic financing -120.0 119.9 118.4 147.1 74.9 92.8 -6.2 53.7 Net credit from banking system -144.3 150.6 136.3 137.8 94.0 92.8 -6.2 53.7 Of which: Import levy/strat. reserve … … … … -19.2 -19.2 -21.1 -24.0 Nonbank sector 24.3 -30.8 -- 9.3 -- -- -- --
Errors and omissions6 24.8 -8.3 -17.9 -39.0 -- -- -- --
Memorandum items:
Priority spending 550.7 626.5 607.6 656.8 673.4 673.4 … …
Sources: Rwandan authorities and IMF staff estimates and projections.1 Fiscal year runs from July to June.2 Includes peacekeeping operations, assistance to victims of genocide, and spending on demobilisaton/reintegration. 3 Reflects the government's contribution to the Agaciro Development Fund. 4 Total revenue minus noninterest expenditure. 5 A negative sign indicates a reduction.6 A negative number implies an overerestimate of financing.
2014/15 2015/16
(Billions of Rwanda francs)
2016/17 2017/18

RWANDA
20 INTERNATIONAL MONETARY FUND
Table 2b. Rwanda: Operations of the Central Government, Fiscal-Year Basis,1 2012/13–2017/18
2012/13 2013/14
3rd PSI Rev. Prel.
3rd PSI Rev. Proj. Proj. Proj.
Revenue and grants 23.7 26.1 23.9 25.0 23.1 23.6 22.9 22.6
Total revenue 15.8 16.9 16.7 17.7 17.4 17.6 18.2 18.3 Tax revenue 14.0 14.9 14.9 15.4 15.4 15.5 15.5 15.8 Direct taxes 6.1 6.1 6.2 6.6 6.5 6.6 6.7 6.7 Taxes on goods and services 6.8 7.5 7.7 7.6 7.7 7.8 7.7 7.9 Taxes on international trade 1.2 1.3 1.0 1.1 1.2 1.2 1.1 1.1 Nontax revenue 1.8 2.0 1.8 2.3 2.0 2.1 2.6 2.6 Of which : PKO 1.3 1.6 1.1 1.6 0.5 1.1 1.7 1.6
Grants 7.8 9.3 7.2 7.3 5.7 6.0 4.7 4.2 Budget grants 4.1 3.3 2.9 3.1 3.0 3.3 2.6 2.1 Project grants 3.8 5.9 4.2 4.2 2.7 2.7 2.1 2.1
Total expenditure and net lending 28.7 30.0 29.0 30.3 27.5 28.5 27.0 26.6
Current expenditure 13.6 15.2 14.0 14.7 13.7 14.3 14.4 14.3 Wages and salaries 3.6 3.7 3.6 3.6 3.5 3.6 3.5 3.5 Purchases of goods and services 2.6 2.8 2.7 2.8 2.5 2.9 2.7 2.7 Interest payments 0.7 0.8 0.8 0.8 0.9 0.9 0.9 0.9 Domestic debt 0.3 0.3 0.3 0.3 0.4 0.4 0.4 0.4 External debt 0.3 0.5 0.5 0.5 0.5 0.5 0.5 0.5 Transfers 5.0 5.6 5.3 5.4 5.2 5.4 5.1 4.9 Exceptional social expenditure2 1.7 2.3 1.6 2.1 1.6 1.6 2.2 2.3
Capital expenditure 12.1 13.9 13.2 13.6 11.8 12.4 11.0 10.6 Domestic 5.1 6.2 7.0 6.8 7.4 7.8 6.2 5.5 Foreign 7.0 7.6 6.2 6.7 4.4 4.6 4.8 5.2
Net lending and privatization receipts 3.0 1.0 1.4 1.6 2.0 1.7 1.6 1.6
Agaciro Development Fund3 0.4
Primary balance4 -4.4 -3.1 -4.4 -4.5 -3.5 -4.0 -3.2 -3.1
Overall deficit (including grants) -5.0 -3.9 -5.1 -5.3 -4.4 -4.9 -4.1 -4.0
Change in float/arrears5 -0.2 -0.3 -0.2 0.1 -0.2 -0.4 -0.3 -0.2
Overall deficit (incl. grants, cash basis) -5.2 -4.2 -5.3 -5.2 -4.6 -5.3 -4.4 -4.2
Financing 5.2 4.2 5.3 5.2 4.6 5.3 4.4 4.2
Foreign financing (net) 7.3 2.0 3.2 3.3 3.4 3.8 4.5 3.5 Drawings 7.6 2.3 3.5 3.6 3.7 4.1 4.8 3.8 Budgetary loans 0.3 1.0 1.8 1.8 1.9 2.2 2.1 0.8 Project loans 7.3 1.3 1.6 1.7 1.8 1.9 2.7 3.1 Amortization -0.3 -0.2 -0.3 -0.3 -0.3 -0.3 -0.3 -0.3 Net domestic financing -2.6 2.3 2.1 2.6 1.2 1.5 -0.1 0.7 Net credit from banking system -3.1 2.9 2.4 2.4 1.5 1.5 -0.1 0.7 Of which: Import levy/strat. reserve -0.3 -0.3 -0.3 Nonbank sector -- -0.6 -- 0.2 -- -- -- --Errors and omissions6 0.5 -0.2 -0.3 -0.7 -- -- -- --
Memorandum items:
Priority spending 11.8 12.2 10.7 11.6 10.6 10.7 … …
GDP (Billions of RwF), FY basis 4,651 5,127 5,682 5,672 6,336 6,272 6,989 7,838
Sources: Rwandan authorities and IMF staff estimates and projections.1 Fiscal year runs from July to June.2 Includes peacekeeping operations, assistance to victims of genocide, and spending on demobilisaton/reintegration. 3 Reflects the government's contribution to the Agaciro Development Fund. 4 Total revenue minus noninterest expenditure. 5 A negative sign indicates a reduction.6 A negative number implies an overerestimate of financing.
(Percent of GDP)
2014/15 2015/16 2016/17 2017/18

RWANDA
INTERNATIONAL MONETARY FUND 21
Table 2c. Rwanda: Operations of the Central Government, Semi-Annual Basis,1 2014/15–2016/17
FY2014/15 FY2015/16 FY2016/17
14-H2 (Prel.)
15-H1 (Prel.)
15-H2 (Proj.)
16-H1 (Proj.)
16-H2 (Proj.)
17-H1 (Proj.)
Revenue and grants 689.0 729.7 719.6 759.3 828.5 770.4
Total revenue 448.1 554.8 491.8 612.3 616.4 654.6 Tax revenue 407.0 464.6 443.1 532.1 521.5 565.0 Direct taxes 167.1 208.7 180.9 232.8 225.4 244.2 Taxes on goods and services 211.2 221.2 227.1 259.3 259.1 280.7 Taxes on international trade 28.8 34.7 35.1 40.0 37.0 40.1 Non-tax revenue 41.0 90.2 48.7 80.2 94.9 89.6
Grants 240.9 175.0 227.8 147.0 212.1 115.8 Budget grants 115.4 59.4 131.1 74.8 140.4 44.0 Project grants 125.5 115.6 96.7 72.2 71.8 71.8
Total expenditure and net lending 798.5 921.5 818.8 966.1 937.9 949.8
Current expenditure 427.3 406.7 440.8 459.1 500.9 508.1 Wages and salaries 101.9 102.0 111.0 115.3 124.1 124.1 Purchases of goods and services 101.6 57.9 99.7 80.1 91.8 95.5 Interest payments 21.8 23.8 27.9 28.2 32.1 33.1 Domestic debt 8.2 9.8 12.3 14.1 14.0 14.6 External debt 13.6 14.0 15.6 14.1 18.0 18.5
Transfers 141.1 162.8 168.1 168.8 175.4 182.5 Exceptional social expenditure2 60.9 60.2 34.1 66.7 77.7 73.0
Capital expenditure 323.4 446.3 323.9 452.3 382.4 385.2 Domestic 128.6 259.9 173.0 315.5 211.7 220.4 Foreign 194.8 186.5 150.9 136.8 170.7 164.9
Net lending and privatization receipts3 47.8 68.4 54.1 54.7 54.6 56.4
Primary balance4 -87.7 -167.9 -71.3 -178.6 -77.4 -146.3
Overall deficit (including grants) -109.5 -191.8 -99.2 -206.8 -109.4 -179.4
Change in float/arrears5 41.7 -36.6 24.2 -50.6 -10.0 -10.0
Overall deficit (incl. grants, cash basis) -67.9 -228.4 -75.0 -257.4 -119.4 -189.4
Financing 67.9 228.4 75.0 257.4 119.4 189.4
Foreign financing (net) 103.5 84.7 185.3 54.4 191.1 123.9 Drawings 110.2 92.6 194.0 64.6 202.2 135.1 Budgetary loans 56.7 46.9 139.8 -- 103.3 42.0 Project loans 53.5 45.7 54.2 64.6 99.0 93.1 Amortization -6.8 -7.9 -8.8 -10.2 -11.1 -11.2 Net domestic financing -0.2 147.3 -110.2 203.0 -71.7 65.6
Net credit from banking system -7.8 145.7 -110.2 203.0 -71.7 65.6 Of which: Import levy/strat. reserve -- -- -9.4 -9.8 -10.4 -10.8
Nonbank sector 7.6 1.6 -- -- -- --
Errors and omissions6-35.4 -3.6 -- -- -- --
Sources: Rwandan authorities and IMF staff estimates and projections.1 Fiscal year runs from July to June.2 Includes peacekeeping operations, assistance to genocide victims, and spending on demobilisaton/reintegration. 3 For the purpose of this presentation, 2014 number includes the contribution to the Agaciro Development Fund.4 Total revenue minus noninterest expenditure. 5 A negative sign indicates a reduction.6 A negative number implies an overerestimate of financing.
(Billions of Rwanda francs)

RWANDA
22 INTERNATIONAL MONETARY FUND
Table 2d. Rwanda: Operations of the Central Government, Calendar-Year Basis,1 2015–17
Proj. Proj. Proj.
Revenue and grants 1,449.3 1,587.8 1,622.3
Total revenue 1,046.6 1,228.7 1,347.4 Tax revenue 907.7 1,053.7 1,157.6 Direct taxes 389.6 458.2 497.1 Taxes on goods and services 448.3 518.4 578.9 Taxes on international trade 69.8 77.1 81.6 Non-tax revenue 138.8 175.1 189.8 Of which : PKO 79.6 112.4 121.5
Grants 402.8 359.1 274.9 Budget grants 190.5 215.1 119.7 Project grants 212.3 144.0 155.2
Total expenditure and net lending 1,740.3 1,904.1 1,958.7
Current expenditure 847.5 960.0 1,059.6 Wages and salaries 213.0 239.4 261.7 Purchases of goods and services 157.6 171.9 199.5 Interest payments 51.7 60.3 68.1 Domestic debt 22.1 28.1 30.0 External debt 29.6 32.1 38.1
Transfers 330.9 344.2 369.0 Exceptional social expenditure2 94.3 144.4 161.2
Capital expenditure 770.3 834.8 780.4 Domestic 432.9 527.2 432.1 Foreign 337.4 307.5 348.3
Net lending and privatization receipts 122.5 109.3 118.7
Primary balance3 -239.3 -256.0 -268.2
Overall deficit (including grants) -291.0 -316.3 -336.4
Change in float/arrears4 -12.4 -60.6 -16.6
Overall deficit (incl. grants, cash basis) -303.4 -376.9 -353.0
Financing 303.4 376.9 353.0
Foreign financing (net) 270.0 245.6 271.8 Drawings 286.7 266.9 295.0 Budgetary loans 186.7 103.3 101.9 Project loans 100.0 163.6 193.1 Amortization -16.7 -21.3 -23.2 Net domestic financing 37.1 131.3 81.2
Net credit from banking system 35.4 131.3 81.2 Of which: Import levy/strategic reserve -9.4 -20.2 -22.5
Nonbank sector 1.6 -- --
Errors and omissions5-3.6 -- --
Sources: Rwandan authorities and IMF staff estimates and projections.1 January to December.2 Includes peacekeeping operations, assistance to victims of genocide, and spending on demobilisaton/reintegration. 3 Total revenue minus noninterest expenditure. 4 A negative sign indicates a reduction.5 A negative number implies an overerestimate of financing.
2015 2016 2017
(Billions of Rwanda francs)
RWANDA
INTERNATIONAL MONETARY FUND 23
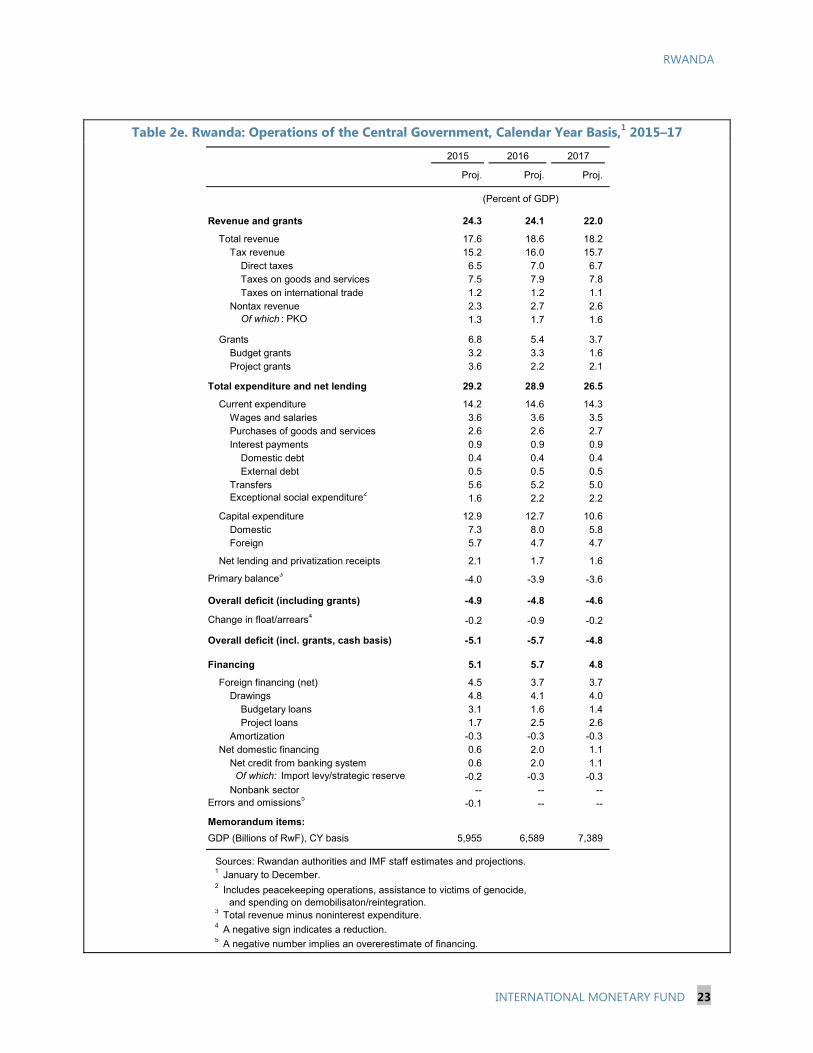
Table 2e. Rwanda: Operations of the Central Government, Calendar Year Basis,1 2015–17
Proj. Proj. Proj.
Revenue and grants 24.3 24.1 22.0
Total revenue 17.6 18.6 18.2 Tax revenue 15.2 16.0 15.7 Direct taxes 6.5 7.0 6.7 Taxes on goods and services 7.5 7.9 7.8 Taxes on international trade 1.2 1.2 1.1 Nontax revenue 2.3 2.7 2.6 Of which : PKO 1.3 1.7 1.6
Grants 6.8 5.4 3.7 Budget grants 3.2 3.3 1.6 Project grants 3.6 2.2 2.1
Total expenditure and net lending 29.2 28.9 26.5
Current expenditure 14.2 14.6 14.3 Wages and salaries 3.6 3.6 3.5 Purchases of goods and services 2.6 2.6 2.7 Interest payments 0.9 0.9 0.9 Domestic debt 0.4 0.4 0.4 External debt 0.5 0.5 0.5 Transfers 5.6 5.2 5.0 Exceptional social expenditure2
1.6 2.2 2.2
Capital expenditure 12.9 12.7 10.6 Domestic 7.3 8.0 5.8 Foreign 5.7 4.7 4.7
Net lending and privatization receipts 2.1 1.7 1.6
Primary balance3-4.0 -3.9 -3.6
Overall deficit (including grants) -4.9 -4.8 -4.6
Change in float/arrears4-0.2 -0.9 -0.2
Overall deficit (incl. grants, cash basis) -5.1 -5.7 -4.8
Financing 5.1 5.7 4.8
Foreign financing (net) 4.5 3.7 3.7 Drawings 4.8 4.1 4.0 Budgetary loans 3.1 1.6 1.4 Project loans 1.7 2.5 2.6 Amortization -0.3 -0.3 -0.3 Net domestic financing 0.6 2.0 1.1 Net credit from banking system 0.6 2.0 1.1 Of which: Import levy/strategic reserve -0.2 -0.3 -0.3 Nonbank sector -- -- --Errors and omissions5
-0.1 -- --
Memorandum items:
GDP (Billions of RwF), CY basis 5,955 6,589 7,389
Sources: Rwandan authorities and IMF staff estimates and projections.1 January to December.2 Includes peacekeeping operations, assistance to victims of genocide, and spending on demobilisaton/reintegration. 3 Total revenue minus noninterest expenditure. 4 A negative sign indicates a reduction.5 A negative number implies an overerestimate of financing.
(Percent of GDP)
2015 2016 2017

RWANDA
24 INTERNATIONAL MONETARY FUND
Table 3. Rwanda: Monetary Survey, 2012–18
2012 2013 2014 2017 2018
3rd PSI Rev. Prelim.
3rd PSI Rev. Proj. Proj. Proj. Proj.
Monetary authorities
Net Foreign Assets1457.1 634.3 585.7 512.9 535.0 524.0 570.8 503.9 522.3 583.3
Net domestic assets -267.7 -421.1 -338.9 -244.4 -262.2 -233.3 -280.1 -176.2 -141.7 -141.2
Domestic credit -218.6 -339.3 -223.1 -121.5 -167.8 -110.4 -173.4 -69.5 -35.0 -34.6
Other items (net; asset +) -49.1 -81.8 -115.8 -122.9 -94.4 -122.9 -106.7 -106.7 -106.7 -106.7
Reserve money2189.3 213.2 246.9 268.5 272.8 290.7 290.7 327.7 380.6 442.0
Commercial banks
Net foreign assets 98.8 109.6 104.6 105.5 64.5 100.3 64.6 44.6 34.6 34.6
Reserves 80.5 95.6 127.6 138.5 134.8 148.7 153.7 169.4 191.8 217.9
Net credit from BNR 58.5 40.6 66.2 68.6 80.9 117.0 14.8 42.2 73.2 88.4
Domestic credit 704.3 866.1 1,047.8 1,047.8 1,259.6 1,225.4 1,307.4 1,475.1 1,669.6 1,904.9
Government (net) 28.2 116.3 145.6 195.7 222.0 145.6 184.0 184.0 184.0 184.0
Private sector 675.1 748.6 896.4 974.0 1,032.6 1,073.9 1,117.6 1,285.3 1,479.8 1,715.0
Other items (net; asset +) -161.0 -201.4 -241.6 -286.9 -250.0 -313.8 -257.4 -257.4 -257.4 -257.4
Deposits 781.1 910.6 1,104.6 1,201.3 1,289.8 1,277.2 1,283.1 1,473.8 1,711.9 1,988.3
Monetary survey
Net foreign assets 555.8 744.0 690.4 618.5 599.5 624.4 635.4 548.5 556.9 617.9
Net domestic assets 334.1 284.2 533.5 712.5 828.3 793.7 781.8 1,076.4 1,330.3 1,573.9
Domestic credit 544.8 570.7 889.6 1,126.1 1,172.3 1,230.8 1,148.3 1,447.3 1,707.4 1,958.2
Government -137.2 -187.4 -21.2 135.3 125.0 141.8 14.7 146.0 211.6 227.2
Public enterprises 1.0 1.3 5.8 5.8 5.0 5.8 5.8 5.8 5.8 5.8
Private sector 681.0 756.8 905.0 985.0 1,042.3 1,087.9 1,127.8 1,295.4 1,490.0 1,725.2
Other items (net; asset +) -210.1 -283.2 -357.4 -409.9 -344.5 -436.8 -364.1 -364.1 -364.1 -364.1
Broad money 889.9 1028.2 1223.9 1330.9 1427.8 1418.0 1417.2 1624.9 1887.2 2191.8
Year on Year Growth
Broad money 14.0 15.5 19.0 8.7 16.7 15.9 15.8 14.7 16.1 16.1
Net foreign assets -17.4 33.9 -7.2 -15.6 -18.2 -11.1 -8.0 -13.7 1.5 11.0
Credit to the private sector 35.0 11.1 19.6 20.6 27.6 20.2 24.6 14.9 15.0 15.8
Memorandum items:
Velocity (eop) 5.0 4.7 4.4 4.5 4.2 4.2 4.2 4.1 3.9 3.8
Money multiplier 4.7 4.8 5.0 4.7 5.2 4.5 4.9 5.0 5.0 5.0
Sources: National Bank of Rwanda (NBR) and IMF staff estimates and projections.1 For program purposes NFA are shown at program exchange rates.
(Billions of Rwandan Francs)
(Percent)
2 Reserve money as an assessment criteria is measured as the average of the months in the quarter. The actual reserve money is measured as the daily average of the three months in the quarter.
2015
June December
2016

RWANDA
INTERNATIONAL MONETARY FUND 25
Table 4. Rwanda: Balance of Payments, 2012–18 2012 2017 2018
Prel.
3rd PSI Rev. Proj.
3rd PSI Rev. Proj. Proj. Proj.
Exports (f.o.b.),1 590.8 703.0 722.7 741.6 664.4 829.8 695.3 759.6 833.7Of which: coffee and tea 126.6 110.4 110.9 119.2 133.1 129.8 139.4 157.1 171.9Minerals 136.1 225.7 203.3 210.5 110.4 248.1 98.9 109.7 122.4
Imports (f.o.b.) 1,967.0 1,851.5 1,995.4 2,031.3 2,011.3 2,154.2 2,227.0 2,210.1 2,338.4Of which: capital goods 471.4 476.9 514.6 547.9 528.8 586.3 550.3 578.6 636.5Fuel 289.1 307.6 304.2 255.9 232.1 309.2 241.6 277.5 320.0
Trade balance -1,376.2 -1,148.4 -1,272.7 -1,289.6 -1,346.9 -1,324.4 -1,531.7 -1,450.5 -1,504.7
Services (net) -85.2 -122.4 -57.6 -44.5 -183.0 -0.1 -117.4 -47.2 72.5Of which: tourism receipts 281.8 293.6 303.7 317.8 317.8 347.8 334.1 400.9 481.1
Income -73.8 -135.3 -156.6 -178.0 -191.3 -193.3 -220.2 -192.0 -201.7Of which: interest on public debt2 -9.2 -32.3 -39.0 -47.7 -47.7 -52.8 -62.0 -87.8 -96.8
Current transfers (net)3 722.5 847.7 578.1 564.7 524.7 560.8 560.9 417.1 500.2Private 183.0 181.4 179.9 194.1 158.5 186.4 168.3 171.0 189.3
Of which: remittance inflows 175.3 161.8 174.9 183.8 161.7 193.8 171.9 174.1 191.2
Public 539.5 666.4 398.2 370.5 366.1 374.5 392.6 246.1 310.9
Current account balance (incl. grants) -812.8 -558.4 -908.8 -947.4 -1,196.6 -957.1 -1,308.4 -1,272.5 -1,133.7
Capital account 171.2 234.5 337.1 300.1 301.9 202.4 202.5 190.6 205.9Financial account 411.2 660.5 587.8 507.8 791.6 1,026.2 1,045.0 1,076.0 1,007.1
Direct investment 159.8 257.6 267.7 281.3 327.0 297.0 348.1 371.2 428.4Public sector capital 110.4 420.6 302.4 341.6 487.8 408.0 559.4 520.2 429.2
Long-term borrowing4 199.8 599.2 335.9 377.5 523.7 448.0 679.9 583.9 470.5
Scheduled amortization5 -89.4 -178.7 -33.5 -35.9 -35.9 -40.0 -120.5 -63.7 -41.3
Other capital6 141.0 -17.7 17.7 -115.0 -23.2 321.2 137.5 184.6 149.5
Capital and financial account balance 582.5 895.0 924.9 808.0 1,093.5 1,228.6 1,247.5 1,266.6 1,213.0
Errors and omissions 24.8 -42.8 -163.9 0.0 0.0 0.0 0.0 0.0 0.0
Overall balance -205.5 293.8 -147.8 -139.4 -103.0 271.5 -60.8 -6.0 79.3
Financing 205.5 -293.8 147.8 139.4 103.0 -271.5 60.8 6.0 -79.3
Change in NFA of NBR (increase -) 205.5 -293.8 147.8 139.4 103.0 -271.5 60.8 6.0 -79.3Net credit from the IMF -1.0 -1.7 -2.4 -2.7 -2.6 -2.2 -2.2 -1.8 -1.1
Disbursements/purchases 0.0 0.0 0.0 0.0 0.0 0.0 0.0 0.0 0.0Repayments/repurchases -1.0 -1.7 -2.4 -2.7 -2.6 -2.2 -2.2 -1.8 -1.1
Change in other gross reserves (increase -) 206.6 -292.1 150.2 142.1 105.6 -269.3 63.0 7.8 -78.2 Change in other foreign liabilities (increase + 0.0 0.0 0.0 0.0 0.0 0.0 0.0 0.0 0.0
Financing gap 0.0 0.0 0.0 0.0 0.0 0.0 0.0 0.0 0.0
Memorandum items: Current account deficit (percent of GDP)
Including official transfers -11.3 -7.4 -11.5 -11.2 -14.5 -10.4 -15.4 -14.0 -11.5Gross official reserves 843.5 1,135.5 985.3 879.7 879.6 1,149.0 790.0 782.2 860.4 in months of prosp. imports of G&S 4.1 5.1 4.2 3.7 3.4 4.0 3.1 3.0 3.0 using imports of goods cif7 4.2 5.3 4.4 4.1 3.7 4.9 3.2 3.1 3.1Overall balance (percent of GDP) -2.8 3.9 -1.9 -1.6 -1.2 2.9 -0.7 -0.1 0.8Total Public Transfers (US$ million) 710.7 900.9 735.3 670.7 668.0 576.9 595.1 436.6 516.7
Of which : budgetary grants 370.9 279.2 217.8 239.1 264.7 245.2 277.8 147.0 218.8Budgetary Loans (US$ million) 30.1 50.8 154.9 109.5 259.4 155.9 133.4 125.1 40.1 Total Public Transfers (percent of GDP) 9.8 12.0 9.3 7.9 8.1 6.3 7.0 4.8 5.2
Sources: Rwandan authorities and IMF staff estimates and projections.1 From 2010 onward includes the results of the informal cross-border trade survey.2 Including interest due to the IMF.3 Current transfers include disbursed budgetary and HIPC grants and humanitarian and technical assistance. 4 Includes project and budgetary loans.5 Excluding payments to the IMF. 6 Other capital includes long-term private capital, commercial credit, change in NFA of commercial banks, and unrecorded imports. 7 Authorities' definition.
(Millions of U.S. dollars, unless otherwise indicated)
2013 2014 2015 2016

RWANDA
26 INTERNATIONAL MONETARY FUND
Table 5. Rwanda: Financial Soundness Indicators for Banking Sector, 2012–15
2012
Dec Dec Mar Jun Sep Dec Mar Jun
Capital adequacy Regulatory capital to risk-weighted 21.4 20.8 20.5 21.2 21.7 21.4 23.3 21.6 Capital to assets 23.9 23.1 22.6 23.6 24.0 24.2 25.9 24.3 Off-balance items/qualifying capital 233.3 405.3 395.1 379.4 361.3 327.5 282.6 352.5 Insider loans/core capital 3.6 4.2 4.1 4.3 3.6 3.4 2.1 2.8 Large exposure/core capital 41.0 56.9 70.1 74.6 69.0 83.6 82.3 107.2
Asset quality NPLs/gross Loans 6.0 7.0 6.7 6.6 6.3 6.0 6.3 5.9 NPLs net/gross loans 5.4 6.1 5.6 5.5 5.5 5.1 4.9 4.9 Provisions/NPLs 53.7 53.0 56.4 50.0 55.3 56.8 52.3 51.5 Earning assets/total asset 79.9 78.6 82.1 80.6 83.0 93.1 79.3 81.8 Large exposures/gross loans 9.1 11.9 15.1 15.8 14.8 17.7 19.3 22.5
Profitability and earnings Return on average assets 2.2 1.5 2.3 2.1 1.9 1.9 2.7 2.4 Return on average equity 10.4 7.3 11.9 12.1 10.9 10.8 14.1 13.1 Net interest margin 9.7 9.5 9.2 8.7 8.2 7.9 8.7 8.9 Cost of deposits 2.9 3.8 4.1 3.4 3.2 3.4 3.1 3.1 Cost to income 81.0 85.3 80.7 81.5 82.2 82.1 79.4 78.6 Overhead to income 54.7 52.5 49.2 48.8 49.3 49.4 43.6 46.0
Liquidity Short term gap 12.1 14.8 13.8 11.0 9.8 5.3 9.9 11.6 Liquid assets/total deposits 41.2 49.4 46.3 54.2 54.0 51.7 46.0 49.5 Interbank borrowings/total deposits 9.2 11.3 16.2 15.1 14.2 11.6 13.7 15.9 BNR borrowings/total deposits 0.1 -- -- -- -- 6.1 -- -- Gross loans/total deposits 91.9 86.4 86.1 76.4 79.7 90.4 86.6 84.2
Market sensitivity Forex exposure/core capital1 -0.6 -2.2 -12.6 -1.5 -4.8 -2.2 -5.5 -7.1 Forex loans/Forex deposits 4.4 8.3 11.0 12.7 16.2 29.5 27.1 32.6 Forex assets/Forex liabilities 78.9 87.3 79.4 84.8 82.6 84.7 83.2 82.1
Source: National Bank of Rw anda.
(Percent)
2013 2014 2015

RWANDA
INTERNATIONAL MONETARY FUND 27
Table 6. Rwanda: Quantitative Assessment Criteria and Indicative Targets as of end-June 20151
ProgramAdjusted Program Actual Status
Assessment criteria 2
Net foreign assets of the NBR at program exchange rate 512.9 513.9 516.3 Met
(floor on stock) 3, 4
Reserve money (ceiling on stock) (upper bound) 5 273.6 273.6 Met
Reserve money (ceiling on stock) 5 268.2 267.0
Reserve money (ceiling on stock) (lower bound) 5 262.8 262.8
Net domestic financing (ceiling on flow) 4, 6 153.9 152.9 143.7 Met
New nonconcessional external debt contracted or guaranteed by the public sector(US$ millions) (ceiling on stock) 500.0 101.5 Met
External payment arrears (US$ millions) (ceiling on stock) 0.0 0.0 Met
Indicative targetsDomestic revenue collection (floor on flow) 6 467.9 495.6 Met
Net accumulation of domestic arrears (ceiling on flow) 6 -26.7 -36.6 Met
Consolidated domestic debt of public sector (ceiling on stock, eop) 4, 7 481.5 486.2 Not met
Total priority spending (floor on flow) 6 331.2 380.5 Met
Memorandum items:Total budget support (US$ millions) 6, 8 139.2 -7.7 146.8
Budget support grants (US$ millions) 69.2 80.6Budget support loans (US$ millions) 70.0 66.2
Euro bond (US$ millions) 400.0 400.0 Unused euro bond proceeds (US$ millions) 75.8 9.1 66.7
Sources: Rwandan authorities and IMF staff estimates and projections.
2 Assessment criteria for non-concessional external borrowing and arrears are continuous3 End-June 2015 program numbers are at the old program exchange rate of RWF694.4.
5 Targets are an arithmetic avg. of the stock of reserve money for the 3 months in the quarter. AC applies to upper bound only.
1 All items including adjusters are defined in the Technical Memorandum of Understanding (TMU).
Jun 2015
(Billions of Rwandan francs, unless otherwise indicated)
4 Subject to adjustors. See TMU for details.
6 Numbers for 2015 are cumulative from 12/31/2014. The figure excludes demobilization and AU peace keeping operations.7 Excluding NBR's debt issued for monetary policy purposes. 8 Excluding demobilization and African Union peace keeping operations, HIPC grant, and COMESA compensation grant.

RWANDA
28 INTERNATIONAL MONETARY FUND
Table 7. Rwanda: Status of Structural Benchmarks for 4th Review
Policy Measure Target Date Status
Revenue Mobilization
Revise law on Decentralized Local government taxes to enable the migration from Land Lease Fees to Fixed Asset Tax
End-June 2015 Met
Prepare legislative proposal for new tax regime for mining. End-Sep 2015 Met
Fully migrate one district in Kigali from Land Lease Fee to Fixed Asset Tax End-Dec 2015
Prepare study on new tax regime for agriculture. End-Dec 2015 Rephased to March 2016
Prepare legislative proposal for new tax regime for agriculture. End-June 2016 Delayed beyond program period
Public Financial Management
MINECOFIN to publish (and put on its website) quarterly reports of budget execution against annual fiscal policy objectives, within 45 days of end of each quarter.
Continuous, starting mid-May 2015
Not met, revised and rephased to March 2016
Sub-national entities (416) to produce monthly, quarterly, and annual financial reports using a uniform template.
End-Dec. 2015 Ongoing
Monetary and Exchange Rate Policy
Start issuing government bonds with maturities of 7 and 10 years End-June 2015 Met

RWANDA
INTERNATIONAL MONETARY FUND 29
Appendix I. Letter of Intent
Kigali, Rwanda December 17, 2015
Ms. Christine Lagarde Managing Director International Monetary Fund 700 19th Street, N.W. Washington, D.C., 20431
Dear Ms. Lagarde,
The attached memorandum of economic and financial policies (MEFP) is an update of the April 2015 MEFP and sets out the macroeconomic policies of the Rwandan government for the remainder of fiscal year 2015/16 and the medium term.
Although growth has been stronger than expected in 2015, with projections revised upward to 7%, an unanticipated external shock to Rwanda’s main commodity export has begun to unfold this year. A sharp drop in mineral prices and in global demand for those products has resulted in an unexpected significant loss of export receipts and international reserves of the banking system. Inflation has remained low with an annual average of 2.0% through end-September, reflecting the general decline in international energy prices and solid agricultural harvest.
Program performance under the new PSI has been reasonable. All end-June 2015 quantitative Assessment Criteria (QAC) were met. However one of the four indicative targets was not met. As a result of bridge financing to compensate for delays in donor disbursements for peacekeeping operations, the target on the consolidated domestic debt of the public sector was exceeded by a small margin.
Despite some setbacks, the government believes its performance continues to reflect its commitment to sound policies, and it thereby requests the completion of the fourth review under the PSI. Based on the revised forward-looking macroeconomic framework, the government also requests modification of the quantitative assessment criteria for end-December 2015 and approval of new targets for end-June 2016.
The government believes that the policies and measures set forth in the MEFP will deliver the objectives of the PSI-supported program but we will take any further measures that may become appropriate for this purpose. The Government will consult with the IMF—at its own initiative or whenever the Managing Director of the IMF requests such a consultation—before the adoption of any such measures or changes to the main policies described in the attached MEFP.
The government will provide the IMF with such information as the IMF may request in connection with the progress made in implementing the economic and financial policies and achieving the objectives of the program. The fifth review will take place before end-June 2016.

RWANDA
30 INTERNATIONAL MONETARY FUND
The Government of Rwanda authorizes the publication and distribution of this letter, its attachments, and all reports prepared by the IMF staff.
Sincerely yours,
/s/ /s/
Claver Gatete John Rwangombwa Minister of Finance and Economic Planning Governor, National Bank of Rwanda

RWANDA
INTERNATIONAL MONETARY FUND 31
Memorandum of Economic and Financial Policies—Update December 17, 2015
1. This MEFP update reviews performance under the PSI-supported program through end-June 2015 and discusses the macroeconomic outlook and policies for the remainder of FY2015/16 and outlines broad macroeconomic policy intentions for the medium term, past the expiry of the PSI-supported program. It also lays out proposed quantitative and structural targets for end-December 2015 and end-June 2016. As has been the case in the past, policy formulation in all areas takes into account Rwanda’s commitments to the East African Community.
Recent Economic and Policy Performance
Introduction
2. Rwanda experienced a strong economic performance in the first semester of the year. GDP expanded by 7.0 percent year-on-year in the second quarter of 2015, following growth of 7.6 percent in the first quarter, yielding a 2015 first semester growth rate of 7.3 percent. Year-over-year inflation in October 2015 was 2.9 percent, with an annual average rate at 2.0 percent. Overall inflation throughout 2015 has been moderated, mainly by the decline in international energy prices.
Growth and Inflation
3. Looking at the first semester of 2015, industry rebounded compared to 2014, with growth of 8.5 percent. Within the sector, growth was driven by construction, which grew by 13.0 percent. It contributed one percentage point to total GDP growth. Mining dragged the industry sector’s overall growth down (contracting by 7.0 percent in the first half of the year), due to weak international prices for minerals. Manufacturing is recovering, following a weak performance by the main brewery in 2014.. Services expanded by 7.0 percent in the first semester of 2015. The retail and wholesale trade sub-sector was the main driver of growth, as usual, but information and communication services have also been rapidly expanding, albeit from a small base. This is due to the impact of foreign investment in the sector in recent years.
4. From the demand side, the strength of private sector activity is very evident in the first nine months of the year, supported by an expansion of private sector credit of 20.9 percent. Private consumption also expanded by 12.5 percent in the first semester of 2015, despite the aforementioned decline in minerals earnings, which negatively affected incomes and consumption of those citizens and their families that depend on mining. Government consumption contracted compared to the year before (reflecting back loading of current expenditure to the second half of fiscal year 14/15, i.e. in the January-June 2015 period), yet private sector activity was not impacted. In fact, its expansion in the first semester was the highest on record since 2008. Consumer spending has been stimulated by a low price environment, and also supported by the influx of many Burundians resettling in urban areas of Rwanda. Investment growth mirrored the growth in construction on the supply-side.

RWANDA
32 INTERNATIONAL MONETARY FUND
5. Inflation, both headline and core, was well contained, with the former standing at 2.9 percent year-on-year in October 2015 and the latter at 1.3 percent. Average headline inflation of 2.0 percent for the year is one of the lowest rates in the last decade, reflecting both low food and energy prices in the earlier months of the year. September’s year-on-year inflation of 3.7 percent was the highest rate so far in 2015, reflecting typical food price behavior at this time of the year between the two main harvests and utility price increases (paragraph 5). Imported inflation has contributed very little to rising prices so far in 2015, as the Franc, while depreciating by about 6 percent against the USD, has appreciated against the currencies of most of the regional trading partners such as Uganda, Tanzania, and Kenya. Moreover, the favorable energy price environment has quelled inflation during the year and, given Rwanda’s land-locked status, also reduced unit prices for all other import categories (capital, intermediate and consumption goods). However, administered retail fuel prices did not capture the full drop in international prices . The price of food imports has contracted by 10.9 percent this year, which has further kept inflation subdued.
6. On 1st September 2015, utility prices increased in Rwanda. Electricity prices increased for low-voltage users (i.e. residential and small businesses) by 35 percent; there was no increase for high-voltage (i.e. industrial) users. Water is charged on a per use basis, but the average price increase was 19 percent. Water prices had not risen in a decade. The impact on inflation (and consumer expenditure) is expected to be temporary. No impact is expected for industrial production as electricity prices for that category of consumers remain unchanged. The impact of water prices are expected to rise but will have very small effect on overall inflation. Despite this one-off increase in prices, more fundamental inflationary pressures are however expected to remain low.
External developments
7. Overall, the trade deficit has narrowed slightly so far in 2015. At US$1.32 billion for the first nine months, the deficit is 1.9 percent less than the same period a year ago. The fall in mineral export prices has been offset by the fall in energy import prices, but this offsetting impact is expected to taper in the rest of the year and into 2016. However, the overall balance of payments was in deficit and, as programmed, there has been substantial use of central bank reserves over the course of the year. However, this would have been larger still, if there had not been significant use of commercial bank reserves.
8. Between January and September of this year, formal imported goods contracted by 3.0 percent. This drop is primarily caused by a decline in energy prices (with US$ unit values of energy imports down 30.6 percent compared to the same nine month period the year previously), which was partly offset by franc depreciation. On a volume basis, capital imports grew by 14.8 percent while intermediates expanded by 10 percent in the year to September. These trends have supported real GDP growth so far during the year, particularly in the construction and manufacturing sectors.
9. Formal exports contracted by 6.4 percent over the first nine months of this year compared to the same period a year ago, due to a 40 percent drop in the value of minerals exports in the first three quarters compared to the previous year. Prices for coltan, cassiterite (tin), and wolfram fell

RWANDA
INTERNATIONAL MONETARY FUND 33
sharply, mirroring global demand for such commodities. On the other hand, non-traditional exports (composed of horticultural, milling, agricultural and construction products) have performed very well in the first 9 months of 2015, expanding by 15.9 percent. These exports have higher value added compared to traditional commodity exports and serve regional trading partners, boding well for more resilient export performance over time. The one traditional export to perform well in the first three quarters of 2015 was tea, where large international price increases and a good harvest resulted in a 42.6 percent increase over the same period a year before (although 2014 was a particularly poor year for tea prices, so some of the rise is due to base effects).
10. Based on export performance for the first three quarters, in particular a halving of mineral export receipts, export projections for 2015 have been revised downward, from US$742 to US$664. Lower than expected foreign exchange earnings have caused large scale use of the international reserves of the banking system. The central bank realized the full programmed use of its reserves, which were US$986 million at the beginning of 2015, falling to US$853.4 million by end June. Thanks to some large disbursements of donor budget support that will be moved forward into CY 2015, central bank reserves are expected to meet the end-December program floor of US$ 879 million. However, to sustain imports and activity, commercial banks were also obliged to use a significant amount of reserves. Commercial banks’ NFA of US$ 150.6 million at end December 2014 was reduced to US$92.9 million by end-June and are projected to remain at this level till end December 2015..
Fiscal developments
11. The FY 2014/15 fiscal deficit was slightly lower than programmed, at 5.2 percent of GDP. Net domestic finance for FY 2014/15 amounted to RWF 108 billion which was RWF10.8 billion lower than projected in the revised budget. The figure for domestic finance includes RWF 39 billion of offsetting accumulated deposits in donor project accounts.
12. On the revenue side, total domestic tax collections exceeded the revised estimate by RWF 26 billion (0.5 percent of GDP), although performance under subcategories varied. In particular, direct taxes over-performed, including local property taxes. Additional payments for the financing of Peace Keeping Operations boosted non-tax revenue, and grants surpassed expectations due to additional disbursements from the Global Fund. As a result, total revenue and grants, at RWF 1,418.7 billion, exceeded the revised budget estimate by RWF 63.7 billion (1.1 percent of GDP).
13. Total expenditure and net lending, at RWF 1,697 billion, exceeded revised budget projections by RWF 50 billion (0.8 percent of GDP). However, these were for categories of spending that are not financed out of general budget resources, namely additional outlays for Peace-Keeping Operations and accelerated implementation of foreign-financed infrastructure projects for energy and roads.
14. Outlays for priority spending accounted for the largest share of total expenditure. These included infrastructure, particularly energy and roads, as well as programs and projects associated

RWANDA
34 INTERNATIONAL MONETARY FUND
with poverty reduction and social protection, especially in the areas of agriculture, education, health and local government activities.
Selected Priority Spending in Fiscal Year 2014/15 (as % GDP)
Energy Construction of Nyabarongo Hydro power station(27MW) 4.4
Rehabilitation of power plants and connecting households to the to the national grid
2.8
Roads Rehabilitation of various national and urban roads 6.6
Kivu belt road construction( on-going) 2.8 Agriculture
Construction of terraces (radical and progressive) to increase arable land and stop erosion
2.6
“one cow per family” project 0.2
Health Construction and rehabilitation of health facilities 3.8 Purchase of materials including equipment 1.3 Provision of specialized staff 1.0
Education Construction and renovation of various classrooms for primary and secondary education
2.0
Construction and equipment for vocational education 2.2 Purchases of various educational materials (books, desks etc.) 1.2
“One laptop per child” project 0.5
Monetary developments
15. Monetary policy in 2015 continued to remain accommodative. This monetary policy stance was designed to support the gradual recovery in economic activity after the slowdown since 2013. The Monetary Policy Committee (MPC) therefore decided to keep the policy rate (the Key Repo Rate-KRR) at 6.5 percent in force since June 2014 to support the financing of the private sector by the banking sector and ensure positive real interest rates to stimulate domestic savings. Broad money grew by 15.9 percent from end-December 2014 to end-September 2015, compared to 17.5 percent in the same period of 2014, and was driven mainly by increases in credit to government and the private sector, offset by sharp drops in net foreign assets (which appear larger in US$ terms than in RWF terms, due to the use of a program exchange rate that reflected a much stronger RWF). In a context of strong growth, accommodative monetary policy and ample liquidity in the banking system, growth in credit to the private sector for the first three quarters of 2015stood at 20.9 percent, slightly higher than programmed.

RWANDA
INTERNATIONAL MONETARY FUND 35
16. The foreign exchange (forex) market in Rwanda is operating in a structural deficit, due to a narrow export base and strong imports underpinning high growth, exacerbated by recent trends in donor support (away from budget support grants to more project lending). This situation was exacerbated by recent cyclical developments related to mining exports, leading to the aforementioned drawdown in commercial banks’ forex reserves. This situation, coupled with the continued strengthening of US dollar, has put pressure on the value of the Rwandan franc. In cumulative terms, the depreciation of Rwandan franc between 2012 and 2015 will be at around 21.3%, compared to 4.2% recorded between 2004 and 2011. Pressure on the Rwandan franc was also fuelled by speculation from cash traders in July-August. The NBR increased NBR sales to the market in an attempt to mitigate the speculative pressure.
17. The NBR also continued efforts to strengthen the channel of transmission whereby policy interest rates influence market interest rates and inflation. While significant progress has been achieved, there remains room for improvement, particularly as regard development of an interbank market and a secondary market for government securities. The NBR is working on the regulatory framework to shift from the simple interbank operations to a true Horizontal REPO. Moreover, efforts are underway to identify and tackle factors that lead to high and rigid bank lending rates.
The BNR and the government are also continuing efforts to deepen shallow financial markets. A ten-year bond was issued this year, to complement the 3, 5, and 7-year bonds already in circulation. In addition, efforts were made to widen the base of investors, with institutional investors’ participation share rising to 50 percent from 10 percent last year, and retail investors’ share increasing from 1 to 4 percent.
Financial sector developments
18. Rwandan financial soundness indicators suggest a banking system in sound health: banks are well capitalized and adequately liquid, and asset quality continue to improve. In both sub-sector (banks and MFIs) this capital level remains significantly above the prudential CAR of 15 percent. The ratio of liquid assets to total deposits (which measures the banks’ ability to meet liquidity needs) stood at 49.5 percent as at June 2015 and far above the regulatory minimum of 20 percent. The quick liquidity ratio of MFIs (liquid assets/current liabilities) was 95.4 percent and significantly above 30 percent regulatory requirement. Non-Performing Loans (NPLs) of banks declined from 6 percent in December 2014 to 5.9 percent in June 2015. In the same period, NPLs of MFIs however increased from 7 percent to 7.4 percent. To curb NPLs in the MFIs, the NBR is conducting a round of on-site inspection in all 416 SACCOs, targeting mainly loan portfolio management. This exercise is expected to be completed in the second quarter of 2016.

RWANDA
36 INTERNATIONAL MONETARY FUND
Performance Indicators for the Banking System and Microfinance Sector
Dec-14 Jun-15
Banks
Capital / Risk Weighted Assets (Min 15%) 24% 24.30%
Liquid assets to total deposits (Min 20%) 48.7% 49.5%
Non-Performing Loans (NPLs) 6% 5.9%
Microfinance
Capital / Risk Weighted Assets (Min 15%) 33.2 % 31.4 %
Quick liquidity ratio (liquid assets/current liabilities: with min 30%) 87% 95.4%
Non-Performing Loans (NPLs) 7% 7.4%
19. The NBR continued to strengthen its supervision function. The capacity of supervisors is continually enhanced through both in-house and external training (EAC and the IMF’s East Afritac), while the retention rate of supervisors has improved over the past 3 years. In collaboration with regional central banks, the NBR closely monitored cross-border banking activity to identify any contagion risks. MOUs for information exchange between home supervisors of regional banks and local supervisors have been signed. Regular supervisory colleges (supervisory meetings on regional banks) were organized to discuss financial soundness and inherent risks of regional banks.
20. The NBR is also making good progress in reviewing legal and supervisory frameworks, as well as strengthening contingency planning. A new Central Bank Law was approved by Cabinet in October 2015. The Central Bank Law is the legal framework which defines the organization structure and guides the activities of the Central Bank of Rwanda (BNR). A new pension law, which provides for establishment of private pensions, was gazetted in May 2015. The first one regulates the supervision of the activities of Banks while the second provides the supervisory framework for the insurance sector. A new Deposit Insurance Law, which extends protection for smaller depositors in banks and MFIs, was published in the Official Gazette in August 2015 and regulations are forthcoming. The NBR plans to start a parallel running exercise of existing Basel I capital requirements and new capital requirements on Basel II&III, before the end of 2015, with the new capital requirements already discussed with stakeholders. In the spirit of establishing a robust contingency planning (financial crisis preparedness), the NBR board approved the Emergency Liquidity Facility Framework (ELF) in September 2015. The ELF is a contingency (standby) facility to support a solvent bank with liquidity stress.
Debt developments
21. Rwanda continues to be at low risk of external debt distress and its long-term foreign and local currency sovereign credit ratings were raised to 'B+' from 'B' by Standard & Poor’s in March

RWANDA
INTERNATIONAL MONETARY FUND 37
2015 as a result of increased confidence by investors in the country’s broad macroeconomic management. In July 2015, the ratings agency Fitch maintained its ‘B+’ rating for Rwanda, citing strong GDP growth and prudent fiscal management as key ratings drivers. Total public and publicly guaranteed debt stood at 30.4 percent of GDP as of end December 2014 (23.2 percent of GDP external debt and 7.1 percent domestic debt). External concessional debt represented 56.7 percent of total debt while commercial and guaranteed debt represented 16.7 percent and 3.1 percent respectively. Guarantees were extended on debt owed by RwandAir and Rwanda Energy Group. PTA Bank, a key financing partner for RwandAir, no longer requires sovereign guarantees for its loans to the company.
Program Performance
22. Program performance under the new PSI has been satisfactory. All end-June 2015 quantitative Assessment Criteria (QAC) were met. However, one of four indicative targets was not met. Due to delays in the disbursement of peacekeeping operations funds, the target on consolidated domestic debt of the public sector was exceeded by a small margin on account of additional sales of short term government securities as bridge financing for peacekeeping spending operations. Structural measures related to studying reforms in agricultural taxes have been delayed due to difficulties finding technical expertise in this area, and publication of quarterly reports on budget execution were delayed due to technical problems; these have been rescheduled for completion in 2016. Revised targets for end-December 2015 and new targets for end-June 2016 are proposed in Table 1. The assessment of the end-December 2015 targets is expected to be completed by end-June 2016, at the time of the fifth review. The sixth review is expected to be completed by end-December 2016. Table 2 includes the new structural benchmarks under the PSI.
Macroeconomic Outlook and Policy for FY2015/16 and the medium term
Introduction
23. In response to the weaker external environment, growth projections for 2016 were lowered modestly (to 6.3 percent from 7.0 percent), and a set of short term policy responses agreed. These policies comprise some additional drawdown of official reserves, and import compression through tightening of the 2016 monetary targets, relative to 2015. The BNR will continue to allow market determination of the exchange rate – further depreciation would also lead to import compression. These policies form a reasonable basis for dealing with the current shock in the near term.
24. Growth in 2016 is now estimated at 6.3 percent. Agriculture is expected to expand by 5.1 percent, similar to previous years, but some contraction in export crops is anticipated due to adverse international prices. Mining will continue to be a drag on growth. Manufacturing should strengthen in 2016 due to better market access for beverage production and new textile production. The growth of construction, however, is expected to be somewhat slower than in 2015, due to the impact on demand for imported intermediate goods of exchange rate depreciation that has already taken place. Services are projected to grow by 7.1 percent overall, buoyed by wholesale and retail trade (with more expensive imports a constraint to some extent). Real estate activity is expected to

RWANDA
38 INTERNATIONAL MONETARY FUND
grow strongly due to the building completion rate observed in 2015. Information technology will continue its strong growth due to the impact of foreign investment and regional market expansion through products like mobile money transfers. Growth rates for 2017 and 2018, originally projected at 7.5%, have now been adjusted downwards to 6.7 and 6.8 percent, respectively. However there are notable downside risks to this forecast, such as a more prolonged decline in commodity prices and/or lower growth in Asia and other export markets.
Fiscal policy
25. The fiscal framework for 2015/16 and the medium term aims at containing spending in line with expected external pressures. To ensure that longer term development goals are protected, the objective is to increase domestic resource mobilization while introducing more expenditure prioritization to reduce the fiscal deficit and reliance on external financing over time. In line with this objective, the revised 2015/16 budget projects an overall deficit of 5.3% of GDP, declining to 4.4% of GDP in 2016/17 and further to 4.2% of GDP in 2017/18.
Revised FY 2015/16 budget
26. The original FY 2015/16 budget projected total revenue and grants at RWF 1,462.5 billion comprising domestic revenue of RWF 1,104.2 billion and total grants of RWF 358.3 billion. Total expenditure and net lending had been estimated at RWF 1,741.2 billion comprising RWF 865.6 billion of recurrent spending, RWF 747.3 billion capital expenditure and net lending of RWF 128.3 billion, resulting in an overall deficit of RWF 290 billion with domestic financing of RWF 74.9 billion.
27. A 2015/16 revised budget will be sent to parliament in Q1 2016. The revised budget will reflect acceleration of budgetary loans from the World Bank, and additional grants from DFID, as well as additional spending for some priority programs and projects. Total revenue and grants are being revised upwards to RWF 1,478.9 billion, showing an increase of RWF 16.4 billion mainly on account of additional budget support grants. Domestic revenue estimates are being retained, reflecting the offsetting effects of lower growth on one hand and higher collection rates and new tax compliance measures underway. Expenditure and net lending will be revised upwards to RWF 1,785 billion, reflecting an increase of RWF 43.8 billion. Recurrent spending is being adjusted upwards by RWF 34.3 billion, whilst capital expenditure is raised by RWF 29 billion, and net lending is reduced by RWF 19.5 billion on account of lower spending by KCC.
28. Regarding recurrent spending, a modest additional allocation for wages and salaries (0.1 percentage points of GDP) will allow the hiring of additional teachers in the districts as well as the recruitment of additional technical and vocational training staff. Regarding goods and services, the additional allocation of 0.4 percentage points of GDP is to cover some foreseen spending shortfalls and for the preparation of the 2017 elections, including voter registration, equipment purchases, etc. In the case of capital expenditure, additional budget authorization is being provided for RWF 29 billion to accommodate use of US$14.5 million of Euro bonds receipts for a hydro-power project, and use of RWF 20.3 billion of Global Fund grants that were disbursed in the middle of last

RWANDA
INTERNATIONAL MONETARY FUND 39
year and have accumulated in project deposits. In addition an allocation has been made for the purchase of additional livestock to continue the one cow per family program.
29. These revisions will result in an increase in the overall deficit in FY2015/16 from RWF 290 billion to RWF 332.5 billion compared to the original budget. Using revised GDP figures, this implies an increase of 0.7 percentage points of GDP. However, as mentioned this slightly higher deficit will be fully financed by higher concessional external borrowing and more domestic financing. Specifically, the accelerated World Bank budget loan and additional drawdown of a project loan from the AfDB will increase external borrowing by RWF 25.5 billion to RWF 258.7 billion. Planned net domestic financing will be RWF 42.2 billion.
Revenue mobilization
30. Over the past three years, the Government has embarked on comprehensive tax reforms. A medium-term tax reform plan was developed and identified policies and administrative measures aimed at improving taxpayers’ compliance, reducing exemptions, strengthening risk management, and broadening the tax base. Going forward, the strategy focuses on implementation and monitoring the anticipated outcomes. Relatedly, the RRA underwent the Tax Administration Diagnostic Assessment (TADAT) from the IMF Fiscal Affairs Department, which offered insights on reform priorities going forward. Actions to respond to the identified weaknesses will be incorporated into the RRA Three-year Strategic Plan and consequent annual action plans. RRA is also revising the Tax procedure Law which will, among other things:
Improve use of the Electronic Billing Machines (EBMs). Some sectors will be made liable for VAT payments regardless of turnover levels, i.e. evolution to more sector-based rather than threshold-based approach;
Allow taxpayers who never declared taxes but later declare voluntarily to be considered as voluntarily disclosure;
Require tax litigation cases to pass through an administrative review by the Commissioner General prior to going to court, in order to reduce the number of cases that go to court; and
Provide more comprehensive rules for handling false declarations or incomplete returns submitted to the tax administration.
31. In addition, government is still committed to proposing legislation on reforms to agriculture taxation, but expert advice is needed for developing the reforms in light of the importance of the sector for the majority of Rwandans. Despite help by numerous development partners in the search for this expertise, including the Fund and Bank, the search is still ongoing.
Public Financial Management
32. In a bid to accelerate the public financial management reforms agenda, the government is implementing the following measures:

RWANDA
40 INTERNATIONAL MONETARY FUND
Implementation of E-Procurement: A feasibility study of the implementation of an e-procurement system in Rwanda concluded that e-procurement has huge potential for increasing efficiency, transparency and compliance. After a careful consideration of these findings, the government has made this one of the top priorities in the PFM reform agenda for the medium term. The government has signed a contract with the vendor and is currently working on the recruitment of the counterpart team that will work with the vendor to develop and rollout the system across government. It is also anticipated that the implementation of this system will bring about significant cost savings in form of time saving, lower transaction costs, and it is expected that it will reduce the use of paper and travel among others.
Development of an IPSAS (International Public Sector Accounting Standards) roadmap: This relates to government accounting policy for fixed assets, and will greatly contribute to improved accountability and transparency in general, but will also help Rwanda attain the fiscal reporting convergence criteria required for the East Africa Monetary Union (EAMU) and full (IPSAS) compliance.
Further linkage of plans and budgets through: consolidating the practice of holding annual planning consultations to inform budget consultations; strengthening the investment committee which aids in the selection and prioritization of investment projects. The investment committee has now been operational for 2 years (in 2015/16 local government projects were also appraised by a new District Investment Advisory Committee); the investment committee will furthermore be empowered to approve PPPs and Joint Ventures. The National Investment Policy is going to be revised in 2015/16 to create a robust framework for oversight and implementation of projects with clear roles and responsibilities of stakeholders including PPPs and Joint ventures. The Project monitoring unit in MINECOFIN as well as the functions of performance contract elaboration and monitoring have also been transferred from the budget unit and the office of the Prime Minister respectively to the responsibility of the Minister of State in charge of Economic Planning. These are expected to improve monitoring of financial and non-financial performance and create feedback loops into the prioritization process. A new form of performance contracts shared across institutions spanning central and local government as well as support to the private sector has also been introduced in 2015/16 to incentivize coordination in delivery.
Debt Management
33. The Government of Rwanda has embraced the IMF new debt limit policy which will now depend on the presence of debt vulnerabilities as per the Debt Sustainability Analysis, but also the quality of fiscal data. Rwanda expects to remain at low risk of debt distress, and will keep monitoring its level of indebtedness through two indicative targets including the Net Domestic Financing (NDF) and the Non-concessional borrowing (NCB). It is for that reason that the Debt Management Unit (DMU) has developed (during FY 14/15) a process for issuance of guarantees. After review and analysis of the loan guarantees, the DMU submits the analysis to the Debt Management committee (DMC) and the Treasury Management committee (TMC), before it is submitted to the Minister for approval and signature. The government also plans to jointly undertake with the World Bank, the

RWANDA
INTERNATIONAL MONETARY FUND 41
design of debt management reform priorities, based on the debt management performance assessment (DeMPA), which was conducted during July 2015.
Monetary Policy
34. Following the recent pressures from food, transport and housing inflation, headline inflation is projected at around 4 percent in December 2015. The main risks to monitor, going forward, include the depreciation of the FRW against the USD, and agricultural products. BNR expects headline inflation to be around the 5 percent target in 2016. The BNR will implement a prudent monetary policy allowing monetary aggregates to growth at low pace compared to 2015. In 2016, M3 will increase by 14.9 percent from 16.1 percent and credit to the private sector by 16.2 percent from 24.5 percent. The NBR will continue to carefully assess developments and adapt the stance to the changing circumstances with the aim of maintaining inflation within its 5 percent target, while supporting growth and containing pressures on the currency.
35. In a bid to promote capital market development and support the transmission mechanism, the NBR in collaboration with MINECOFIN, is committed to continue issuing Treasury Bonds on quarterly basis and extend the maturity of securities by issuing a 15 year T-Bond in May 2016. Furthermore, with the objective of enhancing the trading activities on the secondly market, NBR shall put in place the framework of Market intermediaries for Government Securities by September 2016.
36. To encourage the development of interbank and secondary markets, both for domestic currency transactions and forex, the NBR will continue to enhance its communication strategy by creating an interactive platform of exchanging information with all stakeholders, with a particular focus on financial institutions and the business community. In addition, the communication will focus on educating the public about the ongoing financial deepening reforms such as credit reporting bureau activities, the capital market development and payment systems modernization.
PPG external debt contracted or guaranteed
Volume of new debt, US$ million 1/
Sources of debt financing 252Commercial terms 2/ 252
Uses of debt financing 252RwandAir and KCC 252
Summary Table on New External Borrowing Program for 2016
1/ Contracting and guaranteeing of new debt in nominal terms. All multilateral and bilateral debt in the central government's budget for 2016 related to disbursements of previous contracted loans.
2/ All commercial debt is central government guaranteed debt related to RwandAir and the Kigali Convention Center (KCC).

RWANDA
42 INTERNATIONAL MONETARY FUND
External developments and exchange rate policy
37. The balance of trade for goods and services is expected to deteriorate further by about 10 percent in 2016, due to a further deterioration of the terms of trade. Export growth in 2016 will be subdued, expanding by only 4.7 percent after a decline of 7.8 percent projected for 2015. Mineral export revenues are expected to decline by 10.3 percent in 2016, due to continued weak prices. The Rwandan mining industry is dominated by artisanal mining, with their production share at over 70 percent. These miners are less sensitive to international price than larger semi-industrial miners (as their fixed costs are non-existent and their financial situation is more vulnerable), but nevertheless the volumes produced in 2016 are expected to decline, reflecting lower international demand for minerals generally. Non-traditional export revenues are anticipated to expand by 4.8 percent, more moderate growth than in the recent past due to slowing demand in the region generally. Tea volumes are projected to increase by 16 percent, due to increased acreage under production and nine new processing factories.
38. Import growth will also be slower than in the past, reflecting the impact of tighter monetary policy and exchange rate depreciation that has already taken place. 2016 growth is projected at 5.0 percent, excluding one-off RwandAir imports which are financed fully in the financial account of the balance of payments. (Including the importation of new planes, growth will be 11 percent). Increased public sector flows of loans and grants and other private sector financing should help finance most capital and intermediate imports.
39. In light of depleted commercial bank forex reserves, the BNR is planning to sell additional reserves of US$90 million, bringing reserve cover down to 3.3 months of projected 2017 imports. The BNR plans to allow further exchange rate flexibility needed to contain additional deterioration of external balances. In line with the objective of allowing greater exchange rate flexibility, the BNR is planning to improve gradually its methodology and base the exchange rate on interbank deals, as agreed at the EAC level. The BNR is thus working with the Dealer’s Association on raising the technical capacity of dealers and organizing a forex interbank market, which will be realized through a signed code of conduct in June 2016. The BNR aims to have in operation a framework based on interbank transactions by December 2016. In addition, the BNR is closely working with the cash traders to establish their association, which will be also governed by a Code of Conduct.
Financial Sector Policies
40. The following measures would be implemented to further strengthen the financial sector:
The BNR plans to establish the “Financial Sector Coordination Committee”. This committee will be mandated to manage any systemic financial crisis. This committee is expected to be established by June 2016.
The BNR plans to put in place the regulation implementing the deposit insurance law by end 2016. This regulation will cover the following: 1) the contribution rate; 2) the coverage ratio and; 3) the pay-out procedures.

RWANDA
INTERNATIONAL MONETARY FUND 43
For the purpose of financial consumer protection, the BNR plans to develop transparency and disclosure instruments: Regulation on Key Fact Statement (KFS) and Annual Percentage Rate (APR) by 2016. These two instruments will require banks and MFIs to disclose key information (terms and conditions) regarding a loan and its total costs.
The BNR plans to issue a regulation on new capital requirements on Basel II/III by end of 2016. The new capital requirements will include minimum capital ratios plus a conservation buffer of 2.5.
The process of automating operations of UMURENGE SACCOs started and is planned to be completed by 2017.
In the insurance sector, BNR plans to re-model solvency requirements parameters using risk based capital approach by December 2016. This is to ensure that the solvency requirements are in line with the risk, nature, scale and complexity of the operations of insurers.

RWANDA
44 INTERNATIONAL MONETARY FUND
MEFP Table 1. Quantitative Assessment Criteria and Indicative Targets1
Jun 2016
3rd PSI review
Modified Program
Projected/ program
Assessment criteria
Ceiling on the overall fiscal deficit, including grants2, 3, 4 … -291.0 -206.8
Net foreign assets of the NBR at program exchange rate (floor on stock)4, 5 524.0 570.8 465.0
Reserve money (ceiling on stock) (upper bound)6 290.9 290.9 315.3
Reserve money (ceiling on stock)6 285.2 285.2 309.1
Reserve money (ceiling on stock) (lower bound)6 279.5 279.5 302.9
External payment arrears (US$ millions) (ceiling on stock)7 0.0 0.0 0.0
Indicative targetsNet domestic financing (ceiling on flow)3, 4 151.0 37.1 203.0
Domestic revenue collection (floor on flow)3, 8 951.7 966.9 562.0
Net accumulation of domestic arrears (ceiling on flow)3 -2.5 -12.4 -5.6
Consolidated domestic debt of public sector (ceiling on stock, eop)4, 9 456.1 522.9 561.3
Total priority spending (floor on flow)3 640.8 720.7 366.2
New nonconcessional external debt contracted or guaranteed by nonfinancial public enterprises (US$ millions) (ceiling on stock)7 500.0 500.0 500.0
Memorandum items:Total budget support (US$ millions) 3, 10 400.2 500.9 97.5
Budget support grants (US$ millions) 239.1 247.6 97.5Budget support loans (US$ millions) 161.2 253.3 0.0
Euro bond (US$ millions) 400.0 400.0 400.0 Unused euro bond proceeds (US$ millions) 18.8 12.1 0.0
RWF/US$ program exchange rate 694.4 746.5 746.5
Sources: Rwandan authorities and IMF staff estimates and projections.
3 Numbers for 2015 are cumulative from 12/31/2014; numbers for 2016 are cumulative from 12/31/2015.
5 2015 program numbers are at the revised program exchange rate of RWF746.5.6 Targets are calculated as an arithmetic average of the stock of reserve money for the 3 months in the quarter. AC applies to upper bound only. 7 Ceilings on external arrears and non-concessional external borrowing are continuous.8 The figure excludes revenues associated with demobilization and AU peace keeping operations.
10 Excluding demobilization and African Union peace keeping operations, HIPC and COMESA grants.
9 Excluding NBR's debt issued for monetary policy purposes.
1 All items including adjusters are defined in the Technical Memorandum of Understanding (TMU).
Dec 2015
(Billions of Rwandan francs, unless otherwise indicated)
2 Commitment basis, with adjustor on externally-financed capital spending.
4 Subject to adjustors. See TMU for details.

RWANDA
INTERNATIONAL MONETARY FUND 45
MEFP Table 2. Status of Structural Benchmarks for the 5th Review
Policy Measure Target Date Macroeconomic rationale
Revenue Mobilization
Submit revised Law on Tax Procedures to Cabinet.June 2016 To enhance revenue mobilization.
Share draft study on new tax regime for agriculture. End-November 2016 To enhance revenue mobilization.
Public Financial Management
Sub-national entities (416) to produce monthly, quarterly, and annual financial reports using a uniform template.
End-Dec. 2015To improve accounting, transparency and accountability.
Submit revised National Investment Policy (NIP) to Cabinet. End-June 2016 To enable private sector involvement in PPPs
Share IPSAS roadmap which includes government accounting policy for fixed assets is developed and implemented.
End-June 2016To improve accountability and help Rwanda attain the EAMU fiscal reporting convergence
it iPublish quarterly reports of budget execution against annual fiscal policy objectives, within 60 days of end of each quarter, initially excluding foreign-financed projects.
Continuous, starting Q4 2015
To improve accounting, transparency and accountability.
Operationalize IFMIS and E-Procurement interface protocols December 2016To improve efficiency, transparency, and controls in public procurement.
Monetary and Financial Sector
Issue a 15-year Government T-Bond May 2016 To extend the yield curve.
Establish a framework of market intermediaries for government securities. September 2016 To deepen secondary market.

RWANDA
46 INTERNATIONAL MONETARY FUND
Attachment II. Technical Memorandum of Understanding December 17, 2015
1. This memorandum defines the quantitative targets described in the memorandum of economic and financial policies (MEFP) for the period July 1, 2015–November 30, 2016 supported by the IMF Policy Support Instrument (PSI), and sets out the data reporting requirements. This TMU updates the one of April, 2015.
I. QUANTITATIVE PROGRAM TARGETS
2. The quantitative program will be assessed through assessment criteria (AC) and indicative targets (IT) for the duration of the program.
3. AC will apply to the following indicators for December 31, 2015 and June 30, 2016 (the test dates) throughout the program period:
Floor on stock of net foreign assets (NFA) of the National Bank of Rwanda (NBR);
Ceiling on stock of reserve money;
Ceiling on the overall deficit, including grants as measured on a commitment basis; and
Ceiling on stock of external payment arrears of the public sector.
4. IT will apply to the following indicators throughout the program period:
Ceiling on flow of net domestic financing (NDF) of the central government;
Floor on flow of domestic revenue collection of the central government;
Ceiling on flow of net accumulation of domestic arrears of the central government;
Ceiling on contracting or guaranteeing of new non-concessional external debt of nonfinancial public enterprises ;
Ceiling on stock of consolidated domestic debt of the public sector; and
Floor on flow of priority spending.
5. Assessment criteria on contracting or guaranteeing of new non-concessional external debt by the public sector and stock of external payment arrears of the public sector are applicable on a continuous basis for the duration of the program.
6. Program exchange rates. For accounting purposes, the program exchange rates in Table 1 will apply.
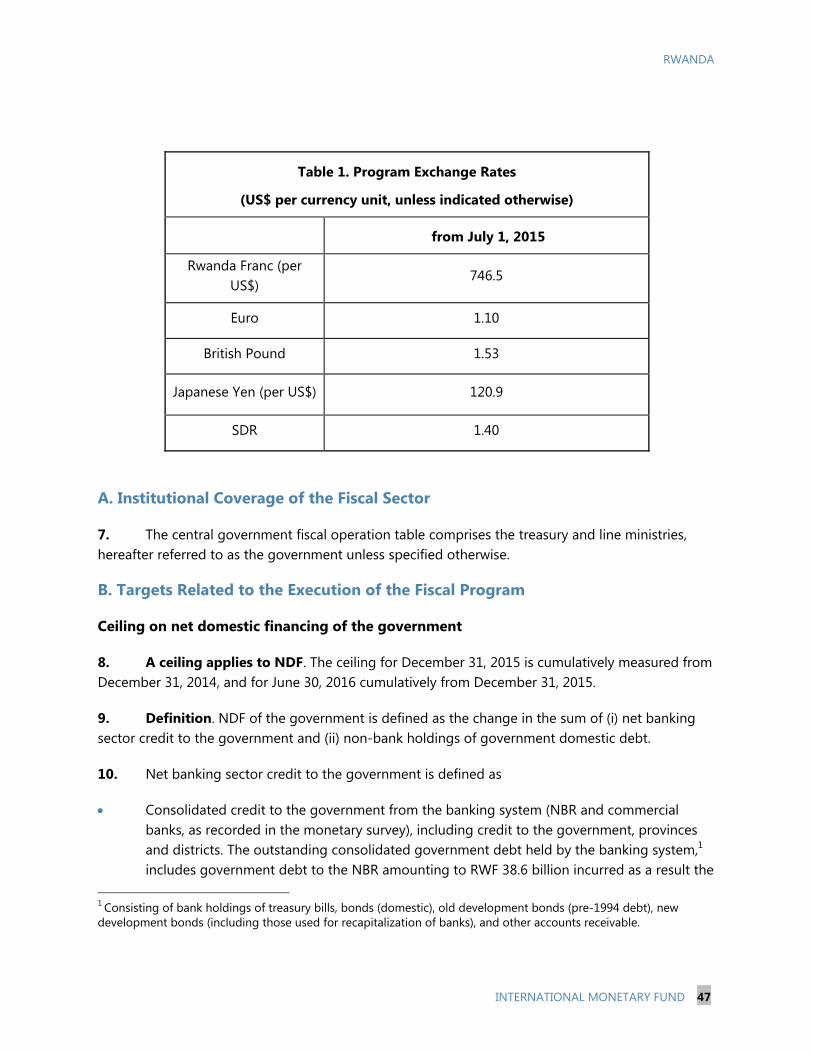
RWANDA
INTERNATIONAL MONETARY FUND 47
Table 1. Program Exchange Rates
(US$ per currency unit, unless indicated otherwise)
from July 1, 2015
Rwanda Franc (per US$)
746.5
Euro 1.10
British Pound 1.53
Japanese Yen (per US$) 120.9
SDR 1.40
A. Institutional Coverage of the Fiscal Sector
7. The central government fiscal operation table comprises the treasury and line ministries, hereafter referred to as the government unless specified otherwise.
B. Targets Related to the Execution of the Fiscal Program
Ceiling on net domestic financing of the government
8. A ceiling applies to NDF. The ceiling for December 31, 2015 is cumulatively measured from December 31, 2014, and for June 30, 2016 cumulatively from December 31, 2015.
9. Definition. NDF of the government is defined as the change in the sum of (i) net banking sector credit to the government and (ii) non-bank holdings of government domestic debt.
10. Net banking sector credit to the government is defined as
Consolidated credit to the government from the banking system (NBR and commercial banks, as recorded in the monetary survey), including credit to the government, provinces and districts. The outstanding consolidated government debt held by the banking system,1 includes government debt to the NBR amounting to RWF 38.6 billion incurred as a result the
1 Consisting of bank holdings of treasury bills, bonds (domestic), old development bonds (pre-1994 debt), new development bonds (including those used for recapitalization of banks), and other accounts receivable.

RWANDA
48 INTERNATIONAL MONETARY FUND
overdraft to the pre-war government and the 1995 devaluation 2, as well as the current overdraft with the NBR. Credit to the government will exclude treasury bills issued by the NBR for monetary policy purposes, the proceeds of which are sterilized in deposits held as other NBR liabilities.
less total government deposits with the banking system (as recorded in the monetary survey), including in the main treasury account, the accounts of line ministries, the fund for assistance to genocide survivors, the Rwanda Revenue Authority, the electoral commission, the demobilization commission, fonds routier, the privatization account, and the accounts of any other autonomous public enterprises and public agencies over which the government has direct control over their deposits. Thus, this definition excludes any government deposits over which the central government does not have any direct control (i.e., for project accounts, Global Fund money meant for the private sector, counterpart funds, and fonds publics affectés as well as the portion of funds for Peace-keeping Operations (PKO) reserved for the payment of wages and other allowances to peace-keeping troops and police.)
11. Non-bank holdings of government domestic debt consist of non-bank holdings of treasury bills, bonds (domestic and non-resident), old development bonds (pre-1994 debt), new development bonds (including those used for recapitalization of banks), and other accounts receivable.
Adjusters to NDF:
The ceiling on NDF will be adjusted upward by the amount of any shortfall between actual and programmed budgetary grants and loans3 (defined in Table 2), up to a maximum of RWF 120 billion. In the event that actual budgetary grants and loans exceed programmed levels, the ceiling on NDF will not be adjusted.
The ceiling on NDF will be adjusted downward by the extent to which in Rwandan francs at the program exchange rate the unused proceeds of the US$400 million euro bond issued in April 2013 is lower than US$12.1 million by end-December.
The ceiling on NDF will be adjusted upward by the amount of expenditure for food imports in the case of a food emergency.
The ceiling on NDF will be adjusted upward up to a maximum of RWF120 billion representing the amount of foreign financed capital expenditure financed with draw-down of accumulated government deposits as specified in the definition of NDF.
2 The authorities will inform Fund staff of any substantive changes in government accounts with the banking system, which may affect the calculation of net bank claims. 3 Budgetary grants exclude COMESA and HIPC grants, but include Global Fund.

RWANDA
INTERNATIONAL MONETARY FUND 49
The ceiling on NDF will be adjusted downward by the amount of disbursement of unused capital grants and loans accumulated in project deposits.
The ceiling on NDF will be adjusted upward, up to a maximum of RWF120 billion, representing the amount of expenditure arising from pre-financing of Peace Keeping Operations.
12. Reporting requirement. Data on NDF (showing separately treasury bills and government bonds outstanding, other government debt, and central government deposits), each type of debt to be shown by debt holder, will be transmitted on a monthly basis within five weeks from the end of each month. Deposits of the government with the NBR and with the commercial banks will be separated from the deposits of the public enterprises and autonomous public agencies and agencies that the government does not have any direct control over.
Overall Fiscal Deficit Including Grants
13. A ceiling applies to the overall fiscal deficit including grants. The ceiling for December 31, 2015 is cumulatively measured from December 31, 2014, and for June 30, 2016 cumulatively from December 31,, 2015.
14. Definition. For the program, the overall deficit including grants is valued on a commitment basis. That is, the overall fiscal balance is the difference between the government’s total revenue and grants and total expenditure and net lending (costs and acquisition net of nonfinancial assets). The definition of revenues and expenditures is consistent with that in the 2001 Government Financial Statistics Manual (GFSM). Government expenditure is defined on the basis of payment orders accepted by the Treasury, as well as those executed with external resources. This assessment criterion is set as a floor on the overall fiscal balance as of the beginning of the year.
Adjusters to the overall fiscal deficit including grants:
The ceiling on the overall deficit will be adjusted upward by the amount of any shortfall between actual and programmed budgetary grants4 (defined in Table 2), up to a maximum of RWF120 billion. In the event actual budgetary grants exceed programmed levels, the deficit will not be adjusted.
The ceiling on the overall deficit will be adjusted downward by the extent to which in Rwandan francs at the program exchange rate the unused proceeds of the US$400 million euro bond issued in April 2013 is lower than US$12.1 million by end-December.
The ceiling on the overall deficit will be adjusted upward by the amount of expenditure for food imports in the case of a food emergency.
4 Budgetary grants exclude COMESA and HIPC grants, but include Global Fund.

RWANDA
50 INTERNATIONAL MONETARY FUND
The ceiling on the overall deficit will be adjusted upward up to a maximum of RWF120 billion representing the amount of foreign financed capital expenditure financed with draw-down of accumulated government deposits as specified in the definition of NDF.
The ceiling on the overall deficit will be adjusted downward by the amount of disbursement of unused capital grants and loans accumulated in project deposits.
The ceiling on the overall deficit will be adjusted upward up to a maximum of RWF120 billion, representing the amount of expenditure arising from pre-financing of Peace Keeping Operations.
Floor on flow of domestic revenues
15. A floor applies to domestic revenue. The floor for December 31, 2015 is cumulatively measured from December 31, 2014, and for June 30, 2016 cumulatively from December 31, 2015.
16. Definition. The floor on domestic government revenue is defined as total government revenue (tax and non-tax revenues), per the central government fiscal operation table, but excluding external grants, peace keeping operations, and privatization receipts.
17. Reporting requirement. Detailed data on domestic revenues will be transmitted on a monthly basis within five weeks of the end of each month.
Floor on priority expenditure
18. The floor applies to priority spending of the government. The floor for December 31, 2015 is cumulatively measured from December 31, 2014, and for June 30, 2016 cumulatively from December 31, 2015.
19. Definition. Priority expenditure is defined as the sum of those recurrent expenditures, domestically-financed capital expenditures, and net lending that the government has identified as priority in line with the EDPRS2. Priority expenditure is monitored through the computerized SIBET expenditure management system which tracks priority spending of the annual budget at the program level.
20. Reporting requirement. Data on priority expenditure will be transmitted on a quarterly basis within eight weeks of the end of each quarter.

RWANDA
INTERNATIONAL MONETARY FUND 51
Net accumulation of domestic arrears of the government
21. A ceiling applies to net accumulation of domestic arrears of the government.5 The ceiling for December 31, 2015 is cumulatively measured from December 31, 2014, and for June 30, 2016 cumulatively from December 31, 2015.
22. Definition. The net accumulation of arrears is defined as the difference between the gross accumulation of new domestic arrears (measured as the difference between payment orders and actual payments related to payment orders issued) that are overdue by more than 90 days and gross repayment of any arrears outstanding at the beginning of the year under review (including repayment of float during the review year and the repayment of older arrears).
23. Reporting requirement. Data on repayment of domestic arrears and the remaining previous year’s stock of arrears will be transmitted on a quarterly basis within eight weeks of the end of each quarter.
C. Limits on Debt
Limit on new non-concessional external debt of nonfinancial public enterprises
24. A ceiling applies to the contracting and guaranteeing by nonfinancial public enterprises of new non-concessional borrowing with non-residents (see below for the definition of the public sector, concessionality, and debt). The ceiling is given in Table 1. Quantitative Assessment Criteria and Indicative Targets of the MEFP which applies continuously from July 1, 2015 to end-November 2016. The ceiling excludes non-concessional borrowing by one state-owned bank, the Bank of Kigali and Rwanda Development Bank (BRD), which are assumed not to seek or be granted a government guarantee. The ceiling also applies to private debt for which official guarantees have been extended, including future swaps involving foreign currency loans guaranteed by the public sector (see below for swaps), and which, therefore, constitute a contingent liability of the public sector. The ceiling will exclude non-concessional borrowing which is for the sole purpose of refinancing existing public sector debt and which helps to improve the profile of public sector debt.
25. The public sector comprises the general government (central government, NBR, local governments) and nonfinancial public enterprises. Nonfinancial public enterprises are entities in which the government holds a controlling stake (owning more than 50 percent of shares), but which are not consolidated in the budget. This definition of the public sector excludes the Bank of Kigali and Rwanda Development Bank (BRD). For program purposes, the guarantee of a debt arises from any explicit legal obligation of the public sector to service a debt in the event of nonpayment by the debtor (involving payments in cash or in kind)..
5 A negative target thus represents a floor on net repayment.

RWANDA
52 INTERNATIONAL MONETARY FUND
26. The definition of debt is set out in paragraph 8(a) of the Guidelines on Public Debt Conditionality in Fund Arrangements attached to Executive Board Decision No. 15688-(14/107), adopted December 5, 2014.
(a) The term "debt" will be understood to mean a current, i.e., not contingent, liability, created under a contractual arrangement through the provision of value in the form of assets (including currency) or services, and which requires the obligor to make one or more payments in the form of assets (including currency) or services, at some future point(s) in time; these payments will discharge the principal and/or interest liabilities incurred under the contract. Debts can take a number of forms, the primary ones being as follows:
(i) loans, i.e., advances of money to the obligor by the lender made on the basis of an undertaking that the obligor will repay the funds in the future (including deposits, bonds, debentures, commercial loans and buyers' credits) and temporary exchanges of assets that are equivalent to fully collateralized loans under which the obligor is required to repay the funds, and usually pay interest, by repurchasing the collateral from the buyer in the future (such as repurchase agreements and official swap arrangements);
(ii) suppliers' credits, i.e., contracts where the supplier permits the obligor to defer payments until sometime after the date on which the goods are delivered or services are provided; and
(iii) leases, i.e., arrangements under which property is provided which the lessee has the right to use for one or more specified period(s) of time that are usually shorter than the total expected service life of the property, while the lesser retains the title to the property. The debt is the present value (at the inception of the lease) of all lease payments expected to be made during the period of the agreement excluding those payments that cover the operation, repair, or maintenance of the property.
(b) Under the definition of debt set out in this paragraph, arrears, penalties, and judicially awarded damages arising from the failure to make payment under a contractual obligation that constitutes debt. Failure to make payment on an obligation that is not considered debt under this definition (e.g., payment on delivery) will not give rise to debt.
27. Debt guarantees. For the purposes of the relevant IT, a government debt guarantee means an explicit legal obligation to service a debt in the event of nonpayment by the borrower (through payment in cash or in kind)
28. Concessionality of external debt. For the purposes of the relevant IT, a debt is considered concessional if it includes a grant element of at least 35 percent, calculated as follows: the grant element of a debt is the difference between the present value (PV) of debt and its nominal value,

RWANDA
INTERNATIONAL MONETARY FUND 53
expressed as a percentage of the nominal value of the debt. The PV of debt at the time it is contracted is calculated by discounting the borrower’s future debt service payments on the debt. For debts with a grant element equal or below zero, the PV will be set equal to the nominal value of the debt. The discount rates used is 5.0 percent.
Limit on the stock of external payment arrears
29. A continuous assessment criterion applies to the non-accumulation of payment arrears on external debt contracted or guaranteed by the public sector. External payment arrears consist of external debt service obligations (principal and interest) that have not been paid at the time they are due, as specified in the contractual agreements, but shall exclude arrears on obligations that are subject to rescheduling.
Consolidated Domestic Debt of the Public Sector
30. For program purposes, domestic debt excludes treasury bills issued by the NBR for monetary policy purposes. The ceiling on DD applies to domestic commitments contracted or guaranteed by the public sector. This also applies to private debt for which official guarantees have been extended either implicitly or explicitly. The authorities would inform Fund staff of any changes in debt position of public sector entities.
Adjusters:
In the case of a shortfall in programmed budgetary loans and grants (per paragraph 11), the ceiling on consolidated domestic debt of public sector will be adjusted upward by the same amount as the increase in the ceiling in the NDF, but capped per paragraph 11.
The ceiling on the DD will be adjusted upward by the amount of expenditure for food imports in the case of a food emergency.
31. Reporting requirement. Data on domestic debt of the public sector, including treasury bills issued by the NBR for monetary policy purposes, will be transmitted on a quarterly basis within eight weeks of the end of each quarter.
D. Targets for Monetary Aggregates
Net foreign assets of the National Bank of Rwanda
32. A floor applies to the net foreign assets (NFA) of the NBR for December 31, 2015 and June 30, 2016.
33. Definition. NFA of the NBR in Rwandan francs is defined, consistent with the definition of the Special Data Dissemination Standard (SDDS) template, as external assets readily available to, or controlled by, the NBR net of its external liabilities. Pledged or otherwise encumbered reserve assets (including swaps) are excluded; such assets include, but are not limited to, reserve assets used as

RWANDA
54 INTERNATIONAL MONETARY FUND
collateral or guarantee for third party external liabilities. Foreign assets and foreign liabilities in U.S. dollars are converted to Rwandan francs by using the U.S. dollar/Rwanda franc program exchange rate. Foreign assets and liabilities in other currencies are converted to U.S. dollars by using the actual end-of-period U.S. dollar/currency exchange rate. Foreign liabilities include, inter alia, use of IMF resources.
Adjusters:
The floor on NFA will be adjusted downward by the amount of any shortfall between actual and programmed budgetary loans and grants per Table 1. Quantitative Assessment Criteria and Indicative Targets of the MEFP. This adjustment will be capped at the equivalent of US$160 million, evaluated in Rwanda francs at the program exchange rate.
The floor on NFA will be adjusted upward/downward by the extent to which in Rwandan francs at the program exchange rate unused proceeds of the US$400 million euro bond issued in April 2013 is lower than/exceed US$12.1 million by end-December2015.
The floor on NFA will be adjusted downward by the amount of expenditure for food imports in the case of a food emergency, evaluated in Rwanda francs at the program exchange rate.
34. Reporting requirement. Data on foreign assets and foreign liabilities of the NBR will be transmitted on a weekly basis within seven days of the end of each week, including breakdown of assets that are pledged or encumbered. This transmission will include daily and weekly data on the NBR’s foreign exchange liabilities to commercial banks (including required reserves with the NBR) and the exchange rate used for their conversion into Rwanda francs will be shown separately.
Reserve money
35. A ceiling applies to the stock of reserve money for December 31, 2015 and June 30, 2015 as indicated in Table 1. Quantitative Assessment Criteria and Indicative Targets of the MEFP. The ceiling is the upper bound of a reserve money band (set at+/- 2 percent) around a central reserve money target).
36. The stock of reserve money for a given quarter will be calculated as the arithmetic average of the stock of reserve money at the end of each calendar month in the quarter. Daily average of all the three months in the quarter will constitute the actual reserve money to be compared with the target.
37. Reserve money is defined as the sum of currency in circulation, commercial banks’ reserves, and other nonbank deposits at the NBR.
Adjuster:
The ceiling on the stock of reserve money will be adjusted symmetrically for a change in the required reserve ratio of commercial banks. The adjustor will be calculated as (new reserve

RWANDA
INTERNATIONAL MONETARY FUND 55
ratio minus program baseline reserve ratio) multiplied by actual amount of liabilities (Rwanda Franc plus foreign-currency denominated) in commercial banks.
38. Reporting requirement. Data on reserve money will be transmitted on a weekly basis within seven days of the end of each week. This transmission will include a daily and a weekly balance sheet of the NBR which will show all items listed above in the definitions of reserve money.
II. OTHER DATA REPORTING REQUIREMENTS
39. For the purposes of program monitoring, the Government of Rwanda will provide the data listed in TMU Table 1 below, weekly data within seven days of the end of each week; monthly data within five weeks of the end of each month; annual data as available.
40. The authorities will inform the IMF staff in writing prior to making any changes in economic and financial policies that could affect the outcome of the financial program. Such policies include, but are not limited to, customs and tax laws, wage policy, and financial support to public and private enterprises. The authorities will inform the IMF staff of changes affecting respect of continuous QACs and ITs. The authorities will furnish a description of program performance according to QACs and ITs as well as structural benchmarks within 8 weeks of a test date. The authorities engage to submit information to IMF staff with the frequency and submission time lag indicated in TMU Table 1. The information should be mailed electronically to the Fund. (email: [email protected]).
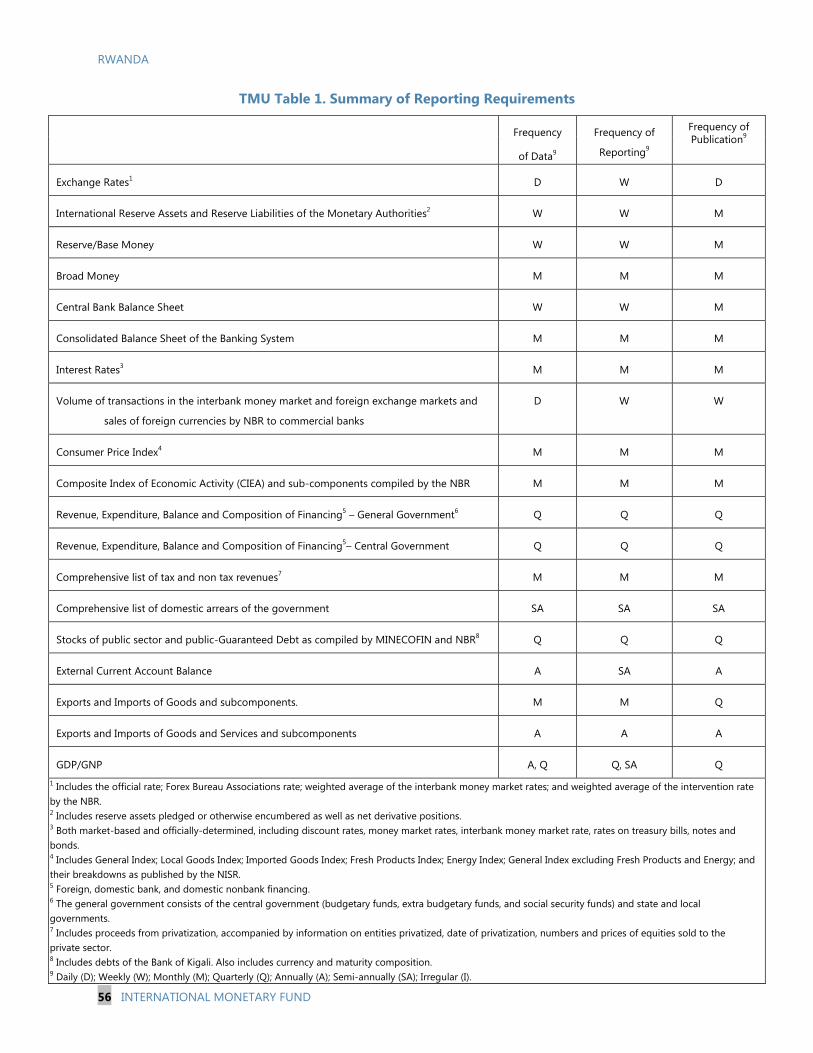
RWANDA
56 INTERNATIONAL MONETARY FUND
TMU Table 1. Summary of Reporting Requirements
Frequency
of Data9
Frequency of
Reporting9
Frequency of Publication9
Exchange Rates1 D W D
International Reserve Assets and Reserve Liabilities of the Monetary Authorities2 W W M
Reserve/Base Money W W M
Broad Money M M M
Central Bank Balance Sheet W W M
Consolidated Balance Sheet of the Banking System M M M
Interest Rates3 M M M
Volume of transactions in the interbank money market and foreign exchange markets and
sales of foreign currencies by NBR to commercial banks
D W W
Consumer Price Index4 M M M
Composite Index of Economic Activity (CIEA) and sub-components compiled by the NBR M M M
Revenue, Expenditure, Balance and Composition of Financing5 – General Government6 Q Q Q
Revenue, Expenditure, Balance and Composition of Financing5– Central Government Q Q Q
Comprehensive list of tax and non tax revenues7 M M M
Comprehensive list of domestic arrears of the government SA SA SA
Stocks of public sector and public-Guaranteed Debt as compiled by MINECOFIN and NBR8 Q Q Q
External Current Account Balance A SA A
Exports and Imports of Goods and subcomponents. M M Q
Exports and Imports of Goods and Services and subcomponents A A A
GDP/GNP A, Q Q, SA Q 1 Includes the official rate; Forex Bureau Associations rate; weighted average of the interbank money market rates; and weighted average of the intervention rate by the NBR. 2 Includes reserve assets pledged or otherwise encumbered as well as net derivative positions. 3 Both market-based and officially-determined, including discount rates, money market rates, interbank money market rate, rates on treasury bills, notes and bonds. 4 Includes General Index; Local Goods Index; Imported Goods Index; Fresh Products Index; Energy Index; General Index excluding Fresh Products and Energy; and their breakdowns as published by the NISR. 5 Foreign, domestic bank, and domestic nonbank financing. 6 The general government consists of the central government (budgetary funds, extra budgetary funds, and social security funds) and state and local governments. 7 Includes proceeds from privatization, accompanied by information on entities privatized, date of privatization, numbers and prices of equities sold to the private sector. 8 Includes debts of the Bank of Kigali. Also includes currency and maturity composition. 9 Daily (D); Weekly (W); Monthly (M); Quarterly (Q); Annually (A); Semi-annually (SA); Irregular (I).
RWANDA FOURTH REVIEW UNDER THE POLICY SUPPORT
INSTRUMENT—DEBT SUSTAINABILITY ANALYSIS
The results of the debt sustainability analysis indicate that Rwanda continues to face a low
risk of external debt distress, similar to the analysis prepared last year. 1, 2
Under the baseline
scenario all external debt burden indicators are projected to remain below the
policy-dependent thresholds. Standard stress tests show marginal temporary breaches of the
debt service-to-exports and debt service-to-revenue ratios in 2023 when the Eurobond
issued in 2013 matures. As these breaches are temporary, and it is assumed that Rwanda
will be able to refinance the maturing Eurobond, the final assessment of a low risk of
external debt distress is maintained. The ratio of the present value of public sector
debt-to-GDP ratio remains below the policy dependent benchmark both under the baseline
and standard stress tests. Until efforts to broaden the export base pay off, Rwanda should
remain prudent about the terms and amount of external debt it contracts/guarantees.
1 This debt sustainability analysis updates the DSA analysis contained in IMF Country Report No. 14/343
(December 2014). The fiscal year for Rwanda is from July–June; however, this DSA is prepared on a calendar
year basis. The results of this DSA were discussed with the authorities and they are in broad agreement with
its conclusions.
2 The Country Policy and Institutional Assessment (CPIA) which assesses the quality of a country’s present
policy and institutional framework has classified Rwanda as a strong performer, with an average CPIA score
of 3.92 over the last three years.
Approved By Roger Nord and Masato
Miyazaki (IMF) and John
Panzer (IDA)
The Debt Sustainability Analysis (DSA) was prepared jointly
by IMF and World Bank staff, in consultation with the
authorities.
December 17, 2015

RWANDA
2 INTERNATIONAL MONETARY FUND
2012 2013 2014
Bill ions US$ Share Bill ions US$ Share Bill ions US$ Share
Multilateral creditors 0.9 76.4 0.9 58.6 1.1 60.6
Bilateral creditors 0.2 14.7 0.2 13.5 0.3 13.8
Commercial creditors 0.4 25.0 0.4 21.9
Total (excluding guarantees) 1.1 91.2 1.6 97.1 1.8 96.3
Publicly guaranteed debt 0.1 8.8 0.0 2.9 0.1 3.7
Total (including guarantees) 1.2 100.0 1.6 100.0 1.8 100.0
Source: Rwandan authorities
BACKGROUND
1. The Rwandan economy grew strongly in 2014 and 2015, but recent weak mineral
exports have highlighted external vulnerabilities. Real GDP grew by 7 percent in 2014 and is
projected to record a similar growth rate in 2015. But while output has remained strong, export
performance has suffered as a consequence of weak commodity prices, with mineral exports
faring the worst. In 2015, the decline in mineral prices and production (by 18 percent and
34 percent, respectively) has resulted in a near halving of mining exports compared to the
previous year. Weak mineral prices are projected to lower mineral exports further in 2016 and
this will dampen the expansion in overall export receipts. Inflation stood at 2.1 percent at
end-2014 and is expected to remain well contained in 2015, below the authorities’ medium-term
target of 5 percent.
2. Rwanda’s public sector debt remains low, but it is increasing. At end-2014, total
public sector debt was 29.9 percent of GDP—with the external debt of the public sector at
23.7 percent of GDP and mainly comprised of multilateral and bilateral debt, and domestic debt
at 6 percent of GDP. These debt ratios compare favorably with those of other countries in the
region. The public debt-to-GDP ratio has increased steadily over the last three years, reflecting
new borrowing, in particular large disbursements under multilateral concessional loans as
Rwanda’s low-risk rating of debt distress has shifted donor support towards more concessional
lending rather than grants. Public external guaranteed debt has been rising mainly due to the
expansion of RwandAir’s fleet of aircraft.
Table 1. Rwanda: External Public Debt

RWANDA
INTERNATIONAL MONETARY FUND 3
2011 2012 2013 2014 2015 2016 2017 2018 2019 2020 2026 2025 2030 2035
(Percent of GDP, unless otherwise indicated)
Nominal GDP (RF billions) 3,846 4,437 4,864 5,389 5,955 6,589 7,389 8,287 9,309 10,509 24,532 19,255 35,279 64,641
Real GDP (percentage change) 7.5 8.8 4.7 6.9 7.0 6.3 6.7 6.8 7.0 7.5 7.5 7.5 7.5 7.5
GDP deflator (percentage change) 7.7 6.1 4.7 3.6 3.3 4.1 5.1 5.0 5.0 5.0 5.0 5.0 5.0 5.0
Fiscal (central government)
External grants (incl. HIPC relief) 10.8 9.3 8.6 7.4 6.8 5.4 3.7 4.3 4.1 3.9 1.9 2.1 1.2 0.6
Revenue (excl. external grants) 14.0 15.0 16.5 16.7 17.6 18.6 18.2 18.7 18.9 19.1 21.1 20.5 22.0 23.2
Revenue (incl. external grants) 24.8 24.2 25.1 24.1 24.3 24.1 22.0 23.0 23.0 23.0 23.0 22.6 23.1 23.8
Primary expenditures 25.1 26.9 28.8 28.2 28.4 28.1 25.6 26.0 25.8 25.6 26.1 26.5 25.7 25.0
Primary current expenditures 13.9 13.5 13.8 14.3 13.4 13.7 13.4 13.4 13.3 13.3 13.8 13.9 13.6 13.3
Capital expenditure and net lending 11.3 13.4 15.0 13.9 15.0 14.5 12.2 12.6 12.4 12.3 12.3 12.5 12.1 11.7
Primary balance, incl. external grants -0.4 -2.7 -3.7 -4.2 -4.0 -3.9 -3.6 -2.9 -2.7 -2.6 -3.3 -3.9 -2.6 -0.9
Primary balance, excl. external grants -11.2 -11.9 -12.4 -11.5 -10.8 -9.5 -7.4 -7.2 -6.8 -6.5 -5.2 -6.1 -3.8 -1.5
Net domestic financing 0.3 -1.8 0.0 3.2 1.9 1.5 0.7 0.4 0.4 0.4 2.5 2.5 2.5 2.0
Interest rate (percent) 8.0 8.0 8.0 8.0 8.0 8.0 8.0 8.0 8.0 8.0 8.0 8.0 8.0
New external borrowing1 2.6 1.9 2.2 4.2 5.5 5.1 4.4 3.9 3.7 3.2 3.4 2.7 0.8
Grant element of new external borrowing (percent) 38.7 34.2 54.6 47.2 47.5 51.9 33.3 38.7 24.7 18.2
Balance of payments
Exports of goods and services 14.0 14.0 15.6 16.9 15.8 16.8 17.1 17.6 17.4 17.1 18.5 18.1 18.8 18.8
Imports of goods and services 34.1 34.3 32.5 33.7 34.3 36.2 33.6 32.1 31.5 30.9 30.5 30.5 30.5 30.5
Current account, incl. official transfers -7.2 -11.3 -7.4 -11.5 -14.5 -15.4 -14.0 -11.5 -10.9 -10.7 -9.8 -9.7 -9.6 -9.4
Foreign Direct Investment 1.7 2.2 3.4 3.4 4.0 4.1 4.1 4.3 3.9 3.9 4.6 4.4 4.8 4.9
Gross official reserves (months of imports of G&S) 5.1 4.1 5.1 4.2 3.4 3.2 3.0 3.0 3.0 3.1 4.5 4.5 4.5 4.5
Source: Rwandan authorities, IMF and World Bank staff.
1 Includes publicly guaranteed external borrowing.
UNDERLYING ASSUMPTIONS
3. The medium and long-term macroeconomic framework underlying the DSA is
consistent with the baseline scenario presented in the Staff Report for 4th
review of the PSI
program. The main assumptions and projections for key macroeconomic variables are
summarized in Box 1 and Table 2. The main differences between the current assumptions and
those underlying the last DSA update are: (i) the current account deficit (as a share of GDP) is
worse, largely due to weaker mineral exports; (ii) medium-term GDP growth is lower; (iii) external
grants decline faster beyond 2020; and (iv) from 2020 onward, the central government is more
reliant on external commercial borrowing to meet its external financing need, including bonds
issued in the international capital market. Table 3 shows the near-term differences in the
underlying baseline assumptions between the current and previous DSAs.
Table 2. Key Assumptions

RWANDA
4 INTERNATIONAL MONETARY FUND
2015 2016 2017 2015 2016 2017
Proj. Proj. Proj. Proj. Proj. Proj.
Stock of public and publicly-guaranteed (PPG) external debt
Millions of U.S. dollars 2,259 2,628 3,132 2,281 2,956 3,363
Percent of GDP 27.0 28.6 31.1 28.6 36.0 37.6
Present value (PV) of PPG external debt
Millions of U.S. dollars 1,573 1,769 2,065 1,494 1,936 2,114
Percent of GDP 18.8 19.3 20.5 18.7 23.6 23.7
PV of PPG external debt to revenues (percent)3 95.5 95.6 102.0 91.5 109.0 120.6
PV of PPG external debt to exports (percent) 124.2 130.6 131.5 118.7 140.1 138.7
PPG external debt service to revenues (percent) 6.5 6.1 5.8 6.2 6.1 8.0
PPG external debt service to exports (percent) 8.5 8.4 7.5 8.1 7.9 9.2
Discount rate (percent) 5.0 5.0 5.0 5.0 5.0 5.0
(Percent of GDP, unless indicated otherwise)
Nominal GDP (RF billions) 5,940 6,722 7,590 5,955 6,589 7,389
Real GDP (percentage change) 6.0 7.0 7.5 7.0 6.3 6.7
GDP Deflator (percentage change) 5.2 5.8 5.0 3.3 4.1 5.1
Fiscal
External grants (incl. HIPC relief) 5.8 4.1 3.5 6.8 5.4 3.7
Revenue (excl. external grants) 18.4 19.0 19.3 17.6 18.6 18.2
Primary expenditures 27.7 25.8 25.6 28.4 28.1 25.6
Primary balance, incl. external grants -3.5 -2.7 -2.8 -4.0 -3.9 -3.6
Primary balance, excl. external grants -9.3 -6.8 -6.3 -10.8 -9.5 -7.4
Grant element of new external borrowing (percent)2 46.1 47.6 43.0 38.7 34.2 54.6
Balance of payments
Exports of goods and services 15.2 14.8 15.6 15.8 16.8 17.1
Millions of U.S. dollars 1,285 1,374 1,593 1,305 1,431 1,547
Imports of goods and services 32.2 28.9 29.0 34.3 36.2 33.6
Millions of U.S. dollars 2,730 2,695 2,963 2,835 3,081 3,045
Current account, incl. official transfers -11.0 -9.1 -8.9 -14.5 -15.4 -14.0
Sources: Rwandan authorities, IMF, and World Bank staff.1 See IMF Country Report No. 14/343, December 2014.
2 Includes publicly-guaranteed external borrowing.3 Larger non-concessional borrowing in 2015 and 2016 in
current DSA makes this ratio higher in 2017 relative to the
previous DSA.
Previous DSA1 Current DSA
Table 3. Baseline External DSA Compared to the Previous DSA Update, 2015-17

RWANDA
INTERNATIONAL MONETARY FUND 5
Box 1. Macroeconomic Framework for the DSA
Despite near-term weakness in the mining sector, the medium-term and long-term framework underpinning
the DSA assumes that Rwanda continues to enjoy rapid growth, and low and stable inflation.
Key highlights:
Growth: Long-run growth is projected at 7.5 percent. The composition of growth is expected to shift
toward the private sector and exports as policies designed to expand and diversify the export base bear
fruit.
External sector: Near-term weakness in mineral exports will be partially offset by buoyancy in exports
of coffee and tea, non-traditional exports and tourism. Exports of goods and services (as a percent of
GDP) are expected to gradually rise over the projection horizon. Despite the anticipated completion of
some current projects in the near-term, import needs are expected to remain high, reflecting continued
high investment needs in the economy. Consequently, Rwanda’s external current account is projected to
remain in deficit throughout the period under consideration, though the gap is expected to narrow.
Inflation: Inflation is expected to remain contained. After falling at the end of 2014 to 2.1 percent, the
rate is expected to be anchored to the authorities’ medium-term target of 5 percent. Improvements in
agricultural productivity are expected to lower food prices over the long run, containing a key driver of
inflation in Rwanda.
Reserves: Reserve buffers are expected to attain coverage of 4.5 months of prospective imports by
2023, consistent with the monetary integration process among East African Community members.
Fiscal outlook. The key fiscal assumption is that there would be a gradual and consistent rise in
domestic revenues (excluding grants) from 2015 to 2035. This reflects the authorities’ commitment to
raise Rwanda’s revenue collection efforts to comparable level observed in other countries in the region.
Primary expenditures are forecast to remain high, reflecting the need for ongoing significant capital and
current spending.
Grants. The DSA assumes a tapering of external donor assistance, reflecting reduced access to grants,
given Rwandan’s improved debt distress risk rating, and greater capacity to mobilize and use domestic
revenue
External borrowing. The assumptions for new external borrowing vary over the assessment period.
From 2015-2020, the framework assumes central government external borrowing needs are met mainly
by disbursements of already-contracted external multilateral and bilateral debt; while public guaranteed
external borrowing associated with RwandAir’s expansion and the completion of the Kigali Convention
Center is done via commercial debt. From 2021 onward, the framework assumes that the external
financing need of the central government will be financed by new external debt, with a progressively
increasing share from commercial debt, including bonds issued in the international capital market.
Domestic borrowing. The framework assumes that domestic borrowing will continue to decline until
2019 as the authorities anchor fiscal policy on a goal of limiting net domestic financing. From 2020,
domestic borrowing of 2.5 percent of GDP is assumed, which sees share of domestic debt rise. Over
time, the composition of domestic borrowing is also expected to shift towards medium- and long-term
debt as the authorities intensify efforts to develop the local government bond market.
Domestic interest rates. New domestic borrowing is expected to be contracted at a nominal interest
rate of 8 percent—a weighted average of the cost of short-and long-term domestic debt.

RWANDA
6 INTERNATIONAL MONETARY FUND
DEBT SUSTAINABILITY ANALYSIS
A. External DSA
4. Based on the assumptions outlined above, Rwanda’s debt is assessed to be
sustainable with low risk of debt distress (Appendix Figures 1a and Tables 1a and 1b).
Similar to the last DSA update, the joint Bank-Fund debt sustainability framework (DSF) for
low-income countries classifies Rwanda as a “strong” performer, based on the quality of the
country’s policies and institutions as measured by the 3-year average of the ratings under the
World Bank’s Country Policy and Institutional Assessment (CPIA). This is reflected in higher debt
sustainability thresholds compared to countries operating in a weak policy environment.3 Under
the baseline scenario all debt burden indicators are projected to remain comfortably below the
policy-dependent thresholds. Standard stress tests show in 2023 (when the Eurobond issued in
2013 is set to mature) marginal temporary breaches of the debt service-to-revenue ratio, and the
debt service-to-exports ratio thresholds. These findings highlight the vulnerability of the
Rwandan economy to external shocks and liquidity pressures at the time the Eurobond matures.
However, as the breaches of these debt service ratios are temporary, and taking into account the
low level of external debt and strengthening indicators of repayment capacity (the expansion of
Rwanda’s export base and tax revenues), and that Rwanda is assumed to refinance the maturing
Eurobond, the final assessment for Rwanda’s external public and public guaranteed debt is a low
risk of debt distress.
B. Public DSA
5. Adding domestic public debt to external debt does not change the results of the
analysis (see Appendix Figure 1b and Tables 2a and 2b). The evolution of the total public
debt indicators broadly follows that of external debt under the baseline. The DSA suggests that
public debt remains stable under the baseline. Based on the 3 indicators examined—PV of public
debt-to-GDP, PV of public debt-to-revenue and debt service of public debt-to-revenue—the
long-term path of total public debt is projected to be broadly stable in the baseline
(Appendix Figure 1b). PV of public debt-to-GDP remains comfortably below the indicative
benchmark throughout the assessment period. The sharp increase in the PV of debt-to-revenue
indicator when the primary balance is assumed fixed at 2015 level highlights the importance of
securing the revenue gains assumed under the baseline.
3 The thresholds for strong performers are 200, 50 and 300 percent for the PV of debt to exports, GDP and
government revenue, respectively. Debt service thresholds are 25 and 22 percent of exports and revenue,
respectively.

RWANDA
INTERNATIONAL MONETARY FUND 7
AUTHORITIES’ VIEW 6. The Rwandan authorities broadly agree with the results of this DSA and the overall
assessment of low risk of debt distress. They agree with the assessment that the main risk to
debt vulnerability remains the narrow export base. However, at the same time, they also
anticipate that the on-going investments and the implementation of measures to boost the
traditional and non-traditional exports and tourism sectors will make the expansion in the export
base sufficiently durable to mitigate this risk (see Box. 2 in Staff Report). Further, the authorities
agree that maintaining a prudent medium-term debt management strategy and carefully and
prudently assessing future projects and their financing remain important to prevent public debt
from becoming unsustainable.
CONCLUSION
7. Rwanda continues to face a low risk of debt distress but remains subject to external
vulnerabilities. Under the current set of baseline assumptions, Rwanda’s debt burden indicators
remain below the policy-related thresholds under baseline scenario, with temporary breaches of
the respective thresholds of the debt service-to-revenue and the debt service-to-exports ratios
in 2023 under standard stress tests. These breaches of the two liquidity ratios underscore
Rwanda’s susceptibility to external shocks and the potential risk of liquidity pressures in the
future. However it is judged that the risk arising from these breaches can be mitigated by the
ability of the authorities to refinance non-concessional debt falling due in 2023, provided that
sound macroeconomic and fiscal policies are maintained. Public debt is low and Rwanda’s
external debt burden profile is also expected to improve further, given the anticipated strong
growth and expansion in exports.
8. The main risk to Rwanda’s debt sustainability remains the narrow export base.
While it is assumed that this risk will be mitigated by export expansion and diversification over
the assessment period, the near-term weakness in mineral exports underscores the vulnerability
associated with a narrow export base heavily dependent on fluctuating commodity prices.
Moreover, should the anticipated medium-to long-term export gains fail to materialize, resulting
significantly in lower than expected export revenues, the risks to debt sustainability over the
longer term would increase.

RWANDA
8 INTERNATIONAL MONETARY FUND
Historical6/
Standard6/
Average Deviation 2015-2020 2021-2035
2012 2013 2014 2015 2016 2017 2018 2019 2020 Average 2025 2035 Average
External debt (nominal) 1/ 21.4 26.6 28.0 32.5 39.6 40.7 40.9 40.6 40.0 37.3 27.1
of which: public and publicly guaranteed (PPG) 16.8 22.1 23.7 28.6 36.0 37.6 38.2 38.2 37.9 35.2 23.5
Change in external debt -1.2 5.2 1.4 4.5 7.1 1.2 0.1 -0.3 -0.5 -0.3 -2.0
Identified net debt-creating flows 7.2 3.2 6.9 8.7 9.3 7.5 4.6 3.7 3.0 2.8 2.5
Non-interest current account deficit 10.8 6.7 10.5 5.4 4.2 13.5 14.3 12.9 10.4 9.7 9.8 9.3 8.6 9.0
Deficit in balance of goods and services 20.2 16.9 16.8 18.5 19.4 16.5 14.5 14.1 13.8 12.4 11.6
Exports 14.0 15.6 16.9 15.8 16.8 17.1 17.6 17.4 17.1 18.1 18.8
Imports 34.3 32.5 33.7 34.3 36.2 33.6 32.1 31.5 30.9 30.5 30.5
Net current transfers (negative = inflow) -10.0 -11.3 -7.3 -11.4 2.0 -6.3 -6.6 -4.6 -5.1 -4.8 -4.6 -3.2 -2.5 -3.0
of which: official -7.5 -8.9 -4.2 -4.5 -4.4 -2.4 -2.1 -1.9 -1.8 -1.2 -0.5
Other current account flows (negative = net inflow) 0.6 1.1 0.9 1.3 1.5 1.0 0.9 0.5 0.6 0.1 -0.5
Net FDI (negative = inflow) -1.5 -3.4 -3.4 -1.6 1.1 -4.0 -4.1 -4.1 -4.3 -4.6 -4.9 -4.4 -4.9 -4.6
Endogenous debt dynamics 2/ -2.1 -0.1 -0.2 -0.8 -0.9 -1.3 -1.4 -1.5 -1.8 -2.1 -1.2
Contribution from nominal interest rate 0.4 0.7 1.1 1.0 1.1 1.2 1.1 1.2 0.9 0.5 0.8
Contribution from real GDP growth -1.8 -1.0 -1.8 -1.9 -2.0 -2.5 -2.5 -2.6 -2.8 -2.6 -2.0
Contribution from price and exchange rate changes -0.8 0.1 0.5 … … … … … … … …
Residual (3-4) 3/ -8.4 2.0 -5.5 -4.2 -2.3 -6.3 -4.5 -4.0 -3.6 -3.1 -4.6
of which: exceptional financing 0.0 0.0 0.0 0.0 0.0 0.0 0.0 0.0 0.0 0.0 0.0
PV of external debt 4/ ... ... 20.0 22.6 27.1 26.8 26.3 25.6 24.8 24.0 20.4
In percent of exports ... ... 118.3 143.5 161.3 157.0 149.4 147.3 144.9 132.1 108.2
PV of PPG external debt ... ... 15.7 18.7 23.6 23.7 23.6 23.3 22.7 21.9 16.8
In percent of exports ... ... 92.7 118.7 140.1 138.7 134.1 133.8 132.6 120.6 89.2
In percent of government revenues ... ... 81.8 91.5 109.0 120.6 113.7 111.8 108.5 101.8 71.6
Debt service-to-exports ratio (in percent) 6.1 8.4 10.2 11.8 11.7 13.2 14.2 14.5 13.5 12.0 20.4
PPG debt service-to-exports ratio (in percent) 3.6 5.3 7.0 8.1 7.9 9.2 10.2 10.1 8.8 5.5 7.8
PPG debt service-to-revenue ratio (in percent) 2.6 4.1 6.2 6.2 6.1 8.0 8.6 8.5 7.2 4.7 6.3
Total gross financing need (Billions of U.S. dollars) 0.8 0.4 0.7 1.0 1.1 1.0 0.9 0.9 0.9 1.5 4.8
Non-interest current account deficit that stabilizes debt ratio 12.1 1.5 9.1 9.0 7.2 11.7 10.2 10.1 10.3 9.5 10.6
Key macroeconomic assumptions
Real GDP growth (in percent) 8.8 4.7 6.9 7.4 1.9 7.0 6.3 6.7 6.8 7.0 7.5 6.9 7.5 7.5 7.5
GDP deflator in US dollar terms (change in percent) 3.6 -0.5 -1.8 4.8 5.9 -2.1 -3.2 -0.1 1.9 1.9 1.9 0.1 2.0 2.0 2.0
Effective interest rate (percent) 5/ 2.1 3.5 4.3 2.5 1.1 3.8 3.5 3.2 3.0 3.1 2.5 3.2 1.4 3.1 2.1
Growth of exports of G&S (US dollar terms, in percent) 13.2 15.5 14.0 18.8 21.5 -2.2 9.7 8.1 12.1 8.0 8.0 7.3 10.9 9.6 10.3
Growth of imports of G&S (US dollar terms, in percent) 13.3 -1.4 9.2 18.6 14.4 6.4 8.7 -1.2 4.0 7.1 7.6 5.4 9.6 9.4 9.5
Grant element of new public sector borrowing (in percent) ... ... ... ... ... 38.7 34.2 54.6 47.2 47.5 51.9 45.7 38.7 18.2 29.6Government revenues (excluding grants, in percent of GDP) 19.7 19.8 19.2 20.5 21.6 19.6 20.7 20.8 20.9 21.5 23.5 22.2Aid flows (in Billions of US dollars) 7/ 0.7 0.8 0.6 0.7 0.7 0.7 0.5 0.5 0.6 0.6 0.3
of which: Grants 0.3 0.4 0.4 0.3 0.2 0.2 0.2 0.2 0.2 0.2 0.2of which: Concessional loans 0.4 0.4 0.2 0.3 0.5 0.5 0.3 0.3 0.3 0.4 0.1
Grant-equivalent financing (in percent of GDP) 8/ ... ... ... 6.1 5.3 5.1 4.4 4.0 4.0 2.4 0.5 1.8
Grant-equivalent financing (in percent of external financing) 8/ ... ... ... 63.1 49.2 69.0 65.5 66.4 69.1 54.1 42.1 45.6
Memorandum items:
Nominal GDP (Billions of US dollars) 7.2 7.5 7.9 8.3 8.5 9.1 9.9 10.8 11.8 18.7 47.0
Nominal dollar GDP growth 12.7 4.1 5.0 4.8 2.9 6.6 8.9 9.1 9.6 7.0 9.6 9.6 9.6
PV of PPG external debt (in Billions of US dollars) 1.2 1.5 1.9 2.1 2.3 2.5 2.6 4.0 7.8
(PVt-PVt-1)/GDPt-1 (in percent) 3.5 5.3 2.1 2.0 1.8 1.6 2.7 2.1 0.2 1.6
Gross workers' remittances (Billions of US dollars) 0.2 0.2 0.2 0.2 0.2 0.2 0.2 0.2 0.2 0.4 0.0
PV of PPG external debt (in percent of GDP + remittances) ... ... 15.3 18.4 23.1 23.2 23.1 22.8 22.3 21.5 16.8
PV of PPG external debt (in percent of exports + remittances) ... ... 81.9 105.6 125.1 124.6 120.8 120.3 118.9 108.7 89.2
Debt service of PPG external debt (in percent of exports + remittances) ... ... 6.2 7.2 7.1 8.2 9.2 9.1 7.9 5.0 7.8
Sources: Country authorities; and staff estimates and projections. 0
1/ Includes both public and private sector external debt.
2/ Derived as [r - g - ρ(1+g)]/(1+g+ρ+gρ) times previous period debt ratio, with r = nominal interest rate; g = real GDP growth rate, and ρ = growth rate of GDP deflator in U.S. dollar terms.
3/ Includes exceptional financing (i.e., changes in arrears and debt relief); changes in gross foreign assets; and valuation adjustments. For projections also includes contribution from price and exchange rate changes.
4/ Assumes that PV of private sector debt is equivalent to its face value.
5/ Current-year interest payments divided by previous period debt stock.
6/ Historical averages and standard deviations are generally derived over the past 10 years, subject to data availability.
7/ Defined as grants, concessional loans, and debt relief.
8/ Grant-equivalent financing includes grants provided directly to the government and through new borrowing (difference between the face value and the PV of new debt).
Actual Projections
Table 1a: External Debt Sustainability Framework, Baseline Scenario, 2012-20351
(In percent of GDP, unless otherwise indicated)
RW
AN
DA
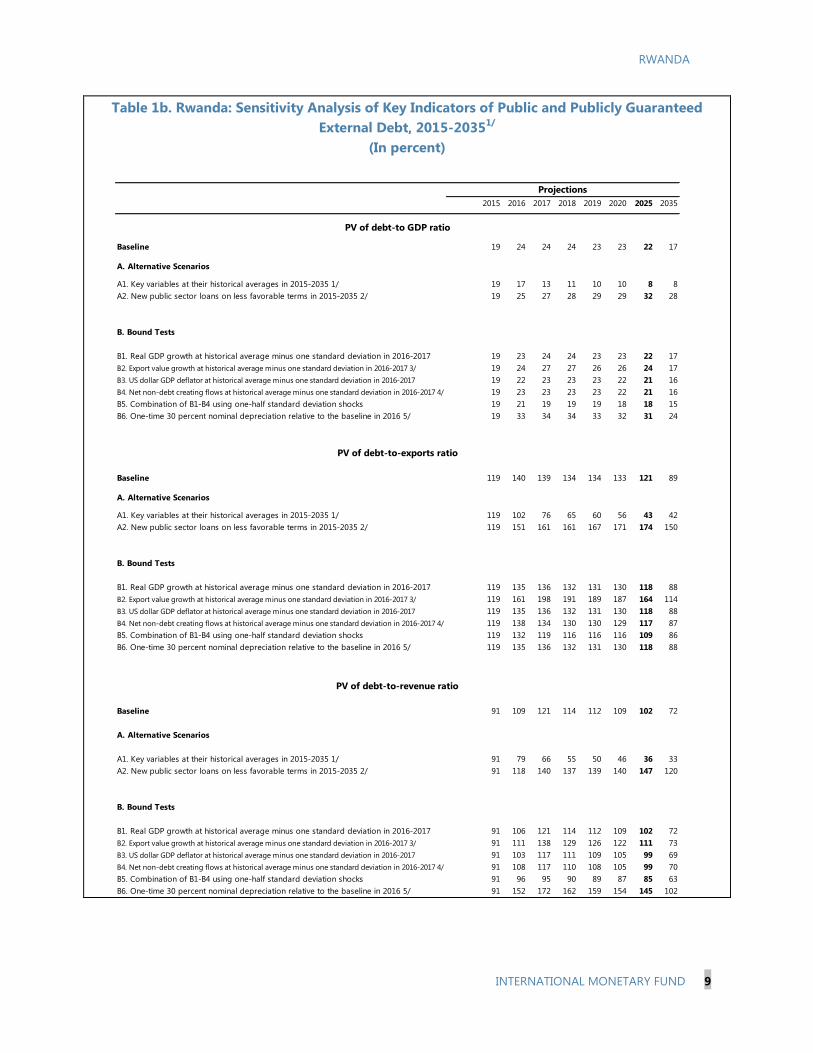
RWANDA
INTERNATIONAL MONETARY FUND 9
2015 2016 2017 2018 2019 2020 2025 2035
Baseline 19 24 24 24 23 23 22 17
A. Alternative Scenarios
A1. Key variables at their historical averages in 2015-2035 1/ 19 17 13 11 10 10 8 8
A2. New public sector loans on less favorable terms in 2015-2035 2/ 19 25 27 28 29 29 32 28
B. Bound Tests
B1. Real GDP growth at historical average minus one standard deviation in 2016-2017 19 23 24 24 23 23 22 17
B2. Export value growth at historical average minus one standard deviation in 2016-2017 3/ 19 24 27 27 26 26 24 17
B3. US dollar GDP deflator at historical average minus one standard deviation in 2016-2017 19 22 23 23 23 22 21 16
B4. Net non-debt creating flows at historical average minus one standard deviation in 2016-2017 4/ 19 23 23 23 23 22 21 16
B5. Combination of B1-B4 using one-half standard deviation shocks 19 21 19 19 19 18 18 15
B6. One-time 30 percent nominal depreciation relative to the baseline in 2016 5/ 19 33 34 34 33 32 31 24
Baseline 119 140 139 134 134 133 121 89
A. Alternative Scenarios
A1. Key variables at their historical averages in 2015-2035 1/ 119 102 76 65 60 56 43 42
A2. New public sector loans on less favorable terms in 2015-2035 2/ 119 151 161 161 167 171 174 150
B. Bound Tests
B1. Real GDP growth at historical average minus one standard deviation in 2016-2017 119 135 136 132 131 130 118 88
B2. Export value growth at historical average minus one standard deviation in 2016-2017 3/ 119 161 198 191 189 187 164 114
B3. US dollar GDP deflator at historical average minus one standard deviation in 2016-2017 119 135 136 132 131 130 118 88
B4. Net non-debt creating flows at historical average minus one standard deviation in 2016-2017 4/ 119 138 134 130 130 129 117 87
B5. Combination of B1-B4 using one-half standard deviation shocks 119 132 119 116 116 116 109 86
B6. One-time 30 percent nominal depreciation relative to the baseline in 2016 5/ 119 135 136 132 131 130 118 88
Baseline 91 109 121 114 112 109 102 72
A. Alternative Scenarios
A1. Key variables at their historical averages in 2015-2035 1/ 91 79 66 55 50 46 36 33
A2. New public sector loans on less favorable terms in 2015-2035 2/ 91 118 140 137 139 140 147 120
B. Bound Tests
B1. Real GDP growth at historical average minus one standard deviation in 2016-2017 91 106 121 114 112 109 102 72
B2. Export value growth at historical average minus one standard deviation in 2016-2017 3/ 91 111 138 129 126 122 111 73
B3. US dollar GDP deflator at historical average minus one standard deviation in 2016-2017 91 103 117 111 109 105 99 69
B4. Net non-debt creating flows at historical average minus one standard deviation in 2016-2017 4/ 91 108 117 110 108 105 99 70
B5. Combination of B1-B4 using one-half standard deviation shocks 91 96 95 90 89 87 85 63
B6. One-time 30 percent nominal depreciation relative to the baseline in 2016 5/ 91 152 172 162 159 154 145 102
PV of debt-to-exports ratio
PV of debt-to-revenue ratio
PV of debt-to GDP ratio
Projections
Table 1b. Rwanda: Sensitivity Analysis of Key Indicators of Public and Publicly Guaranteed
External Debt, 2015-20351/
(In percent)
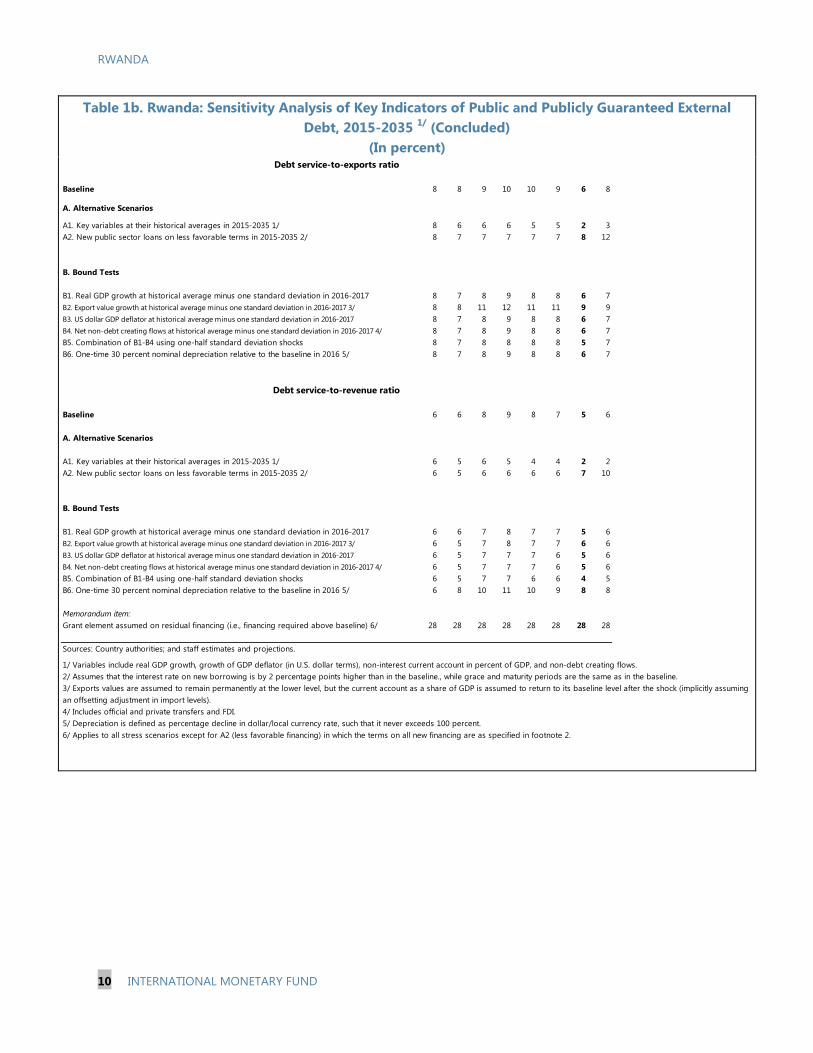
RWANDA
10 INTERNATIONAL MONETARY FUND
Baseline 8 8 9 10 10 9 6 8
A. Alternative Scenarios
A1. Key variables at their historical averages in 2015-2035 1/ 8 6 6 6 5 5 2 3
A2. New public sector loans on less favorable terms in 2015-2035 2/ 8 7 7 7 7 7 8 12
B. Bound Tests
B1. Real GDP growth at historical average minus one standard deviation in 2016-2017 8 7 8 9 8 8 6 7
B2. Export value growth at historical average minus one standard deviation in 2016-2017 3/ 8 8 11 12 11 11 9 9
B3. US dollar GDP deflator at historical average minus one standard deviation in 2016-2017 8 7 8 9 8 8 6 7
B4. Net non-debt creating flows at historical average minus one standard deviation in 2016-2017 4/ 8 7 8 9 8 8 6 7
B5. Combination of B1-B4 using one-half standard deviation shocks 8 7 8 8 8 8 5 7
B6. One-time 30 percent nominal depreciation relative to the baseline in 2016 5/ 8 7 8 9 8 8 6 7
Baseline 6 6 8 9 8 7 5 6
A. Alternative Scenarios
A1. Key variables at their historical averages in 2015-2035 1/ 6 5 6 5 4 4 2 2
A2. New public sector loans on less favorable terms in 2015-2035 2/ 6 5 6 6 6 6 7 10
B. Bound Tests
B1. Real GDP growth at historical average minus one standard deviation in 2016-2017 6 6 7 8 7 7 5 6
B2. Export value growth at historical average minus one standard deviation in 2016-2017 3/ 6 5 7 8 7 7 6 6
B3. US dollar GDP deflator at historical average minus one standard deviation in 2016-2017 6 5 7 7 7 6 5 6
B4. Net non-debt creating flows at historical average minus one standard deviation in 2016-2017 4/ 6 5 7 7 7 6 5 6
B5. Combination of B1-B4 using one-half standard deviation shocks 6 5 7 7 6 6 4 5
B6. One-time 30 percent nominal depreciation relative to the baseline in 2016 5/ 6 8 10 11 10 9 8 8
Memorandum item:
Grant element assumed on residual financing (i.e., financing required above baseline) 6/ 28 28 28 28 28 28 28 28
Sources: Country authorities; and staff estimates and projections.
1/ Variables include real GDP growth, growth of GDP deflator (in U.S. dollar terms), non-interest current account in percent of GDP, and non-debt creating flows.
2/ Assumes that the interest rate on new borrowing is by 2 percentage points higher than in the baseline., while grace and maturity periods are the same as in the baseline.
3/ Exports values are assumed to remain permanently at the lower level, but the current account as a share of GDP is assumed to return to its baseline level after the shock (implicitly assuming
an offsetting adjustment in import levels).
4/ Includes official and private transfers and FDI.
5/ Depreciation is defined as percentage decline in dollar/local currency rate, such that it never exceeds 100 percent.
6/ Applies to all stress scenarios except for A2 (less favorable financing) in which the terms on all new financing are as specified in footnote 2.
Debt service-to-revenue ratio
Debt service-to-exports ratio
Table 1b. Rwanda: Sensitivity Analysis of Key Indicators of Public and Publicly Guaranteed External
Debt, 2015-2035 1/
(Concluded)
(In percent)

RWANDA
INTERNATIONAL MONETARY FUND 11
Estimate
2012 2013 2014Average
5
/
Standard
Deviation
5/
2015 2016 2017 2018 2019 2020
2015-20
Average 2025 2035
2021-35
Average
Public sector debt 1/ 17.0 27.1 29.9 35.1 41.9 43.6 43.9 43.7 43.3 48.1 42.2
of which: foreign-currency denominated 16.8 22.1 23.7 28.6 36.0 37.6 38.2 38.2 37.9 35.2 23.5
Change in public sector debt -5.6 10.2 2.8 5.2 6.8 1.7 0.3 -0.2 -0.5 0.8 -2.4
Identified debt-creating flows -4.5 0.3 0.1 0.8 1.3 -0.1 -1.6 -2.1 -2.3 -0.4 -2.0
Primary deficit 2.6 3.8 4.3 0.9 2.1 4.2 4.1 3.6 2.9 2.3 2.4 3.2 4.0 0.7 2.9
Revenue and grants 24.2 25.0 24.1 24.3 24.1 22.0 23.0 23.0 23.0 22.6 23.8
of which: grants 4.5 5.3 4.9 3.9 2.5 2.3 2.3 2.2 2.1 1.1 0.3
Primary (noninterest) expenditure 26.7 28.8 28.4 28.5 28.2 25.5 25.9 25.4 25.4 26.7 24.5
Automatic debt dynamics -1.7 0.3 -0.7 -0.1 -0.1 -2.2 -2.3 -2.3 -2.7 -3.4 -2.4
Contribution from interest rate/growth differential -1.7 -0.2 -1.0 -1.3 -1.5 -2.1 -2.3 -2.3 -2.7 -3.4 -2.4
of which: contribution from average real interest rate 0.1 0.6 0.7 0.7 0.6 0.5 0.5 0.5 0.3 -0.1 0.7
of which: contribution from real GDP growth -1.8 -0.8 -1.8 -1.9 -2.1 -2.6 -2.8 -2.9 -3.1 -3.3 -3.1
Contribution from real exchange rate depreciation 0.1 0.5 0.3 1.2 1.3 0.0 0.0 0.0 0.0 ... ...
Other identified debt-creating flows -5.3 -3.8 -3.5 -3.3 -2.6 -1.5 -2.2 -2.1 -2.0 -1.1 -0.3
Privatization receipts (negative) -5.6 -4.1 -3.0 -3.5 -3.5 -1.8 -2.4 -2.2 -2.1 -1.2 -0.3
Recognition of implicit or contingent liabilities 0.0 0.0 0.0 0.0 0.0 0.0 0.0 0.0 0.0 0.0 0.0
Debt relief (HIPC and other) 0.0 0.0 0.0 0.0 0.0 0.0 0.0 0.0 0.0 0.0 0.0
Other (specify, e.g. bank recapitalization) 0.3 0.3 -0.5 0.2 0.9 0.2 0.2 0.2 0.2 0.1 0.0
Residual, including asset changes 6/ -1.2 9.9 2.7 4.4 5.5 1.8 2.0 1.9 1.8 1.2 -0.4
Other Sustainability Indicators
PV of public sector debt ... ... 21.9 25.2 29.4 29.6 29.3 28.8 28.1 34.8 35.5
of which: foreign-currency denominated ... ... 15.7 18.7 23.6 23.7 23.6 23.3 22.7 21.9 16.8
of which: external ... ... 15.7 18.7 23.6 23.7 23.6 23.3 22.7 21.9 16.8
PV of contingent liabilities (not included in public sector debt) ... ... ... ... ... ... ... ... ... ... ...
Gross financing need 2/ 5.2 3.1 7.8 8.5 8.7 8.3 8.3 7.5 7.0 14.7 19.8
PV of public sector debt-to-revenue and grants ratio (in percent) … … 91.1 103.6 122.2 134.8 127.2 125.2 122.0 153.6 149.2
PV of public sector debt-to-revenue ratio (in percent) … … 114.5 123.2 136.1 151.0 141.4 138.4 134.1 161.7 151.3
of which: external 3/ … … 81.8 91.5 109.0 120.6 113.7 111.8 108.5 101.8 71.6
Debt service-to-revenue and grants ratio (in percent) 4/ 3.4 4.5 6.2 6.4 7.0 8.9 9.6 9.5 8.4 7.6 11.9
Debt service-to-revenue ratio (in percent) 4/ 4.2 5.7 7.8 7.6 7.8 10.0 10.7 10.5 9.2 8.0 12.1
Primary deficit that stabilizes the debt-to-GDP ratio 8.2 -6.4 1.5 -1.0 -2.7 1.9 2.5 2.5 2.8 3.2 3.1
Key macroeconomic and fiscal assumptions
Real GDP growth (in percent) 8.8 4.7 6.9 7.4 1.9 7.0 6.3 6.7 6.8 7.0 7.5 6.9 7.5 7.5 7.5
Average nominal interest rate on forex debt (in percent) 4.8 5.7 7.0 5.3 1.9 3.7 3.4 3.1 2.9 3.0 2.4 3.1 1.2 2.9 1.8
Average real interest rate on domestic debt (in percent) -9.0 -39.5 -8.7 -13.5 11.9 1.8 2.0 2.2 2.9 3.3 3.5 2.6 1.8 2.9 1.9
Real exchange rate depreciation (in percent, + indicates depreciation) 0.3 2.9 1.5 -2.4 4.7 5.1 ... ... ... ... ... ... ... ... ...
Inflation rate (GDP deflator, in percent) 6.1 4.7 3.6 7.5 3.9 3.3 4.1 5.1 5.0 5.0 5.0 4.6 5.0 5.0 5.0
Growth of real primary spending (deflated by GDP deflator, in percent) 16.3 12.8 5.4 4.4 6.6 7.4 5.1 -3.3 8.4 4.7 7.6 5.0 7.0 6.6 7.3
Grant element of new external borrowing (in percent) ... ... ... … … 38.7 34.2 54.6 47.2 47.5 51.9 45.7 38.7 18.2 ...
Sources: Country authorities; and staff estimates and projections.1/ Indicate coverage of public sector.
2/ Gross financing need is defined as the primary deficit plus debt service plus the stock of short-term debt at the end of the last period.
3/ Revenues excluding grants.
4/ Debt service is defined as the sum of interest and amortization of medium and long-term debt.
5/ Historical averages and standard deviations are generally derived over the past 10 years, subject to data availability.
6/ Residuals in 2015 and 2016 arise mainly because guaranteed non-concessional loans are excluded from the fiscal accounts.
Actual Projections
Table 2a: Rwanda: Public Sector Debt Sustainability Framework, Baseline Scenario, 2012-20351/
(In percent of GDP, unless otherwise indicated)
RW
AN
DA

RWANDA
12 INTERNATIONAL MONETARY FUND
2015 2016 2017 2018 2019 2020 2025 2035
Baseline 25 29 30 29 29 28 35 36
A. Alternative scenarios
A1. Real GDP growth and primary balance are at historical averages 25 27 25 23 22 21 18 19A2. Primary balance is unchanged from 2015 25 30 30 31 31 32 38 49
A3. Permanently lower GDP growth 1/ 25 30 30 30 30 29 39 49
B. Bound tests
B1. Real GDP growth is at historical average minus one standard deviations in 2016-2017 25 30 31 31 30 30 38 40
B2. Primary balance is at historical average minus one standard deviations in 2016-2017 25 29 28 28 28 27 34 35
B3. Combination of B1-B2 using one half standard deviation shocks 25 28 27 27 27 26 33 35
B4. One-time 30 percent real depreciation in 2016 25 37 36 35 34 32 37 40
B5. 10 percent of GDP increase in other debt-creating flows in 2016 25 36 36 36 35 34 39 38
Baseline 104 122 135 127 125 122 154 149
A. Alternative scenarios
A1. Real GDP growth and primary balance are at historical averages 104 112 114 102 96 90 81 81
A2. Primary balance is unchanged from 2015 104 122 137 133 137 139 166 204
A3. Permanently lower GDP growth 1/ 104 123 137 130 130 128 173 205
B. Bound tests
B1. Real GDP growth is at historical average minus one standard deviations in 2016-2017 104 124 139 132 132 129 167 168
B2. Primary balance is at historical average minus one standard deviations in 2016-2017 104 119 130 123 121 118 150 148
B3. Combination of B1-B2 using one half standard deviation shocks 104 116 123 117 115 113 147 147
B4. One-time 30 percent real depreciation in 2016 104 155 164 151 146 140 165 167
B5. 10 percent of GDP increase in other debt-creating flows in 2016 104 151 165 155 152 147 174 160
Baseline 6 7 9 10 10 8 8 12
A. Alternative scenarios
A1. Real GDP growth and primary balance are at historical averages 6 7 8 9 8 7 5 7
A2. Primary balance is unchanged from 2015 6 7 9 10 10 9 8 14
A3. Permanently lower GDP growth 1/ 6 7 9 10 10 9 8 15
B. Bound tests
B1. Real GDP growth is at historical average minus one standard deviations in 2016-2017 6 7 9 10 10 9 8 13
B2. Primary balance is at historical average minus one standard deviations in 2016-2017 6 7 9 9 9 8 7 12
B3. Combination of B1-B2 using one half standard deviation shocks 6 7 9 9 9 8 7 12
B4. One-time 30 percent real depreciation in 2016 6 8 12 13 13 12 11 16
B5. 10 percent of GDP increase in other debt-creating flows in 2016 6 7 10 11 11 10 10 13
Sources: Country authorities; and staff estimates and projections.
1/ Assumes that real GDP growth is at baseline minus one standard deviation divided by the square root of the length of the projection period.
2/ Revenues are defined inclusive of grants.
PV of Debt-to-GDP Ratio
Projections
PV of Debt-to-Revenue Ratio 2/
Debt Service-to-Revenue Ratio 2/
Table 2b. Rwanda: Sensitivity Analysis for Key Indicators of Public Debt 2015–2035

RWANDA
INTERNATIONAL MONETARY FUND 13
Sources: Country authorities; and staff estimates and projections.
1/ The most extreme stress test is the test that yields the highest ratio on or before 2025. In figure
b. it corresponds to a One-time depreciation shock; in c. to a Exports shock; in d. to a One-time
depreciation shock; in e. to a Exports shock and in figure f. to a One-time depreciation shock
Baseline Historical scenario Most extreme shock 1/
Threshold
0
5
10
15
20
25
30
2015 2020 2025 2030 2035
f .Debt service-to-revenue ratio
0
10
20
30
40
50
60
-1
0
1
2
3
4
5
6
7
2015 2020 2025 2030 2035
Rate of Debt Accumulation
Grant-equivalent financing (% of GDP)
Grant element of new borrowing (% right scale)
a. Debt Accumulation
0
50
100
150
200
250
2015 2020 2025 2030 2035
c.PV of debt-to-exports ratio
0
10
20
30
40
50
60
2015 2020 2025 2030 2035
b.PV of debt-to GDP ratio
0
50
100
150
200
250
300
350
2015 2020 2025 2030 2035
d.PV of debt-to-revenue ratio
0
5
10
15
20
25
30
2015 2020 2025 2030 2035
e.Debt service-to-exports ratio
Figure 1a. Rwanda: Indicators of Public and Public Guaranteed External Debt under
Alternative Scenarios, 2015-2035 1/

RWANDA
14 INTERNATIONAL MONETARY FUND
Most extreme shock Non-debt flows
Sources: Country authorities; and staff estimates and projections.
1/ The most extreme stress test is the test that yields the highest ratio on or before 2025.
2/ Revenues are defined inclusive of grants.
BaselinePublic debt benchmark
Most extreme shock 1/Historical scenario
Fix Primary Balance
0
50
100
150
200
250
2015 2017 2019 2021 2023 2025 2027 2029 2031 2033 2035
PV of Debt-to-Revenue Ratio 2/
0
10
20
30
40
50
60
70
80
2015 2017 2019 2021 2023 2025 2027 2029 2031 2033 2035
PV of Debt-to-GDP Ratio
0
5
10
15
20
25
30
2015 2017 2019 2021 2023 2025 2027 2029 2031 2033 2035
Debt Service-to-Revenue Ratio
Figure 1b. Rwanda: Indicators of Public Debt under Alternative Scenarios, 2015-20351/

Statement by Mr. Yambaye, Executive Director for Rwanda and
Mr. Alle, Senior Advisor to the Executive Director
January 15, 2016
1. On behalf of our Rwandan authorities, we would like to thank the Board,
Management and Staff for their continued support. Fund assistance has been valuable to
Rwanda in helping to achieve macroeconomic stability, sustain growth and reduce poverty
over the past decades. Staff’s recent visit to Kigali offered another opportunity to deepen the
understanding of the challenges facing the economy and discuss policies aimed at furthering
the country’s strides towards its development goals. The authorities broadly share the thrust
of the staff report.
2. Over the past period, Rwanda has maintained its steady pace of economic
transformation with enviable results. In spite of adverse external conditions, growth was
robust in 2015, backed by a strong commitment to reforms and enhanced efforts of
economic diversification. The PSI anchor was instrumental in helping the authorities in
fine-tuning their policy mix to address short-term challenges without jeopardizing long-term
goals set in the Economic Development and Poverty Reduction Strategy for 2013-2018
(EDPRS 2). Sound policymaking will be particularly critical in the period ahead as the
economy weathers the shock of falling mining exports. The authorities are committed to the
objectives of the program and to adjust policies accordingly and would welcome the Board
support for the conclusion of the 4th review under the PSI.
Recent Developments and Program Performance
3. Performance under the PSI continues to be strong. All end-June quantitative
assessment criteria were met and all but one indicative targets were also observed. The
implementation of structural benchmarks was also satisfactory.
4. Favorable developments over the recent period led to a revision in growth
projections for 2015 from 6.5 percent to 7 percent. The main drivers of this performance
are agriculture, construction and services. Headline inflation was kept low, standing at 2.9
percent y-o-y in October. Owing to enhanced revenue collection, the fiscal deficit was
slightly lower than programmed, at 5.2 percent of GDP against 5.3 percent.
5. The sharp fall both in mineral export prices and production translated into a
deteriorating external position. Strong construction activity and the ensued capital goods
imports have added up to the sharp drop in exports to cause a larger-than-anticipated trade
deficit of 14.5 percent. The authorities are closely monitoring the developments on the

2
external front, including the depreciation of the Franc, and will take the appropriate
adjustment measures, if necessary.
Outlook and Medium-Term Policies
6. The decline in the mining sector and related consequences remain the main risk to the
outlook. Nonetheless, the authorities have agreed with staff to gather more data on the
unfolding shock and not to significantly modify the program’s quantitative objectives at this
stage. This approach should help strike the right balance between addressing the external
shock and preserving the track of policies for long-term development goals. To this end,
policy objectives for the period ahead should evolve around four building blocks: (i) boosting
domestic revenue for development financing; (ii) enhancing monetary policy and financial
deepening; (iii) strengthening debt management; and (iv) diversifying the economy. The
authorities are confident that their efforts in those areas will help them mitigate the impact of
the adverse external environment, while enhancing the long-term resilience of the economy.
7. Boosting domestic revenue for development financing. Pursuing a fiscal policy
coherent with their development objectives and challenges is paramount to our authorities’
strategy. In this regard, they attach a particular importance to reforms needed to boost
domestic revenue collection and improve public financial management, with the view to
increase the domestic share of their development financing. The EDPRS 2 has identified
critical projects for which a blend of domestic and foreign financing is needed. For FY15/16
for instance, priority projects include the hiring of more teachers for training programs,
power projects, and the extension of the one-cow-per-family program which has proved very
effective in poverty reduction.
8. An array of tax policy and tax administration measures has been identified to boost
revenue, including the rollout of a new road fund levy, an excise tax for strategic reserve,
higher taxes on tobacco, and changes to the mining tax regime. Measures to enhance e-tax
are also being implemented to improve compliance and streamline tax payment. The
authorities also continue to explore new avenues to broaden the tax base, including the
potential of agriculture taxation for which a benchmarking study should help develop an
agricultural income taxation model for Rwanda.
9. Our authorities’ fiscal policy should also be reinforced by a set of measures meant to
improve public financial management, notably in the areas of state-owned enterprises and
public investment. The recent separation of the water and electricity company into two
entities and the tariff raise should help cover production costs and minimize fiscal risks.
Likewise, the establishment of the Public Investment Committee aimed at helping in
prioritization, planning, monitoring, and evaluation of investment projects should improve
value-for-money in public investment.

3
10. Enhancing monetary policy and financial deepening. Monetary policy has
supported the authorities’ overarching goal of enhancing growth, while balancing its specific
objective of price stability. In the face of the unfolding shock and the drawdown on reserves,
the authorities are mindful that a close attention should be paid and the monetary stance be
adjusted, if needed. Furthermore, they remain committed to further enhance transmission
mechanisms to ease the conduct of monetary policy and bolster financial deepening. The
financial sector is sound and NPLs are declining owing to strong economic activity. Our
authorities have embarked on a set of reforms to enhance the supervisory framework,
including through draft laws to improve the central bank oversight on non-bank financial
institutions. The reform of the SACCOs is also proceeding well with the aim of fostering
financial inclusion. The establishment of new institutions such as private pensions and the
revision of the deposit insurance law should also help broaden the financial architecture and
serve a larger share of the population.
11. Strengthening debt management. Our authorities welcome the conclusion of the
staff’s DSA that Rwanda continues to face a low risk of external debt distress. Though the
downturn in the mining sector has somewhat highlighted external vulnerabilities, our
authorities are confident that the economy will enhance its resilience going forward as
diversification efforts bear fruits. As regards the slight increase in public sector debt pointed
out by staff- 29.9 percent of GDP at end-2014, of which 23.7 percent for the external debt
and 6 percent for domestic debt – it financed critical investment projects, including
RwandAir and the Kigali Convention Center (KCC). As evidenced by the current dynamism
and growing activity of RwandAir, the authorities are confident that the returns on those
investments will more than balance the costs in the near future. Going forward, our
authorities attach a high importance to preserving the hard-won debt sustainability as they
strengthen their Debt Management Unit and smoothly transition to the IMF new debt limit
policy.
12. Diversifying the economy. Economic diversification has been at the center of our
authorities’ development strategy as highlighted in their successive EDPRS. They are
convinced that a broad export base underpinned by a dynamic and diversified private sector
is the ultimate driver of growth and engine of economic resilience. Although fiscal and
monetary policies can provide buffers against external vulnerabilities in the short run, the
authorities are of the view that diversifying away from traditional commodity exports will
yield more sustainable buffers. This rationale has been driving the authorities’ economic
transformation agenda and export diversification strategy.
13. The Rwanda Development Board (RDB) has been set as the implementation body
of this strategy, with the view to promote Rwanda as a high spot for doing business.
Projects like KCC and the overhauling of RwandAir fall under the business tourism
aspect of this strategy. The development of the ICT sector has started to bear fruits around
emerging young entrepreneurs whose innovations have recently attracted global investors.
These strategies and operations are being complemented with other initiatives to further
4
ease the doing of business, including the development of Special Economic Zones, the
strengthening of tieswith neighboring countries, and the speeding up of the integration
within the East African Community.
Conclusion
14. The Rwandan authorities have kept pace with their sound policymaking record that
has underpinned the country’s impressive achievements over the past decades. As a result,
growth continues to be robust and sustained and progress is being made in economic
transformation and poverty reduction.
15. Yet, vulnerabilities remain as evidenced by the adverse impact of the global
commodity market downturn on the shallow export base. The authorities are cognizant of
these vulnerabilities and are committed to step up their efforts to adjust policies with the aim
of dampening their impact on the economy. Going forward, the authorities are determined to
press ahead with their reforms and strategies to diversify the economy around a dynamic
private sector as the ultimate way to enhance resilience, entrench growth and create jobs. Our
authorities appreciate the Fund’s continued support in this challenging endeavor.