imf country report no. 19/141 colombia - sipotra.it · imf country report no. 19/141 colombia...
TRANSCRIPT

© 2019 International Monetary Fund
IMF Country Report No. 19/141
COLOMBIA REVIEW UNDER THE FLEXIBLE CREDIT LINE
ARRANGEMENT—PRESS RELEASE AND STAFF REPORT
In the context of the review under the Flexible Credit Line arrangement the following
documents have been released and are included in this package:
• A Press Release including a statement by the Chair of the Executive Board.
• The Staff Report prepared by a staff team of the IMF for the Executive Board’s
consideration on May 20, 2019. Based on information available at the time of these
discussions, the staff report was completed on May 3, 2019.
• A Statement by the Executive Director for Colombia.
The IMF’s transparency policy allows for the deletion of market-sensitive information and
premature disclosure of the authorities’ policy intentions in published staff reports and
other documents.
Copies of this report are available to the public from
International Monetary Fund • Publication Services
PO Box 92780 • Washington, D.C. 20090
Telephone: (202) 623-7430 • Fax: (202) 623-7201
E-mail: [email protected] Web: http://www.imf.org
Price: $18.00 per printed copy
International Monetary Fund
Washington, D.C.
May 2019

Press Release No. 19/180
FOR IMMEDIATE RELEASE
May 22, 2019
IMF Executive Board Completes Review of Colombia's Performance under the Flexible
Credit Line Arrangement
On May 20, 2019, the Executive Board of the International Monetary Fund (IMF) completed
its review of Colombia’s qualification for the arrangement under the Flexible Credit Line
(FCL) and reaffirmed Colombia’s continued qualification to access FCL resources. The
Colombian authorities stated their intention to continue treating the arrangement as
precautionary. The current two-year FCL arrangement for Colombia in an amount equivalent to
SDR 7.848 billion (about US$11 billion) was approved by the IMF’s Executive Board on
May 25, 2018 (see Press Release No. 18/196).
Colombia’s FCL arrangement was first approved on May 11, 2009 (see Press Release
No. 09/161) and successor arrangements were approved on May 7, 2010 (see Press Release
No. 10/186), May 6, 2011 (see Press Release No. 11/165), June 24, 2013 (see Press Release
No. 13/229), June 17, 2015 (see Press Release 15/281) and June 15, 2016 (see Press Release
No. 16/279).
Following the Executive Board’s discussion on Colombia, Mr. David Lipton, First Deputy
Managing Director and Acting Chairman of the Board, made the following statement:
“Colombia’s economic recovery is gaining momentum, supported by its very strong policy
frameworks and well-executed policies. Fiscal policy remains anchored over the medium term
by the structural deficit rule and monetary policy is governed by a credible inflation targeting
framework that has delivered inflation close to target and anchored inflation expectations. The
financial system remains sound and financial sector supervision is being further strengthened,
including through a gradual convergence to Basel III standards. A flexible exchange rate
continues to be the primary mechanism of adjustment to external shocks.
“With elevated downside risks to global growth, Colombia remains exposed to the
materialization of external tail risks. Given the importance of the oil sector for the Colombian
economy and the relatively high share of non-resident holdings of domestic government bonds,
these risks include a sharp correction in the price of oil or a repricing of risk in global financial
markets. In that context, the authorities are further strengthening their policy frameworks and
building policy space to ensure Colombia’s continued resilience to external shocks, including
through a well-communicated program to gradually accumulate international reserves.
International Monetary Fund
700 19th Street, NW
Washington, D. C. 20431 USA

“The FCL arrangement continues to provide a cushion of international liquidity and signals the
strength of Colombia’s economy and its policy frameworks. The authorities have clearly stated
their intention to continue to treat the FCL arrangement as precautionary and have taken
proactive steps to prepare for a gradual phasing out, risks permitting, of the FCL in line with the
temporary nature of the instrument. A careful communication strategy remains important to
facilitate a smooth exit from the FCL.”
COLOMBIA REVIEW UNDER THE FLEXIBLE CREDIT LINE ARRANGEMENT
EXECUTIVE SUMMARY Context. Colombia’s recovery is gaining momentum on the back of strong domestic demand, with a wider current account deficit. As a key external shock, migration flows from Venezuela accelerated in 2018 and by end-December 1.5 million migrants were estimated to live in Colombia.
Risks. Risks to global growth and financial stability are tilted to the downside and have increased somewhat relative to the last FCL approval according to the April 2019 WEO and GFSR. Given the importance of oil exports and non-resident holdings of local-currency bonds, Colombia remains exposed to lower global growth, including indirectly through lower oil prices, and a sudden reversal in investor sentiment. Colombia weathered last year’s financial and oil market volatility well, however, as evidenced by stable spreads and local currency bond yields.
Policies. Colombia continues to have very strong policies and policy frameworks. The authorities have been proactively accumulating reserves through a market-based mechanism that allows the exchange rate to remain the first line of defense against external shocks. The financial regulatory framework is being further strengthened by the implementation of the Conglomerates Law and Basel III capital and liquidity standards. To accommodate spending pressures associated with migration, the authorities decided to use flexibility within the fiscal rule to modestly relax the deficit target in a well-defined manner starting in 2019 while safeguarding the medium-term fiscal anchor.
Flexible Credit Line (FCL). On 25 May 2018, the Executive Board of the IMF approved a two-year arrangement for Colombia under the FCL in an amount equivalent to SDR 7.848 billion (384 percent of quota). The authorities stated their continued intention to treat the arrangement as precautionary and no change in access levels is being sought during this mid-term review. They are committed to the exit strategy communicated during the 2018 approval and see the reserve accumulation program as an important step in preparing for a phased reduction in access to Fund resources under the FCL, risks permitting.
Qualification. In staff’s assessment, Colombia continues to meet the qualification criteria for access to FCL resources as specified under the Executive Board decision on FCL arrangements (Decision No. 14283 – (09/29), adopted on March 24, 2009, as amended). Staff therefore recommends completion of the review under the FCL arrangement.
May 3, 2019

COLOMBIA
2 INTERNATIONAL MONETARY FUND
Approved By Aasim M. Husain (WHD) and Zuzana Murgasova (SPR)
This report was prepared by a team comprising Hamid Faruqee (Head), Emilio Fernandez-Corugedo and Frederik Toscani (all WHD), Andrew Swiston (SPR) and Farid Jimmy Boumediene (MCM). Cristina Barbosa and Danjing Shen provided excellent assistance.
CONTENTS
CONTEXT ________________________________________________________________________________________ 4
RECENT DEVELOPMENTS _______________________________________________________________________ 5
OUTLOOK AND RISKS ___________________________________________________________________________ 5
POLICIES _________________________________________________________________________________________ 9
REVIEW OF QUALIFICATION __________________________________________________________________ 11
SAFEGUARDS ASSESSMENT __________________________________________________________________ 14
STAFF APPRAISAL _____________________________________________________________________________ 14 BOX 1. Updated External Economic Stress Index _______________________________________________________ 8 FIGURES 1. Recent Economic Developments ______________________________________________________________ 16 2. External Sector Developments _________________________________________________________________ 17 3. Recent Financial Developments _______________________________________________________________ 18 4. Non-Resident Investors in Local Currency Government Debt __________________________________ 19 5. FCL Qualification Criteria ______________________________________________________________________ 20 6. Reserve Coverage in an International Perspective _____________________________________________ 21 7. External Debt Sustainability: Bound Tests _____________________________________________________ 34 TABLES 1. Selected Economic and Financial Indicators ___________________________________________________ 22 2a. Summary Balance of Payments (In millions of US$) __________________________________________ 23 2b. Summary Balance of Payments (In percent of GDP) __________________________________________ 24 3. Operations of the Central Government ________________________________________________________ 25 4. Operations of the Combined Public Sector ____________________________________________________ 26 5. Monetary Indicators ___________________________________________________________________________ 27 6. Medium-Term Outlook ________________________________________________________________________ 28

COLOMBIA
INTERNATIONAL MONETARY FUND 3
7. Financial Soundness Indicators ________________________________________________________________ 29 8. Indicators of External Vulnerability ____________________________________________________________ 30 9. Public Sector Debt Sustainability Analysis – Baseline Scenario _________________________________ 31 10. Public Sector Debt Sustainability Analysis – Composition of Public Debt and Alternative Scenarios ________________________________________________________________________________________ 32 11. External Debt Sustainability Framework ______________________________________________________ 33 12. Indicators of Fund Credit _____________________________________________________________________ 35

COLOMBIA
4 INTERNATIONAL MONETARY FUND
CONTEXT 1. Colombia’s macroeconomic policies and policy framework remain very strong. Upon taking office in August 2018, President Duque’s government re-iterated its commitment to policy continuity and maintaining Colombia’s strong macroeconomic policy framework. Fiscal policy remains anchored over the medium term by the structural deficit rule and monetary policy decisions under the inflation targeting framework delivered inflation close to target, with well anchored inflation expectations, in 2018. The flexible exchange rate continues to be the primary mechanism of adjustment to external shocks.
2. The FCL arrangement provides valuable insurance against external tail risks. As noted in the April 2019 WEO and GFSR, global risks are tilted to the downside. Given the importance of the oil sector for the Colombian economy and the elevated share of non-resident holdings of domestic government bonds, Colombia remains exposed to the materialization of external risks, including a sharp correction in the price of oil or a general risk-off episode in financial markets. Against this backdrop, the FCL continues to provide a cushion of international liquidity and a signal of the strength of the Colombian economy and policy frameworks, contributing to Colombia being well-shielded from EM financial volatility in 2018, as evidenced by stable sovereign spreads and local currency bond yields.
3. Colombia has been the main recipient of migrants from Venezuela, leading to fiscal pressures. Following a sharp acceleration in inflows during 2018, 1.5 million migrants from Venezuela resided in Colombia as of December 2018, according to Migracion Colombia. The authorities’ commitment and efforts to provide humanitarian support such as health care and education to migrants will result in net fiscal costs for Colombia that will likely peak at around ½ percent of GDP in 2020 according to staff’s baseline estimates. The net costs should gradually decline, as migrants integrate into the economy and associated gains in their economic output rise over time. In response to the substantial near-term spending pressures, the Fiscal Rule Consultative Committee (FRCC) recommended on March 29th to use flexibility within the fiscal rule to modestly relax the headline deficit target over the next few years. Market reactions to date have been muted.
0
50
100
150
200
250
300
350
400
450
Dec-17 Mar-18 Jun-18 Sep-18 Dec-18 Mar-19
EMBIG Spreads(Basis points)
EMBI Global ColombiaMexico Chile
Source: Bloomberg.

COLOMBIA
INTERNATIONAL MONETARY FUND 5
RECENT DEVELOPMENTS 4. Growth picked up in 2018 while external imbalances widened. GDP growth strengthened to 2.7 percent in 2018 from 1.4 percent in 2017, supported by stronger private consumption, and a modest investment pick-up (Figure 1). With demand-driven growth spurring imports while non-oil exports remained sluggish, the current account deficit increased to 3.8 percent of GDP (Figure 2). Inflation has been stable around the 3 percent target since 2018Q1 and inflation expectations remain well-anchored. NPLs started to decline in 2018H2 and domestic banks have become increasingly willing to lend as the economy and investment recovers (Figure 3).1
5. The financial sector remains sound. Banks remain well capitalized with provisions stable at approximately 130 percent of NPLs and Tier-1 and regulatory capital having been raised to 13.2 percent and 18.9 percent of risk-weighted-assets (RWAs) respectively (Table 7).
6. The central government reduced its deficit in 2018 as mandated by the fiscal rule. Consistent with the fiscal rule, the central government’s headline deficit narrowed to 3.1 percent of GDP in 2018 from 3.6 in 2017. Government debt increased modestly to 51.8 percent of GDP, primarily driven by an increase in the value of foreign currency-denominated debt in peso terms.
OUTLOOK AND RISKS 7. Despite external headwinds, growth is expected to strengthen further this year, while the current account deficit is projected to remain elevated. Notwithstanding a slowdown in global growth, staff projects growth to rise to 3.6 percent this year, driven by continued strength in consumption and an investment rebound. High-frequency indicators for early 2019 corroborate a further pick-up in growth. Key investment supports include implementation of 4G infrastructure spending, improved corporate balance sheets and investment-friendly tax reform. Inflation should remain near target despite possible temporary factors, given favorable indexation dynamics and continued slack. But with strong domestic demand, the current account deficit is projected to remain elevated. While the current account deficit is being comfortably financed by stable foreign direct investment and robust portfolio inflows from a more diversified
1 See 2019 Article IV Report for Colombia for a comprehensive discussion of recent economic developments.
0
2
4
6
8
10
12
14
16
18
20
2013 2014 2015 2016 2017 2018 2019 2020 2021 2022 2023 2024
Gross External Financing Needs(In percent of GDP)
Current account deficit Public sector short termPrivate sector short term Public sector MLTPrivate sector MLT
Sources: National authorities and IMF staff estimates.

COLOMBIA
6 INTERNATIONAL MONETARY FUND
investor base, the projection for broadly unchanged deficits over the medium term would imply a modest build-up in net foreign liabilities.2
8. Global risks remain skewed to the downside amid high policy uncertainty, posing external sector risks to Colombia.
• Current account: As noted in the April 2019 WEO and GFSR, lower global growth—amid a further escalation in trade tensions and downside risks in systemic economies, including an increase in policy uncertainty—poses risks to Colombia’s exports, including indirectly through lower oil prices (with oil exports in 2018 amounting to one-third of total exports). The downside risks to global growth have increased somewhat relative to the time of the approval of the current FCL while the risk of lower oil prices is broadly similar.
Colombia: Update on Global Risks
• Capital flows: Financial conditions facing emerging markets (EMs) tightened in mid-2018 as
several EMs underwent turmoil, then eased in early 2019 as prospective policy tightening by systemic central banks was delayed or reduced. While capital flows to Colombia have remained robust, the potential remains for a sharp deterioration in market sentiment, which could result in a rapid tightening in global financial conditions or a generalized risk-off episode. In addition to the gross external financing requirement of about 13 percent of GDP (Table 11), Colombia remains exposed to external financial conditions via nonresident participation in the local bond market, which rose to an all-time high in 2018 (7.9 percent of GDP or 26 percent of the total holdings), although increased diversification of the investor base has reduced concentration risk and a continued lengthening of average maturities has reduced roll-over risks (Figure 4).
2 The government has already met its external borrowing plan for 2019 with oversubscribed Eurobond issuances in October and January.
Source: IMF staff estimates.Note: This fan chart is from April 2019 World Economic Outlook (WEO).
Prospects for World GDP Growth(Percent change)
Source: Bloomberg and IMF staff calculations.Note: Derived from prices of futures options on Mar 12, 2019.
Brent Crude Oil(U.S. dollars barrel)

COLOMBIA
INTERNATIONAL MONETARY FUND 7
• Correlation of risks: The balance of payments could be affected through multiple channels if negative external shocks materialize simultaneously. In 2009 and 2015, oil prices declined, demand for non-oil exports weakened, and EM financial conditions tightened together. This led to lower oil revenues, non-oil exports, and reduced private capital inflows. In this context, given the current account deficit, a large fall in oil prices could also negatively affect capital inflows. This correlation of risks is consistent with previous staff analysis finding a strong positive relationship between commodity prices and capital inflows in Latin America.3 Capital-flows-at-risk analysis suggests that while the baseline outlook is for continued robust portfolio inflows, substantial net outflows could occur in the case of a tail risk scenario.4
Colombia - Vulnerability to Capital Account Shocks
• The updated External Stress Index (ESI) shows that the external conditions Colombia faces under
the baseline are broadly similar to those at the time of the FCL approval. A tail-risk scenario continues to imply a significant deterioration in conditions relative to the baseline (Box 1).
3 See Regional Economic Outlook, Western Hemisphere: Tale of Two Adjustments (April 2017). 4 This is proxied by simultaneous two-standard-deviation shocks to oil prices, U.S. Treasury yields, and EM sovereign spreads. See Staff Report for the 2019 Article IV Consultation for Colombia, Annex IV.
Feb-19, 25.43
Feb-19, 25.63
0
5
10
15
20
25
30
0
5
10
15
20
25
30
35
May-13 May-14 May-15 May-16 May-17 May-18
Foreign Participation in Local Government Debt
Foreign holdings in US$ billion
Foreign holdings in percent of total (RHS)
Sources: National authorities and IMF staff estimates.
0.0
0.2
0.4
0.6
0.8
1.0
1.2
1.4
1.6
1.8
-1.8 -0.7 -0.2 0.3 0.8 1.3 1.8 2.3 2.8 3.4 3.9
Model baseline, 2019Q2One standard deviation shockTwo standard deviations shock
Frequency Distribution of Net Portfolio Inflows(Percent of GDP, capital-flow-at-risk approach)
Sources: Haver Analytics; and IMF staff calculations and estimates.
2.0
2.5
3.0
3.5
4.0
4.5
5.0
-4
-2
0
2
4
6
8
2000 2002 2004 2006 2008 2010 2012 2014 2016 2018
Private inflows including FDI
Private inflows excluding FDI
Oil price, brent (log; RHS)
Gross Private Capital Inflows and the Oil Price(percent of GDP)
Sources: IMF, International Financial Statistics; Haver Analytics; and IMF staff calculations.

COLOMBIA
8 INTERNATIONAL MONETARY FUND
Box 1. Updated External Economic Stress Index The updated ESI shows that the estimated impact of tail risks in the adverse scenario remain about the same as at the time of the FCL approval last year.
The external ESI summarizes Colombia’s external shocks and exposures to these shocks. It was initially presented in the staff report for the June 2015 FCL arrangement. The methodology is explained in “Flexible Credit Line—Operational Guidance Note,” IMF Policy Paper, July 2018.
The index is based on four major variables which capture external risks for Colombia: the level of the oil price (a proxy for oil exports as well as oil-related FDI); U.S. real GDP growth (a proxy for exports); remittances, and other inward FDI; and the emerging market volatility index (VXEEM) and the change in the 10-year U.S. Treasury yield as proxies for risks to equity and debt portfolio flows, respectively. The methodology and weights are unchanged from previous Colombia FCL reports. These unchanged weights, which were formulated when Colombia’s oil exports-GDP were higher and external liabilities to non-residents were lower, do not fully capture the more recent reduced exposure to current account shocks nor increased exposure to capital account shocks, but the results would be broadly similar with updated weights.
The adverse scenario reflects external risks from global policy uncertainty and a global growth slowdown. In the adverse scenario, policy uncertainty or protectionism combined with a rise in risk premium are assumed to lower U.S. growth by 0.75 percentage point. Oil prices are assumed to fall 28 percent with respect to the baseline due to weak global growth, in line with the risks currently priced into futures markets. Stress in financial markets due to policy uncertainty is assumed to increase the VXEEM by two standard deviations, and a decompression of term premia is assumed to trigger a 100bps increase in 10-year U.S. Treasury yields. The assumed shocks to the oil price, VXEEM, and yields are unchanged compared to the 2018 FCL approval, while the 0.75 assumption for the U.S. growth shock was lowered from a 1.5 percent shock in the 2018 FCL approval, bringing it into line with the latest scenarios used for the World Economic Outlook. Overall, the updated ESI is now significantly stronger than at the time of the FCL approval last year, but is projected to fall towards a similar level under the baseline and under the tail risk scenario.

COLOMBIA
INTERNATIONAL MONETARY FUND 9
9. On the domestic front risks are broadly balanced. Heightened uncertainty in Venezuela adds to fiscal risks for Colombia. The number of migrants is projected to reach 2½ million by end 2020 in staff’s baseline projection, with spillovers in terms of public spending for Colombia. But there exists substantial uncertainty around migration flows depending on how the Venezuela crisis evolves. A high migration scenario could result in additional near-term fiscal costs of around ½ percent of GDP relative to the baseline.5 A failure to mobilize tax revenues in the future could lead to large cuts in social and investment spending, adversely affecting growth and poverty reduction. Lower-than-expected subnational and private investment are a risk to the 2019 growth forecast. On the upside, 4G infrastructure investment could proceed more quickly than expected.
POLICIES 10. The authorities are further strengthening the policy framework and building policy space to ensure Colombia’s continued resilience to external shocks.
• Reserve accumulation: Reserves remained adequate in 2018 at 118 percent of the ARA metric (130 percent excluding a commodity buffer). In a proactive step, in September 2018 the Central Bank announced a program to accumulate reserves as part of the authorities’ efforts to enhance the economy’s resilience to external shocks and prepare for a gradual reduction in FCL access in the future, risks permitting. The program’s market-based mechanism has allowed reserve accumulation without disrupting the smooth functioning of the foreign exchange market, while permitting the flexible exchange rate to remain the primary mechanism of adjustment to external shocks.6 As of April 2019 the Central Bank has purchased close to US$2.9 billion since last October.7
• Financial sector supervision: The financial supervisor is implementing the Conglomerates Law and Basel III capital and liquidity standards, in line with previous staff advice. These standards
5 See 2019 Article IV Report for Colombia, Annex III. 6 The program involves monthly auctions of “put” options allowing market participants to sell U.S. dollars to the Central Bank at the previous day’s market rate during any period when the dollar weakens against the peso below its 20 business-day moving average. See 2019 Article IV Report for Colombia, Annex IV for a detailed description of the program. 7 The purchases include US$1.9 billion through the market-based program and a US$1 billion direct purchase from the treasury at the prevailing market rate on February 1. This was a one-off transaction to monetize the proceeds of a Eurobond issued shortly before that date.

COLOMBIA
10 INTERNATIONAL MONETARY FUND
will be gradually introduced over a four year period (Feb. 2020–Feb. 2024). The measures should further strengthen the regulatory framework.8
11. The 2018−22 national development plan (NDP) should strengthen competitiveness and governance. The plan is focused on measures to improve productivity growth, such as providing firms with incentives for technology adoption, improving human capital and reducing skills mismatches (most prominently, by pushing forward a new national qualification system) and expanding access to credit for SMEs and start-ups. The authorities are also focused on closing infrastructure gaps and reducing transport costs, including by pushing ahead with an ambitious 4G investment agenda. These measures should boost Colombia’s external competitiveness and help lay the foundation for higher medium-term exports. The NDP also includes welcome initiatives to improve the efficiency of the state and fight corruption.
12. Fiscal policy remains anchored by the fiscal framework and should place public debt on a declining path. The authorities’ medium-term fiscal framework (MTFF) requires reducing the structural deficit of the central government to 1 percent of GDP over the medium term. Given the large migration shock and its attendant fiscal costs, a modestly relaxed headline deficit path has been defined for a fixed period with a pre-specified ceiling on the deviation in the budget deficit, but the structural deficit objective remains unchanged as a medium-term anchor. The new headline deficit path implies higher deficits in 2019 and 2020 but lower deficits from 2023 to 2024 relative to the 2018 MTFF.9 Notwithstanding these revisions, adhering to the fiscal rule will keep public debt on a declining path over the coming years. In the baseline, public sector gross debt is projected to steadily decline from about 51 percent in 2018 to around 40 percent of GDP by 2024.10 In that context, durably raising tax revenues as a share of GDP, aligned with the authorities’ policy intentions, would help build fiscal buffers and minimize the risk of slower debt reduction while avoiding cuts in public investment and social spending that would adversely affect inclusive growth.
13. The moderately expansionary monetary stance is appropriate in the near term. With inflation close to target, anchored inflation expectations, weak credit growth, and the prevailing negative output gap, monetary policy should remain accommodative to safeguard the recovery and insure against heightened downside risks. If the recovery in credit and GDP materializes as
8 See 2019 Article IV Report for Colombia for further details on the regulatory changes. 9 The revised deficit path also includes a reassessment of the economy’s cyclical position which was deemed to be stronger relative to the 2018 MTFF, implying lower headline deficits between 2019 and 2026. 10 See 2019 Article IV Report for Colombia, Annex II for a discussion of the Debt Sustainability Analysis (DSA).

COLOMBIA
INTERNATIONAL MONETARY FUND 11
projected, the Central Bank can shift to a tightening bias towards the second half of the year to move monetary policy to neutral territory.
14. The authorities reiterated their intention to continue treating the FCL arrangement as precautionary and to gradually reduce access to Fund resources, risks permitting. The authorities continue to view external risks as elevated, in particular a possible sharp tightening in global financial conditions and a renewed decline in oil prices and continue to value the precautionary liquidity buffer provided by the FCL. The authorities see implementation of the Conglomerates Law and convergence to Basel III as well as continued adherence to the structural balance rule as important steps to further build resilience. They remain committed to the exit strategy communicated at the time of the 2018 FCL approval and see the reserve accumulation program as an important step in preparing for an eventual and gradual reduction, risks permitting, in FCL access.11
REVIEW OF QUALIFICATION 15. Staff’s assessment is that Colombia continues to meet the qualification criteria for an FCL arrangement. Colombia maintains very strong economic fundamentals and institutional policy frameworks, with an inflation-targeting regime and flexible exchange rate, fiscal policy anchored by a well-defined medium-term fiscal framework, and financial system oversight based on a sound regulatory and supervisory framework (Figure 5). Moreover, Colombia has a sustained track record of implementing very strong policies and the authorities remain committed to maintaining such policies going forward. Specifically:
• Sustainable external position. Overall, staff assesses the external position to be sustainable, based on the external assessment conducted for the 2019 Article IV consultation.12 The current account deficit widened to 3.8 percent of GDP in 2018 and is expected to remain around that level in the medium term. Under staff projections, the estimated current account gap of 1.8 percent of GDP in the EBA current account approach implies it is moderately weaker than implied by fundamentals and desirable policies. The external balance sheet is sustainable given sizable non-debt-creating capital inflows. Moreover, staff’s debt sustainability analysis projects external debt to be broadly stable over the medium term near its end-2018 level of 47 percent of GDP and to remain manageable even under large negative shocks (Table 11 and Figure 7). Going forward, the authorities remain committed to allowing the flexible exchange rate to serve as the primary mechanism of adjustment to external shocks, which should limit the risk of episodes of unsustainable external deficits.
11 The press release announcing the reserve accumulation program explicitly noted that one purpose was to prepare for a possible reduction in FCL access. See “The Board of Directors of Banco de la República Announces Program of Accumulation of International Reserves (28 September 2018).” 12 See 2019 Article IV Report for Colombia, Annex I.

COLOMBIA
12 INTERNATIONAL MONETARY FUND
• Capital account position dominated by private flows. Capital account flows in Colombia are predominantly private. Public flows accounted for only around 25 percent of Colombia’s direct, portfolio, and other asset and liabilities flows on average over the last three years. Capital flows have been mostly in the form of net flows of foreign direct investment (FDI) and portfolio investment (averaging 2.8 and 0.6 percent of GDP, respectively, over 2016–18). Stable funding sources—especially FDI—are expected to continue to finance the bulk of the current account deficit in the medium term.
• Track record of steady sovereign access to international capital markets at favorable terms. Colombia has had uninterrupted access to international capital markets at favorable terms since the early 2000s. The cumulative amount of external bonds issued by the sovereign between 2014 and 2018, is equivalent to more than 500 percent of Colombia’s Fund quota. In addition, cumulative non-resident acquisition of peso-denominated sovereign bonds during the period amounted to over nine times quota. The three major credit rating agencies all continue to assign an investment grade rating to Colombia.13 Sovereign bond spreads have performed in line with spreads on similarly-rated countries, remaining below the aggregate EMBI-Global spread.
• A reserve position that is relatively comfortable. Colombia’s reserves have exceeded 100 percent of the ARA metric in each of the last three years, with end-2018 coverage estimated at 118 percent of the metric including a commodity buffer, and 130 percent excluding the commodity buffer. Coverage is also adequate according to other traditional metrics (Figure 6). Based on projected ARA metrics, the reserve accumulation currently being undertaken by the authorities will help maintain these strong external buffers in terms of reserve adequacy over the medium term.
• Sound public finances, including a sustainable public debt position. In recent years, the strong fiscal framework and moderate levels of public debt helped Colombia absorb the oil price shock of 2014–15 through a combination of expenditure restraint and revenue measures. Notwithstanding an increase in public debt in the wake of the oil price shock, debt has stabilized in recent years, and staff assesses it to be sustainable with high probability, including under alternative scenarios and encompassing consideration of potential contingent liability realizations. The authorities are committed to fiscal sustainability by adhering to their structural deficit target as an anchor that will place public debt on a declining path. The current use of flexibility within the fiscal rule to address the costs of migration from Venezuela is understandable to avoid crowding out key public investment and social spending. The well-defined adjustment to the fiscal rule—in terms of the trigger, size, and duration—is welcome and is not expected to appreciably alter Colombia’s debt dynamics.
• Low and stable inflation in the context of a sound monetary and exchange rate policy framework. Colombia has maintained single digit inflation since 2000. Monetary policy has been set to help keep inflation close to target in most years, with inflation expectations becoming more well-
13 Fitch and Moody’s assign (equivalent) ratings of BBB and Baa2, respectively. S&P assigns a rating of BBB-.
COLOMBIA
INTERNATIONAL MONETARY FUND 13
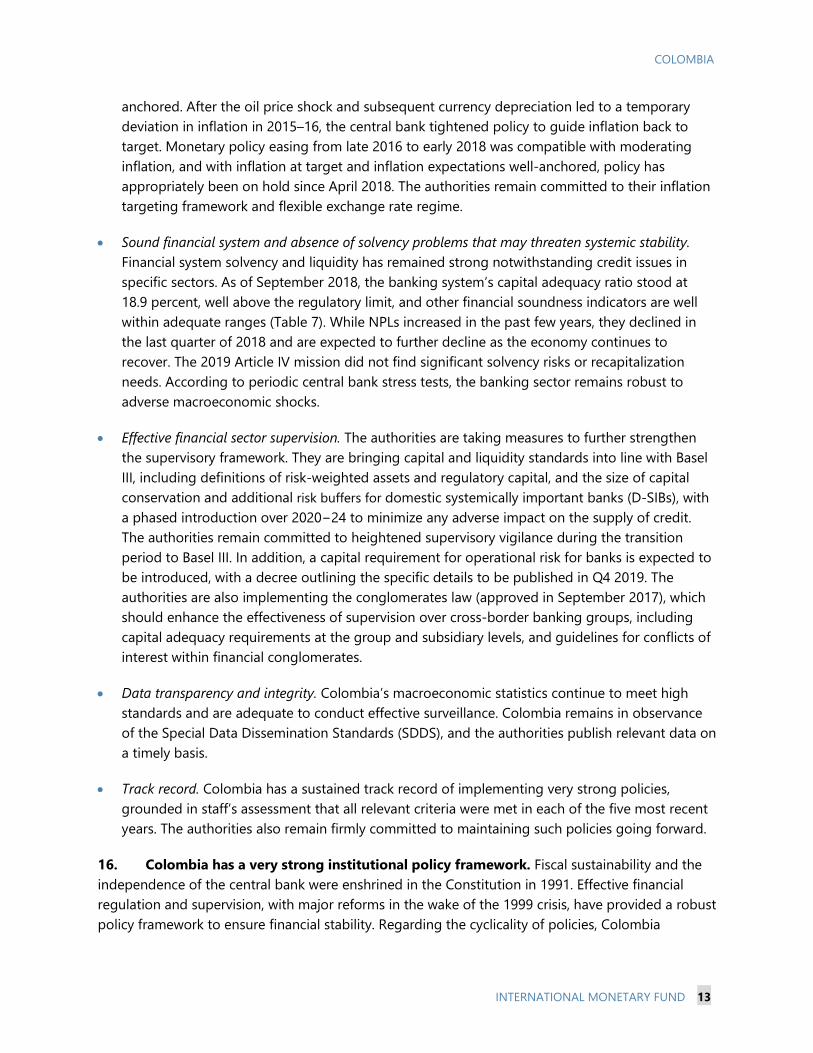
anchored. After the oil price shock and subsequent currency depreciation led to a temporary deviation in inflation in 2015–16, the central bank tightened policy to guide inflation back to target. Monetary policy easing from late 2016 to early 2018 was compatible with moderating inflation, and with inflation at target and inflation expectations well-anchored, policy has appropriately been on hold since April 2018. The authorities remain committed to their inflation targeting framework and flexible exchange rate regime.
• Sound financial system and absence of solvency problems that may threaten systemic stability. Financial system solvency and liquidity has remained strong notwithstanding credit issues in specific sectors. As of September 2018, the banking system’s capital adequacy ratio stood at 18.9 percent, well above the regulatory limit, and other financial soundness indicators are well within adequate ranges (Table 7). While NPLs increased in the past few years, they declined in the last quarter of 2018 and are expected to further decline as the economy continues to recover. The 2019 Article IV mission did not find significant solvency risks or recapitalization needs. According to periodic central bank stress tests, the banking sector remains robust to adverse macroeconomic shocks.
• Effective financial sector supervision. The authorities are taking measures to further strengthen the supervisory framework. They are bringing capital and liquidity standards into line with Basel III, including definitions of risk-weighted assets and regulatory capital, and the size of capital conservation and additional risk buffers for domestic systemically important banks (D-SIBs), with a phased introduction over 2020−24 to minimize any adverse impact on the supply of credit. The authorities remain committed to heightened supervisory vigilance during the transition period to Basel III. In addition, a capital requirement for operational risk for banks is expected to be introduced, with a decree outlining the specific details to be published in Q4 2019. The authorities are also implementing the conglomerates law (approved in September 2017), which should enhance the effectiveness of supervision over cross-border banking groups, including capital adequacy requirements at the group and subsidiary levels, and guidelines for conflicts of interest within financial conglomerates.
• Data transparency and integrity. Colombia’s macroeconomic statistics continue to meet high standards and are adequate to conduct effective surveillance. Colombia remains in observance of the Special Data Dissemination Standards (SDDS), and the authorities publish relevant data on a timely basis.
• Track record. Colombia has a sustained track record of implementing very strong policies, grounded in staff’s assessment that all relevant criteria were met in each of the five most recent years. The authorities also remain firmly committed to maintaining such policies going forward.
16. Colombia has a very strong institutional policy framework. Fiscal sustainability and the independence of the central bank were enshrined in the Constitution in 1991. Effective financial regulation and supervision, with major reforms in the wake of the 1999 crisis, have provided a robust policy framework to ensure financial stability. Regarding the cyclicality of policies, Colombia

COLOMBIA
14 INTERNATIONAL MONETARY FUND
achieved a smooth adjustment to the 2014−16 oil price shock through effective monetary and fiscal policy responses, as described above.
17. Colombia’s government effectiveness indicators continue to improve. The World Bank’s government effectiveness score improved from -0.3 in 2000 to 0−0.1 in 2017, converging to the regional average, and most other governance indicators have also improved substantially. Behind this, the authorities have combined strengthening of the legal framework for governance and transparency with wider access to information and organizational changes to improve governance (IMF, 2018, Box 2). Colombia has been invited to become an OECD member, having introduced reforms on labor standards, the justice system, corporate governance of state-owned enterprises, anti-bribery issues, and trade practices.14 Progress in implementing the governance agenda has been noted by the OECD15 and going forward, it is important for the government to continue to strengthen implementation of governance and anti-corruption measures.
SAFEGUARDS ASSESSMENT 18. Staff has completed the safeguards procedures for Colombia’s 2018 FCL arrangement. On February 7, 2018, Deloitte Colombia (the external auditor) issued an unmodified audit opinion on Banco de la República’s 2017 financial statements, which are published. Staff reviewed the 2017 audit results and discussed them with Deloitte. No significant issues emerged from the conduct of these procedures. Since then, the 2018 financial statements have been published with an unmodified audit opinion.
STAFF APPRAISAL 19. Colombia continues to benefit from the FCL arrangement. The FCL has contributed to Colombia weathering last year’s emerging market financial market turmoil well and continues to boost confidence in Colombia’s very strong policy framework. The volatility in oil markets in late 2018 highlighted that an oil price shock remains an important risk, as is a shock to risk premia in emerging markets. Downside risks to global growth and financial stability have increased somewhat over the past months. In that context, the FCL provides important insurance against tail risks.
20. The authorities’ commitment to maintaining very strong policies and policy frameworks is welcome. The authorities’ proactive step to accumulate reserves will help maintain reserve adequacy metrics near current levels and underscores their commitment to the exit strategy communicated during the 2018 FCL approval. Implementation of the Conglomerates Law and Basel III capital and liquidity standards will further strengthen the regulatory framework. Fiscal policy remains anchored by the structural balance rule while the modest adjustment to the headline deficits targets is understandable given the additional spending due to exceptional migration
14 See OECD countries agree to invite Colombia as 37th member. 15 OECD Integrity Review of Colombia.

COLOMBIA
INTERNATIONAL MONETARY FUND 15
inflows. Staff welcomes adjusting the deficit targets in a well-defined manner under the strict conditions outlined by the FRCC and welcomes the FRCC’s recommendations to revise the fiscal rule’s contingency framework to handle exceptional shocks in the future, which should avoid situations where the deficit target is modified after the occurrence of a shock. Going forward, reforms to raise tax revenue would help to rebuild fiscal space while meeting future spending priorities.
21. In staff’s view, Colombia continues to meet the qualification criteria for access to FCL resources. The IMF Board assessment of the recently-completed 2019 Article IV consultation noted Colombia’s accelerating economic recovery in a setting of very strong policy frameworks. Colombia has a track-record of very strong macroeconomic policies, anchored by its inflation-targeting regime, flexible exchange rate, structural fiscal balance rule, and effective financial system regulatory and supervisory framework. The authorities remain committed to maintaining such policies going forward. Staff therefore recommends completion of the review under the FCL arrangement for Colombia.

COLOMBIA
16 INTERNATIONAL MONETARY FUND
Figure 1. Colombia: Recent Economic Developments
Sources: Departamento Administrativo Nacional de Estadísticas (DANE); La Fundación Para la Educación Superior y el Desarollo;Banco de la República; Haver Analytics; and IMF staff estimates.
-8
-3
2
7
12
2012Q4 2013Q4 2014Q4 2015Q4 2016Q4 2017Q4 2018Q4
Real GDP Growth and Contributions (In percent, y/y change)
Private consumption Govt. consumptionGross investment Net exportsGDP growth
GDP growth picked up in H22018, driven by domestic demand...
0
1
2
3
4
5
6
-30
-20
-10
0
10
20
30
40
2012Q4 2013Q4 2014Q4 2015Q4 2016Q4 2017Q4 2018Q4
Private Consumption(In percent)
Consumer confidenceConsumption growth (y/y, RHS)
....as consumer confidence recovered...
-15
-10
-5
0
5
10
15
20
25
2012Q4 2013Q4 2014Q4 2015Q4 2016Q4 2017Q4 2018Q4
Investment Growth and Contributions(In percent, y/y change)
Dwell ings Other buildingsMachine & Equipment Cultivated bio resourcesIntellectual property Gross investment
....and investment started to improve.
-6
-4
-2
0
2
4
6
8
0
2
4
6
8
10
12
14
16
2008 2010 2012 2014 2016 2018
Labor Market Overview (In percent)
Employment growth (RHS)Change in informality rate (RHS)Unemployment rate
A relatively weak labor market is lagging the pick-up in activity...
-6
-1
4
9
Jan-15 Jan-16 Jan-17 Jan-18
Salary Growth (In percent, y/y change)
Real salary growthRetail (nominal)Manufacturing (nominal)
...but falling inflation and broadly constant nominal wage growth led to real wage gains.
-6
-4
-2
0
2
4
6
8
10
Jan-13 Jan-14 Jan-15 Jan-16 Jan-17 Jan-18 Jan-19
Monetary Policy Rate and Inflation Expectations(In percent)
Gap between real ex ante policy and real neutral rateInflation expectations over next 24 monthsPolicy rateHeadline inflat ion rate
Monetary policy has been moderatly accomodative since early 2018 with inflation and inflation expectations at target.

COLOMBIA
INTERNATIONAL MONETARY FUND 17
Figure 2. Colombia: External Sector Developments
Sources: DANE; Banco de la República; Ministerio de Hacienda y Crédito Público; Haver Analytics; and IMF staff estimates.
50
60
70
80
90
100
110
120
Jan-13 Jan-14 Jan-15 Jan-16 Jan-17 Jan-18 Jan-19
REER (increase is an appreciation)Terms of trade
Term of Trade and Exchange Rate Index(2013=100)
The terms of trade improved in 2018, driven by oil prices....
-50
-40
-30
-20
-10
0
10
20
30
40
Jan-13 Jan-14 Jan-15 Jan-16 Jan-17 Jan-18 Jan-19
International Trade(Y/y percent change of3-month moving average)
ExportsImports
...but export growth weakened late in the year while imports accelerated, which...
-10
-8
-6
-4
-2
0
2
4
6
2013 2014 2015 2016 2017 2018
Goods trade ServicesPrimary income Secondary incomeCurrent account
...along with higher income outflows, widened the current account deficit after two years of adjustment.
Current Account and Components(Percent of GDP)
-9
-7
-5
-3
-1
1
3
2013 2014 2015 2016 2017 2018
Financial Account (Percent of GDP)
Direct investment Portfol io investmentOther investment Change in reserve assetsFinancial account
The current account was financed by a combination of FDI,…
-2
0
2
4
6
8
2015Q4 2016Q4 2017Q4 2018Q4
Portfolio and Other Investment Inflows (Billion U.S.dollars)
Equity securities Peso-denominated govt. debtOther govt. borrowing Private borrowing
…government bond issuance, and private borrowing.
-140
-120
-100
-80
-60
-40
-20
0
20
2013 2014 2015 2016 2017 2018
Net International Investment Position(In percent of GDP)
FDI liabilities Portfol io liabilitiesOther liabilites NIIP
Liabilities to non-residents are primarily in FDI and portfolio securities.

COLOMBIA
18 INTERNATIONAL MONETARY FUND
Figure 3. Colombia: Recent Financial Developments
Source: Bloomberg; Superintendencia Financiera de Colombia; Banco de la República; and IMF staff estimates.1/ Colombia mix follows closely Brent oil prices.2/ LA5 corresponds to the maximum and minimum sovereign spreads among Brazil, Peru, Mexico, Chile, and Uruguay.
0
50
100
150
0
500
1,000
1,500
2,000
2,500
3,000
3,500
4,000
Jan-13 Jan-14 Jan-15 Jan-16 Jan-17 Jan-18 Jan-19
Exchange rate (pesos per US$)Brent oil (US$ per barrel, RHS) 1/
Exchange Rate and Oil Price
The peso weakened against the dollar in 2018, including as oil prices declined late in the year...
0
100
200
300
400
500
600
700
Jan-13 Jan-14 Jan-15 Jan-16 Jan-17 Jan-18 Jan-19
LA5 2/Colombia
Sovereign Spreads(EMBIG, Basis points)
...but sovereign bond spreads have remained stable despite strains among other Latin American markets.
0
2
4
6
8
10
Jan-13 Jan-14 Jan-15 Jan-16 Jan-17 Jan-18 Jan-19
10-year dollar-denominated bond10-year Col$-denominated bond
Government Bond Yield(In percent per annum)
Government bond yields increased marginally during the year.
0
1
2
3
4
5
6
7
Jan-13 Jan-14 Jan-15 Jan-16 Jan-17 Jan-18 Jan-19
Non Performing Loan(In percent)
TotalCommercialConsumerMortgages
NPLs rose in H12018 before reaching a turning point...
-6
-2
2
6
10
14
18
Jan-13 Jan-14 Jan-15 Jan-16 Jan-17 Jan-18 Jan-19
CommercialConsumerTotal
...facilitating an improvement in total bank credit....
Real Credit Growth(In percent)
-0.5
-0.3
-0.1
0.1
0.3
0.5
Jan-13 Jan-14 Jan-15 Jan-16 Jan-17 Jan-18
Financial Condition Index
.....which contributed to an easing of financial conditions overall.
Tight
Loose

COLOMBIA
INTERNATIONAL MONETARY FUND 19
Figure 4. Colombia: Non-Resident Investors in Local Currency Government Debt
Source: Banco de la República.1/ Public Sector includes IFIs, monetary authorities and sovereign wealth funds.2/ Others includes Hedge Funds, Endowments and 'Not Classified'.
0%
20%
40%
60%
80%
100%Foreign Investors by Main Regions
Asia - Middle EastEuropeNorth America
Investors come in equal shares from Europe and North America...
0%
20%
40%
60%
80%
100%Foreign Investors by Main Types
Mutual Funds
Banks
Pension Funds andInsurance FirmsPublic Sector 1/
Other 2/
...with a high percentage of mutual funds and stable institutional investors..
0%
20%
40%
60%
80%
100%Concentration
LargestLargest 3Largest 5
Concentration risk has declined over the past 12 months...
0%
20%
40%
60%
80%
100%Share of Longer Maturities in Total Foreign Holdings
3-year or longer
5-year or longer
...and average maturity has increased.

COLOMBIA
20 INTERNATIONAL MONETARY FUND
Figure 5. Colombia: FCL Qualification Criteria
Sources: Banco de la República; Ministerio de Hacienda y Crédito Público; Datastream; Haver; and IMF staff estimates.1/ Combined permanent 1/4 standard deviation shocks applied to interest rate; growth; and non-interest current account balance.2/ Combined 2 year shock to primary balance (1/2 standard deviation) and growth (1 standard deviation) shocks to primary balance; permanent shock to interest rate (to historical maximum) and exchange rate (about 30 percent real).3/ One-time increase in non-interest expenditures equivalent to 10 percent of banking sector assets leads to a real GDP growth shock (see above): growth is reduced by 1 standard deviation for 2 consecutive years; interest rate increases as a function of the widening of the primary deficit.4/ 30 percent permanent real depreciation in 2020.
15
25
35
45
55
65
75
2008 2012 2016 2020 2024
Combined 1/30% depreciationBaseline
Gross External Debt(Percent of GDP)
Public bonds16%
Other public liabilities
7%
FDI57%
Equity2%
Private bonds
6%
Other private
liabilities12%
International Investment Liabilities (US$333 billion, End 2018)
0
200
400
600
800
1000
0
1
2
3
4
5
6
2010 2012 2014 2016 2018
COL bond issuance (US$ bil.)COL (RHS)Latin America (RHS)
Sovereign Spreads(EMBIG, basis points, central government only)
30
35
40
45
50
55
60
2008 2012 2016 2020 2024
BaselineCombined 2/contingent liabilities 3/30% depreciation 4/
Gross Public Debt(Percent of GDP)
0
2
4
6
8
10
Jan-10 Jul-11 Jan-13 Jul-14 Jan-16 Jul-17 Jan-19
Headline24-month ahead inflation expectations12-month ahead inflation expectations
Inflation and inflation expectations(In percent)
Inflation target
Low and sustainable external debt.
Uninterrupted access to capital markets.
Sustainable public debt dynamics.
Nonresident claims concentrated in FDI.
0
5
10
15
20
25
30
35
0
50
100
150
200
Short-termdebt
Short-termdebt plus CA
deficit
GDP Broad money
Gross International Reserves, end-2018(In percent)
(RHS)
Inflation and inflation expectations very close to target.
Comfortable reserve coverage.

COLOMBIA
INTERNATIONAL MONETARY FUND 21
Figure 6. Colombia: Reserve Coverage in an International Perspective
Sources: World Economic Outlook; IFS; and IMF staff estimates.1/ The current account is set to zero if it is in surplus.2/ The upper and lower lines denote the 100-150 percent range of reserve coverage regarded as adequate for a typical country under this metric. 3/ Calculated based on the ARA metric augmented by a buffer for commodity exporters.
0
10
20
30
40
50
60
70
CZE
THA
BGR
HRV JO
RIS
RRU
SM
YS SRB
PER
URY
PHL
ISL
JAM
VNM
MAR PO
LBR
AEG
YRO
MKA
ZUK
RGT
MIN
DCO
LM
EX ZAF
SLV
CHL
TUN
CRI
ARG
LVA
TUR
IDN
DOM
LTU
VEN
LKA
PAN
PAK
ECU
GIR to GDPFCL
Median
GIR to GDP, end-2018(In percent)
0
20
40
60
80
100
120
140
ARG
CZE
JAM
PER
SRB
BGR
KAZ
URY
RUS
UKR
ROM
HRV IS
RM
EX ISL
GTM
THA
JOR
PHL
IDN
POL
COL
DOM
SLV
MYS
BRA
TUR
EGY
LVA
LBN
ZAF
CHL
IND
CRI
TUN
MAR LKA
VNM
PAK
VEN
PAN
ECU
GIR to Broad MoneyFCL
GIR to Broad Money, end-2018(In percent)
Median
0
50
100
150
200
250
300
350
400
450
500
RUS
MAR PE
RLK
APH
LJA
MTH
ABR
AG
TM KAZ
BGR
EGY
VNM
SRB
URY JOR
MEX
DO
MID
NH
RV IND
CRI
COL
POL
ZAF
SLV
MYS
CHL
ROM
TUR
UKR PA
KTU
NLB
NAR
GEC
ULT
ULV
APA
N
GIR to ST Debt and CA deficit
FCL
GIR to Short-term External Debt at Remaining Maturity plus Current Account Deficit (end-2018) 1/(In percent)
Median
0
50
100
150
200
250
300
RUS
PER
THA
PHL
URY
GTM
KAZ
BRA
BGR
IND
EGY
BIH
COL
ROM
MEX JOR
COL
3/SR
BPO
LID
NH
RVM
YSAR
GM
AR JAM
CHL
UKR
TUR
CRI
DOM
TUN
SLV
ZAF
PAK
LTU
LVA
PAN
ECU
GIR to ARA Metric (2018)FCLUpperLower
Median
GIR to ARA Metric, 2018 2/(In percent)

COLOMBIA
22 INTERNATIONAL MONETARY FUND
Table 1. Colombia: Selected Economic and Financial Indicators
Population (million), 2018 49.8 Unemployment rate, 2018 (percent) 9.7GDP, 2018 Adult illliteracy rate (ages 15 and older), 2016 5.3 Per capita (US$) 6,684 Net secondary school enrollment rate, 2017 78.8 In billion of Col$ 984,803 Gini coefficient, 2017 50.8 In billion of US$ 333 Poverty rate, 2017 26.9Life expectancy at birth (years), 2016 74.4Mortality rate, (under 5, per 1,000 live births), 2017 14.7
2014 2015 2016 2017 2018 2019 2020 2021 2022 2023 2024
National income and pricesReal GDP 4.7 3.0 2.1 1.4 2.7 3.6 3.7 3.6 3.7 3.7 3.6Potential GDP 3.9 3.5 3.1 2.9 3.3 3.3 3.2 3.3 3.3 3.3 3.4Output Gap 1.5 1.0 0.0 -1.6 -2.2 -1.8 -1.4 -1.0 -0.7 -0.3 0.0GDP deflator 2.1 2.4 5.1 5.1 4.2 3.4 3.1 3.0 3.0 3.0 3.0Consumer prices, end of period (eop) 3.7 6.8 5.8 4.1 3.2 3.2 3.0 3.0 3.0 3.0 3.0External sectorExports (f.o.b.) -5.6 -32.2 -11.6 16.4 11.7 -2.6 7.4 0.0 3.6 4.5 4.2Imports (f.o.b.) 7.8 -15.4 -16.9 2.3 12.2 4.0 6.3 3.8 5.1 5.2 5.3Export volume -0.3 1.7 -0.2 2.5 -2.7 4.1 6.9 -0.1 3.6 3.7 3.1Import volume 7.8 -1.1 -3.5 1.2 6.8 4.6 5.9 3.1 4.2 4.4 4.1Terms of trade (deterioration -) -4.5 -17.5 3.7 9.3 10.3 -4.1 0.0 1.0 -0.1 0.6 0.7Real exchange rate (depreciation -) 1/ -6.9 -20.6 -4.8 5.6 0.8 NA NA NA NA NA NAMoney and credit Broad money 10.0 11.6 9.5 6.4 6.9 10.2 9.9 9.7 9.8 9.4 9.0Credit to the private sector 14.7 16.8 7.7 12.8 8.4 9.8 9.7 10.8 11.8 11.7 12.7Policy rate, eop 4.5 5.8 7.5 4.8 4.3 NA NA NA NA NA NA
Central government balance 2/ -2.4 -2.9 -4.0 -3.6 -3.1 -3.0 -2.3 -1.8 -1.4 -1.2 -1.0Central government structural balance 3/ -3.7 -3.6 -3.2 -2.3 -2.2 -2.4 -2.0 -1.6 -1.2 -1.0 -1.0Combined public sector (CPS) balance 4/ -1.8 -3.4 -2.3 -2.4 -2.0 -2.1 -0.6 -0.3 -0.4 -0.4 0.0
CPS non-oil structural primary balance -3.5 -2.6 0.4 0.3 0.3 -0.8 0.5 0.6 0.4 0.2 0.4CPS fiscal impulse 0.7 -0.9 -2.9 0.1 0.0 1.1 -1.3 -0.1 0.2 0.2 -0.2
Public debt 43.3 50.4 49.8 49.5 51.8 50.6 48.5 46.2 44.2 42.2 39.9Public debt, excluding Ecopetrol 40.5 45.7 45.4 46.1 49.3 48.5 46.5 44.6 42.8 41.2 39.2
Gross domestic investment 24.0 23.8 23.3 22.3 21.0 22.1 21.7 22.3 22.4 22.6 22.7Gross national savings 18.8 17.4 19.0 19.0 17.2 18.2 17.9 18.6 18.7 18.8 19.0Current account (deficit -) -5.2 -6.3 -4.3 -3.3 -3.8 -3.9 -3.8 -3.7 -3.7 -3.7 -3.8External debt 5/ 30.0 42.1 49.4 47.3 46.7 48.7 48.7 48.1 47.9 47.2 46.2 Of which: public sector 5/ 18.9 26.5 31.9 30.3 28.9 29.5 28.9 28.0 27.5 26.6 25.5
External debt service 40.2 63.2 68.1 73.7 69.9 74.1 75.7 78.4 74.9 76.9 76.5Interest payments 6.2 9.9 11.3 10.9 10.7 15.0 15.1 15.1 14.9 14.9 14.8
Exports (f.o.b.) 56.9 38.6 34.1 39.7 44.3 43.1 46.3 46.4 48.0 50.2 52.3 Of which: Petroleum products 29.0 14.6 10.8 13.2 16.8 15.2 16.5 14.3 14.1 14.3 14.3Gross international reserves 6/ 46.8 46.3 46.2 47.1 48.3 51.2 53.2 55.1 57.0 58.9 60.8
Sources: Colombian authorities; UNDP Human Development Report; World Development Indicators; and IMF staff estimates.1/ Based on bilateral COL Peso/USD exchange rate.2/ For 2019, it excludes expected privatization proceeds (0.3 percent of GDP) that, under GFSM 1986, produces a headline deficit of -2.7 percent of GDP estimated by the authorities.3/ IMF staff estimate.4/ Includes the quasi-fiscal balance of Banco de la República, sales of assets, phone licenses, and statistical discrepancy.5/ Includes foreign holdings of locally issued public debt (TES); does not include Banco de la República's outstanding external debt.6/ Excludes Colombia's contribution to FLAR; includes valuation changes of reserves denominated in currencies other than U.S. dollars.
(In percentage change, unless otherwise indicated)
(In percent of GDP)
(In percent of exports of goods and services)
(In billion of U.S. dollars; unless otherwise indicated)
Projections
I. Social and Demographic Indicators
II. Economic Indicators

COLOMBIA
INTERNATIONAL MONETARY FUND 23
Table 2a. Colombia: Summary Balance of Payments (In millions of US$, unless otherwise indicated)
2014 2015 2016 2017 2018 2019 2020 2021 2022 2023 2024Current account balance -19,761 -18,564 -12,028 -10,295 -12,660 -13,264 -13,356 -13,941 -14,717 -15,569 -16,543
Goods balance -4,640 -13,478 -9,149 -4,572 -5,317 -8,453 -8,510 -10,570 -11,777 -12,730 -13,930Exports, f.o.b. 56,899 38,572 34,090 39,676 44,316 43,150 46,344 46,364 48,041 50,210 52,333
Commodities 41,122 24,180 20,407 25,749 29,074 27,264 29,338 27,739 27,808 28,411 28,847Fuel 28,988 14,566 10,796 13,167 16,769 15,184 16,475 14,336 14,145 14,320 14,309Non-fuel 12,134 9,614 9,612 12,582 12,304 12,080 12,864 13,403 13,663 14,091 14,538
Non-traditional exports 11,651 10,418 9,520 10,062 10,715 11,391 12,189 13,408 14,614 15,784 17,046Other 4,126 3,974 4,163 3,865 4,233 4,495 4,817 5,217 5,619 6,015 6,440
Imports, f.o.b. 61,539 52,050 43,239 44,248 49,633 51,603 54,854 56,934 59,819 62,940 66,264Consumer goods 13,120 11,103 10,114 10,161 11,273 11,466 12,222 12,816 13,590 14,402 15,273Intermediate goods 26,278 21,814 18,809 18,889 21,502 21,935 23,490 24,397 25,505 26,773 28,124Capital goods 20,160 17,407 12,527 13,210 14,814 16,016 16,831 17,313 18,185 19,089 20,052Other 1,980 1,726 1,789 1,988 2,044 2,187 2,310 2,407 2,538 2,677 2,815
Services balance -7,222 -4,789 -3,531 -3,917 -3,809 -3,528 -3,682 -3,274 -3,132 -3,013 -2,802Exports of services 7,156 7,426 7,771 8,461 9,457 10,147 10,829 11,577 12,422 13,315 14,233Imports of services 14,378 12,215 11,302 12,378 13,266 13,675 14,511 14,851 15,554 16,327 17,035
Primary income balance -12,521 -5,728 -5,229 -8,404 -11,140 -9,346 -9,691 -9,139 -9,396 -9,989 -10,581Receipts 3,997 4,483 4,996 5,478 6,112 6,985 7,336 7,816 8,322 8,746 9,187Expenditures 16,518 10,211 10,225 13,882 17,252 16,331 17,027 16,956 17,718 18,735 19,769
Secondary income balance 4,622 5,431 5,881 6,598 7,606 8,064 8,527 9,042 9,588 10,163 10,771
Financial account balance -19,287 -18,244 -12,278 -9,641 -11,975 -13,264 -13,356 -13,941 -14,717 -15,569 -16,543Direct Investment -12,268 -7,507 -9,334 -10,145 -5,890 -8,209 -9,391 -10,004 -10,687 -11,410 -12,063
Assets 3,899 4,218 4,516 3,690 5,121 3,959 4,035 4,124 4,216 4,308 4,399Liabilities 16,167 11,725 13,850 13,835 11,011 12,168 13,426 14,128 14,903 15,718 16,462
Oil sector 4,732 2,502 2,386 3,106 2,115 2,337 2,578 2,713 2,862 3,018 3,161Non-oil sectors 11,435 9,223 11,464 10,729 8,896 9,831 10,848 11,415 12,041 12,700 13,300
Portfolio Investment -11,564 -9,166 -4,839 -1,618 1,224 -5,368 -3,579 -3,575 -3,631 -3,287 -3,091Assets 7,097 -475 5,189 6,200 1,572 1,042 1,325 1,443 1,530 1,624 1,711Liabilities 18,661 8,691 10,028 7,818 348 6,410 4,904 5,018 5,160 4,911 4,801
Equity 1,823 640 -364 473 -823 1,108 1,257 1,241 1,133 889 779Debt instruments 16,838 8,051 10,392 7,345 1,171 5,302 3,647 3,777 4,027 4,022 4,022
General government 12,835 5,651 8,792 6,011 4,529 3,580 2,301 2,385 2,635 2,630 2,630Banks -17 400 1,100 300 -800 385 239 286 286 286 286Corporates and households 4,020 2,000 500 1,034 -2,558 1,337 1,107 1,107 1,107 1,107 1,107
Derivatives 609 1,956 -622 362 66 0 0 0 0 0 0Other Investments -501 -3,943 2,353 1,246 -8,563 -2,607 -2,306 -2,282 -2,319 -2,791 -3,309Change in reserve assets 4,437 416 164 514 1,188 2,920 1,920 1,920 1,920 1,920 1,920
Net errors and omissions 472 320 -249 652 679 0 0 0 0 0 0
Sources: Banco de la República and IMF staff estimates and projections.
Projections

COLOMBIA
24 INTERNATIONAL MONETARY FUND
Table 2b. Colombia: Summary Balance of Payments (In percent of GDP)
2014 2015 2016 2017 2018 2019 2020 2021 2022 2023 2024Current account balance -5.2 -6.3 -4.3 -3.3 -3.8 -3.9 -3.8 -3.7 -3.7 -3.7 -3.8
Goods balance -1.2 -4.6 -3.2 -1.5 -1.6 -2.5 -2.4 -2.8 -3.0 -3.1 -3.2Exports, f.o.b. 14.9 13.1 12.1 12.7 13.3 12.8 13.1 12.4 12.2 12.1 11.9
Commodities 10.8 8.2 7.2 8.3 8.7 8.1 8.3 7.4 7.1 6.8 6.6Fuel 7.6 5.0 3.8 4.2 5.0 4.5 4.7 3.8 3.6 3.4 3.3Non-fuel 3.2 3.3 3.4 4.0 3.7 3.6 3.6 3.6 3.5 3.4 3.3
Non-traditional exports 3.1 3.5 3.4 3.2 3.2 3.4 3.5 3.6 3.7 3.8 3.9Other 1.1 1.4 1.5 1.2 1.3 1.3 1.4 1.4 1.4 1.4 1.5
Imports, f.o.b. 16.1 17.7 15.3 14.2 14.9 15.3 15.5 15.3 15.2 15.1 15.1Consumer goods 3.4 3.8 3.6 3.3 3.4 3.4 3.5 3.4 3.5 3.5 3.5Intermediate goods 6.9 7.4 6.7 6.1 6.5 6.5 6.7 6.5 6.5 6.4 6.4Capital goods 5.3 5.9 4.4 4.2 4.4 4.8 4.8 4.6 4.6 4.6 4.6Other 0.5 0.6 0.6 0.6 0.6 0.6 0.7 0.6 0.6 0.6 0.6
Services balance -1.9 -1.6 -1.2 -1.3 -1.1 -1.0 -1.0 -0.9 -0.8 -0.7 -0.6Exports of services 1.9 2.5 2.7 2.7 2.8 3.0 3.1 3.1 3.2 3.2 3.2Imports of services 3.8 4.2 4.0 4.0 4.0 4.1 4.1 4.0 4.0 3.9 3.9
Primary income balance -3.3 -2.0 -1.8 -2.7 -3.3 -2.8 -2.7 -2.5 -2.4 -2.4 -2.4Receipts 1.0 1.5 1.8 1.8 1.8 2.1 2.1 2.1 2.1 2.1 2.1Expenditures 4.3 3.5 3.6 4.5 5.2 4.8 4.8 4.5 4.5 4.5 4.5
Secondary income balance 1.2 1.9 2.1 2.1 2.3 2.4 2.4 2.4 2.4 2.4 2.5
Financial account balance -5.1 -6.2 -4.3 -3.1 -3.6 -3.9 -3.8 -3.7 -3.7 -3.7 -3.8Direct Investment -3.2 -2.6 -3.3 -3.3 -1.8 -2.4 -2.7 -2.7 -2.7 -2.7 -2.7
Assets 1.0 1.4 1.6 1.2 1.5 1.2 1.1 1.1 1.1 1.0 1.0Liabilities 4.2 4.0 4.9 4.4 3.3 3.6 3.8 3.8 3.8 3.8 3.7
Oil sector 1.2 0.9 0.8 1.0 0.6 0.7 0.7 0.7 0.7 0.7 0.7Non-oil sectors 3.0 3.1 4.1 3.4 2.7 2.9 3.1 3.1 3.1 3.1 3.0
Portfolio Investment -3.0 -3.1 -1.7 -0.5 0.4 -1.6 -1.0 -1.0 -0.9 -0.8 -0.7Assets 1.9 -0.2 1.8 2.0 0.5 0.3 0.4 0.4 0.4 0.4 0.4Liabilities 4.9 3.0 3.5 2.5 0.1 1.9 1.4 1.3 1.3 1.2 1.1
Equity 0.5 0.2 -0.1 0.2 -0.2 0.3 0.4 0.3 0.3 0.2 0.2Debt instruments 4.4 2.7 3.7 2.4 0.4 1.6 1.0 1.0 1.0 1.0 0.9
General government 3.4 1.9 3.1 1.9 1.4 1.1 0.7 0.6 0.7 0.6 0.6Banks 0.0 0.1 0.4 0.1 -0.2 0.1 0.1 0.1 0.1 0.1 0.1Corporates and households 1.1 0.7 0.2 0.3 -0.8 0.4 0.3 0.3 0.3 0.3 0.3
Derivatives 0.2 0.7 -0.2 0.1 0.0 0.0 0.0 0.0 0.0 0.0 0.0Other Investments -0.1 -1.3 0.8 0.4 -2.6 -0.8 -0.7 -0.6 -0.6 -0.7 -0.8Change in Reserve Assets 1.2 0.1 0.1 0.2 0.4 0.9 0.5 0.5 0.5 0.5 0.4
Net errors and omissions 0.1 0.1 -0.1 0.2 0.2 0.0 0.0 0.0 0.0 0.0 0.0
Sources: Banco de la República and IMF staff estimates and projections.
Projections

COLOMBIA
INTERNATIONAL MONETARY FUND 25
Table 3. Colombia: Operations of the Central Government 1/ (In percent of GDP, unless otherwise indicated)
2014 2015 2016 2017 2018 2019 2020 2021 2022 2023 2024Total revenue 16.5 16.1 15.0 15.6 15.1 15.5 15.4 15.4 15.3 15.2 15.2
Current revenue 14.3 14.6 13.7 13.9 13.7 14.1 14.0 14.0 13.9 13.8 13.8Tax revenue 14.3 14.5 13.6 13.8 13.6 14.0 13.9 13.9 13.8 13.7 13.7
Net income tax and profits 5.0 4.8 4.6 6.0 6.4 6.8 6.9 6.8 6.8 6.8 6.8Goods and services 5.1 5.1 4.8 5.2 5.4 5.5 5.0 5.0 5.0 5.0 5.0
Value-added tax 5.1 5.1 4.8 5.0 5.2 5.3 4.8 4.8 4.8 4.8 4.8International trade 0.5 0.5 0.5 0.5 0.5 0.5 0.5 0.5 0.5 0.5 0.5Financial transaction tax 0.8 0.8 0.8 0.7 0.8 0.8 0.8 0.8 0.8 0.8 0.8Stamp and other taxes 2.8 3.2 2.9 1.5 0.6 0.4 0.7 0.8 0.6 0.6 0.5
Nontax revenue 2.3 1.7 1.3 1.8 1.5 1.5 1.5 1.5 1.4 1.4 1.4Property income 0.2 0.4 0.4 0.4 0.2 0.2 0.2 0.2 0.2 0.2 0.2Other 2.1 1.2 0.9 1.4 1.3 1.2 1.3 1.4 1.3 1.3 1.3
Total expenditure and net lending 19.2 19.1 19.0 19.2 18.2 18.5 17.7 17.2 16.7 16.3 16.2
Current expenditure 14.7 15.1 15.6 15.5 15.2 15.7 15.7 15.3 15.0 14.7 14.4Wages and salaries 2.2 2.4 2.3 2.3 2.2 2.2 2.2 2.2 2.2 2.2 2.2Goods and services 0.8 0.8 0.8 0.9 0.9 1.1 1.2 1.1 1.0 1.0 1.0Interest 2.2 2.6 2.9 2.9 2.9 2.9 2.8 2.8 2.8 2.6 2.5
External 0.5 0.5 0.7 0.7 0.7 0.7 0.7 0.7 0.7 0.7 0.7Domestic 1.7 2.0 2.3 2.3 2.2 2.3 2.1 2.0 2.1 1.9 1.9
Current transfers 9.4 9.4 9.6 9.4 9.2 9.4 9.5 9.3 9.1 8.9 8.8
Capital expenditure 4.3 4.0 3.4 3.7 3.0 2.8 2.1 2.0 1.7 1.7 1.8Fixed capital formation 2.9 2.7 2.0 2.4 1.7 1.5 0.8 0.7 0.4 0.4 0.6Capital transfers 1.3 1.3 1.3 1.3 1.3 1.3 1.3 1.3 1.3 1.2 1.2
Net lending 0.0 0.0 0.0 0.0 0.0 0.0 0.0 0.0 0.0 0.0 0.0
Overall balance 2/ -2.4 -2.9 -4.0 -3.6 -3.1 -3.0 -2.3 -1.8 -1.4 -1.2 -1.0
Memorandum items: Oil-related revenues 3/ 2.6 1.1 0.2 0.2 0.6 1.0 1.0 1.2 1.2 1.1 1.2Structural balance 4/ -3.7 -3.6 -3.2 -2.3 -2.2 -2.4 -2.0 -1.6 -1.2 -1.0 -1.0Structural primary non-oil balance -3.3 -1.6 -1.2 -0.5 -0.3 -0.4 -0.1 0.0 0.3 0.4 0.3
Fiscal Impulse -0.2 -1.7 -0.4 -0.7 -0.2 0.1 -0.3 -0.1 -0.4 -0.1 0.1Non-oil balance -5.3 -4.0 -4.1 -3.8 -3.6 -4.0 -3.3 -3.0 -2.6 -2.3 -2.2Primary balance -0.2 -0.4 -1.0 -0.6 -0.2 -0.1 0.5 1.0 1.4 1.5 1.5Nominal GDP (in Col$ trillion) 762.9 804.7 863.8 920.2 984.8 1,055.7 1,129.0 1,205.8 1,288.5 1,376.6 1,469.7
Sources: Ministry of Finance; Banco de la República; and IMF staff estimates and projections.1/ Includes central administration only.2/ For 2019, it excludes expected privatization proceeds (0.3 percent of GDP) that, under GFSM 1986, produces a headline
3/ Includes income tax payments and dividends from Ecopetrol corresponding to earnings from the previous year. 4/ In percent of potential GDP. Adjusts non-commodity revenues for the output gap and commodity revenues for differentials between estimated equilibrium oil price and production levels. Adjustments are made to account for fuel subsidy expenditures and the accrual of Ecopetrol dividends.
Projections
deficit of -2.7 percent of GDP estimated by the authorities.

COLOMBIA
26 INTERNATIONAL MONETARY FUND
Table 4. Colombia: Operations of the Combined Public Sector 1/ (In percent of GDP, unless otherwise indicated)
2014 2015 2016 2017 2018 2019 2020 2021 2022 2023 2024
Total revenue 27.6 26.3 25.2 25.4 25.2 26.1 26.2 26.0 25.6 25.5 25.5Tax revenue 19.9 20.1 19.3 19.4 19.2 19.6 19.5 19.5 19.4 19.3 19.3Nontax revenue 7.7 6.2 5.9 6.0 6.0 6.5 6.7 6.5 6.2 6.1 6.2 Financial income 0.5 0.5 0.5 0.5 0.5 0.5 0.5 0.5 0.5 0.5 0.5 Operating surplus of public enterprises 2/ -0.3 -0.3 -0.2 -0.3 -0.2 -0.3 -0.3 -0.3 -0.3 -0.3 -0.3 Other 3/ 7.5 6.0 5.6 5.8 5.7 6.3 6.5 6.3 5.9 5.9 6.0
Total expenditure and net lending 4/ 29.4 29.7 27.6 28.0 27.4 28.7 27.2 26.7 26.4 26.2 25.9
Current expenditure 21.8 22.0 22.3 22.1 21.7 22.0 21.9 21.7 21.5 21.3 21.1Wages and salaries 5.3 5.2 5.1 5.1 5.1 5.0 5.0 5.0 5.0 5.0 5.0Goods and services 3.1 3.1 3.1 3.1 3.1 3.4 3.4 3.3 3.2 3.2 3.2Interest 2.6 3.1 3.6 3.4 3.2 3.2 3.1 3.0 2.8 2.7 2.5 External 0.6 0.8 1.0 1.0 1.0 1.0 1.0 1.0 1.0 1.0 1.0 Domestic 2.0 2.3 2.6 2.4 2.3 2.1 2.1 1.9 1.8 1.7 1.5Transfers to private sector 8.0 7.7 7.7 7.7 7.5 7.6 7.6 7.6 7.6 7.6 7.6Other 5/ 2.8 2.8 2.8 2.8 2.8 2.8 2.8 2.8 2.8 2.8 2.8
Capital expenditure 7.6 7.7 5.3 5.9 5.7 6.7 5.3 5.0 4.9 4.9 4.7
Statistical discrepancy 0.0 0.0 0.0 0.0 0.0 0.0 0.0 0.0 0.0 0.0 0.0
Nonfinancial public sector balance -1.8 -3.4 -2.4 -2.6 -2.2 -2.6 -1.0 -0.7 -0.8 -0.8 -0.3
Quasi-fiscal balance (BR cash profits) -0.1 0.0 0.1 0.1 0.1 0.3 0.3 0.2 0.3 0.3 0.3Fogafin balance 0.1 0.1 0.1 0.1 0.1 0.1 0.1 0.1 0.1 0.1 0.1Net cost of financial restructuring 6/ 0.0 0.0 0.0 0.0 0.0 0.0 0.0 0.0 0.0 0.0 0.0
Combined public sector balance 7/ -1.8 -3.4 -2.3 -2.4 -2.0 -2.1 -0.6 -0.3 -0.4 -0.4 0.0
Overall financing 1.8 3.3 2.8 3.0 2.6 1.8 0.8 0.7 0.6 0.4 0.0Foreign, net 2.8 2.5 1.6 1.1 1.2 1.5 1.1 1.1 1.1 1.1 1.1Domestic, net -1.0 0.8 1.3 1.9 1.4 0.3 -0.2 -0.4 0.6 -0.7 -1.1
Memorandum items: Overall structural balance 8/ -3.1 -3.5 -1.3 -0.9 -1.2 -1.9 -0.7 -0.3 -0.4 -0.6 -0.3Primary balance 9/ 0.8 -0.2 1.4 1.0 1.2 1.1 2.5 2.7 2.4 2.3 2.5Oil-related revenues 10/ 4.0 2.0 1.1 1.2 1.6 2.4 2.5 2.4 2.2 2.2 2.2Total public debt 11/ 43.3 50.4 49.8 49.5 51.8 50.6 48.5 46.2 44.2 42.2 39.9Nominal GDP (In Col$ trillion) 762.9 804.7 863.8 920.2 984.8 1,055.7 1,129.0 1,205.8 1,288.5 1,376.6 1469.7
Sources: Ministry of Finance; Banco de la República; and IMF staff estimates and projections.1/ The combined public sector includes the central, regional and local governments, social security, and public sector enterprises. Excludes Ecopetrol.
7/ For 2019, excludes privatization proceeds.8/ Adjusts non-commodity revenues for the output gap and commodity revenues for differentials between estimated equilibrium oil price and production levels. Adjustments are made to account for fuel subsidy expenditures and the accrual of Ecopetrol dividends.
local governments.11/ Includes Ecopetrol and Banco de la República's outstanding external debt.
6/ Interest payments on public banks restructuring bonds and mortgage debt relief related costs.
Excludes private pension transfers from revenues.9/ Includes statistical discrepancy. Overall balance plus interest expenditures.
4/ Expenditure reported on commitments basis.5/ Includes adjustments to compute spending on commitment basis and the change in unpaid bills of nonfinancial public enterprises.
10/ Includes income tax payments and dividends from Ecopetrol that correspond to earnings from the previous year, and royalties to
3/ Includes royalties, dividends and social security contributions.
Projections
2/ For 2016, excludes proceeds from the sale of ISAGEN and for 2019, it excludes projected privatization proceeds.

COLOMBIA
INTERNATIONAL MONETARY FUND 27
Table 5. Colombia: Monetary Indicators 1/
2014 2015 2016 2017 2018 2019 2020 2021 2022 2023 2024
Central BankNet Foreign Assets 112,111.1 145,823.2 138,859.3 140,586.1 155,540.8 166,226.6 176,078.0 184,747.5 193,598.9 202,429.2 211,429.6
Gross official reserve assets 112,101.2 145,726.0 138,631.7 140,724.9 161,491.6 172,173.1 182,032.7 190,698.2 199,549.6 208,381.2 217,380.8In billions of US$ 46.9 46.3 46.2 47.2 49.7 52.6 54.5 56.4 58.4 60.3 62.2
Short-term foreign liabilities 25.0 43.1 20.2 64.8 49.0 44.7 52.8 48.8 48.8 50.1 49.2Other net foreign assets 34.9 140.3 247.9 -74.0 -5,901.9 -5,901.9 -5,901.9 -5,901.9 -5,901.9 -5,901.9 -5,901.9
Net domestic assets -42,428.7 -63,301.3 -54,259.4 -51,773.4 -57,459.8 -61,085.2 -63,635.0 -64,658.5 -65,272.4 -65,324.1 -65,058.3Net credit to the public sector -21,025.7 -9,269.8 -5,989.4 -2,492.2 -1,525.1 -1,621.3 -1,689.0 -1,716.1 -1,732.4 -1,733.8 -1,726.7Net credit to the financial system 6,768.0 6,525.0 5,678.6 3,808.4 9,016.5 9,585.4 9,985.5 10,146.2 10,242.5 10,250.6 10,208.9Other -28,171.0 -60,556.5 -53,948.6 -53,089.6 -64,951.3 -69,049.4 -71,931.6 -73,088.5 -73,782.5 -73,840.9 -73,540.5
Monetary base 69,682.4 82,522.0 84,599.9 88,812.7 98,081.0 105,141.4 112,443.0 120,089.1 128,326.5 137,105.1 146,371.3Currency in circulation 56,393.8 66,739.5 69,222.0 74,057.6 80,653.3 86,459.2 92,463.4 98,750.9 105,524.6 112,743.4 120,363.1Deposit money banks reserves 13,205.2 15,711.5 15,283.3 14,671.5 17,322.5 34,497.5 36,935.7 39,473.2 42,169.5 45,058.0 48,121.3Other deposits 83.4 70.9 94.7 83.6 105.2 105.2 105.2 105.2 105.2 105.2 105.2
Financial systemNet foreign assets 92,814.8 131,762.9 130,824.5 128,443.1 142,180.9 151,905.0 160,761.9 168,389.9 176,119.3 183,753.8 191,492.1
In billions of US$ 38.8 41.8 43.6 43.0 43.8 46.4 48.2 49.8 51.5 53.2 54.8Net domestic assets 269,523.0 272,760.4 312,192.4 343,012.9 361,655.9 403,252.6 449,350.2 501,130.4 558,695.2 619,818.6 684,359.0
Net credit to public sector 30,800.1 32,253.4 34,552.8 42,087.7 46,375.2 62,308.5 67,212.5 72,854.4 74,695.0 76,362.4 77,262.1Credit to private sector 323,152.2 377,281.0 406,280.2 458,277.8 496,870.2 545,556.0 598,718.4 663,379.5 741,389.0 828,434.6 933,301.7Other net -84,429.2 -136,774.0 -128,640.6 -157,352.6 -181,589.5 -204,611.9 -216,580.7 -235,103.6 -257,388.8 -284,978.3 -326,204.8
Broad money 362,337.8 404,523.3 443,016.9 471,456.0 503,836.8 555,157.6 610,112.0 669,520.3 734,814.5 803,572.4 875,851.1
Credit to private sector 14.7 16.8 7.7 12.8 8.4 9.8 9.7 10.8 11.8 11.7 12.7Currency 14.9 18.3 3.7 7.0 8.9 7.2 6.9 6.8 6.9 6.8 6.8Monetary base 7.0 18.4 2.5 5.0 10.4 7.2 6.9 6.8 6.9 6.8 6.8Broad money 10.0 11.6 9.5 6.4 6.9 10.2 9.9 9.7 9.8 9.4 9.0
Credit to private sector 42.4 46.9 47.0 49.8 50.5 51.7 53.0 55.0 57.5 60.2 63.5Currency 7.4 8.3 8.0 8.0 8.2 8.2 8.2 8.2 8.2 8.2 8.2Monetary base 9.1 10.3 9.8 9.7 10.0 10.0 10.0 10.0 10.0 10.0 10.0Broad money 47.5 50.3 51.3 51.2 51.2 52.6 54.0 55.5 57.0 58.4 59.6Memorandum items:CPI inflation, eop 3.7 6.8 5.8 4.1 3.2 3.2 3.0 3.0 3.0 3.0 3.0Nominal GDP (In Col$ billions) 762,903 804,692 863,782 920,194 984,803 1,055,693 1,129,007 1,205,779 1,288,488 1,376,632 1,469,671Sources: Banco de la Republica; and IMF staff estimates and projections.1/ For 2018: IMF staff estimates.
(In percent of GDP)
(Annual percentage change)
(In billions of Col$, unless otherwise indicated)
Projections

COLOMBIA
28 INTERNATIONAL MONETARY FUND
Table 6. Colombia: Medium-Term Outlook
2014 2015 2016 2017 2018 2019 2020 2021 2022 2023 2024
Real GDP (in percent change) 4.7 3.0 2.1 1.4 2.7 3.6 3.7 3.6 3.7 3.7 3.6Consumer prices (in percent change; eop) 3.7 6.8 5.8 4.1 3.2 3.2 3.0 3.0 3.0 3.0 3.0Gross national savings 18.8 17.4 19.0 19.0 17.2 18.2 17.9 18.6 18.7 18.8 19.0
Private sector 13.2 13.6 16.1 15.7 13.7 13.9 13.4 14.1 14.4 14.6 14.5Public sector 5.6 3.8 2.9 3.4 3.5 4.3 4.4 4.4 4.3 4.2 4.4
Gross domestic investment 24.0 23.8 23.3 22.3 21.0 22.1 21.7 22.3 22.4 22.6 22.7
Nonfinancial public sector 1/Revenue 27.6 26.3 25.2 25.4 25.2 26.1 26.2 26.0 25.6 25.5 25.5Expenditure 29.4 29.7 27.6 28.0 27.4 28.7 27.2 26.7 26.4 26.2 25.9
Current expenditure 21.8 22.0 22.3 22.1 21.7 22.0 21.9 21.7 21.5 21.3 21.1Capital expenditure 7.6 7.7 5.3 5.9 5.7 6.7 5.3 5.0 4.9 4.9 4.7
Primary balance 2/3/ -0.2 -0.4 -1.0 -0.6 -0.2 -0.1 0.5 1.0 1.4 1.5 1.5Overall balance 2/3/ -1.8 -3.4 -2.4 -2.6 -2.2 -2.6 -1.0 -0.7 -0.8 -0.8 -0.3
Combined public sector balance 3/ -1.8 -3.4 -2.3 -2.4 -2.0 -2.1 -0.6 -0.3 -0.4 -0.4 0.0External financing 2.8 2.5 1.6 1.1 1.2 1.5 1.1 1.1 1.1 1.1 1.1Domestic financing -1.0 0.8 1.3 1.9 1.4 0.3 -0.2 -0.4 0.6 -0.7 -1.1
External current account balance -5.2 -6.3 -4.3 -3.3 -3.8 -3.9 -3.8 -3.7 -3.7 -3.7 -3.8Trade balance -1.2 -4.6 -3.2 -1.5 -1.6 -2.5 -2.4 -2.8 -3.0 -3.1 -3.2
Exports 14.9 13.1 12.1 12.7 13.3 12.8 13.1 12.4 12.2 12.1 11.9Imports 16.1 17.7 15.3 14.2 14.9 15.3 15.5 15.3 15.2 15.1 15.1
Financial account balance -5.1 -6.2 -4.3 -3.1 -3.6 -3.9 -3.8 -3.7 -3.7 -3.7 -3.8Direct Investment -3.2 -2.6 -3.3 -3.3 -1.8 -2.4 -2.7 -2.7 -2.7 -2.7 -2.7Portfolio Investment -3.0 -3.1 -1.7 -0.5 0.4 -1.6 -1.0 -1.0 -0.9 -0.8 -0.7Other Investments and Derivatives 0.0 -0.7 0.6 0.5 -2.6 -0.8 -0.7 -0.6 -0.6 -0.7 -0.8Change in Reserve Assets 1.2 0.1 0.1 0.2 0.4 0.9 0.5 0.5 0.5 0.5 0.4
Gross public sector debt 4/ 43.3 50.4 49.8 49.5 51.8 50.6 48.5 46.2 44.2 42.2 39.9Gross public sector debt, excluding Ecopetrol 40.5 45.7 45.4 46.1 49.3 48.5 46.5 44.5 42.8 41.2 39.3
Total public net debt 5/ 32.9 42.1 38.6 38.7 41.3 41.6 40.3 38.7 37.3 35.9 34.2
Memorandum items:Nominal GDP (in Col$ billion) 762,903 804,692 863,782 920,194 984,803 1,055,693 1,129,007 1,205,779 1,288,488 1,376,632 1,469,671Crude oil, spot price 96.2 50.8 42.8 52.8 68.3 59.2 59.0 58.1 57.6 57.6 58.0
Sources: Colombian authorities and IMF staff estimates and projections. 1/ Excludes Ecopetrol. 2/ Includes statistical discrepancy. 3/ For 2016, excludes proceeds from the sale of ISAGEN and for 2019, it excludes projected privatization proceeds. 4/ Includes debt of the non-financial public sector, plus Ecopetrol, FOGAFIN and FINAGRO. 5/ Gross debt minus financial assets (public sector deposits in domestic and foreign financial institutions).
(In percent of GDP, unless otherwise indicated)
(In percent of GDP, unless otherwise indicated)
Projections

COLOMBIA
INTERNATIONAL MONETARY FUND 29
Table 7. Colombia: Financial Soundness Indicators 1/ (In percent, unless otherwise indicated; end-of-period values)
2009 2010 2011 2012 2013 2014 2015 2016 2017 2018
Capital AdequacyRegulatory capital to risk-weighted assets 17.2 17.3 16.9 18.1 17.0 17.0 16.9 17.5 18.6 18.5Regulatory Tier 1 capital to risk-weighted assets 13.4 13.0 13.4 13.7 12.0 11.7 11.4 11.4 12.4 12.7Capital (net worth) to assets 2/ 14.2 14.2 14.3 14.7 14.8 14.9 14.1 16.2 16.1 16.6
Asset Quality and DistributionNonperforming loans to gross loans 4.0 2.9 2.5 2.8 2.8 2.9 2.8 3.1 4.2 4.4Provisions to nonperforming loans 140.1 175.0 182.0 163.9 160.7 151.3 155.5 153.5 134.7 127.3Gross loans to assets 64.3 67.9 70.4 69.6 68.2 69.3 70.2 69.3 70.1 69.9
Earnings and ProfitabilityROAA 3.5 3.4 3.3 3.1 2.8 2.9 2.7 3.0 2.2 2.6ROAE 26.2 23.7 23.0 21.2 19.5 19.8 18.9 18.3 13.7 16.0Interest margin to gross income 54.0 55.6 58.4 58.7 61.3 60.6 58.7 53.7 59.2 57.3Noninterest expenses to gross income 43.2 47.0 49.3 47.2 47.0 44.6 43.4 41.2 43.9 41.9
LiquidityLiquid assets to total assets 3/ 24.6 22.1 21.5 21.6 21.4 19.8 18.9 18.0 18.6 19.2Liquid assets to short-term liabilities 3/ 47.8 42.7 43.7 43.6 41.9 40.3 39.9 39.9 42.6 43.0Deposit to loan ratio 98.8 93.5 91.4 94.7 96.3 91.6 93.2 92.6 92.7 92.0
OtherForeign-currency-denominated loans to total loans 4.2 6.9 7.7 7.5 7.3 8.4 8.3 6.9 6.1 5.9Foreign-currency-denominated liabilities to total liabilities 7.1 9.8 11.5 10.5 11.9 13.5 13.9 11.8 11.0 11.6Net open position in foreign exchange to capital 4/ 0.5 0.6 1.0 0.6 0.5 0.7 1.3 5.5 6.4 7.1
Source: Superintendencia Financiera.1/ Total Banking System. All deposit-taking institutions.2/ Large increase in 2016 due to a change to IFRS in January 2016 where deposit insurance that used to be recorded as a liability is now recorded as capital.3/ Data after 2011 refers to broader definition of liquid assets in line with international standards.4/ Since January 2016, goodwill and retained earnings started to be recorded in foreign currency. Before January of 2016, they were recorded in Colombian pesos and weren’t included in the foreign exchange position.

COLOMBIA
30 INTERNATIONAL MONETARY FUND
Table 8. Colombia: Indicators of External Vulnerability 1/ (In billions of US$, unless otherwise indicated)
2014 2015 2016 2017 2018 2019 2020 2021 2022 2023 2024
Exports of GNFS 64.1 46.0 41.9 48.1 53.8 53.3 57.2 57.9 60.5 63.5 66.6Imports of GNFS 75.9 64.3 54.5 56.6 62.9 65.3 69.4 71.8 75.4 79.3 83.3Terms of trade (y/y percent change) -4.5 -17.5 3.7 9.3 10.3 -4.1 0.0 1.0 -0.1 0.6 0.7
Current account balance -19.8 -18.6 -12.0 -10.3 -12.7 -13.3 -13.4 -13.9 -14.7 -15.6 -16.5In percent of GDP -5.2 -6.3 -4.3 -3.3 -3.8 -3.9 -3.8 -3.7 -3.7 -3.7 -3.8
Financial account balance -19.3 -18.2 -12.3 -9.6 -12.0 -13.3 -13.4 -13.9 -14.7 -15.6 -16.5Of which: Foreign direct investment (net) -12.3 -7.5 -9.3 -10.1 -5.9 -8.2 -9.4 -10.0 -10.7 -11.4 -12.1Of which: Portfolio investment (net) -11.6 -9.2 -4.8 -1.6 1.2 -5.4 -3.6 -3.6 -3.6 -3.3 -3.1
Total external debt (in percent of GDP) 2/ 30.0 42.1 49.4 47.3 46.7 48.7 48.7 48.1 47.9 47.2 46.2Of which : Public sector (in percent of GDP) 2/ 18.9 26.5 31.9 30.3 28.9 29.5 28.9 28.0 27.5 26.6 25.5In percent of gross international reserves 243.9 267.0 302.1 312.6 321.9 320.4 323.4 325.6 330.7 333.0 333.4Short-term external debt (in percent of GDP) 3/ 3.9 5.5 5.3 5.3 6.2 6.5 6.4 6.4 6.3 6.3 6.2
Of which : Public sector (in percent of GDP) 0.2 0.2 0.2 0.2 0.2 0.2 0.2 0.2 0.2 0.2 0.2Of which : Private sector (in percent of GDP) 3.7 5.3 5.0 5.1 6.0 6.2 6.2 6.2 6.1 6.1 6.0
Amortization of MLT external debt 15.0 20.9 18.1 31.9 28.7 20.2 22.6 24.0 20.5 22.8 22.6(in percent of GNFS exports)
External interest payments 6.2 9.9 11.3 10.9 10.7 15.0 15.1 15.1 14.9 14.9 14.8(in percent of GNFS exports)
Gross international reserves 4/ 46.8 46.3 46.2 47.1 48.3 51.2 53.2 55.1 57.0 58.9 60.8In months of prospective GNFS imports 8.7 10.2 9.8 9.0 8.9 8.9 8.9 8.8 8.6 8.5 8.3In percent of broad money 25.9 31.4 31.9 29.5 28.4 28.9 27.9 26.6 25.4 24.3 23.2In percent of short-term debt on residual maturity 108.7 129.3 114.0 105.9 108.0 106.7 105.1 108.1 103.7 102.3 105.6
basis plus current account deficitIn percent of ARA 5/ 151.9 152.4 137.9 129.4 130.1 130.6 128.0 125.7 123.8 121.2 119.7
Nominal exchange rate (Col$/US$, period average) 2,001 2,742 3,055 2,951 2,956 NA NA NA NA NA NA
Real effective exchange rate -6.9 -20.6 -4.8 5.6 0.8 NA NA NA NA NA NA(percentage change, + = appreciation)
Sources: Banco de la República; and IMF staff estimates and projections.1/ GNFS stands for goods and nonfactor services; MLT stands for medium and long-term. 2/ Includes foreign holdings of locally issued public debt (TES).3/ Original maturity of less than 1 year. Stock at the end of the previous period.4/ IMF definition that excludes Colombia's contribution to Fondo Latinoamericano de Reservas (FLAR) and includes valuation changes of reserves denominated in other currencies than U.S. dollars.5/ Excluding commodity buffer. Coverage including a buffer for oil price uncertainty was 118 percent of the metric at end-2018.
Projections

COLOMBIA
INTERNATIONAL MONETARY FUND 31
Table 9. Colombia: Public Sector Debt Sustainability Analysis – Baseline Scenario (In percent of GDP, unless otherwise indicated)
As of February 28, 20192/ 2017 2018 2019 2020 2021 2022 2023 2024 Sovereign Spreads
Nominal gross public debt 39.5 49.5 51.8 50.6 48.5 46.2 44.2 42.2 39.9 EMBIG (bp) 3/ 191Public gross financing needs 5.6 5.3 3.9 6.4 3.7 3.3 2.3 3.4 2.2 5Y CDS (bp) 103
Real GDP growth (in percent) 3.8 1.4 2.7 3.6 3.7 3.6 3.7 3.7 3.6 Ratings Foreign LocalInflation (GDP deflator, in percent) 4.2 5.1 4.2 3.4 3.1 3.0 3.0 3.0 3.0 Moody's Baa2 Baa2Nominal GDP growth (in percent) 8.2 6.5 7.0 7.2 6.9 6.8 6.9 6.8 6.8 S&Ps BBB- BBBEffective interest rate (in percent) 4/ 8.8 7.2 7.0 6.7 6.6 6.6 6.6 6.7 6.5 Fitch BBB BBB
2017 2018 2019 2020 2021 2022 2023 2024 cumulativeChange in gross public sector debt 1.9 -0.3 2.4 -1.2 -2.1 -2.3 -2.1 -2.0 -2.3 -11.9Identified debt-creating flows -2.3 -3.4 -2.3 -0.3 -1.7 -1.9 -1.6 -1.5 -1.8 -8.9Primary deficit -0.2 -0.3 -0.5 -0.1 -1.6 -1.8 -1.5 -1.4 -1.7 -8.1
Primary (noninterest) revenue and grants25.9 24.9 24.7 25.6 25.7 25.5 25.1 25.0 25.0 152.0Primary (noninterest) expenditure 25.7 24.7 24.1 25.5 24.1 23.7 23.6 23.6 23.3 143.9
Automatic debt dynamics 5/ -2.0 -3.1 -1.7 -0.2 -0.1 -0.1 -0.1 -0.1 -0.1 -0.7Interest rate/growth differential 6/ -2.8 -3.0 -3.2 -0.2 -0.1 -0.1 -0.1 -0.1 -0.1 -0.7
Of which: real interest rate -1.5 -2.4 -2.0 1.5 1.6 1.6 1.5 1.5 1.3 9.0Of which: real GDP growth -1.3 -0.6 -1.2 -1.8 -1.7 -1.7 -1.6 -1.5 -1.4 -9.8
Exchange rate depreciation 7/ 0.7 -0.1 1.5 … … … … … … …Other identified debt-creating flows -0.1 0.0 0.0 0.0 0.0 0.0 0.0 0.0 0.0 0.0
Privatization (incl. concessions) (negativ-0.1 0.0 0.0 -0.3 0.0 0.0 0.0 0.0 0.0 -0.3Contingent liabilities 0.0 0.0 0.0 0.0 0.0 0.0 0.0 0.0 0.0 0.0Please specify (2) (e.g., ESM and Euroare 0.0 0.0 0.0 0.0 0.0 0.0 0.0 0.0 0.0 0.0
Residual, including asset changes 8/ 4.2 3.1 4.7 -0.3 -0.3 -0.4 -0.4 -0.5 -0.5 -2.4
Source: IMF staff estimates.1/ Public sector is defined as non-financial public sector.2/ Based on available data.3/ EMBIG.4/ Defined as interest payments divided by debt stock (excluding guarantees) at the end of previous year.5/ Derived as [(r - π(1+g) - g + ae(1+r)]/(1+g+π+gπ)) times previous period debt ratio, with r = interest rate; π = growth rate of GDP deflator; g = real GDP growth rate;a = share of foreign-currency denominated debt; and e = nominal exchange rate depreciation (measured by increase in local currency value of U.S. dollar).6/ The real interest rate contribution is derived from the numerator in footnote 5 as r - π (1+g) and the real growth contribution as -g.7/ The exchange rate contribution is derived from the numerator in footnote 5 as ae(1+r). 8/ Includes asset changes and interest revenues (if any). For projections, includes exchange rate changes during the projection period.9/ Assumes that key variables (real GDP growth, real interest rate, and other identified debt-creating flows) remain at the level of the last projection year.
-0.10balance 9/
primary
Debt, Economic and Market Indicators 1/
2008-2016Actual
Projections
Contribution to Changes in Public DebtProjections
2008-2016Actual
debt-stabilizing
-8
-6
-4
-2
0
2
4
6
8
10
12
2008 2009 2010 2011 2012 2013 2014 2015 2016 2017 2018 2019 2020 2021 2022 2023 2024
Debt-Creating Flows
Primary deficit Real GDP growth Real interest rateExchange rate depreciation Other debt-creating flows ResidualChange in gross public sector debt
projection
(In percent of GDP)
-25
-20
-15
-10
-5
0
5
10
15
cumulative

COLOMBIA
32 INTERNATIONAL MONETARY FUND
Table 10. Colombia: Public Sector Debt Sustainability Analysis – Composition of Public Debt and Alternative Scenarios
Baseline Scenario 2019 2020 2021 2022 2023 2024 Historical Scenario 2019 2020 2021 2022 2023 2024Real GDP growth 3.6 3.7 3.6 3.7 3.7 3.6 Real GDP growth 3.6 3.5 3.5 3.5 3.5 3.5Inflation 3.4 3.1 3.0 3.0 3.0 3.0 Inflation 3.4 3.1 3.0 3.0 3.0 3.0Primary Balance 0.1 1.6 1.8 1.5 1.4 1.7 Primary balance 0.1 0.1 0.1 0.1 0.1 0.1Effective interest rate 6.7 6.6 6.6 6.6 6.7 6.5 Effective interest rate 6.7 6.6 6.7 6.7 6.8 6.7
Constant Primary Balance ScenarioReal GDP growth 3.6 3.7 3.6 3.7 3.7 3.6Inflation 3.4 3.1 3.0 3.0 3.0 3.0Primary balance 0.1 0.1 0.1 0.1 0.1 0.1Effective interest rate 6.7 6.6 6.6 6.6 6.7 6.5
Source: IMF staff estimates.
Underlying Assumptions(In percent)
Alternative Scenarios
Composition of Public Debt
Baseline Historical Constant Primary Balance
39.9
50.147.850.6
35
37
39
41
43
45
47
49
51
53
2017 2018 2019 2020 2021 2022 2023 2024
Gross Nominal Public Debt
projection
3.3
5.1
0
1
2
3
4
5
6
7
2017 2018 2019 2020 2021 2022 2023 2024
Public Gross Financing Needs
projection
(In percent of GDP)
0
10
20
30
40
50
60
2008 2010 2012 2014 2016 2018 2020 2022 2024
By Maturity
Medium and long-termShort-term
projection
(In percent of GDP)
0
10
20
30
40
50
60
2008 2010 2012 2014 2016 2018 2020 2022 2024
By Currency
Local currency-denominatedForeign currency-denominated
projection
(In percent of GDP)
(In percent of GDP)

COLOMBIA
INTERNATIONAL MONETARY FUND 33
Proj
ectio
ns20
1420
1520
1620
1720
1820
1920
2020
2120
2220
2320
24D
ebt-
stab
ilizi
ngno
n-in
tere
st
curr
ent a
ccou
nt 6
/Ba
selin
e: E
xter
nal d
ebt
30.0
42.1
49.4
47.3
46.7
48.7
48.7
48.1
47.9
47.2
46.2
-2.9
Chan
ge in
ext
erna
l deb
t4.
312
.17.
3-2
.1-0
.62.
0-0
.1-0
.6-0
.2-0
.7-1
.0Id
entif
ied
exte
rnal
deb
t-cre
atin
g flo
ws (4
+8+9
)1.
812
.44.
1-4
.0-0
.7-0
.1-0
.6-0
.6-0
.6-0
.6-0
.5Cu
rren
t acc
ount
def
icit,
exclu
ding
inte
rest
pay
men
ts4.
14.
82.
61.
62.
11.
61.
31.
41.
41.
51.
5De
ficit
in b
alan
ce o
f goo
ds a
nd s
ervic
es3.
16.
24.
52.
72.
73.
63.
53.
73.
83.
83.
8Ex
ports
16.8
15.7
14.8
15.4
16.1
15.8
16.2
15.5
15.4
15.3
15.2
Impo
rts
19.9
21.9
19.3
18.2
18.9
19.4
19.6
19.3
19.1
19.1
19.0
Net
non
-deb
t cre
atin
g ca
pita
l inf
lows
(neg
ative
)-3
.3-1
.7-1
.4-2
.9-1
.5-2
.4-2
.6-2
.7-2
.7-2
.6-2
.6Au
tom
atic
debt
dyn
amics
1/
1.0
9.3
2.8
-2.7
-1.3
0.7
0.7
0.7
0.6
0.6
0.6
Cont
ribut
ion
from
nom
inal
inte
rest
rate
1.0
1.6
1.7
1.7
1.7
2.4
2.4
2.3
2.3
2.3
2.2
Cont
ribut
ion
from
real
GDP
gro
wth
-1.2
-1.2
-0.9
-0.6
-1.2
-1.7
-1.7
-1.7
-1.7
-1.7
-1.6
Cont
ribut
ion
from
pric
e an
d ex
chan
ge ra
te c
hang
es 2
/ 1.
18.
92.
1-3
.8-1
.9...
......
......
...Re
sidua
l, in
cl. c
hang
e in
gro
ss fo
reig
n as
sets
(2-3
) 3/
2.5
-0.3
3.2
1.9
0.2
2.1
0.5
0.0
0.4
-0.1
-0.5
Exte
rnal
deb
t-to-
expo
rts ra
tio (i
n pe
rcen
t)17
8.4
268.
533
3.4
306.
128
9.3
308.
130
0.7
309.
631
1.8
308.
930
4.8
Gros
s ex
tern
al fi
nanc
ing
need
(in
billi
ons
of U
S do
llars
) 4/
41.5
43.1
35.8
40.5
44.5
44.8
48.0
50.6
51.0
54.9
57.6
in p
erce
nt o
f GDP
10.9
14.7
12.7
13.0
13.4
13.3
13.6
13.6
12.9
13.2
13.1
Scen
ario
with
key
var
iabl
es a
t the
ir hi
stor
ical
ave
rage
s 5/
10-Y
ear
10-Y
ear
48.7
50.2
51.5
53.2
54.5
55.3
-2.1
Hist
orica
lSt
anda
rd
Key
Mac
roec
onom
ic A
ssum
ptio
ns U
nder
lyin
g Ba
selin
eAv
erag
eDe
viatio
n
Real
GDP
gro
wth
(in p
erce
nt)
4.7
3.0
2.1
1.4
2.7
3.5
1.9
3.6
3.7
3.6
3.7
3.7
3.6
GDP
defla
tor i
n US
dol
lars
(cha
nge
in p
erce
nt)
-4.7
-25.
2-5
.68.
84.
10.
411
.8-2
.41.
11.
81.
81.
91.
9N
omin
al e
xter
nal i
nter
est r
ate
(in p
erce
nt)
4.1
4.0
3.8
3.8
3.9
4.5
0.7
5.1
5.2
5.1
5.0
5.0
5.0
Grow
th o
f exp
orts
(US
dolla
r ter
ms,
in p
erce
nt)
-4.8
-28.
2-9
.015
.011
.73.
818
.8-0
.97.
31.
34.
45.
14.
8Gr
owth
of i
mpo
rts (
US d
olla
r ter
ms,
in p
erce
nt)
7.7
-15.
3-1
5.1
3.8
11.1
4.4
15.7
3.8
6.3
3.5
5.0
5.2
5.1
Curr
ent a
ccou
nt b
alan
ce, e
xclu
ding
inte
rest
pay
men
ts
-4.1
-4.8
-2.6
-1.6
-2.1
-2.4
1.2
-1.6
-1.3
-1.4
-1.4
-1.5
-1.5
Net
non
-deb
t cre
atin
g ca
pita
l inf
lows
3.
31.
71.
42.
91.
52.
31.
22.
42.
62.
72.
72.
62.
6
Sour
ce: I
MF
staf
f est
imat
es.
g =
real
GDP
gro
wth
rate
, e =
nom
inal
app
reci
atio
n (in
crea
se in
dol
lar v
alue
of d
omes
tic c
urre
ncy)
, and
a =
shar
e of
dom
estic
-cur
renc
y de
nom
inat
ed d
ebt i
n to
tal e
xter
nal d
ebt.
(bas
ed o
n GD
P de
flato
r).
3/ F
or p
roje
ctio
n, li
ne in
clud
es th
e im
pact
of p
rice
and
exch
ange
rate
cha
nges
.4/
Def
ined
as c
urre
nt a
ccou
nt d
efic
it, p
lus a
mor
tizat
ion
on m
ediu
m- a
nd lo
ng-t
erm
deb
t, pl
us sh
ort-
term
deb
t at e
nd o
f pre
viou
s per
iod.
5/
The
key
var
iabl
es in
clud
e re
al G
DP g
row
th; n
omin
al in
tere
st ra
te; d
olla
r def
lato
r gro
wth
; and
bot
h no
n-in
tere
st c
urre
nt a
ccou
nt a
nd n
on-d
ebt i
nflo
ws i
n pe
rcen
t of G
DP.
6/ L
ong-
run,
con
stan
t bal
ance
that
stab
ilize
s the
deb
t rat
io a
ssum
ing
that
key
var
iabl
es (r
eal G
DP g
row
th, n
omin
al in
tere
st ra
te, d
olla
r def
lato
r gro
wth
, and
non
-deb
t inf
low
s in
perc
ent o
f GDP
) rem
ain
at th
eir l
evel
s of
the
last
pro
ject
ion
year
.
Actu
al
2/ T
he c
ontri
butio
n fro
m p
rice
and
exch
ange
rate
cha
nges
is d
efin
ed a
s [-r
(1+g
) + e
a(1+
r)]/(
1+g+
r+gr
) tim
es p
revi
ous p
erio
d de
bt st
ock.
r in
crea
ses w
ith a
n ap
prec
iatin
g do
mes
tic c
urre
ncy
(e >
0) a
nd ri
sing
infla
tion
1/ D
eriv
ed a
s [r -
g -
r(1+g
) + e
a(1+
r)]/(
1+g+
r+gr
) tim
es p
revi
ous p
erio
d de
bt st
ock,
with
r =
nom
inal
effe
ctiv
e in
tere
st ra
te o
n ex
tern
al d
ebt;
r = c
hang
e in
dom
estic
GDP
def
lato
r in
US d
olla
r ter
ms,
Tabl
e 11
. Col
ombi
a: E
xter
nal D
ebt S
usta
inab
ility
Fra
mew
ork
(In p
erce
nt o
f GD
P, u
nles
s oth
erw
ise in
dica
ted)

COLOMBIA
34 INTERNATIONAL MONETARY FUND
Figure 7. Colombia: External Debt Sustainability: Bound Tests 1/ 2/ (External debt in percent of GDP)
i-rate shock
47
Baseline 46
20
30
40
50
60
70
80
90
100
2014 2016 2018 2020 2022 2024
Interest Rate Shock(In percent)
Sources: IMF staff estimates.1/ Shaded areas represent actual data. Individual shocks are permanent one-half standard deviation shocks. Figures in the boxes represent average projections for the respective variables in the baseline and scenario being presented. Ten-year historical average for the variable is also shown. 2/ For historical scenarios, the historical averages are calculated over the ten-year period, and the information is used to project debt dynamics five years ahead.3/ Permanent 1/4 standard deviation shocks applied to real interest rate, growth rate, and current account balance.4/ One-time real depreciation of 30 percent occurs in 2020.
Historical
55
Baseline 46
0
5
10
15
20
20
30
40
50
60
70
80
90
100
2014 2016 2018 2020 2022 2024
Baseline and Historical Scenarios
CA shock 49
Baseline 46
20
30
40
50
60
70
80
90
100
2014 2016 2018 2020 2022 2024
Combined shock
49
Baseline 46
20
30
40
50
60
70
80
90
100
2014 2016 2018 2020 2022 2024
Combined Shock 3/
30 % depreciation
64
Baseline 46
20
30
40
50
60
70
80
90
100
2014 2016 2018 2020 2022 2024
Real Depreciation Shock 4/
Gross financing need under baseline
(right scale)
Non-Interest Current Account Shock (In percent of GDP)
Growth shock 48
Baseline 46
20
30
40
50
60
70
80
90
100
2014 2016 2018 2020 2022 2024
Baseline:
Scenario:
Historical:
5.15.44.5
Baseline:
Scenario:
Historical:
3.72.83.5
Baseline:Scenario:
Historical:
-1.4-2.2-2.4
Growth Shock (In percent per year)

COLOMBIA
INTERNATIONAL MONETARY FUND 35
Table 12. Colombia: Indicators of Fund Credit 1/
2018 2019 2020 2021 2022 2023 2024
Stocks from prospective drawings 2/Fund credit (Millions of SDR) 0 7,848 7,848 7,848 5,886 1,962 0
In percent of quota 0 384 384 384 288 96 0In percent of GDP 0.0 3.3 3.1 3.0 2.1 0.7 0.0In percent of exports of goods and services 0.0 20.6 19.4 19.2 13.9 4.4 0.0In percent of gross reserves 0.0 21.5 20.8 20.2 14.8 4.8 0.0
Flows from prospective drawingsAmortization 0 0 0 0 1,962 3,924 1,962Charges (Millions of SDR) 0 149.1 249.1 248.9 257.2 129.9 19.7Debt Service due on GRA credit (Millions SDR) 0 149.1 249.1 248.9 2,219.2 4,053.9 1,981.7
In percent of quota 0.0 7.3 12.2 12.2 108.5 198.3 96.9In percent of GDP 0.0 0.1 0.1 0.1 0.8 1.4 0.7In percent of exports of goods and services 0.0 0.4 0.6 0.6 5.2 9.1 4.3In percent of gross reserves 0.0 0.4 0.7 0.6 5.5 9.9 4.7
Memorandum Item:Total External Debt (percent of GDP) 46.7 48.7 48.7 48.1 47.9 47.2 46.2Total Debt Service (percent of GDP) 11.3 11.7 12.3 12.2 11.5 11.7 11.6
2/ Stocks as of end of period.
Sources: IMF Finance Department; Colombian authorities, and IMF staff estimates.1/ Assumes full drawings under the FCL upon approval of the review. The Colombian authorities have expressed their intention to treat the arrangement as precautionary.
Projections
Statement by Leonardo Villar, Executive Director for Colombia May 20, 2019
On behalf of the Colombian authorities, I want to thank staff for the review under the Flexible Credit Line arrangement and the clear assessment according to which Colombia continues to meet the qualification criteria for access to FCL resources. This review comes a month after the formal Board discussion on the Article IV consultation. We are grateful for the support Directors expressed commending the authorities for the strong policy framework and well executed policy actions, that despite significant negative shocks have supported economic recovery in a context of subdued inflation, flexible exchange rate, adherence to fiscal balance rule and enhanced financial regulation and supervision. Still, it is clear Colombia continues facing important risks that are somewhat tilted to the downside relative to the situation that could be envisaged one year ago, when the current FCL arrangement was approved. This is certain in the case of global risks, but even more so at the regional level as consequence of the continued deterioration of the Venezuelan situation that has led to an unprecedented process of massive immigration. The current number of migrants is close to 1.5 million and is projected to reach 2.5 million by end 2020 in staff’s baseline projection. As highlighted in the staff’s document, Colombia has benefitted from the FCL arrangement. The FCL contributed to Colombia weathering last year’s emerging market turmoil and it provides important insurance against tail risks. My authorities have reiterated their intention to continue treating the FCL arrangement as precautionary and to gradually reduce access to Fund resources, risk permitting. They remain committed to the exit strategy communicated when the current FCL was approved in August 2018. Authorities would intend to reduce access to the Fund resources in any subsequent FCL arrangement and to phase out Colombia’s use of the facility, contingent on the evolution of risks. To that end, in September 2018 the Central Bank of Colombia—Banco de la República (BoR)—announced a program to accumulate international reserves through a market-based mechanism. The press release announcing the program explicitly noted that the BoR Board of Directors decided to initiate a program of gradual international reserve accumulation “ïn order to be prepared for a potential reduction of the Flexible Credit Line that Colombia has with IMF in the year 2020”1.
1 See http://www.banrep.gov.co/en/press-release/28-september-2018-2.

2
In my authorities’ view, cautious policy continuity is Colombia’s main line of defense against uncertainty and external volatility and it will help the country to respond appropriately to any shock that may arise in the future. A comfortable level of international reserves is part of the same strategy. Still, access to the FCL has also been very important to maintain confidence in the economy and to allow for a sound management of the adjustment process after the shocks that the economy has faced in the recent past and is experiencing today. My authorities are therefore grateful to the IMF for the support and for the staff’s recommendation of completion of the review under the FCL arrangement.