imf country report no. 11/302 chad · recent economic developments, 2005–10 _____5 2. impact of...
TRANSCRIPT

©2011 International Monetary Fund
IMF Country Report No. 11/302
CHAD 2011 ARTICLE IV CONSULTATION
Under Article IV of the IMF’s Articles of Agreement, the IMF holds bilateral discussions with members, usually every year. In the context of the Article IV consultation with Chad, the following documents have been released and are included in this package: Staff Report for the Article IV consultation, prepared by a staff team of the IMF, following discussions that ended on June 15, 2011, with the officials of Chad on economic developments and policies. Based on information available at the time of these discussions, the staff report was completed on August 5, 2011 . The views expressed in the staff report are those of the staff team and do not necessarily reflect the views of the Executive Board of the IMF.
Informational Annex prepared by the IMF.
Debt Sustainability Analysis prepared by the staffs of the IMF and the World Bank.
Staff Statement of September 7, 2011.
Public Information Notice (PIN) summarizing the views of the Executive Board as expressed during its discussion of the staff report that concluded the Article IV consultation.
Statement by the Executive Director for Chad.
The policy of publication of staff reports and other documents allows for the deletion of market-sensitive information.
Copies of this report are available to the public from
International Monetary Fund Publication Services 700 19th Street, N.W. Washington, D.C. 20431
Telephone: (202) 623-7430 Telefax: (202) 623-7201 E-mail: [email protected] Internet: http://www.imf.org
International Monetary Fund
Washington, D.C.
October 2011
CHAD STAFF REPORT FOR THE 2011 ARTICLE IV CONSULTATION
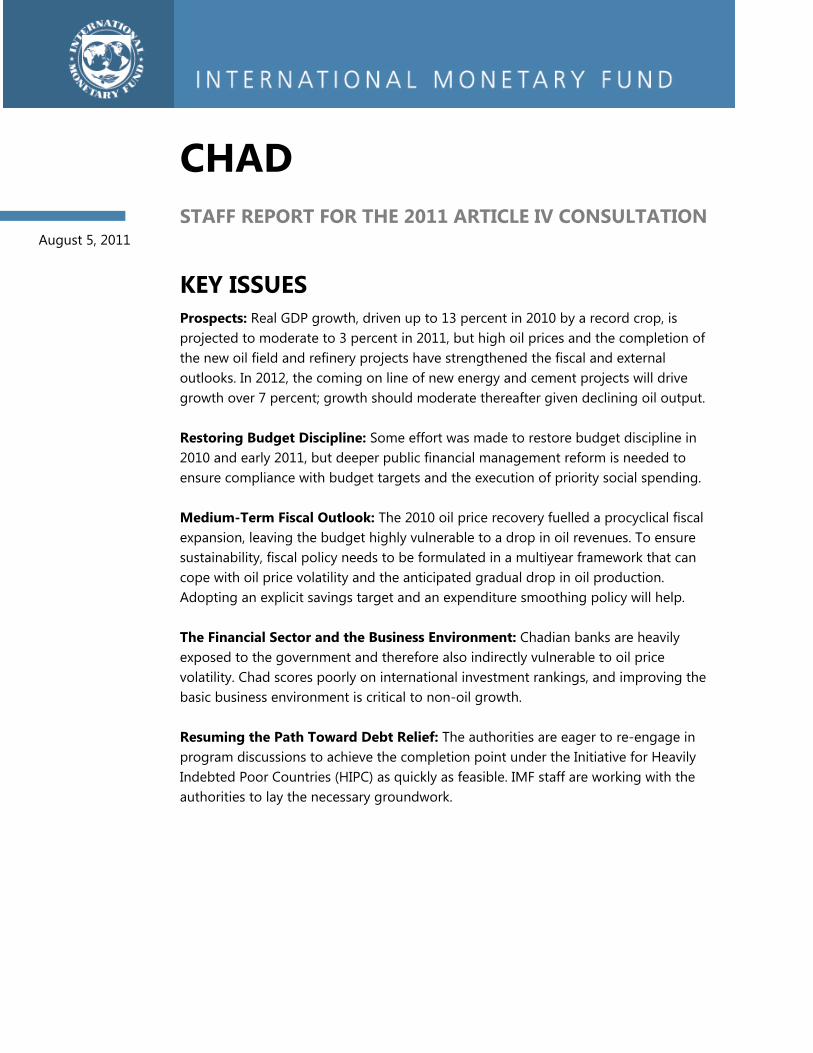
KEY ISSUES Prospects: Real GDP growth, driven up to 13 percent in 2010 by a record crop, is projected to moderate to 3 percent in 2011, but high oil prices and the completion of the new oil field and refinery projects have strengthened the fiscal and external outlooks. In 2012, the coming on line of new energy and cement projects will drive growth over 7 percent; growth should moderate thereafter given declining oil output. Restoring Budget Discipline: Some effort was made to restore budget discipline in 2010 and early 2011, but deeper public financial management reform is needed to ensure compliance with budget targets and the execution of priority social spending. Medium-Term Fiscal Outlook: The 2010 oil price recovery fuelled a procyclical fiscal expansion, leaving the budget highly vulnerable to a drop in oil revenues. To ensure sustainability, fiscal policy needs to be formulated in a multiyear framework that can cope with oil price volatility and the anticipated gradual drop in oil production. Adopting an explicit savings target and an expenditure smoothing policy will help. The Financial Sector and the Business Environment: Chadian banks are heavily exposed to the government and therefore also indirectly vulnerable to oil price volatility. Chad scores poorly on international investment rankings, and improving the basic business environment is critical to non-oil growth. Resuming the Path Toward Debt Relief: The authorities are eager to re-engage in program discussions to achieve the completion point under the Initiative for Heavily Indebted Poor Countries (HIPC) as quickly as feasible. IMF staff are working with the authorities to lay the necessary groundwork.
August 5, 2011

2011 ARTICLE IV REPORT CHAD
2 INTERNATIONAL MONETARY FUND
Approved By Seán Nolan and Dhaneshwar Ghura
Discussions took place in N’Djamena from June 2–5, 2011. The staff team comprised Messrs. Wieczorek (head), Keller, Ladd, Nachega (all AFR), and Mr. Topeur, resident economist.
CONTENTS
I. INTRODUCTION ________________________________________________________________________________ 4
II. RECENT ECONOMIC DEVELOPMENTS AND OUTLOOK _____________________________________ 4
A. The 2010 Recovery ______________________________________________________________________________4
B. Recent Developments, Outlook, and Risks_______________________________________________________8
III. RESTORING BUDGET DISCIPLINE ___________________________________________________________ 10
IV. MEDIUM-TERM FISCAL POLICY ____________________________________________________________ 13
V. THE FINANCIAL SECTOR AND THE BUSINESS ENVIRONMENT ___________________________ 17
VI. RESUMING THE PATH TOWARD DEBT RELIEF_____________________________________________ 20
VII. STAFF APPRAISAL __________________________________________________________________________ 21 TABLES 1. Selected Economic and Financial Indicators, 2009–16 ________________________________________ 23 2. GDP by Sector, 2009–16 ______________________________________________________________________ 24 3. Fiscal Operations of the Central Government, 2009–16 _______________________________________ 25 3a. Statement of Operations of the Central Government, 2009–16 ______________________________ 26 3b. Integrated Financial Balance Sheet of the Central Government, 2011–13 ___________________ 27 4. Fiscal Operations of the Central Government, 2009–16 _______________________________________ 28 4a. Statement of Operations of the Central Government, 2009–16 ______________________________ 29 5. Balance of Payments, 2009–16 ________________________________________________________________ 30 6. Monetary Survey, 2008–12 ____________________________________________________________________ 31 7. Millennium Development Goals, 1990–20091 _________________________________________________ 32 FIGURES 1. Recent Economic Developments, 2005–10 ______________________________________________________5 2. Impact of Oil Production on Fiscal Policy and Public Financial Management, 2005–10 _________6

CHAD 2011 ARTICLE IV REPORT
INTERNATIONAL MONETARY FUND 3
BOXES 1. Exchange Rate and External Competitiveness Assessment ______________________________________9 2. Revisions to National Accounts _______________________________________________________________ 11 3. Public Expenditure Review Update ____________________________________________________________ 12 4. Debt Sustainability ____________________________________________________________________________ 15 TEXT TABLES 1. Medium-Term Fiscal Framework. 2011–14 ____________________________________________________ 16 2. Financial Soundness Indicators, 2007–10 _____________________________________________________ 18

2011 ARTICLE IV REPORT CHAD
4 INTERNATIONAL MONETARY FUND
I. INTRODUCTION1. Chad’s internal security situation has improved, but the crisis in Libya poses risks. The United Nations peacekeeping mission for Chad and the Central African Republic (MINURCAT) completed its mandate on December 31, 2010. The February 2010 peace pact with Sudan is holding, and Chadian forces have defeated a remaining rebel group in the Central African Republic. More than 70,000 people fleeing violence in Libya have been repatriated to or via Chad, with the help of international agencies.
2. The political situation is relatively calm. President Déby (in office since 1990) was reelected on April 25, 2011. The president’s party and its allies won 133 of 188 seats in the National Assembly on February 13, 2011. Appointment of a new cabinet is expected after the presidential inauguration, slated for
August. However, the election results have not been universally accepted (opposition leaders boycotted the elections and alleged fraud) and local elections, originally scheduled for summer, have been postponed until October to allow for better preparation. Meanwhile, opposition members have formed a united front in the National Assembly.
3. The newly reelected president campaigned on a platform of renaissance, aiming to transform Chad into a middle-income economy diversified away from oil. To accelerate non-oil growth and stem the impact that dwindling oil reserves will have on income, exports, and fiscal revenues, the government has been pursuing an ambitious public investment program and foreign direct investment-led industrialization.
II. RECENT ECONOMIC DEVELOPMENTS AND OUTLOOK
A. The 2010 Recovery
4. With real GDP growth reaching 13 percent in 2010, Chad recovered strongly from the 2009 downturn. In a temporary reversal of a declining trend (oil reserves are expected to be largely exhausted by 2030), oil production increased in 2010, as high oil prices justified additional investment to bolster extraction rates. Most importantly, with favorable rains and government measures to provide agricultural inputs, as well as increased cultivated area, agricultural production nearly doubled and food and consumer prices declined. Nevertheless, despite the favorable conditions in the
international cotton market, cotton output (the main traditional export commodity) remained low, mainly owing to the dire financial condition of the cotton parastatal (Cotontchad), and the ensuing neglect of cotton cultivation.
5. The overall fiscal position improved in 2010, reflecting higher-than-projected oil prices and increased non-oil tax revenue. The overall fiscal deficit (excluding grants, commitments basis) shrank from 21 percent of non-oil GDP in 2009 to about 11 percent in

CHAD 2011 ARTICLE IV REPORT
INTERNATIONAL MONETARY FUND 5
Figure 1. Chad: Recent Economic Developments, 2005–10
Sources: Chadian authorities; and IMF staff estimates.
-12
-7
-2
3
8
13
18
2005 2006 2007 2008 2009 2010
In 2010, high oil prices encouraged extraction efforts and non-oil GDP rebounded strongly with record harvests...
Oil GDP growth
Non-oil GDP growth
Real GDP growth
-30
-20
-10
0
10
20
30
2005 2006 2007 2008 2009 2010 2011
...which drove down food prices, contributing to a drop in CPI.
Overall CPIFood price Non-food CPI
Jan 2005–Jan 2011
80
90
100
110
120
130
140
150
2005 2006 2007 2008 2009 2010 2011
As a result, REER depreciated slightly in 2010...
REER
NEER
Relative price index
Jan. 2002 = 100
Jan 2005–Jan 2011
-1
0
1
2
3
4
2005 2006 2007 2008 2009 2010
... and the external position stabilized.
Net foreign assetsCurrent account less FDI-financed importsTrade balance less FDI-financed imports
($ billions)
2011 ARTICLE IV REPORT CHAD
6 INTERNATIONAL MONETARY FUND
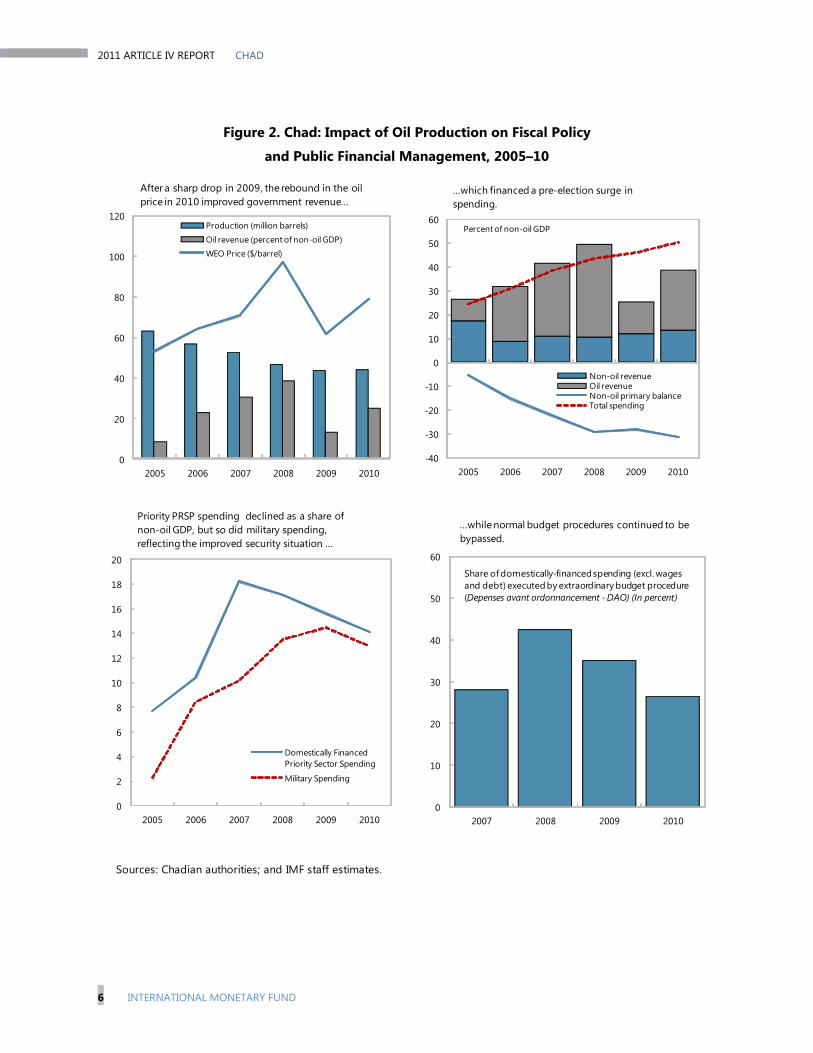
Figure 2. Chad: Impact of Oil Production on Fiscal Policy
and Public Financial Management, 2005–10
Sources: Chadian authorities; and IMF staff estimates.
0
20
40
60
80
100
120
2005 2006 2007 2008 2009 2010
After a sharp drop in 2009, the rebound in the oil price in 2010 improved government revenue...
Production (million barrels)
Oil revenue (percent of non-oil GDP)
WEO Price ($/barrel)
-40
-30
-20
-10
0
10
20
30
40
50
60
2005 2006 2007 2008 2009 2010
…which financed a pre-election surge in spending.
Non-oil revenueOil revenueNon-oil primary balanceTotal spending
Percent of non-oil GDP
0
2
4
6
8
10
12
14
16
18
20
2005 2006 2007 2008 2009 2010
Priority PRSP spending declined as a share of non-oil GDP, but so did military spending, reflecting the improved security situation ...
Domestically Financed Priority Sector Spending
Military Spending
0
10
20
30
40
50
60
2007 2008 2009 2010
Share of domestically-financed spending (excl. wages and debt) executed by extraordinary budget procedure (Depenses avant ordonnancement - DAO) (In percent)
...while normal budget procedures continued to be bypassed.

CHAD 2011 ARTICLE IV REPORT
INTERNATIONAL MONETARY FUND 7
Status of Selected 2010 Article IV Recommendations
Response to the food crisis
Staff called for a prompt response to the regional drought and consequent famine. The authorities took measures that led to a record crop harvest in 2010, and protected Chad from the subsequent international food price crisis.
Fiscal policy
Staff called for a supplementary budget with a lower NOPD target; the estimated 2010 outturn was 31 percent of non-oil GDP, 2.5 points above target.
Public financial management
The main PFM priorities were preserving oil-revenue transparency; further improving tax administration; aligning spending with the poverty reduction strategy; and improving public investment planning and procurement. The authorities managed to improve procurement performance and non-oil tax performance, but the oil refinery project’s revenue regime is opaque.
Improving the business climate and financial sector policy
Recommendations included improving the judicial system; deepening the financial sector and ensuring bank compliance with prudential guidelines; and reform of loss-making SOEs. The bank regulator’s central office functions were strengthened, and the new deposit guarantee fund began raising contributions. However, state-owned firms remain a drain on the treasury.
2010. However, the underlying fiscal stance, as measured by the non-oil primary deficit (NOPD), weakened from 28 percent to 31 percent of non-oil GDP, and the NOPD target established in the 2010 supplementary budget was overshot by 2½ percent of non-oil GDP, mainly on account of a pre-election surge in domestically-financed public investment.1
6. Despite some improvements, serious deficiencies in budget execution persisted. The share of spending executed with emergency procedures (dépenses avant ordonnancement—DAOs) was lower in 2010 than in 2009, but it still accounted for over one
quarter of domestically-financed spending (excluding wages and debt service)—9.3 percent of non-oil GDP—and DAOs equivalent to 4.3 percent of non-oil GDP awaited regularization at end-2010. On the positive side, the share of contracts awarded without competitive tender fell from 85 percent in 2009 to 49 percent in 2010.
7. The stock of public- and publicly-guaranteed debt rose from 30.5 percent of GDP at end-2009 to 32.6 percent of GDP (or 53.3 percent of non-oil GDP) at end-2010, mainly because of a nonconcessional loan from Libya, equivalent to 2.3 percent of non-oil GDP, which raised the stock of external debt to 25 percent of GDP at end-2010. On a net basis, the government repaid some domestic arrears, but continued to draw on the statutory advances from the
_______________________________________
1 The original 2010 NOPD target was overshot by more than 12 percent of non-oil GDP, mainly on account of spending overruns on exceptional security spending and public investment.

2011 ARTICLE IV REPORT CHAD
8 INTERNATIONAL MONETARY FUND
Bank of Central African States (BEAC) up to the limit allowed, raising this debt to 5.3 percent of GDP (or 8.1 percent of non-oil GDP) at end-2010.2 Nevertheless, the updated debt sustainability analysis shows that, in the Baseline scenario, Chad’s risk of debt distress remains moderate.
8. Notwithstanding the increased export earnings from oil, the external current account deficit widened to 35 percent of GDP because of the high
import content of investment spending (notably, in the oil sector). Official reserves increased but the reserve coverage of imports of goods and services (excluding oil-sector imports) weakened somewhat. Chad’s real effective exchange rate remained broadly in line with that of the CEMAC region (Box 1).
9. Broad money increased by 25 percent, in line with nominal GDP, while credit to the economy grew 19 percent, broadly in line with nominal non-oil GDP.
B. Recent Developments, Outlook, and Risks 10. Overall GDP growth is projected to moderate to about 3 percent in 2011. Oil production is expected to decline slightly, despite the contribution from the new, but relatively small field (Bongor), operated by the China National Petroleum Corporation (CNPC). In June, Bongor began producing 20,000 barrels per day (bpd) to feed the new oil refinery, which opened shortly thereafter.3 With agricultural output expected to revert to the underlying trend, non-oil GDP growth is projected to moderate to 3.6 percent.
11. In 2012, growth is expected to spike above 7 percent, reflecting the oil refinery’s first full year in operation and new industrial projects entering production, including a power station and a cement factory. Also, crude oil production is expected to spike in 2012, although output from the main oil field at Doba is expected to decline or, at best, remain at the current level of about
120,000 bpd, provided the international oil price remain high.
12. Consumer price inflation remained negative in the first quarter of 2011, but local media reported that some food prices rose in the second quarter, possibly owing to the seasonal depletion of food stocks. Overall, consumer price inflation (period average) is not expected to exceed 2 percent in 2011 and 3 percent in 2012.4 However, prices of intermediate goods (e.g., cement) and wages of skilled labor are reported to be rising, owing to demand pressures from public investment.
13. Budget execution improved in the first five months of 2011, compared to the same period in 2010 but, on current trend, the NOPD at end-year would exceed the budget target by about 6 percentage points
_______________________________________
2 Financing from commercial banks was unavailable as banks reached the limits of their exposure to the state as a single borrower, which raises financial stability concerns (Section V).
3 The government borrowed to finance its share of the joint venture refinery and guaranteed the Chinese partner. The exposure assumed by the government on this account equals 4.0 percent of 2010 GDP.
_______________________________________
4 Price policy regarding locally-produced petroleum products may help keep inflation low, but it will likely entail negative consequences for the budget. The ex-refinery price for all product categories was fixed at CFAF 200, yielding consumer prices of CFAF 230–375 per liter (depending on product category), compared with the prevailing consumer prices of these products of CFAF 730–775 per liter, or CFAF 500 for a liter of gasoline on the informal market.
CHAD 2011 ARTICLE IV REPORT
INTERNATIONAL MONETARY FUND 9
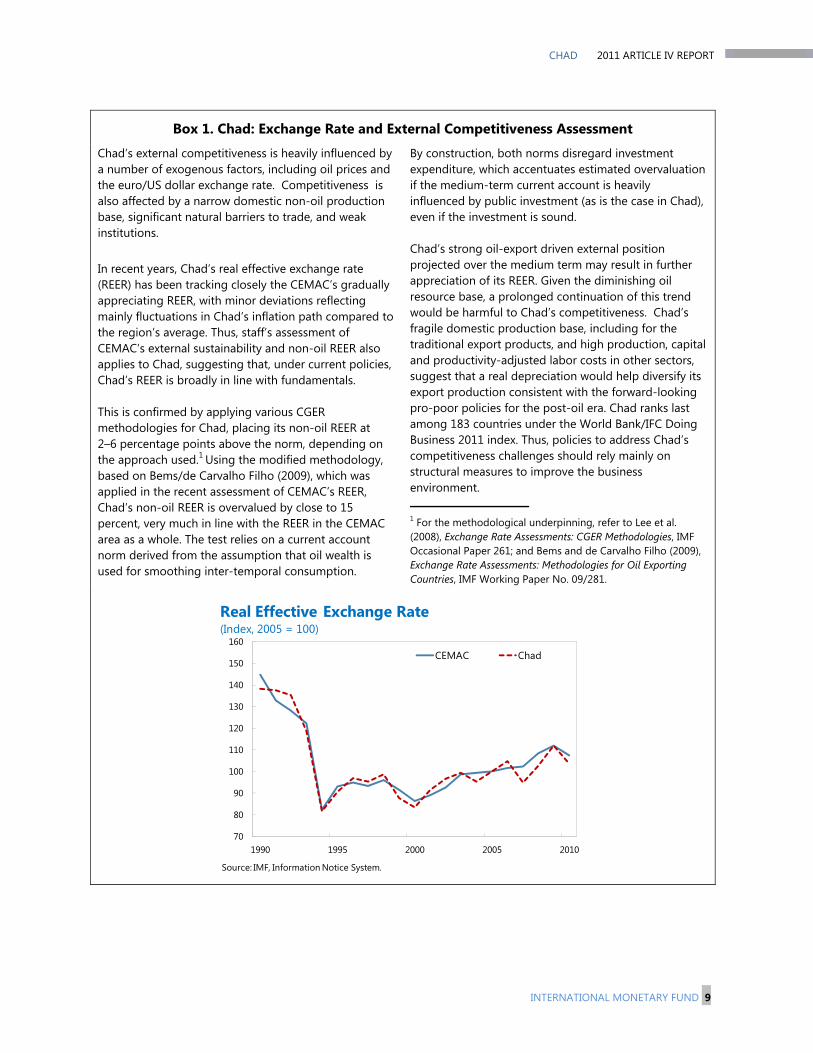
Box 1. Chad: Exchange Rate and External Competitiveness Assessment
Chad’s external competitiveness is heavily influenced by a number of exogenous factors, including oil prices and the euro/US dollar exchange rate. Competitiveness is also affected by a narrow domestic non-oil production base, significant natural barriers to trade, and weak institutions. In recent years, Chad’s real effective exchange rate (REER) has been tracking closely the CEMAC’s gradually appreciating REER, with minor deviations reflecting mainly fluctuations in Chad’s inflation path compared to the region’s average. Thus, staff’s assessment of CEMAC’s external sustainability and non-oil REER also applies to Chad, suggesting that, under current policies, Chad’s REER is broadly in line with fundamentals. This is confirmed by applying various CGER methodologies for Chad, placing its non-oil REER at 2–6 percentage points above the norm, depending on the approach used.1 Using the modified methodology, based on Bems/de Carvalho Filho (2009), which was applied in the recent assessment of CEMAC’s REER, Chad’s non-oil REER is overvalued by close to 15 percent, very much in line with the REER in the CEMAC area as a whole. The test relies on a current account norm derived from the assumption that oil wealth is used for smoothing inter-temporal consumption.
By construction, both norms disregard investment expenditure, which accentuates estimated overvaluation if the medium-term current account is heavily influenced by public investment (as is the case in Chad), even if the investment is sound. Chad’s strong oil-export driven external position projected over the medium term may result in further appreciation of its REER. Given the diminishing oil resource base, a prolonged continuation of this trend would be harmful to Chad’s competitiveness. Chad’s fragile domestic production base, including for the traditional export products, and high production, capital and productivity-adjusted labor costs in other sectors, suggest that a real depreciation would help diversify its export production consistent with the forward-looking pro-poor policies for the post-oil era. Chad ranks last among 183 countries under the World Bank/IFC Doing Business 2011 index. Thus, policies to address Chad’s competitiveness challenges should rely mainly on structural measures to improve the business environment.
1 For the methodological underpinning, refer to Lee et al. (2008), Exchange Rate Assessments: CGER Methodologies, IMF Occasional Paper 261; and Bems and de Carvalho Filho (2009), Exchange Rate Assessments: Methodologies for Oil Exporting Countries, IMF Working Paper No. 09/281.
70
80
90
100
110
120
130
140
150
160
1990 1995 2000 2005 2010
CEMAC Chad
Real Effective Exchange Rate(Index, 2005 = 100)
Source: IMF, Information Notice System.

2011 ARTICLE IV REPORT CHAD
10 INTERNATIONAL MONETARY FUND
of non-oil GDP. This is due equally to spending overruns, mainly on security, and a non-oil revenue shortfall (20 percent below expectations through May). In February, the government suspended commitments for recurrent purchases of goods and services until further notice, and suspended purchases of vehicles for investment projects until end-2012. These measures apparently did not cover extraordinary security spending, which by end-May had already reached 90 percent of budget authorization.5 Public investment spending has also kept pace, but priority social spending has not.
14. The authorities have taken some steps to improve the budget process, but PFM problems persist. The 2010 budget was closed at end-February (per the organic budget law) and a new macro-framework was prepared for the 2012 budget (Box 2). There was some reduction in the use of DAOs for
non-emergency spending, but extra-budgetary spending continued, notably under the conventions that allow their beneficiaries (e.g., the electricity company as a recipient of fuel subsidies, or some government suppliers) to receive payments, even absent a budget allocation. Despite high oil revenues, half of the end-2010 treasury float (5.5 percent of non-oil GDP) slipped into arrears.
15. Given the government’s underlying fiscal stance, a sharp decline in oil prices remains the main risk to the budget. Without a financial cushion in the form of government deposits, such a shock would imply a forced fiscal tightening, a significant investment slowdown, and increased domestic arrears, possibly including arrears to the central bank.6 In turn, government suppliers may be unable to service their debts, and banks’ nonperforming loans would rise.
III. RESTORING BUDGET DISCIPLINE Since the beginning of the oil era, Chad has pursued an expansionary and procyclical fiscal policy, straining the absorptive capacity of the economy and the public financial management (PFM) capacity of the administration (particularly procurement). Improving budget discipline will require measures to strengthen PFM, especially spending controls.
Background
16. The oil-fuelled fiscal expansion reflected mainly rapid growth in domestically-financed capital and certain primary current spending.7 Investment projects were launched without taking into
account the commitments associated with past or ongoing projects, while allocations
_______________________________________
5 It is unclear to what extent rapid execution of extraordinary security spending was a response to emergencies linked to the conflict in Libya and rebel activity in the Central African Republic.
_______________________________________
6 The government has already asked the BEAC to reschedule interest payments on statutory advances, payments that were overdue at end-2010. 7 Domestically-financed capital spending as a share of non-oil GDP has increased from 2.1 percent in 2003 to 12.6 percent in 2008–10. Likewise, primary current spending as a share of non-oil GDP rose from 10.3 percent in 2003 to 29.4 percent in 2008–10. In particular, the wage bill as a share of non-oil GDP increased from 5.4 percent in 2003 to 9 percent in 2008–10.

CHAD 2011 ARTICLE IV REPORT
INTERNATIONAL MONETARY FUND 11
Box 2. Chad: Revisions to National Accounts
The Chadian authorities have produced new estimates of GDP for 2005–10, consistent with the 1993 System of National Accounts. Compiled with the assistance of AFRISTAT and AFRITAC Centre, these estimates are based on the 2005 input-output structure of the economy and include the informal sector.
These technical improvements, coupled with recommended changes to the organization and staffing of the national statistical bureau (INSEED),
should enable Chad to produce more reliable and timely estimates of economic activity.
The ministry of finance and budget is already using the new GDP estimates for budget planning purposes. However, staff has recommended that the authorities continue to compile and publish 1995-based estimates, alongside the new series, for a period of time, until the new methodology is more widely adopted.
for, and execution of, recurrent spending on infrastructure maintenance, health, and education lagged (Box 3).
17. PFM concerns center on the weak link between annual budgets and the poverty reduction strategy, and the many departures from orthodox expenditure
management, including weak procurement practices and bypassing of normal payment authorization procedures.8 Also, non-oil
0
500
1,000
1,500
2,000
2,500
3,000
3,500
Base 1995 Base 2005
Nominal GDP by Sector, 2005(Billions of CFA francs)
Primary - Oil extraction1
Primary - Non-oil extraction
Secondary
Tertiary
Source: Chadian authorities.
1In Base 1995, this included oil-related construction, which is treated as part of Secondary in Base 2005.
_______________________________________
8 In 2007–10, about a third of domestically-financed spending (excluding wages and debt) were executed through procedures normally reserved for emergency spending.

2011 ARTICLE IV REPORT CHAD
12 INTERNATIONAL MONETARY FUND
Box 3. Chad: Public Expenditure Review Update
The 2011 World Bank report on Chad’s Public Expenditure Review (covering the period from 2004 to 2009) found that budget execution during that period did not reflect strategic priorities set in Chad’s Poverty Reduction Strategies (PRS).1 It also identified multiple weaknesses in public expenditure management that hampered delivery of public services in health and education and other areas critical for economic and social development. Poverty reduction objectives were broadly reflected in budgetary allocations. Priority sectors accounted on average for 62.4 percent of the total budget (excluding debt service and security) compared to the target of 62.2 percent implied by the PRS. However, within the PRS priority spending, education, health and social protection and rural development received on average only 72 percent of the shares of spending called for by the PRS. In contrast, budgeted shares for governance (including allocation for departments of justice, human rights, and decentralization, as well as the State Control Office, the Supreme Court, and Economic and Social Council) and infrastructure were respectively 26 percent higher and almost twice the implied PRS targets. Moreover, the executed amounts of priority spending were well below the budgeted amounts. The highest rate of execution was in spending on infrastructure (90 percent of budgetary allocations) and, to a lower extent, on rural development. Spending budgeted for health and education was crowded out by unbudgeted spending in other areas. Consequently, Chad performed poorly compared with other sub-Saharan African countries in terms of its allocation of public resources (measured in percent of GDP or in per capita dollar terms) to health and education.
Shortcomings in expenditure management have contributed to Chad’s failure in making serious dent into poverty reduction. Some improvements were made in budget preparation and macroeconomic forecasting, but a limited use of multi-year fiscal framework and the absence of a formal project management system created problems: there is no formal project preparation, adoption, programming, and budgeting framework. Also, a large share of expenditures being executed without prior authorization has a crowding out effect on priority spending. Key PER recommendations to improve the execution of the PRS priority spending include: (i) simplifying the ex-ante manual oversight of delegated appropriations for regions; (ii) stopping the practice of freezing ministries’ operating expenditures during preparation of budget amendments; (iii) accelerating the reorganization of the services involved in the expenditure chain; (iv) reducing the use of extraordinary spending procedures (DAOs); and (v) establishing specific procedures at the ministry of finance to guarantee that all expenditures are covered by budget appropriations prior to payment. 1 Chad’s First National Poverty Reduction Strategy (NPRS-I) was adopted in June 2003. Its implementation was undermined by persistent conflict, weak governance, and lack of ownership of economic and social reforms. A new strategy (NPRS-II)—covering the 2008–11 period—was adopted in April 2008. It focused on a narrower set of priorities than NPRS-I: creation of a business climate that is conducive to private sector growth, rural development programs, investments in human capital, and on strengthening governance.
revenue effort remains low. This lack of budget discipline has led to repeated budget overruns, cash flow difficulties, and domestic arrears.
Staff's Views
18. Staff encouraged the authorities to implement longstanding AFRITAC Centre and Fiscal Affairs Department recommendations, as well as those
contained in the recent World Bank public expenditure review and mid-term review of PARCAFIP.9 Staff highlighted a number of PFM measures that need to be taken urgently, including establishing a quarterly treasury plan; restricting DAOs to genuine emergency
_______________________________________
9 World Bank’s Project Support for Capacity Building in Public Finance.

CHAD 2011 ARTICLE IV REPORT
INTERNATIONAL MONETARY FUND 13
expenditure; eliminating payments to government suppliers in excess of budget allocations; and observing strictly the public procurement code. Beyond these immediate measures, a comprehensive PFM reform program should focus on harmonizing local practices with the recently revised CEMAC guidelines. Staff encouraged the authorities to establish a timetable and identify the technical assistance needed to align Chad’s PFM laws and practices with the new guidelines.
Authorities' Views
19. The authorities intend to break from the past lax PFM and budget execution, building on the steps taken to strengthen budget discipline in 2010 and 2011. They affirmed their intention to: (i) contain the NOPD overrun in 2011 to no more than the 2.5–3.0 percent of non-oil GDP accrued in the
first half of the year; and (ii) return in the second half of the year to the NOPD path implied by the 2011 budget as approved by parliament. This would ensure a NOPD reduction of about 8 percentage points of non-oil GDP compared with the 2010 outcome and, with projected 2011 oil revenue of $2 billion, an overall surplus of about 4 percent of non-oil GDP. The measures required to achieve this adjustment are yet to be stipulated in a supplementary budget law, which would need to be passed by the newly-elected parliament. In the second half of 2011, the authorities intend to execute all investment spending through the regular budget process and to adhere strictly to the procurement rules. They also intend to introduce in the 2012 budget a clear distinction between appropriations to pay for previous projects and commitment authorizations for new projects.
IV. MEDIUM-TERM FISCAL POLICY Chad needs a medium-term fiscal strategy that recognizes the challenges and risks of dependence on oil revenue. Its success will hinge on the government’s ability to keep the investment program within realistic proportions, while strengthening non-oil revenue effort and using a portion of oil revenue as a buffer against oil price volatility.
Background
20. In view of the expected steady decline of oil production, the current fiscal stance raises concerns about sustainability. With non-oil revenues at about 12 percent (one fourth less than the average of other oil exporting countries in sub-Saharan Africa), Chad does not have much to lean on when oil production ends. And some contemplated large public investment projects pose an additional risk.10 Also, Chad’s procyclical fiscal policy makes it very vulnerable to oil price shocks; this became particularly pronounced
during 2009 slump in the oil market, leading to a sharp deterioration in both the fiscal and the external positions. Further, spending structure has been biased toward investment spending (of the brick and mortar type) with insufficient provisions for equipment purchases (e.g., for the newly-built schools and medical centers), staffing, and operations and maintenance.
_______________________________________
10 In early 2011, the authorities signed letters of intent with Chinese enterprises for the construction of an airport ($1 billion) and railway ($7.5 billion); the combined total value of these projects exceeds Chad’s 2011 GDP.

2011 ARTICLE IV REPORT CHAD
14 INTERNATIONAL MONETARY FUND
Staff's Views
21. Staff emphasized the need to: utilize a multiyear budget framework, smooth expenditure over the medium term, and create a savings buffer against oil price shocks. Recognizing that the current oil price outlook offers room for a less sharp fiscal adjustment than recommended last year, staff suggested reducing the NOPD gradually, along a medium-term path about 6 percentage points of non-oil GDP higher than previously recommended.11
22. The additional fiscal space could be used for maintenance of infrastructure or for recurrent or capital spending (notably, on equipment) in the social sectors. Room to maneuver could be increased further by reducing subsidies to public enterprises and aligning investment spending with the absorption capacity of the economy and the need to sustain growth beyond the oil boom. In this context, staff cautioned against using the proceeds of the savings bond issue to fund new capital spending (paragraph 30). To cope with the risk inherent in depending on oil revenues, the authorities should save a part of oil revenue, identify contingencies within the investment program, and stand ready to delay
or suspend commitments to lower-priority new projects in the event of budget overruns or revenue shortfalls.
23. A prudent medium-term fiscal strategy is an asset/liability management challenge. Given the current outlook, the authorities would be able to repay statutory advances from the BEAC by 2014, as required, and during that time accumulate savings of about 12 percent of non-oil GDP. This would protect the treasury against a negative oil price shock comparable to that which occurred in 2009 and allow time for adjusting fiscal policy stance as needed. Staff thus advised the authorities to seek agreement with the BEAC on a strategy for asset/liability management to increase the expected yield from Chad’s financial investments, without compromising their safety. Staff also encouraged the authorities to continue to observe the CEMAC rules on the repatriation of foreign currency-denominated revenue, and to support the program to strengthen the BEAC safeguards.
24. Considering the government has already assumed significant liabilities and risks in the context of the joint venture oil refinery with CNPC, staff recommended that the authorities commission feasibility and economic impact studies of the contemplated major infrastructure projects (railroad and airport) and—should the projects be approved as sound—seek concessional funds for their financing. Even if deemed to be economically sound, because of their magnitude and associated debt sustainability implications, these projects should be integrated in the authorities’ medium-term expenditure outlook, rather than treated as additional to it (Box 4).
_______________________________________
11 The analysis in the 2010 Article IV report, based on the permanent income hypothesis (PIH), placed a sustainable NOPD within 1–5 percent of non-oil GDP, and staff recommended that this level of NOPD be reached by 2020, in step with the expected decline in oil revenues. The revised World Economic Outlook oil price baseline projections (Spring 2011 vintage) imply oil revenues during 2011–30 over 40 percent higher than projected last year. The current long-term scenario features an adjustment path that would allow the government to sustain an NOPD of about 5 percent of non-oil GDP beyond 2030. Staff also recognizes that, without undermining Chad’s public debt sustainability, more borrowing from the domestic and regional market would be needed in the long term to sustain the development of the non-oil economy.
CHAD 2011 ARTICLE IV REPORT
INTERNATIONAL MONETARY FUND 15
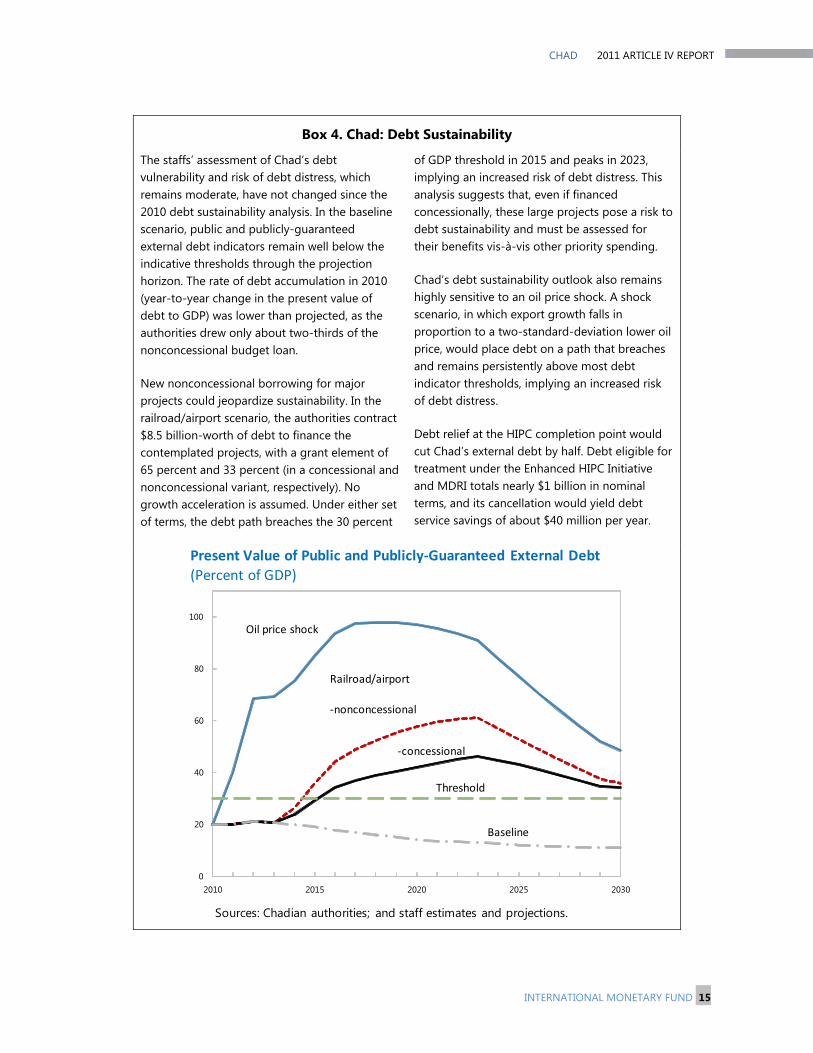
Box 4. Chad: Debt Sustainability
The staffs’ assessment of Chad’s debt vulnerability and risk of debt distress, which remains moderate, have not changed since the 2010 debt sustainability analysis. In the baseline scenario, public and publicly-guaranteed external debt indicators remain well below the indicative thresholds through the projection horizon. The rate of debt accumulation in 2010 (year-to-year change in the present value of debt to GDP) was lower than projected, as the authorities drew only about two-thirds of the nonconcessional budget loan.
New nonconcessional borrowing for major projects could jeopardize sustainability. In the railroad/airport scenario, the authorities contract $8.5 billion-worth of debt to finance the contemplated projects, with a grant element of 65 percent and 33 percent (in a concessional and nonconcessional variant, respectively). No growth acceleration is assumed. Under either set of terms, the debt path breaches the 30 percent
of GDP threshold in 2015 and peaks in 2023, implying an increased risk of debt distress. This analysis suggests that, even if financed concessionally, these large projects pose a risk to debt sustainability and must be assessed for their benefits vis-à-vis other priority spending.
Chad’s debt sustainability outlook also remains highly sensitive to an oil price shock. A shock scenario, in which export growth falls in proportion to a two-standard-deviation lower oil price, would place debt on a path that breaches and remains persistently above most debt indicator thresholds, implying an increased risk of debt distress.
Debt relief at the HIPC completion point would cut Chad’s external debt by half. Debt eligible for treatment under the Enhanced HIPC Initiative and MDRI totals nearly $1 billion in nominal terms, and its cancellation would yield debt service savings of about $40 million per year.
0
20
40
60
80
100
2010 2015 2020 2025 2030
Oil price shock
Railroad/airport
-nonconcessional
-concessional
Threshold
Baseline
Present Value of Public and Publicly-Guaranteed External Debt
(Percent of GDP)
Sources: Chadian authorities; and staff estimates and projections.

2011 ARTICLE IV REPORT CHAD
16 INTERNATIONAL MONETARY FUND
Authorities' Views
25. The authorities agreed with staff that a sharp decline in oil revenues is the main risk, and their draft medium-term fiscal framework (through 2014) features a similar degree of fiscal adjustment as the scenario produced by staff (Text Table 1).
The authorities’ medium-term scenario calls for an adjustment toward a sustainable NOPD; however, the authorities assume a significantly better projected end-2011 fiscal position (in NOPD) which enables a higher level of domestically-financed investment over the medium-term horizon. The authorities also share staff’s concerns about limited absorptive
Text Table 1. Chad: Medium-Term Fiscal Framework, 2011–14
2011 2012 2013 2014 2011–141
Authorities' medium-term fiscal framework
Revenue 34.4 45.9 36.5 35.6 1.2
Oil 2 21.0 31.4 20.8 19.4 -1.5Non-oil 13.4 14.5 15.7 16.1 2.7
Of which : Interest income … … … … … Expenditures 39.4 36.3 35.2 33.8 -5.6
Current 22.2 19.3 18.6 18.0 -4.3 Of which : Interest 0.7 0.7 0.5 0.5 -0.2
Exceptional security 2.4 1.0 0.6 0.0 -2.4Investment 17.2 17.0 16.6 15.9 -1.3
Domestically-financed 12.6 12.8 12.5 11.9 -0.7Foreign-financed 4.5 4.2 4.1 3.9 -0.6
Non-oil primary balance (excl. grants; commitment basis) -20.8 -16.9 -14.9 -13.3 7.5Overall balance (excl. grants; commitment basis) -5.0 9.6 1.3 1.7 6.7Overall balance (excl. grants; cash basis) -7.2 6.5 0.8 1.7 8.9
IMF staff medium-term fiscal scenario
Revenue 44.0 38.0 34.1 33.1 -10.8Oil 33.4 26.3 21.9 20.7 -12.7Non-oil 10.6 11.7 12.2 12.5 1.9
Of which : Interest income 0.0 0.4 0.5 0.5 0.5 Expenditures 42.1 36.1 35.7 34.1 -8.0
Current 25.0 20.1 20.2 19.1 -5.9 Of which : Interest 0.8 0.6 0.6 0.6 -0.2
Exceptional security 5.3 1.6 1.0 0.6 -4.7Investment 17.2 16.0 15.5 15.0 -2.2
Domestically-financed 12.6 11.0 10.5 10.0 -2.6Foreign-financed 4.5 5.0 5.0 5.0 0.5
Non-oil primary balance (excl. grants; commitment basis) -26.2 -19.2 -18.4 -16.6 9.6Overall balance (excl. grants; commitment basis) 1.8 1.9 -1.6 -1.0 -2.8Overall balance (excl. grants; cash basis) 3.9 0.7 -1.3 -1.0 -4.9
Memorandum item:
Deposits in banks (mostly BEAC)3 8.6 11.3 11.7 12.0 3.4Nominal non-oil GDP (in billions of CFAF) 2,912 3,128 3,357 3,604 …
Sources: Chadian authorities; and IMF staff estimates and projections.
1 Cumulative change.2 In 2012, the authorities expect a payment of royalties from CNPC.3 Staff scenario.
(In percent of non-oil GDP; unless otherwise indicated)

CHAD 2011 ARTICLE IV REPORT
INTERNATIONAL MONETARY FUND 17
capacity. Their scenario is predicated on a leveling-off of public investment and better procurement and project control, both of which are intended to address the pressures on absorptive capacity. The authorities also see the continued improvement in security as critical to providing fiscal space for public investment and other development spending.
26. The authorities expect that ongoing tax and customs administration reforms will strengthen non-oil revenues. Notably, the new customs data and payments processing system (SYDONIA) has already begun to improve customs revenue. They also hope that some progress can be made in eliminating arbitrary tax exemptions, which reduced non-oil tax revenue collection in early 2011.
V. THE FINANCIAL SECTOR AND THE BUSINESS ENVIRONMENT
Chad’s financial system is underdeveloped and heavily exposed to the government, while local entrepreneurs remain credit-constrained and face a generally inhospitable business environment. Business-friendly tax reforms and other policy reforms could have a high yield in regard to non-oil growth.
Background
27. Compared to other low-income sub-Saharan African countries, monetization and credit to the private sector are low in Chad. The financial sector is underdeveloped, with eight commercial banks, two insurance companies, and two pension funds. Interbank transactions are minimal and there is no established liquid market for government debt. The banks were not directly affected by the global financial crisis, but are heavily exposed to the government and therefore highly vulnerable to oil price volatility. Foreign-owned private banks are well-capitalized, but domestic banks, all with significant government ownership, are not. The predominantly state-owned banks have insufficient capital, which weighs heavily on the capital adequacy indicator for the banking sector as a whole (Text Table 2).
28. Chad ranks low on international measures of the quality of the business environment.12 Impediments to private-sector investment and trade include weak enforcement of property rights, judicial ineffectiveness, costly and unreliable electrical and telecommunications services, a lack of skilled workers, administrative and financial barriers to formally establishing a business, and the government’s persistent arrears to suppliers. The tax system is needlessly burdensome to formal businesses, with a high marginal corporate income tax rate and a multitude of nuisance taxes and fees that drive up compliance costs.
_______________________________________
12 Chad is ranked last (183rd) in 2010 and 2011 on the IFC’s Doing Business Index and on the World Economic Forum’s 2010–11 Global Competitiveness Index. It is near the bottom of Transparency International’s Corruption Perception 2010 Index (171th out of 178).

2011 ARTICLE IV REPORT CHAD
18 INTERNATIONAL MONETARY FUND
2007 2008 2009 2010
Capital adequacy
Regulatory capital/Risk-weighted assets 11.1 13.3 12.1 6.7
Asset quality
Gross nonperforming loans/Gross banking loans 11.2 8.0 10.4 12.1
Provisions/Nonperforming loans 84.4 70.2 64.6 73.5
Net nonperforming loans/Gross banking loans 1.7 2.4 3.7 3.2
Profitability2
Return on assets 2.7 3.9 1.3 3.7
Return on equity 26.3 36.4 11.4 39.4
Liquidity
Liquid assets/Total assets 28.3 23.9 19.9 24.5
Liquid assets/Demand deposits 66.3 82.4 85.2 73.8
Banks' ratings (number of banks rated)
Solid or Good 6 4 4 3
Fragile 0 1 1 1
Critical 0 1 1 2
Not rated 1 1 2 2
Total 7 7 8 8
Sources: BEAC/COBAC.
2 Before taxes.
1 Based on revised and updated bank balance sheets and regulatory statements submitted to the 2011 FSAP mission.
(Ratios in percent; unless otherwise indicated)
Text Table 2. Chad: Financial Soundness Indicators, 2007–101
Staff's Views13
29. Regarding bank stability, staff recommended that the authorities seek new private capital for predominantly state-owned banks; work with the other CEMAC members to reinforce the regional regulator’s (COBAC) legal framework, and national offices’ powers, to intervene in troubled banks; and align the single exposure limits with international standards.14 At the same time, staff suggested that Chadian banks strengthen their own risk management to monitor portfolio concentration. The banks’ largest individual
exposures are well above the regional limit that in turn, at 45 percent of capital, is higher than international best practice suggests.
_______________________________________
13 Staff’s views and recommendations regarding financial sector issues draw on the observations made by the overlapping joint Bank/IMF FSAP mission.
14 Over the current year, Chad will occupy the chair of key CEMAC councils, and the staff suggested that the authorities take this opportunity to accelerate the strengthening of the key regional institutions, the central bank (BEAC), and the prudential regulator (COBAC).

CHAD 2011 ARTICLE IV REPORT
INTERNATIONAL MONETARY FUND 19
30. To promote financial sector development, staff encouraged the authorities to take the lead in issuing government debt instruments on the regional government securities market. Encouraged by Cameroon’s example, in July, the authorities completed a sale of over CFAF 100 billion of five-year bonds with a 6 percent coupon. Sixty-three percent of the issue was purchased by Chadian residents. Two-thirds of the issue was purchased by banks, local and regional. Nevertheless, staff thinks that a predictable, regular issue of short-term paper would be more efficient than occasional placements of long-term savings bonds. Given government spending commitments and the marked quarterly pattern of oil revenue inflows, good treasury management requires a short-term financing facility, to meet monthly payment pressures and avoid running domestic arrears. It would also have advantages from debt-management and financial sector development perspective.
31. Regarding the broader business environment, staff highlighted tax and regulatory measures that could be implemented quickly, based on technical assistance already received. Recommended tax measures include (i) reducing the corporate income tax rate from 40 percent to 35 percent; (ii) eliminating various special and administrative levies, especially those collected by ministries and other administrations; and (iii) eliminating, or at least reducing the minimum corporate tax from 1.5 percent to 1 percent. Recommended regulatory measures include (i) removing needless administrative
barriers to formal incorporation; (ii) establishing a one stop shop for business services; and (iii) maintaining a forum for ongoing, regular business-government dialogue.
Authorities' Views
32. The authorities welcomed the in-depth attention of the Financial Sector Assessment Program (FSAP) team to Chad’s financial sector. In their preliminary reactions, the authorities expressed skepticism about the effectiveness of market signals and the private sector’s ability to provide funding for businesses and households in a low-income environment. The authorities continue to favor special-purpose financial institutions and to insist on a role for government as a bank shareholder. However, they took note of the call to work with other CEMAC members to strengthen the capacity and independence of the regional regulator.
33. Regarding the proposed tax measures, the authorities agreed with the thrust of staff’s suggestions. They pointed out that (i) a reduction, along with its harmonization at the CEMAC level, of the corporate income tax is of the utmost urgency; (ii) the elimination of special and administrative levies will be considered in the very short term at the government level; and (iii) a reduction of the minimum corporate income tax will be considered in the medium term, mainly for revenue reasons.

2011 ARTICLE IV REPORT CHAD
20 INTERNATIONAL MONETARY FUND
VI. RESUMING THE PATH TOWARD DEBT RELIEF The authorities are eager to take advantage of the government’s renewed political mandate to re-engage in program discussions with the IMF and World Bank to achieve the HIPC completion point as quickly as possible.
Background
34. Chad reached the Decision Point under the Enhanced HIPC Initiative in May 2001, but has been unable to complete a review under an IMF financial arrangement since 2004. A PRGF-supported program (2005) and a staff-monitored program (SMP) (2009) went off track rapidly because of fiscal slippages. Discussions on a possible SMP for 2010 were fruitless. At the conclusion of last year’s Article IV consultation, directors noted that improved fiscal policy and PFM would pave the way for an agreement on an SMP.
35. The authorities have sought an agreement with IMF and World Bank staff on policies that could be supported by an SMP, which could pave the way to a successor program under the Extended Credit Facility (ECF), and to HIPC debt relief. They also plan to hold an economic policy forum in late 2011, involving a broad range of stakeholders, to consider ideas that could contribute to an updated growth and poverty reduction strategy.
Staff's Views
36. Staff is working with the Chadian authorities to put in place policies necessary for macroeconomic stability and economic growth and that could be supported under
an SMP. The agreed steps toward an SMP include (i) adopting a supplementary budget to regularize the extra-budgetary spending incurred in the first half of 2011; (ii) returning to the quarterly NOPD path implied by the original 2011 budget law for the rest of the year, while ensuring effective spending allocations for social sectors (health and education); and (iii) avoiding emergency payment procedures (DAO) for spending that lacks prior budgetary appropriation or that does not constitute a bona fide emergency.15
Authorities’ Views
37. The authorities suggested that the HIPC scenario should be accelerated, recognizing Chad’s special post-conflict circumstances and the progress in economic policy since peace was restored. The authorities also see the benefits of a closer collaboration with IMF and World Bank staffs in designing their long-term growth strategy and framing appropriately the intended foreign-financed large infrastructure projects.
_______________________________________
15 Staff also pointed out that timely provision of complete monthly fiscal accounts and a reconciliation of the treasury net credit to the government data with the monetary survey would be required to monitor an SMP.

CHAD 2011 ARTICLE IV REPORT
INTERNATIONAL MONETARY FUND 21
VII. STAFF APPRAISAL 38. Higher oil prices have relaxed financing constraints in the short term, offering additional fiscal space for growth-enhancing and poverty-reducing spending. Continued investment in the oil sector and an impressive recovery in agriculture (shielding Chad from international food price pressure) yielded strong growth in 2010.
39. New industrial projects in oil refining, electrical generation, and cement production will contribute to stronger growth over the medium term and also help reduce the cost of public and private investment. However, these new (largely state-owned) enterprises should be operated on a sound financial basis and not rely on government financial support.
40. To sustain growth and make efficient use of its resources, Chad should rationalize its fiscal policy and improve budget execution. Building on the steps that have already been taken to improve budget preparation, strengthen procurement procedures, and reduce extra-budgetary spending, the authorities should take strong measures to improve public financial management and address the leakage of non-oil revenues, especially at customs. It is also important that the authorities follow through on plans to clear domestic arrears and continue to service domestic debt.
41. Staff commends the authorities for developing a systematic approach to medium-term fiscal programming. However, within the medium-term framework, greater focus is needed on building a savings cushion against oil price shocks, smoothing
expenditure (in particular, investment spending) to ensure sustainability, and providing adequately for recurrent social spending (e.g., on staffing, equipping, and maintaining medical centers and schools).
42. Rethinking public investment policy is needed to ensure macroeconomic stability and sustain growth. The investment program needs to be calibrated to reduce the pressure on wages, prices, and the external position. This would also help avoid pressure to resort to nonconcessional borrowing, which could undermine debt sustainability, reduces Chad’s access to concessional resources, and perhaps delay Chad’s achieving the HIPC Completion Point. To avoid potential abrupt stops in the execution of the public investment program, a portion of investment outlays should be made contingent on the realization of optimistic oil or non-oil revenue forecasts.
43. The private sector should be able to operate more freely, to be in a position to contribute to growth, economic diversification, and job creation. The establishment of a one stop shop for investors is a priority. Regulatory actions to improve the business environment should be supplemented by tax policy measures to strengthen incentives for private investment and foster compliance.
44. Policy actions are needed to enable Chad to take advantage of favorable international market conditions for cotton exports. To that end, an in-depth restructuring of Cotontchad is essential, along with greater participation of the private sector

2011 ARTICLE IV REPORT CHAD
22 INTERNATIONAL MONETARY FUND
in the cotton industry for it to become a source of growth, rural development, and poverty reduction.
45. Chad could show leadership in the development of the regional money market by regularly issuing short-term treasury bills as soon as it is technically feasible. This would improve government liquidity management and reduce payment delays, and would also contribute to financial sector development by sending, CEMAC-wide, a clear market signal of a point on the yield curve. Government involvement in ownership and management of banks is excessive, and the provision of capital by new private partners would be beneficial.
46. Staff is responding to the authorities’ renewed interest in an SMP, which could pave the way to an ensuing program under the ECF and to the HIPC Completion Point. This new start must be well prepared to ensure success of the program. The staff thus welcomed the proposed economic policy conference and plans to participate, alongside other international development partners, to help articulate policies that could be supported by an SMP and a subsequent ECF arrangement.
47. Staff recommends that the next Article IV consultation with Chad be held on the regular 12-month consultation cycle, in accordance with the decision on Article IV consultation cycles.

CHAD 2011 ARTICLE IV REPORT
INTERNATIONAL MONETARY FUND 23
Table 1. Chad: Selected Economic and Financial Indicators, 2009–161
2009 2012 2013 2014 2015 2016
Est. Proj.1 Est. Proj.1 Rev. Proj.
Real economyGDP at constant prices -1.2 4.3 13.0 3.9 3.1 7.4 3.2 3.2 3.3 3.5
Oil GDP -5.1 2.1 6.4 -2.2 -1.8 10.4 -4.9 -4.4 -4.5 -3.9Non-oil GDP 0.1 4.9 16.8 5.5 3.6 6.0 5.3 5.0 5.0 5.0
Consumer price index (period average) -2.1 6.0 -2.1 3.0 2.0 5.0 3.0 3.0 3.0 3.0
Oil pricesWEO (US$/barrel) 61.8 78.3 79.0 82.5 106.3 105.3 101.8 99.5 98.8 98.5
Chadian price (US$/barrel)2 55.5 68.3 73.6 72.5 99.8 98.8 95.3 93.0 92.3 92.0Oil production (in millions of barrels) 43.6 44.0 44.7 43.0 44.2 46.8 44.4 42.2 40.1 38.1Exchange rate CFAF per US$ (period average) 471.0 … 494.4 … … … … … … …
Money and credit3
Net foreign assets -71.1 -0.7 13.6 14.4 42.1 25.1 … … … …Net domestic assets 67.1 20.7 11.8 -5.2 -29.4 -16.0 … … … …
Of which : net claims on central government 68.3 16.1 5.0 -8.3 -33.1 -19.6 … … … …Of which : credit to private sector 5.3 4.6 8.4 3.6 3.7 3.6 … … … …
Broad money -4.0 20.0 25.4 9.2 12.7 9.1 … … … …Income velocity (non-oil GDP/broad money) 4.5 4.1 4.3 4.1 4.3 4.3 … … … …
External sector (valued in CFA francs)Exports of goods and services, f.o.b. -27.5 21.2 37.2 3.4 29.0 -3.6 -4.6 -3.1 -1.8 -1.3Imports of goods and services, f.o.b. 20.5 14.1 46.3 -5.6 -13.9 -27.3 -3.3 -0.1 -3.3 -3.4Export volume -7.9 -8.3 -4.9 -3.3 1.0 -3.4 -3.7 -3.6 -3.6 -3.5Import volume 27.5 16.8 49.9 -17.0 -10.2 -21.7 -7.8 -4.0 -5.5 -5.4Terms of trade -44.9 24.9 41.6 4.0 24.0 0.2 -1.5 0.0 1.5 1.9Current account, including official transfers (in percent of GDP) -18.3 -33.1 -34.6 -26.1 -23.9 -16.9 -11.7 -11.0 -10.1 -9.7Overall balance of payments (in percent of GDP) -10.6 0.5 0.8 2.4 5.5 3.6 0.8 0.3 0.3 0.0External debt (in percent of GDP) 23.0 27.4 25.0 27.8 23.8 23.8 23.2 22.2 21.3 20.2NPV of external debt (in percent of exports of goods and services) 39.7 52.3 43.9 57.1 38.4 41.7 51.3 54.6 57.1 58.5
Government financeRevenue 25.2 37.2 38.7 34.7 44.0 38.0 34.1 33.1 30.6 28.6
Of which : non-oil 12.0 12.0 12.5 12.9 10.6 11.7 12.2 12.5 12.7 13.1Expenditure 46.1 49.7 49.9 36.3 42.1 36.1 35.7 34.1 32.8 32.4
Current 29.7 33.5 29.6 22.6 25.0 20.1 20.2 19.1 18.3 17.9Capital 16.5 16.2 20.2 13.8 17.2 16.0 15.5 15.0 14.5 14.5
Non-oil primary balance (commitment basis, excl. grants)4 -28.1 -31.8 -31.2 -17.7 -26.2 -19.2 -18.4 -16.6 -15.1 -14.3Overall fiscal balance (cash basis, excl. grants) -20.8 -10.6 -9.3 -1.0 3.9 0.7 -1.3 -1.0 -2.1 -3.5
Total debt (in percent of GDP) 5 30.5 34.2 32.6 32.4 29.5 27.9 27.8 25.8 24.5 24.6Of which : domestic debt 7.5 6.8 7.6 4.6 5.7 4.1 4.6 3.5 3.1 4.4
Investment and savingInvestment 36.9 36.8 37.9 34.7 28.9 19.7 18.9 18.0 18.0 18.2
Government 8.8 10.2 12.3 8.8 11.2 11.0 11.1 11.1 11.0 11.3Private sector 28.1 25.6 25.6 24.9 17.8 8.7 7.8 6.9 7.1 7.0
Of which : oil sector 11.4 24.0 21.2 17.1 13.0 3.7 2.6 1.5 1.5 1.3
Saving 18.6 3.7 3.3 8.6 5.1 2.8 7.3 7.0 7.9 8.5Government 0.6 3.9 7.2 9.4 14.2 14.7 12.5 12.9 12.0 11.1Private sector 18.0 -0.2 -3.9 -0.8 -9.1 -11.9 -5.2 -5.9 -4.0 -2.6
Memorandum items:
Nominal GDP (in billions of CFA francs) 3,344 3,758 4,230 4,032 4,476 4,537 4,689 4,890 5,119 5,369Of which: non-oil GDP 2,138 2,369 2,584 2,587 2,912 3,128 3,357 3,604 3,875 4,171
Sources: Chadian authorities; and IMF staff estimates and projections.
1 IMF Country Report No. 10/196; Chad--Staff Report for the 2010 Article IV Consultation.2 Chadian oil price is WEO price minus quality discount.3 Changes as a percent of broad money stock at beginning of period.4 Defined as the total revenue excluding grants and oil revenue, minus total expenditure excluding net interest payments and foreign-financed investment.5 Central government.
Projections
2011
(In percent of GDP)
(In percent of non-oil GDP, unless otherwise indicated)
2010
(Annual percentage change, unless otherwise indicated)

2011 ARTICLE IV REPORT CHAD
24 INTERNATIONAL MONETARY FUND
Table 2. Chad: GDP by Sector, 2009–16 (Annual percentage change, unless otherwise indicated)
2009 2012 2013 2014 2015 2016
Weight1 Est. Proj.2 Est. Proj.2Rev. Proj.
Primary sector 41.2 -6.0 5.3 19.7 2.0 -4.8 4.8 -0.3 -0.1 0.2 0.5Agriculture 8.5 -11.5 18.7 85.0 9.0 -15.4 5.1 4.8 4.7 4.7 4.9
Food crops 8.2 -8.3 18.0 85.3 8.3 -16.3 5.0 4.8 4.7 4.7 5.0Industrial crops 0.4 -51.2 31.8 78.0 20.6 7.3 7.4 5.1 4.7 4.7 3.0
Livestock 9.0 -1.8 2.8 1.5 2.8 2.5 2.3 2.9 3.2 3.2 3Fishing and forestry 2.0 5.8 4.4 7.0 4.4 2.5 2.3 2.9 3.2 3.2 3.2Oil production 21.6 -6.3 0.8 2.7 -2.2 -1.1 5.8 -5.1 -5.0 -5.0 -4.9
Secondary sector 10.7 1.4 -0.3 4.6 6.1 25.1 20.3 8.5 6.1 5.3 5.5
Manufacturing3 2.3 -9.7 -27.5 -10.5 19.5 20.0 33.0 16.8 12.0 8.0 8.0Of which : cotton processing 0.8 -33.8 -59.0 -49.6 35.0 60.9 27.3 25.0 12.0 12.0 12.0
Handicrafts 4.7 5.0 3.5 5.3 3.5 10.8 7.2 3.8 4.3 4.3 4.3
Electricity and water4 0.8 8.7 6.0 14.5 8.0 14.4 38.5 40.5 9.3 9.3 7.3Construction and public works 2.9 3.4 8.0 12.4 4.5 -2.1 1.0 5.0 6.0 6.0 5.5
Of which : oil construction 1.1 18.2 25.5 76.9 -1.3 -45.8 -73.4 -38.9 3.2 -12.8 51.0
Tertiary sector 44.4 2.8 4.6 8.8 5.0 7.0 5.2 4.5 4.9 5.1 5.1Commerce, transport, and telecommunication 20.8 -0.6 4.4 16.6 6.6 6.9 5.0 6.1 6.1 6.1 6.2
Commerce 18.2 -0.5 4.1 17.7 6.5 4.9 4.5 5.8 5.8 5.8 5.8Transport and telecommunication 2.6 -1.6 6.0 8.9 7.5 21.5 8.0 8.0 8.0 8.0 8.0
General government 15.5 11.7 5.7 0.2 3.0 5.5 5.2 1.3 3.0 3.0 3.0Other 8.1 -3.3 3.6 5.7 3.6 10.4 6.0 5.7 4.7 5.7 5.7
Non-oil GDP (excluding oil production and investment) 77.3 0.1 4.9 16.8 5.5 3.6 6.0 5.3 5.0 5.0 5.0Oil sector GDP (including investment in oil sector) 22.7 -5.1 2.1 6.4 -2.2 -1.8 10.4 -4.9 -4.4 -4.5 -3.9Total GDP 100.0 -1.2 4.3 13.0 3.9 3.1 7.4 3.2 3.2 3.3 3.5
Sources: Chadian authorities; and IMF staff estimates and projections.
1 Share of 2009 GDP.2 IMF Country Report No. 10/196; Chad--Staff Report for the 2010 Article IV Consultation.3 Manufacturing includes a new oil refinery starting production in 2011. 4 Electricity and water include a new power plant starting operation in 2012.
2010 2011
Projections

CHAD 2011 ARTICLE IV REPORT
INTERNATIONAL MONETARY FUND 25
Table 3. Chad: Fiscal Operations of the Central Government, 2009–16 (In billions of CFA francs, unless otherwise indicated)
2009 2012 2013 2014 2015 2016
Est. Proj.1 Est. Budget Proj.
Revenue 540 882 1,000 1,001 1,280 1,189 1,145 1,194 1,187 1,194
Oil 284 599 676 611 973 823 735 745 695 648Non-oil 256 283 324 391 308 366 409 449 492 546
Tax 239 269 313 371 288 336 371 407 445 494Non-tax 16 15 11 20 19 30 38 42 47 51
Expenditure 987 1,176 1,289 1,147 1,227 1,129 1,197 1,229 1,270 1,350Current 634 793 766 648 727 628 677 688 708 745
Wages and salaries 201 212 216 260 263 299 326 347 370 395Goods and services 110 95 111 109 79 153 179 187 195 211Transfers and subsidies 302 467 411 259 362 156 151 133 122 116Interest 21 19 29 20 23 19 21 21 20 22
Domestic 5 8 14 10 13 9 10 9 8 9External 16 11 16 10 10 10 11 12 12 13
Investment 353 384 522 499 500 500 520 541 562 605Domestically financed 242 264 392 368 368 344 352 360 368 396Foreign financed 111 120 130 132 132 156 168 180 194 209
Non-oil primary balance (excl. grants, commitment)2 -601 -754 -805 -604 -764 -600 -617 -599 -586 -597
Overall balance (excl. grants, commitment) -447 -294 -288 -146 54 60 -52 -35 -83 -156
Payment of arrears 3 -83 -110 -159 0 -142 -202 -163 -171 -170 -171
Float 4 85 154 142 19 202 163 171 170 171 181Errors and omissions 2 … 64 … … … … … … …
Overall balance (excl. grants, cash) -444 -251 -241 -127 113 22 -45 -35 -82 -146
Financing 444 251 241 127 -113 -22 45 35 82 146Domestic financing 327 24 60 28 -212 -146 -66 -85 -51 0
Bank financing 328 77 50 15 -198 -132 -52 -70 -58 -41Central Bank (BEAC) 327 76 49 23 -190 -148 -81 -83 -80 -77
Deposits ("+" = drawdown) 211 57 -23 69 -145 -105 -38 -41 -39 -77Advances (net) 120 25 76 -42 -42 -42 -42 -42 -42 0IMF (reimbursement) -4 -5 -4 -4 -4 -2 -1 -1 0 0
Commercial banks 0 0 0 -8 -7 16 29 13 23 36Non-bank financing (net) -1 -73 0 -14 -14 -14 -14 -15 7 42Privatization 1 20 10 27 0 0 0 0 0 0
Foreign financing 117 227 181 98 98 124 111 120 133 146Grants 115 87 69 80 80 108 116 125 134 144
Budget support 35 0 0 0 0 0 0 0 0 0Project 80 87 69 80 80 108 116 125 134 144
Loans (net) 1 139 112 18 18 16 -5 -5 -1 2Disbursements 30 174 157 51 51 48 52 55 60 64Amortization -29 -35 -45 -33 -33 -32 -56 -60 -61 -63
Memorandum items: Non-oil GDP 2,138 2,369 2,584 2,913 2,912 3,128 3,357 3,604 3,875 4,171Deposits in banks (mostly BEAC) 82 24 105 36 250 354 392 433 471 549BEAC statutory advances 142 166 209 166 166 125 83 42 0 0
Sources: Chadian authorities; and IMF staff estimates and projections.
1 IMF Country Report No. 10/196; Chad--Staff Report for the 2010 Article IV Consultation.2 Defined as the total revenue excluding grants and oil revenue, minus total expenditure excluding net interest payments and foreign-financed investment.3 Prior to 2011, this reflects clearance of arrears from previous periods. From 2011 onwards, this assumes that float from previous year is cleared.4 Difference between committed and paid expenditure.
Projections
20112010

2011 ARTICLE IV REPORT CHAD
26 INTERNATIONAL MONETARY FUND
Table 3a. Chad: Statement of Operations of the Central Government, 2009–161
(In billions of CFA francs, unless otherwise indicated)
2009 2012 2013 2014 2015 2016
Est. Proj. Est. Budget Proj.
Revenue 655 970 1,069 1,082 1,361 1,297 1,261 1,319 1,321 1,338
Taxes 433 689 781 787 1,002 940 916 968 970 983
Of which : income tax related to oil activities 194 420 469 416 714 604 545 561 525 489
Grants 115 87 69 80 80 108 116 125 134 144
Other revenue 107 194 219 214 278 249 229 226 217 211
Of which : interest 1 0 0 0 0 12 18 20 22 24
Of which : rent (oil revenue) 90 179 208 195 259 219 191 184 170 160
Expenditures 987 1,176 1,289 1,147 1,227 1,129 1,197 1,229 1,270 1,350
Expense 634 793 766 648 727 628 677 688 708 745
Compensation of employees 201 212 216 260 263 299 326 347 370 395
Use of goods and services 110 95 111 109 79 153 179 187 195 211
Interest 21 19 29 20 23 19 21 21 20 22
To nonresidents 16 11 16 10 10 10 11 12 12 13
To residents other than general government 5 8 14 10 13 9 10 9 8 9
Subsidies 16 32 29 31 31 16 17 17 18 17
Grants 93 183 162 177 177 90 99 96 100 99
Other Expense 193 252 220 51 154 50 35 20 5 0
Net acquisition of nonfinancial assets 353 384 522 499 500 500 520 541 562 605
Domestically financed 242 264 392 368 368 344 352 360 368 396
Foreign financed 111 120 130 132 132 156 168 180 194 209
Net lending/borrowing (overall balance, incl. grants) -332 -207 -220 -65 134 168 64 90 51 -11
Primary non-oil net lending/ borrowing -596 -787 -867 -656 -815 -648 -669 -654 -645 -661
Financial assets -213 -78 13 -96 145 105 38 41 39 77
Domestic -213 -78 13 -96 145 105 38 41 39 77
Currency and deposits ("+" = buildup) -212 -58 23 -69 145 105 38 41 39 77
BEAC -211 -57 23 -69 145 105 38 41 39 77
Commercial banks -1 -1 0 0 0 0 0 0 0 0
Equity and investment fund shares -1 -20 -10 -27 0 0 0 0 0 0
Foreign 0 0 0 0 0 0 0 0 0 0
Liabilities 117 129 168 -30 11 -64 -26 -49 -13 89
Domestic 116 -10 56 -48 -7 -80 -21 -44 -11 87
Currency and deposits 0 0 0 0 0 0 0 0 0 0
Loans 114 -54 72 -68 -67 -41 -29 -44 -13 78
Of which : BEAC 116 19 72 -46 -46 -44 -43 -42 -42 0
Of which : commercial banks 0 0 0 -8 -7 16 29 13 23 36
Other accounts payable 1 43 -17 19 60 -39 7 -1 1 10
Foreign 1 139 112 18 18 16 -5 -5 -1 2
Loans 1 139 112 18 18 16 -5 -5 -1 2
Statistical discrepancies -2 0 -65 0 0 0 0 0 0 0
Memorandum items:
Non-oil GDP 2,138 2,369 2,584 2,913 2,912 3,128 3,357 3,604 3,875 4,171
Oil revenue 284 599 676 611 973 823 735 745 695 648
Non-oil revenue 371 371 393 471 388 474 526 573 626 690
Deposits in banks (mostly BEAC) 82 24 105 36 250 354 392 433 471 549
Net domestic financing–banking sector -328 -77 -49 -15 198 132 52 70 58 41
Sources: Chadian authorities; and IMF staff estimates and projections.
1 Presentation of fiscal table according to Government Finance Statistics Manual 2001 .
2010 2011
Projections

CHAD 2011 ARTICLE IV REPORT
INTERNATIONAL MONETARY FUND 27
Table 3b. Chad: Integrated Financial Balance Sheet of the Central Government, 2011–131
(In billions of CFA francs, unless otherwise indicated)
Opening balance
TransactionsClosing/opening
balanceTransactions
Closing/opening balance
TransactionsClosing/ opening
balance
Financial assets 104 145 249 105 353 38 391Domestic 104 145 249 105 353 38 391
Currency and deposits 104 145 249 105 353 38 391Equity and investment fund shares 0 0 0 0 0 0 0
Foreign 0 0 0 0 0 0 0
Liabilities 1,124 11 1,134 -64 1,070 -26 1,044Domestic 355 -7 347 -80 267 -21 246
Currency and deposits 1 0 1 0 1 0 1Loans 354 -67 287 -41 245 -29 217Other accounts payable 174 60 234 -39 195 7 202
Foreign 769 18 787 16 803 -5 798Loans 769 18 787 16 803 -5 798
Sources: Chadian authorities; and IMF staff estimates and projections.
1 Presentation according to Government Finance Statistics Manual 2001 .
2011 2012 2013

2011 ARTICLE IV REPORT CHAD
28 INTERNATIONAL MONETARY FUND
Table 4. Chad: Fiscal Operations of the Central Government, 2009–161 (In percent of non-oil GDP, unless otherwise indicated)
2009 2012 2013 2014 2015 2016
Est. Proj.1 Est. Budget Proj.
Revenue 25.2 37.2 38.7 34.4 44.0 38.0 34.1 33.1 30.6 28.6Oil 13.3 25.3 26.2 21.0 33.4 26.3 21.9 20.7 17.9 15.5Non-oil 12.0 12.0 12.5 13.4 10.6 11.7 12.2 12.5 12.7 13.1
Tax 11.2 11.3 12.1 12.7 9.9 10.7 11.1 11.3 11.5 11.9Non-tax 0.8 0.6 0.4 0.7 0.7 1.0 1.1 1.2 1.2 1.2
Expenditure 46.1 49.7 49.9 39.4 42.1 36.1 35.7 34.1 32.8 32.4Current 29.7 33.5 29.6 22.2 25.0 20.1 20.2 19.1 18.3 17.9
Wages and salaries 9.4 8.9 8.3 8.9 9.0 9.6 9.7 9.6 9.6 9.5Goods and services 5.2 4.0 4.3 3.7 2.7 4.9 5.3 5.2 5.0 5.1Transfers and subsidies 14.1 9.1 7.4 8.9 12.4 5.0 4.5 3.7 3.2 2.8
Interest 1.0 0.8 1.1 0.7 0.8 0.6 0.6 0.6 0.5 0.5Domestic 0.2 0.4 0.5 0.3 0.4 0.3 0.3 0.3 0.2 0.2External 0.7 0.5 0.6 0.4 0.4 0.3 0.3 0.3 0.3 0.3
Investment 16.5 16.2 20.2 17.1 17.2 16.0 15.5 15.0 14.5 14.5Domestically financed 11.3 11.1 15.2 12.6 12.6 11.0 10.5 10.0 9.5 9.5Foreign financed 5.2 5.1 5.0 4.5 4.5 5.0 5.0 5.0 5.0 5.0
Non-oil primary balance (excl. grants, commitment) 2 -28.1 -31.8 -31.2 -20.8 -26.2 -19.2 -18.4 -16.6 -15.1 -14.3
Overall balance (excl. grants, commitment) -20.9 -12.4 -11.2 -5.0 1.8 1.9 -1.6 -1.0 -2.1 -3.7
Payment of arrears 3 -3.9 -4.7 -6.2 0.0 -4.9 -6.5 -4.9 -4.7 -4.4 -4.1
Float 4 4.0 6.5 5.5 0.7 6.9 5.2 5.1 4.7 4.4 4.3Errors and omissions 0.1 … 2.5 … … … … … … …
Overall balance (excl. grants, cash) -20.8 -10.6 -9.3 -4.3 3.9 0.7 -1.3 -1.0 -2.1 -3.5
Financing 20.8 10.6 9.3 4.3 -3.9 -0.7 1.3 1.0 2.1 3.5Domestic financing 15.3 1.0 2.3 1.0 -7.3 -4.7 -2.0 -2.3 -1.3 0.0
Bank financing 15.3 3.2 1.9 0.5 -6.8 -4.2 -1.5 -1.9 -1.5 -1.0Central Bank (BEAC) 15.3 3.2 1.9 0.8 -6.5 -4.7 -2.4 -2.3 -2.1 -1.9
Deposits ("+" = drawdown) 9.9 2.4 -0.9 2.4 -5.0 -3.3 -1.1 -1.1 -1.0 -1.9Advances (net) 5.6 1.0 2.9 -1.4 -1.4 -1.3 -1.2 -1.2 -1.1 0.0IMF (reimbursement) -0.2 -0.2 -0.1 -0.1 -0.1 -0.1 0.0 0.0 0.0 0.0
Commercial banks 0.0 0.0 0.0 -0.3 -0.3 0.5 0.9 0.4 0.6 0.9Non-bank financing (net) -0.1 -3.1 0.0 -0.5 -0.5 -0.5 -0.4 -0.4 0.2 1.0Privatization 0.0 0.8 0.4 0.9 0.0 0.0 0.0 0.0 0.0 0.0
Foreign financing 5.5 9.6 7.0 3.4 3.4 4.0 3.3 3.3 3.4 3.5Grants 5.4 3.7 2.7 2.8 2.8 3.5 3.5 3.5 3.5 3.5
Budget support 1.6 0.0 0.0 0.0 0.0 0.0 0.0 0.0 0.0 0.0Project 3.8 3.7 2.7 2.8 2.8 3.5 3.5 3.5 3.5 3.5
Loans (net) 0.1 5.9 4.3 0.6 0.6 0.5 -0.1 -0.1 0.0 0.0Disbursements 1.4 7.3 6.1 1.8 1.8 1.5 1.5 1.5 1.5 1.5
Budget borrowings 0.0 6.0 3.7 0.0 0.0 ... ... ... ... ...Amortization -1.4 -1.5 -1.7 -1.1 -1.1 -1.0 -1.7 -1.7 -1.6 -1.5
Memorandum items: Non-oil GDP (in billions of CFA francs) 2,138 2,369 2,584 2,913 2,912 3,128 3,357 3,604 3,875 4,171Deposits in banks (mostly BEAC) 3.8 1.0 4.1 1.2 8.6 11.3 11.7 12.0 12.2 13.2BEAC statutory advances 6.6 7.0 8.1 5.7 5.7 4.0 2.5 1.2 0.0 0.0
Sources: Chadian authorities; and IMF staff estimates and projections.
1 IMF Country Report No. 10/196; Chad--Staff Report for the 2010 Article IV Consultation.2 Defined as the total revenue excluding grants and oil revenue, minus total expenditure excluding net interest payments and foreign-financed investment.3 Prior to 2011, this reflects clearance of arrears from previous periods. From 2011 onwards, this assumes that float from previous year is cleared.4 Difference between committed and paid expenditure.
2011
Projections
2010

CHAD 2011 ARTICLE IV REPORT
INTERNATIONAL MONETARY FUND 29
Table 4a. Chad: Statement of Operations of the Central Government, 2009–161
(In percent of non-oil GDP, unless otherwise indicated)
2009 2012 2013 2014 2015 2016
Est. Proj. Est. Budget Proj.
Revenue 30.6 40.9 41.4 37.1 46.7 41.5 37.6 36.6 34.1 32.1
Taxes 20.3 29.1 30.2 27.0 34.4 30.0 27.3 26.9 25.0 23.6
Of which : income tax related to oil activities 9.1 17.7 18.1 14.3 24.5 19.3 16.2 15.6 13.5 11.7
Grants 5.4 3.7 2.7 2.8 2.8 3.5 3.5 3.5 3.5 3.5
Other revenue 5.0 8.2 8.5 7.4 9.5 8.0 6.8 6.3 5.6 5.1
Of which : interest 0.0 0.0 0.0 0.0 0.0 0.4 0.5 0.5 0.6 0.6
Of which : rent (oil revenue) 4.2 7.6 8.0 6.7 8.9 7.0 5.7 5.1 4.4 3.8
Expenditures 46.1 49.7 49.9 39.4 42.1 36.1 35.7 34.1 32.8 32.4
Expense 29.7 33.5 29.7 22.2 25.0 20.1 20.2 19.1 18.3 17.9
Compensation of employees 9.4 8.9 8.3 8.9 9.0 9.6 9.7 9.6 9.6 9.5
Use of goods and services 5.2 4.0 4.3 3.7 2.7 4.9 5.3 5.2 5.0 5.1
Interest 1.0 0.8 1.1 0.7 0.8 0.6 0.6 0.6 0.5 0.5
To nonresidents 0.7 0.5 0.6 0.4 0.4 0.3 0.3 0.3 0.3 0.3
To residents other than general government 0.2 0.4 0.5 0.3 0.4 0.3 0.3 0.3 0.2 0.2
Subsidies 0.8 1.4 1.1 1.1 1.1 0.5 0.5 0.5 0.5 0.4
Grants 4.3 7.7 6.3 6.1 6.1 2.9 2.9 2.7 2.6 2.4
Other Expense 9.0 10.6 8.5 1.7 5.3 1.6 1.0 0.6 0.1 0.0
Net acquisition of nonfinancial assets 16.5 16.2 20.2 17.1 17.2 16.0 15.5 15.0 14.5 14.5
Domestically financed 11.3 11.1 15.2 12.6 12.6 11.0 10.5 10.0 9.5 9.5
Foreign financed 5.2 5.1 5.0 4.5 4.5 5.0 5.0 5.0 5.0 5.0
Net lending/ borrowing (overall balance, incl. grants) -15.5 -8.7 -8.5 -2.2 4.6 5.4 1.9 2.5 1.3 -0.3
Primary non-oil net lending/ borrowing -27.9 -33.2 -33.5 -22.5 -28.0 -20.7 -19.9 -18.2 -16.7 -15.8
Financial assets -10.0 -3.3 0.5 -3.3 5.0 3.3 1.1 1.1 1.0 1.9
Domestic -10.0 -3.3 0.5 -3.3 5.0 3.3 1.1 1.1 1.0 1.9
Currency and deposits ("+" = buildup) -9.9 -2.4 0.9 -2.4 5.0 3.3 1.1 1.1 1.0 1.9
BEAC -9.9 -2.4 0.9 -2.4 5.0 3.3 1.1 1.1 1.0 1.9
Commercial banks 0.0 0.0 0.0 0.0 0.0 0.0 0.0 0.0 0.0 0.0
Equity and investment fund shares 0.0 -0.8 -0.4 -0.9 0.0 0.0 0.0 0.0 0.0 0.0
Foreign 0.0 0.0 0.0 0.0 0.0 0.0 0.0 0.0 0.0 0.0
Liabilities 5.5 5.4 6.5 -1.0 0.4 -2.0 -0.8 -1.4 -0.3 2.1
Domestic 5.4 -0.4 2.2 -1.7 -0.3 -2.6 -0.6 -1.2 -0.3 2.1
Currency and deposits 0.0 0.0 0.0 0.0 0.0 0.0 0.0 0.0 0.0 0.0
Loans 5.3 -2.3 2.8 -2.3 -2.3 -1.3 -0.9 -1.2 -0.3 1.9
Of which : BEAC 5.4 0.8 2.8 -1.6 -1.6 -1.4 -1.3 -1.2 -1.1 0.0
Of which : commercial banks 0.0 0.0 0.0 -0.3 -0.3 0.5 0.9 0.4 0.6 0.9
Other accounts payable 0.1 1.8 -0.6 0.7 2.1 -1.2 0.2 0.0 0.0 0.2
Foreign 0.1 5.9 4.3 0.6 0.6 0.5 -0.1 -0.1 0.0 0.0
Loans 0.1 5.9 4.3 0.6 0.6 0.5 -0.1 -0.1 0.0 0.0
Statistical discrepancies -0.1 0.0 -2.5 0.0 0.0 0.0 0.0 0.0 0.0 0.0
Memorandum items:
Non-oil GDP 2,138 2,369 2,584 2,913 2,912 3,128 3,357 3,604 3,875 4,171
Oil revenue 13.3 25.3 26.2 21.0 33.4 26.3 21.9 20.7 17.9 15.5
Non-oil revenue 17.4 15.6 15.2 16.2 13.3 15.2 15.7 15.9 16.2 16.5
Deposits in banks (mostly BEAC) 3.8 1.0 4.1 1.2 8.6 11.3 11.7 12.0 12.2 13.2
Net domestic financing–banking sector -15.3 -3.2 -1.9 -0.5 6.8 4.2 1.5 1.9 1.5 1.0
Sources: Chadian authorities; and IMF staff estimates and projections.
1 Presentation of fiscal table according to Government Finance Statistics Manual 2001 .
2010 2011
Projections

2011 ARTICLE IV REPORT CHAD
30 INTERNATIONAL MONETARY FUND
Table 5. Chad: Balance of Payments, 2009–16 (In billions of CFA francs, unless otherwise indicated)
2009 2010 2011 2012 2013 2014 2015 2016
Est. Est.
Current account, incl. official current transfers -575.1 -1,464.8 -1,068.7 -766.6 -546.8 -538.0 -518.3 -524.2
Trade balance, incl. oil sector 143.0 6.5 429.6 610.8 659.7 609.7 527.3 442.3
Exports, f.o.b. 1,358.0 1,779.6 2,153.0 2,015.6 1,780.1 1,673.5 1,606.4 1,550.5
Of which : oil 1,153.5 1,587.5 1,929.3 1,789.8 1,540.9 1,421.3 1,330.3 1,251.2
Imports, f.o.b. -1,214.9 -1,773.1 -1,723.3 -1,404.8 -1,120.4 -1,063.9 -1,079.0 -1,108.2
Services (net) -772.0 -1,446.2 -1,368.9 -1,201.3 -1,081.2 -1,025.7 -975.2 -929.5
Income (net) -191.8 -342.0 -467.0 -533.8 -507.8 -515.4 -486.7 -477.1
Transfers (net) 245.6 316.9 337.6 357.6 382.5 393.5 416.3 440.1
Official (net) 34.6 22.4 26.0 28.2 30.5 32.9 35.7 38.6
Private (net) 211.0 294.5 311.6 329.4 352.0 360.6 380.7 401.5
Financial and capital account 220.0 1,499.8 1,313.1 931.6 586.6 553.4 535.9 525.6
Capital transfers 69.1 43.7 80.4 108.2 116.1 124.7 134.1 144.3
Foreign direct investment 522.0 960.7 875.3 561.4 484.3 442.6 412.1 388.9
FDI linked to oil production 557.1 1,078.8 993.4 679.5 602.4 560.7 530.2 507.0
Other medium and long term investment -7.8 103.1 8.8 6.9 -13.9 -13.9 -10.3 -7.7
Public sector 1.1 112.2 18.0 16.0 -4.7 -4.7 -1.1 1.5
Private sector -8.9 -9.2 -9.2 -9.2 -9.2 -9.2 -9.2 -9.2
Short-term capital (incl. errors and omissions) -366.3 389.4 348.6 255.1 0.0 0.0 0.0 0.0
Overall balance -355.1 35.0 244.4 164.9 39.8 15.4 17.6 1.4
Financing 355.1 -35.0 -244.4 -164.9 -39.8 -15.4 -17.6 -1.4
Net foreign assets (BEAC) 355.1 -35.0 -244.4 -164.9 -39.8 -15.4 -17.6 -1.4
Memorandum items:
Gross official reserves (imputed reserves, billions of US$) 0.6 0.6 0.8 1.1 0.4 0.4 0.5 0.5
(In months of imports of following year's goods and services) 1.0 1.2 2.4 3.7 4.1 4.3 4.4 4.3(Idem, excluding oil-sector imports) 3.0 2.7 5.8 9.2 9.3 9.1 8.9 8.4
Sources: Chadian authorities; and IMF staff estimates and projections.
Projections
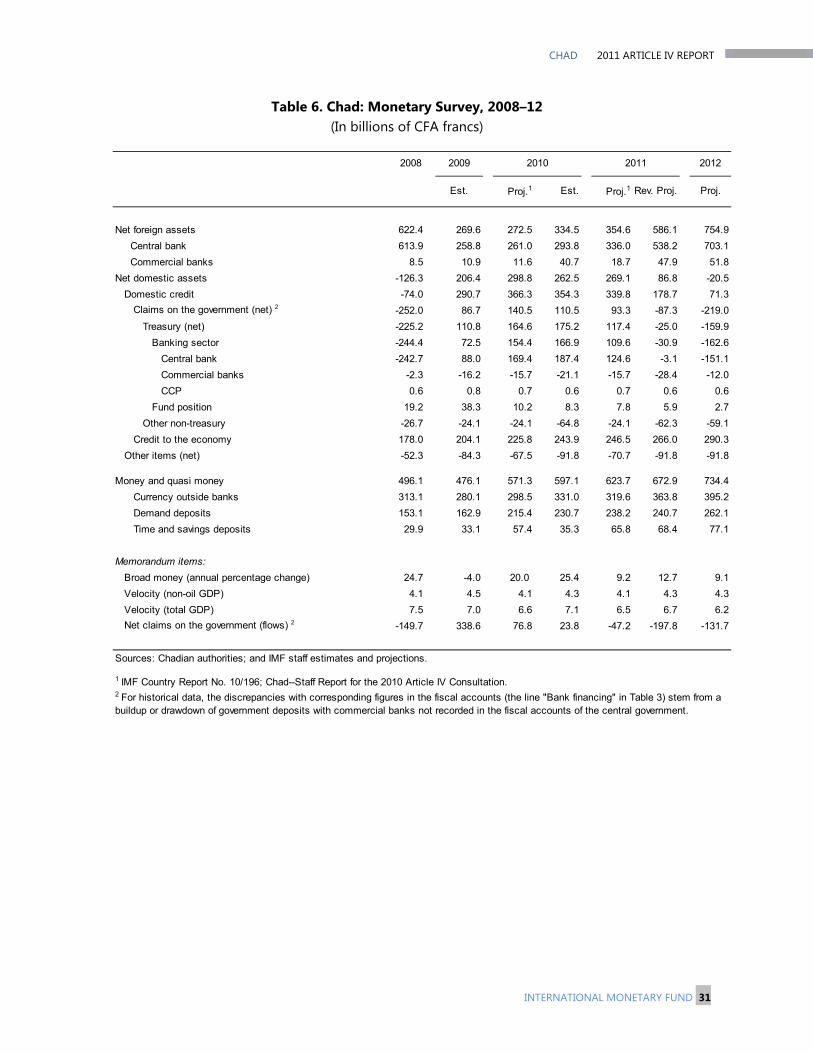
CHAD 2011 ARTICLE IV REPORT
INTERNATIONAL MONETARY FUND 31
Table 6. Chad: Monetary Survey, 2008–12 (In billions of CFA francs)
2008 2009 2012
Est. Proj.1 Est. Proj.1 Rev. Proj. Proj.
Net foreign assets 622.4 269.6 272.5 334.5 354.6 586.1 754.9
Central bank 613.9 258.8 261.0 293.8 336.0 538.2 703.1
Commercial banks 8.5 10.9 11.6 40.7 18.7 47.9 51.8
Net domestic assets -126.3 206.4 298.8 262.5 269.1 86.8 -20.5
Domestic credit -74.0 290.7 366.3 354.3 339.8 178.7 71.3
Claims on the government (net) 2 -252.0 86.7 140.5 110.5 93.3 -87.3 -219.0
Treasury (net) -225.2 110.8 164.6 175.2 117.4 -25.0 -159.9
Banking sector -244.4 72.5 154.4 166.9 109.6 -30.9 -162.6
Central bank -242.7 88.0 169.4 187.4 124.6 -3.1 -151.1
Commercial banks -2.3 -16.2 -15.7 -21.1 -15.7 -28.4 -12.0
CCP 0.6 0.8 0.7 0.6 0.7 0.6 0.6
Fund position 19.2 38.3 10.2 8.3 7.8 5.9 2.7
Other non-treasury -26.7 -24.1 -24.1 -64.8 -24.1 -62.3 -59.1
Credit to the economy 178.0 204.1 225.8 243.9 246.5 266.0 290.3
Other items (net) -52.3 -84.3 -67.5 -91.8 -70.7 -91.8 -91.8
Money and quasi money 496.1 476.1 571.3 597.1 623.7 672.9 734.4
Currency outside banks 313.1 280.1 298.5 331.0 319.6 363.8 395.2
Demand deposits 153.1 162.9 215.4 230.7 238.2 240.7 262.1
Time and savings deposits 29.9 33.1 57.4 35.3 65.8 68.4 77.1
Memorandum items:
Broad money (annual percentage change) 24.7 -4.0 20.0 25.4 9.2 12.7 9.1
Velocity (non-oil GDP) 4.1 4.5 4.1 4.3 4.1 4.3 4.3
Velocity (total GDP) 7.5 7.0 6.6 7.1 6.5 6.7 6.2
Net claims on the government (flows) 2 -149.7 338.6 76.8 23.8 -47.2 -197.8 -131.7
Sources: Chadian authorities; and IMF staff estimates and projections.
1 IMF Country Report No. 10/196; Chad--Staff Report for the 2010 Article IV Consultation.
20112010
2 For historical data, the discrepancies with corresponding figures in the fiscal accounts (the line "Bank financing" in Table 3) stem from a buildup or drawdown of government deposits with commercial banks not recorded in the fiscal accounts of the central government.

2011 ARTICLE IV REPORT CHAD
32 INTERNATIONAL MONETARY FUND
Table 7. Chad: Millennium Development Goals, 1990–20091
1990 1995 2000 2005 2009 2009
SSA
Goal 1: Eradicate extreme poverty and hungerEmployment to population ratio, 15+, total (%) 67.0 68.0 68.0 70.0 70.0 64.0Employment to population ratio, ages 15-24, total (%) 51.0 51.0 52.0 50.0 50.0 49.0Income share held by lowest 20% .. .. .. 6.0 .. ..Malnutrition prevalence, weight for age (% of children under 5) .. 34.0 29.0 34.0 .. 25.0Poverty gap at $1.25 a day (PPP) (%) .. .. .. 26.0 .. ..Poverty headcount ratio at $1.25 a day (PPP) (% of population) .. .. .. 62.0 .. ..Vulnerable employment, total (% of total employment) .. 94.0 .. .. .. ..
Goal 2: Achieve universal primary educationLiteracy rate, youth female (% of females ages 15-24) .. 9.0 23.0 31.0 39.0 67.0Literacy rate, youth male (% of males ages 15-24) .. 26.0 56.0 54.0 54.0 77.0Persistence to last grade of primary, total (% of cohort) .. .. 47.0 30.0 .. ..Primary completion rate, total (% of relevant age group) 16.0 14.0 22.0 32.0 33.0 64.0Total enrollment, primary (% net) 33.0 38.0 54.0 61.0 .. 76.0
Goal 3: Promote gender equality and empower womenProportion of seats held by women in national parliaments (%) .. 17.0 2.0 7.0 5.0 18.0Ratio of female to male primary enrollment (%) 44.0 48.0 61.0 67.0 70.0 91.0Ratio of female to male secondary enrollment (%) 22.0 23.0 28.0 34.0 41.0 79.0Ratio of female to male tertiary enrollment (%) .. 15.0 18.0 6.0 17.0 ..Share of women employed in the nonagricultural sector (% of total nonagricultural employment 3.8 .. .. .. .. ..
Goal 4: Reduce child mortalityImmunization, measles (% of children ages 12-23 months) 32.0 26.0 28.0 23.0 23.0 68.0Mortality rate, infant (per 1,000 live births) 120.0 120.0 122.0 124.0 124.0 81.0Mortality rate, under-5 (per 1,000) 201.0 202.0 205.0 209.0 209.0 130.0
Goal 5: Improve maternal healthAdolescent fertility rate (births per 1,000 women ages 15-19) .. .. 191.0 177.0 155.0 112.0Births attended by skilled health staff (% of total) .. 15.0 16.0 14.0 .. 44.0Contraceptive prevalence (% of women ages 15-49) .. 4.0 8.0 3.0 .. 21.0Maternal mortality ratio (modeled estimate, per 100,000 live births) 1300.0 1300.0 1300.0 1200.0 1200.0 650.0Pregnant women receiving prenatal care (%) .. 23.0 42.0 39.0 .. 71.0Unmet need for contraception (% of married women ages 15-49) .. 10.0 .. 21.0 .. 24.0
Goal 6: Combat HIV/AIDS, malaria, and other diseasesChildren with fever receiving antimalarial drugs (% of children under age 5 with fever) .. .. 53.0 53.0 .. 34.0Condom use, population ages 15-24, female (% of females ages 15-24) .. .. .. 2.0 .. 19.0Condom use, population ages 15-24, male (% of males ages 15-24) .. .. .. 18.0 .. 36.0Incidence of tuberculosis (per 100,000 people) 125.0 181.0 262.0 315.0 283.0 342.0Prevalence of HIV, female (% ages 15-24) .. .. .. .. 2.5 3.8Prevalence of HIV, male (% ages 15-24) .. .. .. .. 1.0 1.5Prevalence of HIV, total (% of population ages 15-49) 1.1 2.1 3.0 3.5 3.4 5.4Tuberculosis case detection rate (%, all forms) 34.0 25.0 24.0 20.0 26.0 48.0
Goal 7: Ensure environmental sustainabilityForest area (% of land area) 10.4 .. 9.8 9.5 9.2 28.0Improved sanitation facilities (% of population with access) 6.0 6.0 7.0 9.0 9.0 31.0Improved water source (% of population with access) 38.0 42.0 45.0 49.0 50.0 60.0Marine protected areas (% of total surface area) .. .. .. .. .. 5.0
Goal 8: Develop a global partnership for developmentInternet users (per 100 people) 0.0 0.0 0.0 0.4 1.7 8.8Mobile cellular subscriptions (per 100 people) 0.0 0.0 0.0 2.0 24.0 37.0Telephone lines (per 100 people) 0.0 0.0 0.0 0.0 0.0 1.0
Source: World Development Indicators database (World Bank).
1Figures in italics refer to periods other than those specified.

CHAD STAFF REPORT FOR THE 2011 ARTICLE IV CONSULTATION—INFORMATIONAL ANNEX Prepared By
The African Department (In collaboration with other Departments)
FUND RELATIONS ________________________________________________________________________ 2
JMAP BANK-FUND MATRIX _____________________________________________________________ 6
STATISTICAL ISSUES APPENDIX _________________________________________________________ 8
CONTENTS
August 8, 2011

2011 ARTICLE IV REPORT—INFORMATIONAL ANNEX CHAD
2 INTERNATIONAL MONETARY FUND
FUND RELATIONS As of June 30, 2011 I. Membership Status: Joined: July 10, 1963; Article VIII
II. General Resources Account: SDR Million %Quota
Quota 66.60 100.00 Fund holdings of currency 63.67 95.60 Reserve Tranche Position 2.93 4.40
III. SDR Department: SDR Million %Allocation
Net cumulative allocation 53.62 100.00 Holdings 0.06 0.11
IV. Outstanding Purchases and Loans: SDR Million %Quota
ECF Arrangements 7.82 11.74
V. Latest Financial Arrangements:
Date of Expiration Amount Approved Amount Drawn Type Arrangement Date (SDR Million) (SDR Million) ECF 1 Feb 16, 2005 May 31, 2008 25.20 4.20 ECF 1 Jan 07, 2000 Jan 06, 2004 47.60 42.40 ECF 1 Sep 01, 1995 Apr 30, 1999 49.56 49.56
1 Formerly PRGF. VI. Projected Payments to Fund (SDR Million; based on existing use of resources and present holdings of SDRs):
Forthcoming
2011 2012 2013 2014 2015 Principal 2.00 2.68 1.88 0.84 0.42
Charges/Interest 0.15 0.31 0.30 0.30 0.30 Total 2.15 2.99 2.18 1.14 0.72

CHAD 2011 ARTICLE IV REPORT—INFORMATIONAL ANNEX
INTERNATIONAL MONETARY FUND 3
VII. Implementation of HIPC Initiative:
I. Commitment of HIPC assistance Enhanced
Framework
Decision point date May 2001 Assistance committed by all creditors (US$ Million) 1 170.00 Of which: IMF assistance (US$ million) 18.00 (SDR equivalent in millions) 14.25 Completion point date Floating II. Disbursement of IMF assistance (SDR Million) Assistance disbursed to the member 8.55 Interim assistance 8.55 Completion point balance -- Additional disbursement of interest income 2 -- Total disbursements 8.55 _______________________________________
1 Assistance committed under the original framework is expressed in net present value (NPV) terms at the completion point, and assistance committed under the enhanced framework is expressed in NPV terms at the decision point. Hence these two amounts cannot be added. 2 Under the enhanced framework, an additional disbursement is made at the completion point corresponding to interest income earned on the amount committed at the decision point but not disbursed during the interim period.
VIII. Safeguards Assessments The Bank of the Central African States (BEAC) is the regional central bank of the Central African States. The most recent safeguards assessment of the BEAC was completed on July 6, 2009. The findings of this assessment indicate that implementation of previous safeguards recommendations on financial reporting, internal audit, and internal control has been limited, and that the changing risk profile of the BEAC foreign exchange holdings requires further actions to strengthen safeguards at the BEAC. Subsequent to revelation of Paris office fraud, a series of initial measures and longer term reforms was
agreed between IMF and BEAC in order to continue with country programs. BEAC adopted an action plan for 2010 with the aim of reforming its own governance, and strengthening key safeguards. Implementation delays and additional safeguard concerns raised in the first special audit triggered a suspension of Fund disbursements to CEMAC countries from June through early August 2010, after which they resumed. A recent safeguards monitoring mission has identified a new series of rolling benchmarks to address outstanding safeguards concerns going forward.

2011 ARTICLE IV REPORT—INFORMATIONAL ANNEX CHAD
4 INTERNATIONAL MONETARY FUND
IX. Exchange Rate Arrangement Chad maintains an exchange system that is free from restrictions and multiple currency practices on payments and transfers for current international transactions. The BEAC common currency is the CFA franc, which was formerly pegged to the French franc and is now pegged to the euro. Repurchase of CFA franc banknotes exported outside the BEAC zone was suspended on August 2, 1993. Effective January 12, 1994, the CFA franc was devalued by 50 percent in foreign currency
terms, and the exchange rate was adjusted from F 1 = CFAF 50 to F 1 = CFAF 100. Since January 1, 1999, the CFA franc has been pegged to the euro at the rate of EUR 1 = CFAF 655.957. X. Article IV Consultations Chad is on the 12-month cycle. The next Article IV consultation is expected to take place by June 2012.
XI. Technical Assistance Department Purpose Time of Delivery STA (AFRITAC) National accounts, 2006 August 2011 MCM Banking system vulnerabilities January 2011 FAD (AFRITAC) Tax administration February 2011 FAD (AFRITAC) Tax administration September–October 2010 FAD (AFRITAC) Tax administration June–July 2010 FAD (AFRITAC) Public financial management September 2010 STA Balance of payments May 2010 MCM (AFRITAC) Public debt May 2010 FAD Tax policy review April–May 2010 FAD (AFRITAC) Tax and custom administration March–April 2010 FAD(AFRITAC) Customs administration March 2010 STA (AFRITAC) National accounts March 2010 FAD (AFRITAC) Public financial management January 2010 FAD(AFRITAC) Tax and customs administration December 2009 MCM (AFRITAC) Public debt November 2009 FAD (AFRITAC) Public financial management September 2009 FAD (AFRITAC) Tax administration August–September 2009 FAD (AFRITAC) Public financial management August–September 2009 FAD Tax and customs administration April 2009 MCM (AFRITAC) Public debt April 2009 FAD (AFRITAC) Treasury management March 2009

CHAD 2011 ARTICLE IV REPORT—INFORMATIONAL ANNEX
INTERNATIONAL MONETARY FUND 5
XII. Financial Sector Assessment Program
(FSAP) Participation, Report on the
Observances of Standards and Codes
(ROSCs), and Offshore Finance Center (OFC)
Assessments A joint IMF-World Bank mission conducted an FSAP for Chad during May 25–June 10, 2011, building on the mission that conducted a regional FSAP for CEMAC countries during
January 30–February 9, 2006. A ROSC Data Module mission visited Chad May 26–June 8, 2005.
XIII. Resident Representative There has been no Fund Resident Representative in N’Djamena since October 2010.
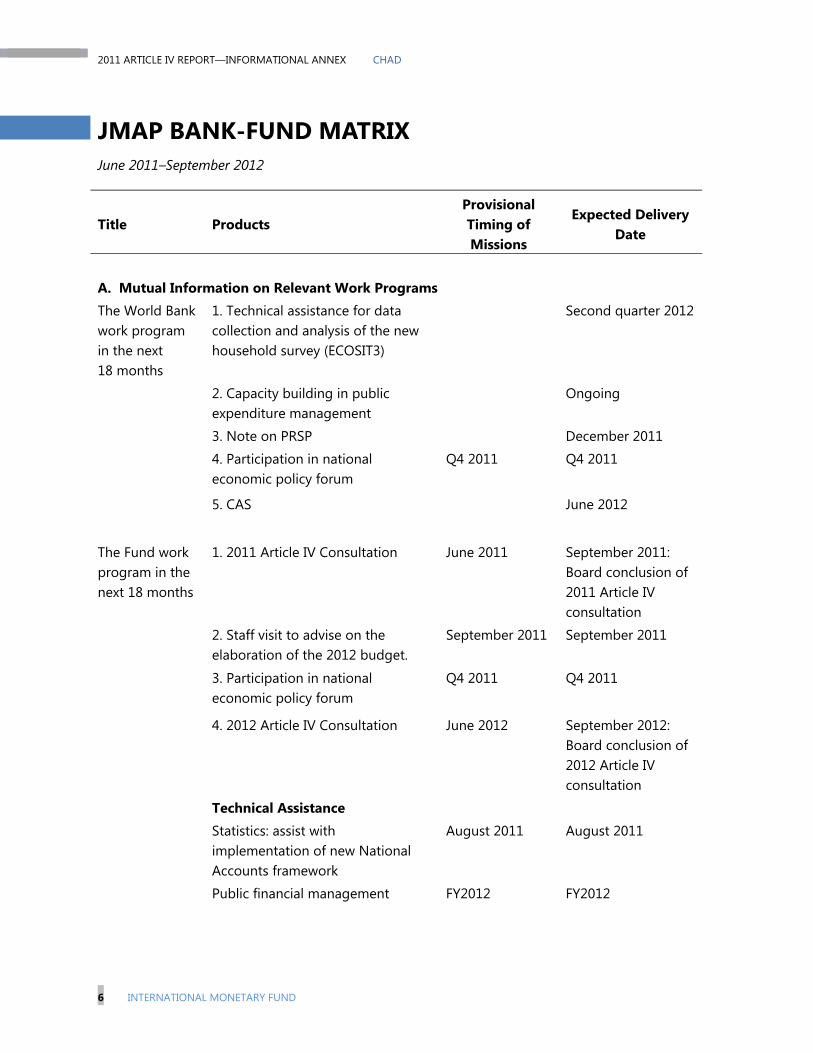
2011 ARTICLE IV REPORT—INFORMATIONAL ANNEX CHAD
6 INTERNATIONAL MONETARY FUND
JMAP BANK-FUND MATRIXJune 2011–September 2012
Title Products Provisional Timing of Missions
Expected Delivery Date
A. Mutual Information on Relevant Work Programs The World Bank work program in the next 18 months
1. Technical assistance for data collection and analysis of the new household survey (ECOSIT3)
Second quarter 2012
2. Capacity building in public expenditure management
Ongoing
3. Note on PRSP December 2011
4. Participation in national economic policy forum
Q4 2011 Q4 2011
5. CAS June 2012
The Fund work program in the next 18 months
1. 2011 Article IV Consultation June 2011 September 2011: Board conclusion of 2011 Article IV consultation
2. Staff visit to advise on the elaboration of the 2012 budget.
September 2011 September 2011
3. Participation in national economic policy forum
Q4 2011 Q4 2011
4. 2012 Article IV Consultation June 2012 September 2012: Board conclusion of 2012 Article IV consultation
Technical Assistance
Statistics: assist with implementation of new National Accounts framework
August 2011 August 2011
Public financial management FY2012 FY2012
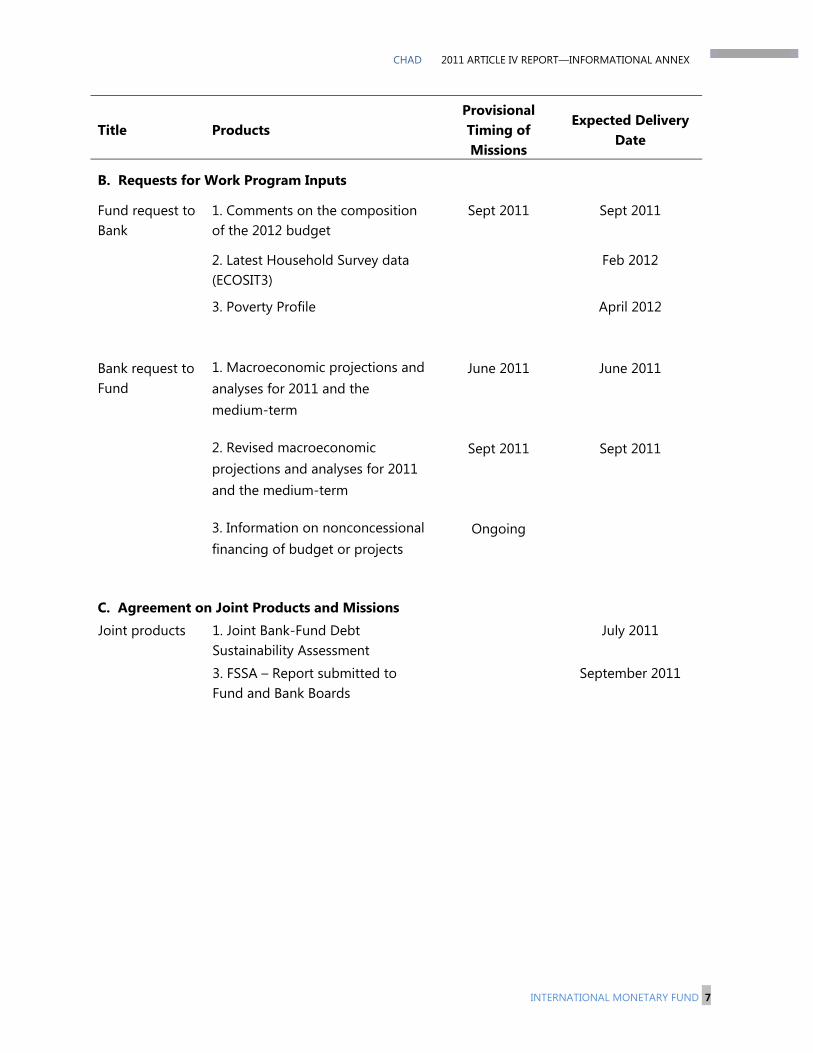
CHAD 2011 ARTICLE IV REPORT—INFORMATIONAL ANNEX
INTERNATIONAL MONETARY FUND 7
Title Products Provisional Timing of Missions
Expected Delivery Date
B. Requests for Work Program Inputs
Fund request to Bank
1. Comments on the composition of the 2012 budget
Sept 2011 Sept 2011
2. Latest Household Survey data (ECOSIT3)
Feb 2012
3. Poverty Profile April 2012
Bank request to Fund
1. Macroeconomic projections and analyses for 2011 and the medium-term
June 2011 June 2011
2. Revised macroeconomic projections and analyses for 2011 and the medium-term
Sept 2011 Sept 2011
3. Information on nonconcessional financing of budget or projects
Ongoing
C. Agreement on Joint Products and Missions Joint products 1. Joint Bank-Fund Debt
Sustainability Assessment July 2011
3. FSSA – Report submitted to Fund and Bank Boards
September 2011
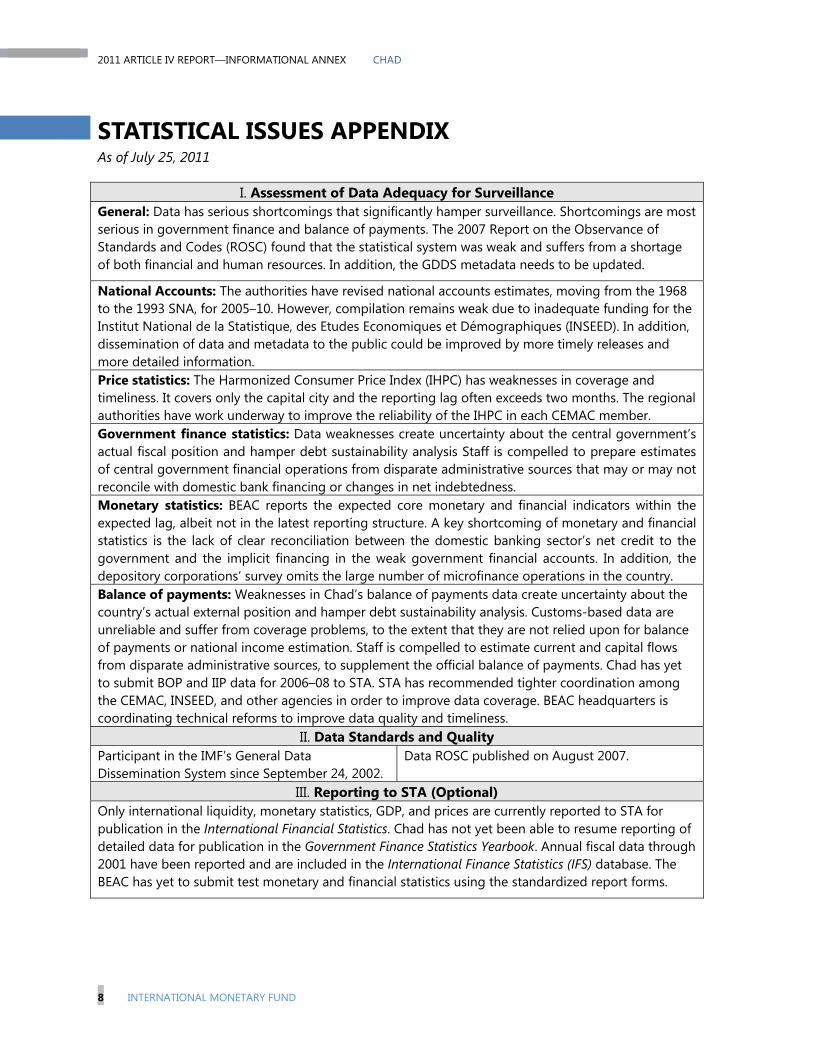
2011 ARTICLE IV REPORT—INFORMATIONAL ANNEX CHAD
8 INTERNATIONAL MONETARY FUND
STATISTICAL ISSUES APPENDIX As of July 25, 2011
I. Assessment of Data Adequacy for Surveillance General: Data has serious shortcomings that significantly hamper surveillance. Shortcomings are most serious in government finance and balance of payments. The 2007 Report on the Observance of Standards and Codes (ROSC) found that the statistical system was weak and suffers from a shortage of both financial and human resources. In addition, the GDDS metadata needs to be updated.
National Accounts: The authorities have revised national accounts estimates, moving from the 1968 to the 1993 SNA, for 2005–10. However, compilation remains weak due to inadequate funding for the Institut National de la Statistique, des Etudes Economiques et Démographiques (INSEED). In addition, dissemination of data and metadata to the public could be improved by more timely releases and more detailed information. Price statistics: The Harmonized Consumer Price Index (IHPC) has weaknesses in coverage and timeliness. It covers only the capital city and the reporting lag often exceeds two months. The regional authorities have work underway to improve the reliability of the IHPC in each CEMAC member. Government finance statistics: Data weaknesses create uncertainty about the central government’s actual fiscal position and hamper debt sustainability analysis Staff is compelled to prepare estimates of central government financial operations from disparate administrative sources that may or may not reconcile with domestic bank financing or changes in net indebtedness. Monetary statistics: BEAC reports the expected core monetary and financial indicators within the expected lag, albeit not in the latest reporting structure. A key shortcoming of monetary and financial statistics is the lack of clear reconciliation between the domestic banking sector’s net credit to the government and the implicit financing in the weak government financial accounts. In addition, the depository corporations’ survey omits the large number of microfinance operations in the country. Balance of payments: Weaknesses in Chad’s balance of payments data create uncertainty about the country’s actual external position and hamper debt sustainability analysis. Customs-based data are unreliable and suffer from coverage problems, to the extent that they are not relied upon for balance of payments or national income estimation. Staff is compelled to estimate current and capital flows from disparate administrative sources, to supplement the official balance of payments. Chad has yet to submit BOP and IIP data for 2006–08 to STA. STA has recommended tighter coordination among the CEMAC, INSEED, and other agencies in order to improve data coverage. BEAC headquarters is coordinating technical reforms to improve data quality and timeliness.
II. Data Standards and Quality Participant in the IMF’s General Data Dissemination System since September 24, 2002.
Data ROSC published on August 2007.
III. Reporting to STA (Optional) Only international liquidity, monetary statistics, GDP, and prices are currently reported to STA for publication in the International Financial Statistics. Chad has not yet been able to resume reporting of detailed data for publication in the Government Finance Statistics Yearbook. Annual fiscal data through 2001 have been reported and are included in the International Finance Statistics (IFS) database. The BEAC has yet to submit test monetary and financial statistics using the standardized report forms.

CHA
D
2011 ARTICLE IV REPORT—
INFO
RMATIO
NAL AN
NEX
INTERN
ATION
AL MO
NETARY FU
ND
9
Chad: Table of Common Indicators Required for Surveillance As of July 19, 2011
Date of latest
observation
Date received Frequency
of
Data7
Frequency
of
Reporting7
Frequency
of
Publication7
Memo Items:
Data Quality – Methodological
soundness8
Data Quality –
Accuracy and
reliability9
Exchange Rates Daily Daily D D D
International Reserve Assets and Reserve
Liabilities of the Monetary Authorities1
12/2009 03/2010 M M M
Reserve/Base Money 4/2011 7/2011 M M M
LO, LNO, LNO, LO
LO, O, O, LO, NA
Broad Money 4/2011 7/2011 M QM M
Central Bank Balance Sheet 4/2011 7/2011 M M M
Consolidated Balance Sheet of the
Banking System
4/2011 7/2011 M M M
Interest Rates2 6/2011 7/2011 MI QM M
Consumer Price Index 10/2010 03/2011 M M M
Revenue, Expenditure, Balance and
Composition of Financing3 – General
Government4
03/2009 04/2009 Q Q Q
LO, LNO, LO, LO
O, LO, LO, LO,
NO
Revenue, Expenditure, Balance and
Composition of Financing3–Central
Government
03/2009 04/2009 Q Q Q
Stocks of Central Government and
Central Government-Guaranteed Debt5
12/2008 04/2009 Q Q Q

10 IN
TERNATIO
NAL M
ON
ETARY FUN
D
2011 ARTICLE IV REPORT—
INFO
RMATIO
NAL AN
NEX CH
AD
Chad: Table of Common Indicators Required for Surveillance As of July 19, 2011
Date of latest
observation
Date received Frequency
of
Data7
Frequency
of
Reporting7
Frequency
of
Publication7
Memo Items:
Data Quality – Methodological
soundness8
Data Quality –
Accuracy and
reliability9
External Current Account Balance 2007 04/2009 A A A
O, O, O, LO
LO, LO, O, O, O Exports and Imports of Goods and
Services
2007 04/2009 A A A
GDP/GNP 2009 5/2010 A A A LNO, LO, LNO, LO LNO, LNO, LNO,
LNO
Gross External Debt 12/ 2008 04/ 2009 Bi-M Bi-M Bi-M
International Investment Position6 NA NA NA NA NA
1 Any reserve assets that are pledged of otherwise encumbered should be specified separately. Also, data should comprise short-term liabilities linked to a foreign currency but settled
by other means as well as the notional values of financial derivatives to pay and to receive foreign currency, including those linked to a foreign currency but settled by other means. 2 Both market-based and officially-determined, including discount rates, money market rates, rates on treasury bills, notes and bonds. 3Foreign, domestic bank, and domestic nonbank financing. 4 The general government consists of the central government (budgetary funds, extra budgetary funds, and social security funds) and state and local governments. 5 Including currency and maturity composition. 6 Includes external gross financial asset and liability positions vis-à-vis nonresidents. 7 Daily (D); weekly (W); monthly (M); quarterly (Q); annually (A); irregular (I); and not available (NA). 8 Reflects the assessment provided in the data ROSC (published on August 31, 2007), and based on the findings of the mission that took place during May 28 to June 8, 2005 for the
dataset corresponding to the variable in each row. The assessment indicates whether international standards concerning concepts and definitions, scope, classification/sectorization,
and basis for recording are fully observed (O); largely observed (LO); largely not observed (LNO); not observed (NO); and not available (NA). 9 Same as footnote 8, except referring to international standards concerning (respectively) source data, assessment of source data, statistical techniques, assessment and validation of
intermediate data and statistical outputs, and revision studies.

CHAD STAFF REPORT FOR THE 2011 ARTICLE IV CONSULTATION—DEBT SUSTAINABILITY ANALYSIS
The staffs’ assessment of Chad’s debt vulnerability and risk of debt distress, which remains moderate, has not changed since the 2010 debt sustainability analysis (DSA). The assumptions underpinning the DSA are also quite similar, except for an upward revision of current and projected oil prices. Public and publicly-guaranteed external debt and debt service indicators remain well below the indicative thresholds through the projection horizon. However, Chad’s debt sustainability outlook remains highly sensitive to an oil price shock. Should a decline in oil price similar to that experienced in 2009 reoccur, all debt and debt service ratios would be breached and remain persistently above most debt indicator thresholds. Furthermore, borrowing to finance contemplated major projects would also jeopardize sustainability.
Approved By Jeffrey Lewis and Jan Walliser (IDA), Seán Nolan and Dhaneshwar Ghura (IMF)
Prepared by the staffs of the International Development Association and the International Monetary Fund
August 8, 2011

2011 ARTICLE IV REPORT—DEBT SUSTAINABILITY ANALYSIS CHAD
2 INTERNATIONAL MONETARY FUND
BACKGROUNDRecent Developments in Public External Debt
1. Chad’s external public debt burden diminished considerably in 2001–08, thanks to strong oil sector-driven growth and low borrowing from abroad. Even in 2009, notwithstanding a sharp deterioration of the fiscal position, external public debt decreased in nominal terms. With a steep drop in oil revenue, the overall fiscal deficit (excluding grants) reached about 22 percent of non-oil GDP, but it was largely financed by depleting government deposits and drawing statutory advances from the central bank. However, the negative GDP shock in 2009 pushed up the external public debt-to-GDP ratio.
2. In 2010, the authorities borrowed abroad on nonconcessional terms and external debt picked up. As a result, the rate of debt accumulation (the year-to-year change in present value (PV) of debt relative to previous year’s GDP) spiked due in part to the low grant element of new borrowing (from Libya and China). The external public debt-to-GDP ratio reached about 25 percent compared with 27½ percent anticipated in the 2010 DSA, as the overall fiscal situation was slightly better, and recourse to external borrowing was lower than anticipated. With the rebound in oil prices, the overall fiscal deficit (excluding grants) dropped to around 12 percent of non-oil GDP, but the external current account deficit widened to 35 percent of GDP, because of the high import content of investment spending (notably, in the oil and energy sector).
Status of Implementation of Debt Relief Initiatives
3. Poor macroeconomic policy performance has prevented Chad from reaching the completion point under the Enhanced Heavily Indebted Poor Countries (HIPC) Initiative. Chad reached the Decision Point under the Enhanced HIPC Initiative in May 2001. Chad’s inability to meet agreed fiscal targets and to implement satisfactorily a program under the IMF’s Poverty Reduction and Growth Facility (PRGF) has been the principal obstacle to debt relief. The 2005 PRGF expired in 2008 without any reviews being concluded. Subsequent efforts to resume the path toward debt relief with the support of IMF Staff-Monitored Programs (SMP) were also hindered by fiscal slippages. Progress towards other completion point triggers1 has either been slow or early gains have been followed by subsequent deterioration. 2
4. Meeting the conditions for debt relief under the Enhanced HIPC Initiative and the Multilateral Debt Relief Initiative (MDRI) would cut external debt in half (in nominal terms). MDRI relief would cover the full stock of debt owed to three multilateral creditors (IDA, IMF, and the African Development Fund (AfDF))
1 2
___________________________________________
1. For a description of completion point triggers, see Chad, Decision Point Document for the Enhanced Heavily Indebted Poor Countries (HIPC) Initiative, May 4, 2001, pp. 29–31. 2. Heavily Indebted Poor Countries (HIPC) Initiative and Multilateral Debt Relief Initiative (MDRI)—Status of Implementation 2010. Table 2B, p.30.

CHAD 2011 ARTICLE IV REPORT—DEBT SUSTAINABILITY ANALYSIS
INTERNATIONAL MONETARY FUND 3
Text Table 1. Chad: External Debt Stock at Year-End, 2001–10 (Billions of CFA francs)
Text Table 1’s end-2010 external public debt stocks are estimated by staff based on World Bank Debt Reporting System (DRS) end-2009 debt stock, Chad’s debt management office’s estimates of 2010 disbursements and amortization, and Ministry of Economy and Planning estimates of 2010 project loan disbursements. The official external debt stock data underestimate the actual level of external debt. Most notably, the debt registry does not capture the loan from Libya or the loan from China for the state’s stake in the joint-venture refinery. Also, project loan disbursements are recognized only after a long lag. Both text tables have discrepancies with corresponding fiscal or balance of payments flow estimates, giving rise to residuals in the sustainability analyses. Data could be substantially revised in the 2012 DSA.
that remains after Enhanced HIPC relief on disbursements before end-2004 in the case of IMF and AfDF, and before end-2003 in the case of IDA. In nominal terms, this could total over $1 billion and would imply a reduction in debt service of about $40 million per year, for about 30 years.
Recent Developments in Public Domestic Debt
5. The stock of public domestic debt has grown, mainly as a result of drawing on
central bank statutory advances. Chad’s domestic debt is estimated at about CFAF 87 billion (7½ percent of GDP) at end-2010 (Text Table 2). The public domestic debt includes central bank statutory advances (avances statutaires); treasury arrears (arriérés comptables); rescheduled debt (dettes conventionnées); legal payment obligations (engagements juridiques); and one small public bond issue. The authorities made a significant effort to reduce domestic arrears in 2010. Most of domestic arrears outstanding at end-2009 were paid, which brought down the stock outstanding to about
2001 2002 2003 2004 2005 2006 2007 2008 2009 2010Rev. Est.
Total 794.7 786.6 736.9 797.2 898.9 896.2 794.0 782.3 781.8 1,066.8 (percent of GDP) 63.4 56.8 46.3 34.2 29.0 27.2 23.6 20.9 23.4 25.2
Multilateral 678.1 687.7 652.5 715.3 810.2 805.5 718.6 706.6 677.7 757.7 IMF 65.3 67.3 57.0 47.7 47.5 37.4 25.4 19.0 12.9 8.3 World Bank/IDA 380.6 398.3 394.0 444.5 507.8 486.1 453.4 422.0 402.7 439.5 African Development Fund/Bank 182.8 169.8 159.9 168.5 179.8 205.8 173.7 182.4 185.5 208.7 EIB 3.9 7.9 7.3 13.0 13.0 12.4 9.9 9.8 8.7 9.4 Others 45.5 44.4 34.2 41.6 62.0 63.8 56.2 73.4 67.9 91.8
Bilateral 116.2 98.6 84.1 81.9 88.8 90.7 75.4 75.7 104.1 309.1 Paris Club official debt 30.2 25.8 24.0 25.2 24.3 23.2 23.6 19.2 16.6 32.0 Non-Paris Club official debt 86.1 72.7 60.1 56.7 64.4 67.5 51.8 56.5 87.5 277.2 of which: China, People's Republic 28.6 25.4 22.0 13.6 15.4 13.9 - 3.5 20.4 125.1
Libya - - - - - - - - - 96.2 India - - - - - 11.3 14.8 22.7 21.4 22.9
Sources: World Bank, Chadian authorities, selected creditors and staff estimates.

2011 ARTICLE IV REPORT—DEBT SUSTAINABILITY ANALYSIS CHAD
4 INTERNATIONAL MONETARY FUND
Text Table 2. Chad: Public Domestic Debt Stock at Year-End, 2006–10 (Billions of CFA francs)
CFAF 3 billion (about 0.1 percent of GDP) at end-2010. In July 2011, the authorities completed a sale of over CFAF 100 billion of five-year savings bonds with a 6 percent coupon. Sixty three percent of the issue was purchased by Chadian residents. Two-thirds (67 percent) of the issue was purchased by banks, local and regional.
Debt Burden Thresholds under the Debt Sustainability Framework
6. Chad is a weak policy performer for the purpose of debt burden thresholds under the Debt Sustainability Framework (DSF). Chad’s rating on the World Bank’s Country Policy and Institutional Assessment (CPIA) is weak (2.46 on average for 2008–10, on a scale from 1 to 6) and declined from 2.88 in 2005 to 2.38 in 2010.
Source: 2010 IDA Country Performance ratings (methodology and results).
2006 2007 2008 2009 2010
Total 122.3 123.1 142.7 238.5 286.9 (Percent of GDP) 3.7 3.7 3.8 7.1 6.8
Central Bank Statutory Advances - 17.0 21.6 141.6 208.6 Rescheduled debts 71.8 48.6 56.8 58.2 67.9 Treasury arrears 24.8 26.1 41.1 25.7 3.1 Legal commitments 13.2 12.5 10.8 10.1 4.6 Standing payment orders 11.5 18.1 11.5 2.1 1.8 National Savings Bond 0.9 0.9 0.9 0.9 0.9
Source: Chadian authorities.
Present value of external debt in percent of:GDP Exports Revenue
External debt service in percent of:Exports Revenue
30100 200
1525
Text Table 3. External Public Debt Burden Thresholds for "Weak PolicyPerformers" under the Debt Sustainability Framework

CHAD 2011 ARTICLE IV REPORT—DEBT SUSTAINABILITY ANALYSIS
INTERNATIONAL MONETARY FUND 5
DSA BASELINE SCENARIO 7. Chad’s external debt ratio in current value terms deteriorated in 2010 by less than expected, due to higher-than-expected GDP growth and lower-than-expected recourse to external borrowing. Real GDP growth reached 13 percent and higher oil prices strengthened exports and government revenues. The non-oil primary deficit in 2010, at 31 percent of non-oil GDP, was larger than in 2009 and exceeded the 2010 supplementary budget target by nearly 3 points of non-oil GDP. However, higher-than-expected oil revenues led to a smaller-than-expected overall deficit. In the event, the authorities drew only two-thirds of the $300 million nonconcessional budget support loan from Libyan Foreign Bank.
8. The central feature of Chad’s medium-and long-term macroeconomic outlook remains the steady decline of oil production over the twenty-year projection period. Production at the Doba oil field started in 2003, reached its peak of 61 million barrels in 2004, with annual output set to decline steadily to a negligible level beyond 2030. Long-term oil export projections are based on this gradual depletion of the Doba field. Chad’s oil trades below the international reference price, reflecting a quality discount and transport cost. For the medium term (to 2016) the price of Chadian oil is assumed to drop from $99.8 per barrel (all discounts included) to about $92 per barrel in 2015–16, in line with the trend projected in the IMF’s World Economic Outlook (WEO) average oil price; from 2017 onward, the price is assumed to increase 3 percent per year in U.S. dollar terms
(consistent with the assumption used by the IMF in long-term projections for other sub-Saharan African countries). Production has begun at a second oil field, Bongor, which is only one-third the size of the Doba oil field. Bongor produces crude oil at a rate of 20,000 barrels per day; however its output is not for export, but feedstock for the oil refinery, the output of which is projected to reduce Chad’s imports of refined petroleum products.
9. The baseline scenario assumes a fiscal adjustment to offset the decline in oil revenues. Dwindling oil revenues will cause a steady decline of total government revenue from 44 percent of non-oil GDP in 2011 to 24 percent in 2030. The adjustment (resulting in a steady reduction of non-oil primary deficit to about 5 percent in 2030) is assumed to be achieved by increased non-oil revenue effort, reduction and subsequent stabilization of investment outlays at about 14 percent of non-oil GDP, and cuts in recurrent spending, notably exceptional security transfers and transfers to cover losses of state-owned enterprises.
10. The authorities recognize the downward sloping profile of oil revenues and see the need for fiscal adjustment. Their draft medium-term fiscal framework (through 2014) features a similar degree of fiscal adjustment as the baseline scenario, but a significantly better end-2011 fiscal position, higher oil revenues, and a strong improvement in non-oil revenues, all of which enable a higher level of domestically-financed investment.

2011 ARTICLE IV REPORT—DEBT SUSTAINABILITY ANALYSIS CHAD
6 INTERNATIONAL MONETARY FUND
Box 1. Baseline Macroeconomic Assumptions (2011–30)
The primary determinant of real GDP growth in the baseline scenario is the steady decline of annual oil production over the next twenty years. Non-oil GDP growth is projected to increase in the short term, as major projects come on line (see below), and is assumed to stabilize at 3.7 percent in the long term, with the help of a sustained level of domestic public investment and private investment in the non-oil sector.
Inflation stabilizes at a level consistent with the CEMAC convergence criterion of maximum 3 percent per year.
The external current account remains in significant deficit until the new pipeline and refinery (Chad-China joint-venture) are completed (they are expected to operate for a full year in 2012), at which time construction-related and refined petroleum product imports drop significantly. Similarly, strong FDI, associated with the refinery and other investment projects (power station and cement factory), slows upon their completion in 2012.
The fiscal outlook is dominated by dwindling oil revenues and limited financing options. The authorities adjust by increasing non-oil revenue effort, eliminating exceptional security spending and subsidies to public enterprises, while maintaining an appropriately high level of investment and social spending to ensure steady growth in non-oil economy and poverty reduction.
The external financing assumptions are based on historical averages; 5 percent of non-oil GDP, 70 percent grants and 30 percent in loans from official multilateral and bilateral creditors. The average grant element of borrowing declines over time, as the mix of terms changes with diminishing reliance on IDA-type loans. In the absence of an IMF arrangement, there is no target date for the HIPC completion point, and the baseline does not take into account HIPC and MDRI debt relief for which Chad is eligible.
The domestic financing assumptions include reimbursement of BEAC statutory advances by 2014 (as scheduled), no accrual of domestic arrears, and issuance of domestic debt instruments (with an average maturity of one year), the stock of which reaches about 11 percent of GDP by 2030.
2010 2011 2012 2013 2014 2015 2010–15 2016–30
Est. Avg. Avg.
Real GDP growth (percent per year) 13.0 3.8 6.9 3.2 3.2 3.3 5.6 2.8
Oil 6.4 -1.8 10.4 -4.9 -4.4 -4.5 0.2 -5.2Non-oil 15.0 5.3 6.0 5.3 5.0 5.0 6.9 3.7
Consumer price inflation (percent per year) -2.1 2.0 5.0 3.0 3.0 3.0 2.3 3.0External current account balance (percent of GDP) -34.6 -23.9 -16.9 -11.7 -11.0 -10.1 -18.0 -7.4
Government revenue and grants 41.8 46.7 41.5 37.6 36.6 34.1 39.7 29.1Of which : oil revenue 26.5 33.4 26.3 21.9 20.7 17.9 24.4 8.3Of which : grants 2.7 2.8 3.5 3.5 3.5 3.5 3.2 3.5
Government expenditure (commitment basis) 50.4 42.1 36.1 35.7 34.1 32.8 38.5 31.0Overall fiscal balance (incl. grants; cash basis) -6.7 6.6 4.1 2.1 2.5 1.3 1.7 -1.7Non-oil primary fiscal bal. (excl. grants; commitment -31.5 -26.2 -19.2 -18.4 -16.6 -15.1 -21.2 -8.3
Memorandum item:Government deposits (in percent of non-oil GDP) 4.1 8.6 11.3 11.7 12.0 12.2 10.0 7.8Chadian crude oil price (US$/barrel) 73.6 99.8 98.8 95.3 93.0 92.3 92.1 115.6
Source: Chadian authorities; and staff estimates and projections.
(In percent of non-oil GDP)

CHAD 2011 ARTICLE IV REPORT—DEBT SUSTAINABILITY ANALYSIS
INTERNATIONAL MONETARY FUND 7
EXTERNAL DEBTBaseline
11. The evolution of external debt is driven by the volume of project loans (Box 1). Going forward, new borrowing is expected to comprise funding from IDA, AfDB, other multilateral lenders, Paris Club and non-Paris Club lenders.3 Absent a substantial improvement in macroeconomic and public financial management performance, traditional donors (multilaterals and Paris Club) are expected to continue to provide concessional project loans at roughly the same nominal level as in the last few years, with an increasing share of project lending by non-Paris Club bilateral creditors. The concessionality of borrowing is projected to decline steadily over the 20-year horizon (Figure 1a).
12. Under the baseline scenario, the present value of external public- and publicly-guaranteed debt remains well below the 30 percent of GDP threshold, declining steadily from 22 percent to 12 percent in 2030 (Figure 1b). With the expected steady decline in oil exports over the projection period, both debt stock and debt service rise steadily relative to exports, but remain well below their respective thresholds (Figures 1c and 1e). Relative to government revenue, the debt stock and debt service rise from 2011 to 2015–16, when amortization of the nonconcessional loans disbursed in 2010 and 2011 begins. Again, the baseline remains well below the respective thresholds (Figures 1d and 1f).
3 The terms of IDA, AfDB and other multilateral loans are concessional, with grant elements ranging from 35 percent to 52 percent.
Alternative Scenarios and Stress Tests
13. A continuation of current policies would quickly bring the external public- and publicly-guaranteed (PPG) debt burden above the thresholds. If the authorities were to continue to run a current account deficit far higher than the foreign direct investment (FDI) inflows in the oil sector, as they did in 2009, external PPG debt would breach two of the five of the sustainability thresholds (Historical scenario in ,Figures 1b, 1c, 1d and 1e; and Alternative Scenario A1 in Table 2a).
14. Chad’s external debt burden indicators are highly sensitive to an oil price shock. Across all indicative debt burden thresholds, the most extreme shock is a drop in export growth in 2011—12 proportional to a two-standard-deviation lower oil price (Most extreme shock in Figure 1 and B2 Bound Test in Table 2a). Such a shock would send the debt on a path that would breach all indicative debt burden thresholds.
15. Nonconcessional borrowing for contemplated major capital projects would increase the risk of debt distress. The authorities have signed letters of intent with Chinese companies for construction of a new airport (estimated cost $1 billion) and an East-West railroad ($7.5 billion). If the projects were undertaken over and above the baseline level of spending, executed and financed over 10 years, and did not significantly accelerate growth, the debt path would breach the 30 percent of GDP threshold in 2015 and peak in 2023, implying an increased risk of debt distress.4 4 These projects are tentative, and therefore not in the baseline. Also, their impact and cost-effectiveness relative to alternative investment projects has not been established; no growth impact is assumed.

2011 ARTICLE IV REPORT—DEBT SUSTAINABILITY ANALYSIS CHAD
8 INTERNATIONAL MONETARY FUND
This would occur under either the typical terms (33 percent grant element) or most concessional
terms (52 percent grant element).
PUBLIC DEBTBaseline
16. The inclusion of domestic debt does not alter the assessment of Chad’s debt sustainability. Given the size of Chad’s domestic debt, the baseline adjustment in the non-oil primary balance, and expected oil revenues, the public debt sustainability analysis broadly parallels the external debt sustainability analysis. The domestic debt component increases from 7½ percent of GDP in 2010 to 11¼ percent of GDP in 2030, reflecting the increased reliance on domestic debt financing.
17. Staffs recommend that the authorities begin to issue short-term treasury paper on a regular basis, to alleviate liquidity constraints and
demonstrate leadership in the development of a regional financial market. The authorities are eager to proceed, as soon as technically feasible, to issue instruments with maturities shorter than one year.5
Alternative Scenarios and Stress Tests
18. The analysis of total public debt sustainability confirms that the recent (2010) fiscal stance is not sustainable. Even with ample oil revenues, and assuming that financing could
5 Domestic borrowing would include the contemplated issuance of short-term instruments on the regional CEMAC market, but their share of total domestic borrowing is not identified.
0
20
40
60
80
100
2010 2015 2020 2025 2030
Oil price shock
Railroad/airport
-nonconcessional
-concessional
Threshold
Baseline
Present Value of Public and Publicly-Guaranteed External Debt
(Percent of GDP)
Sources: Chadian authorities; and staff estimates and projections.

CHAD 2011 ARTICLE IV REPORT—DEBT SUSTAINABILITY ANALYSIS
INTERNATIONAL MONETARY FUND 9
be secured, the resulting debt path would increase steeply, leading to an unmanageable debt and debt-service burden (Fixed Primary Balance Scenario in Figure 2). A temporary shock
to real GDP growth in 2011–12 would also impair public debt sustainability (Most Extreme Shock in Figure 2 and Bound Test B1 in Table 2b).
THE AUTHORITIES’ VIEWS19. The authorities have expressed renewed determination to resume the path to debt relief. They urged staffs to recognize Chad’s special post-conflict circumstances and recent progress, and to accelerate the remaining steps toward completion point. The authorities welcome closer collaboration with staffs in designing their long-term growth strategy,
including a framework for managing major capital projects and related financing. That said, the authorities continue to emphasize that public investment is critical to growth, and that debt relief is needed to create fiscal space for additional development spending (including foreign-financed).
DEBT DISTRESS CLASSIFICATION AND CONCLUSIONS
20. It is staffs’ view that, based on external debt burden indicators, Chad’s risk of debt distress is moderate. The public DSA suggests that under the baseline scenario Chad’s overall public sector debt dynamics are sustainable, in light of the current size, and expected evolution, of the domestic debt stock. This year’s DSA yields roughly the same debt dynamics under the baseline scenario and sensitivity to shocks as last year’s, but stress test results remain a source of concern.
21. Progress toward the HIPC completion point would substantially reduce Chad’s debt vulnerabilities, as HIPC Initiative and MDRI debt relief would cut external debt in half. Staffs are supportive of the authorities’ expressed
determination to return to the path to debt relief, including successfully implementing an IMF-supported program. In this context, staffs continue to emphasize the need for stronger public financial management and a more prudent fiscal policy, both to minimize the risk of debt distress directly and as a basis for an IMF-supported program. The staffs urged the authorities to subject major public investment proposals to careful, independent evaluation, and to avoid nonconcessional borrowing. Better coordination of Chadian agencies, to collect and disseminate comprehensive, timely and reliable debt statistics, would facilitate the conduct of sustainability analysis.

2011 ARTICLE IV REPORT—DEBT SUSTAINABILITY ANALYSIS CHAD
10 INTERNATIONAL MONETARY FUND
Figure 1. Chad: Indicators of Public- and Publicly-Guaranteed External Debt under Alternative Scenarios, 2010–30 1
Sources: Country authorities; and staff estimates and projections. 1 The most extreme stress test is a reduction in export growth proportional to a two standard devision drop in the oil price.
Sources: Country authorities; and staff estimates and projections.
0
5
10
15
20
25
30
2010 2015 2020 2025 2030
Baseline Historical scenario
Most extreme shock 1/ Threshold
f.Debt service-to-revenue ratio
-10
-5
0
5
10
15
20
25
30
35
-2
0
2
4
6
8
10
2010 2015 2020 2025 2030
Rate of Debt Accumulation
Grant-equivalent financing (% of GDP)
Grant element of new borrowing (% right scale)
a. Debt Accumulation
0
10
20
30
40
50
60
70
80
2010 2015 2020 2025 2030
b.PV of debt-to GDP ratio
0
50
100
150
200
250
300
350
400
450
500
2010 2015 2020 2025 2030
c.PV of debt-to-exports ratio
0
50
100
150
200
250
300
350
2010 2015 2020 2025 2030
d.PV of debt-to-revenue ratio
0
10
20
30
40
50
60
2010 2015 2020 2025 2030
e.Debt service-to-exports ratio

CHAD 2011 ARTICLE IV REPORT—DEBT SUSTAINABILITY ANALYSIS
INTERNATIONAL MONETARY FUND 11
Figure 2. Chad: Indicators of Public Debt under Alternative Scenarios, 2010–30 1
Sources: Country authorities; and staff estimates and projections. 1 The most extreme stress test is a reduction in export growth proportional to a two standard devision drop in the oil price. 2 Revenues are defined inclusive of grants.
0
50
100
150
200
250
300
350
400
2010 2012 2014 2016 2018 2020 2022 2024 2026 2028 2030
PV of Debt-to-Revenue Ratio 2
0
20
40
60
80
100
120
2010 2012 2014 2016 2018 2020 2022 2024 2026 2028 2030
PV of Debt-to-GDP Ratio
0
5
10
15
20
25
30
2010 2012 2014 2016 2018 2020 2022 2024 2026 2028 2030
Baseline Fix Primary Balance Most extreme shock Growth Historical scenario
Debt Service-to-Revenue Ratio 2

2011 ARTICLE IV REPORT—
DEBT SU
STAINABILITY A
NALYSIS CH
AD
12 IN
TERNATIO
NAL M
ON
ETARY FUN
D
Historical StandardAverage Deviation 2010–2015 2016–2030
2007 2008 2009 2010 2011 2012 2013 2014 2015 Average 2020 2030 Average
External debt (nominal) 23.6 20.9 23.0 25.0 23.7 23.9 23.2 22.2 21.3 17.2 12.5Change in external debt -3.6 -2.7 2.1 2.0 -1.3 0.2 -0.7 -0.9 -0.9 -0.9 -0.4Identified net debt-creating flows -2.2 -9.9 5.4 9.4 3.5 2.9 0.6 1.2 1.4 3.6 3.6
Non-interest current account deficit 10.4 -3.4 16.9 23.5 29.1 34.2 23.5 16.4 11.2 10.6 9.7 17.6 8.6 5.2 7.3Deficit in balance of goods and services -2.5 -5.9 18.8 34.0 20.9 13.0 9.0 8.5 8.7 10.2 9.8
Exports 54.8 54.0 44.1 45.0 50.7 47.2 40.8 37.0 34.1 26.7 18.3Imports 52.3 48.1 62.9 79.0 71.6 60.2 49.8 45.5 42.8 36.8 28.1
Net current transfers (negative = inflow) -4.0 -6.0 -7.3 -4.9 1.1 -7.5 -7.5 -7.9 -8.2 -8.0 -8.1 -8.7 -7.8 -8.4o/w official -2.5 -1.5 -2.4 -0.5 -0.6 -0.6 -0.6 -0.7 -0.7 -0.8 -0.9
Other current account flows (negative = net inflow) 16.9 8.5 5.4 7.7 10.1 11.3 10.4 10.1 9.1 7.1 3.2Net FDI (negative = inflow) -10.1 -2.8 -15.6 -15.6 14.1 -22.7 -19.5 -12.4 -10.3 -9.1 -8.0 -13.7 -4.9 -1.6 -3.9Endogenous debt dynamics 2 -2.5 -3.7 4.2 -2.1 -0.5 -1.2 -0.3 -0.3 -0.3 -0.1 -0.1
Contribution from nominal interest rate 0.2 0.2 0.4 0.4 0.3 0.5 0.5 0.5 0.4 0.3 0.3Contribution from real GDP growth 0.0 0.1 -0.2 -2.5 -0.8 -1.6 -0.7 -0.7 -0.7 -0.5 -0.4Contribution from price and exchange rate changes -2.7 -4.0 4.0 … … … … … … … …
Residual 3 -1.3 7.2 -3.3 -7.4 -4.8 -2.7 -1.3 -2.1 -2.3 -4.5 -4.0o/w exceptional financing 0.0 0.0 0.0 0.0 0.0 0.0 0.0 0.0 0.0 0.0 0.0
PV of PPG external debt ... ... 17.1 21.6 21.2 21.5 20.9 20.2 19.4 16.0 12.4In percent of exports ... ... 38.8 48.1 41.7 45.5 51.3 54.6 57.1 59.9 67.6In percent of government revenues ... ... 105.9 91.5 74.3 82.0 85.6 82.6 83.8 70.5 53.1
Debt service-to-exports ratio (in percent) 1.5 3.5 2.1 2.6 2.1 2.5 4.1 4.6 4.8 5.9 6.8PPG debt service-to-exports ratio (in percent) 1.5 3.5 2.1 2.6 2.1 2.5 4.1 4.6 4.8 5.9 6.8PPG debt service-to-revenue ratio (in percent) 3.5 7.1 5.7 5.0 3.8 4.4 6.8 6.9 7.0 7.0 5.3Total gross financing need (Billions of U.S. dollars) 0.1 -0.4 0.2 1.1 0.5 0.5 0.3 0.3 0.4 0.7 1.2Non-interest current account deficit that stabilizes debt ratio 14.0 -0.7 14.8 32.3 24.8 16.2 11.9 11.5 10.6 9.4 5.6
Key macroeconomic assumptions
Real GDP growth (in percent) 0.2 -0.4 0.9 7.6 10.7 13.0 3.8 6.9 3.2 3.2 3.3 5.6 2.7 3.4 2.8GDP deflator in US dollar terms (change in percent) 11.1 20.1 -16.1 9.5 13.1 6.6 10.0 -5.2 -0.8 0.1 0.5 1.9 2.4 3.8 2.8Effective interest rate (percent) 4 0.9 1.0 1.4 1.1 0.2 1.9 1.5 1.9 2.0 2.0 2.1 1.9 2.0 2.7 2.2Growth of exports of G&S (US dollar terms, in percent) 8.0 17.9 -30.9 43.8 87.3 23.0 28.7 -5.7 -11.7 -6.3 -4.3 4.0 0.1 5.1 1.4Growth of imports of G&S (US dollar terms, in percent) 12.8 10.1 10.6 32.1 52.3 51.4 3.5 -14.8 -15.5 -5.5 -2.2 2.8 1.9 6.0 2.8Grant element of new public sector borrowing (in percent) ... ... ... ... ... 8.0 1.2 30.7 29.8 22.8 21.6 19.0 15.1 7.3 12.8Government revenues (excluding grants, in percent of GDP) 22.8 26.4 16.1 23.6 28.5 26.2 24.4 24.4 23.2 22.6 23.3 22.8Aid flows (in Billions of US dollars) 5 0.1 0.1 0.3 0.3 0.3 0.3 0.4 0.4 0.4 0.6 1.2
o/w Grants 0.1 0.1 0.2 0.1 0.2 0.2 0.3 0.3 0.3 0.4 0.8o/w Concessional loans 0.0 0.0 0.1 0.12 0.11 0.10 0.11 0.12 0.13 0.18 0.36
Grant-equivalent financing (in percent of GDP) 6 ... ... ... 2.1 1.8 2.7 2.8 2.8 2.9 3.2 3.4 3.2Grant-equivalent financing (in percent of external financing) 6 ... ... ... 28.4 39.4 81.3 79.1 77.0 76.6 74.7 72.4 74.0
Memorandum items:Nominal GDP (Billions of US dollars) 7.0 8.4 7.1 8.6 9.8 9.9 10.1 10.5 10.9 13.2 24.8Nominal dollar GDP growth 11.3 19.6 -15.4 20.5 14.1 1.3 2.3 3.3 3.8 7.6 5.2 7.3 5.7PV of PPG external debt (in Billions of US dollars) 1.3 1.8 2.1 2.1 2.1 2.1 2.1 2.1 3.1(PVt-PVt-1)/GDPt-1 (in percent) 8.1 2.8 0.3 -0.1 0.0 0.0 1.8 0.1 0.6 0.4
Sources: Country authorities; and staff estimates and projections. 01 All of Chad's external debt is public.2 Derived as [r - g - ρ(1+g)]/(1+g+ρ+gρ) times previous period debt ratio, with r = nominal interest rate; g = real GDP growth rate, and ρ = growth rate of GDP deflator in U.S. dollar terms.
4 Current-year interest payments divided by previous period debt stock. 5 Defined as grants, concessional loans, and debt relief.6 Grant-equivalent financing includes grants provided directly to the government and through new borrowing (difference between the face value and the PV of new debt).
Table 1a.: External Debt Sustainability Framework, Baseline Scenario, 2007–2030 1
(In percent of GDP, unless otherwise indicated)
ProjectionsActual
3 Includes transfers not in the current account, changes in gross reserves, and valuation adjustments. For projections also includes contribution from price and exchange rate changes.

CHAD 2011 ARTICLE IV REPORT—DEBT SUSTAINABILITY ANALYSIS
CHA
D 2011 ARTICLE IV REPO
RT—D
EBT SUSTA
INABILITY AN
ALYSIS
INTERN
ATION
AL MO
NETARY FU
ND
13
Estimate
2007 2008 2009 AverageStandard Deviation 2010 2011 2012 2013 2014 2015
2010–15 Average 2020 2030
2016–30 Average
Public sector debt 1 26.0 23.6 30.5 32.6 29.3 29.3 27.8 25.8 24.5 23.3 23.8o/w foreign-currency denominated 23.6 20.9 23.0 25.0 23.7 23.9 23.2 22.2 21.3 17.2 12.5
Change in public sector debt -3.6 -2.4 6.9 2.1 -3.2 -0.1 -1.5 -2.0 -1.3 -0.3 -0.3Identified debt-creating flows -6.2 -5.6 11.1 0.5 -6.8 -3.8 -2.1 -2.8 -2.0 0.7 -0.2
Primary deficit -3.4 -4.8 9.4 2.3 4.8 4.5 -3.6 -4.4 -2.0 -2.5 -1.6 -1.6 1.3 0.6 1.1Revenue and grants 24.2 27.9 19.6 25.3 30.3 28.6 26.9 27.0 25.8 25.6 26.6
of which: grants 1.5 1.5 3.5 1.6 1.8 2.4 2.5 2.6 2.6 3.0 3.3Primary (noninterest) expenditure 20.8 23.1 29.0 29.8 26.7 24.2 24.9 24.5 24.2 27.0 27.1
Automatic debt dynamics -2.8 -0.9 1.7 -3.8 -3.2 0.6 -0.1 -0.3 -0.4 -0.6 -0.8Contribution from interest rate/growth differential -0.5 -0.4 -3.4 -6.6 0.5 0.4 -0.5 -0.7 -0.7 -0.6 -0.8
of which: contribution from average real interest rate -0.5 -0.5 -3.2 -3.1 1.7 2.3 0.4 0.2 0.1 0.0 0.0of which: contribution from real GDP growth -0.1 0.1 -0.2 -3.5 -1.2 -1.9 -0.9 -0.9 -0.8 -0.6 -0.8
Contribution from real exchange rate depreciation -2.2 -0.5 5.1 2.8 -3.7 0.2 0.4 0.4 0.3 ... ...Other identified debt-creating flows 0.0 0.0 0.0 -0.2 0.0 0.0 0.0 0.0 0.0 0.0 0.0
Privatization receipts (negative) 0.0 0.0 0.0 -0.2 0.0 0.0 0.0 0.0 0.0 0.0 0.0Recognition of implicit or contingent liabilities 0.0 0.0 0.0 0.0 0.0 0.0 0.0 0.0 0.0 0.0 0.0Debt relief (HIPC and other) 0.0 0.0 0.0 0.0 0.0 0.0 0.0 0.0 0.0 0.0 0.0Other (specify, e.g. bank recapitalization) 0.0 0.0 0.0 0.0 0.0 0.0 0.0 0.0 0.0 0.0 0.0
Residual, including asset changes 2.6 3.3 -4.2 1.6 3.6 3.7 0.6 0.8 0.7 -1.0 -0.1
Other Sustainability IndicatorsPV of public sector debt 2.4 2.7 24.6 29.2 26.8 26.9 25.5 23.7 22.6 22.1 23.7
o/w foreign-currency denominated 0.0 0.0 17.1 21.6 21.2 21.5 20.9 20.2 19.4 16.0 12.4o/w external ... ... 17.1 21.6 21.2 21.5 20.9 20.2 19.4 16.0 12.4
PV of contingent liabilities (not included in public sector debt) ... ... ... ... ... ... ... ... ... ... ...
Gross financing need 2 -0.8 -2.2 12.4 6.5 -0.1 -1.2 2.6 2.6 3.5 8.4 12.9PV of public sector debt-to-revenue and grants ratio (in percent) 9.7 9.6 125.3 115.8 88.6 94.1 94.9 87.9 87.5 86.1 89.3PV of public sector debt-to-revenue ratio (in percent) 10.3 10.2 152.1 123.7 94.2 102.6 104.5 97.1 97.4 97.5 102.0
o/w external 3 … … 105.9 91.5 74.3 82.0 85.6 82.6 83.8 70.5 53.1
Debt service-to-revenue and grants ratio (in percent) 4 7.7 6.8 8.8 5.9 11.2 9.1 11.4 11.2 11.1 6.9 6.7
Debt service-to-revenue ratio (in percent) 4 8.1 7.2 10.7 6.3 11.9 9.9 12.6 12.4 12.4 7.8 7.6Primary deficit that stabilizes the debt-to-GDP ratio 0.2 -2.4 2.6 2.4 -0.4 -4.3 -0.5 -0.5 -0.3 1.6 0.9
Key macroeconomic and fiscal assumptionsReal GDP growth (in percent) 0.2 -0.4 0.9 7.6 10.7 13.0 3.8 6.9 3.2 3.2 3.3 5.6 2.7 3.4 2.8Average nominal interest rate on forex debt (in percent) 0.9 1.0 1.4 1.1 0.2 1.9 1.5 1.9 2.0 2.0 2.1 1.9 2.0 2.7 2.2Average real interest rate on domestic debt (in percent) 2.0 -9.0 18.6 2.3 11.8 -5.8 1.6 9.5 3.8 3.2 3.1 ... 1.2 1.3 ...Real exchange rate depreciation (in percent, + indicates depreciation) -8.4 -2.3 30.0 -4.1 14.0 15.9 ... ... ... ... ... ... ... ... ...Inflation rate (GDP deflator, in percent) 1.8 11.8 -11.4 6.2 9.3 11.9 2.3 -5.4 0.1 1.0 1.3 1.9 2.4 3.8 2.9Growth of real primary spending (deflated by GDP deflator, in percent) 0.3 0.1 0.3 0.1 0.1 0.2 -0.1 0.0 0.1 0.0 0.0 0.0 0.0 0.0 0.0Grant element of new external borrowing (in percent) ... ... ... … … 8.0 1.2 30.7 29.8 22.8 21.6 19.0 15.1 7.3 ...
Sources: Country authorities; and staff estimates and projections.1 Gross debt of the central government including debts guaranteed for, or assumed from, state-owned enterprises.2 Gross financing need is defined as the primary deficit plus debt service plus the stock of short-term debt at the end of the last period. 3 Revenues excluding grants.4 Debt service is defined as the sum of interest and amortization of medium and long-term debt.
Table 1b. Chad: Public Sector Debt Sustainability Framework, Baseline Scenario, 2007–2030(In percent of GDP, unless otherwise indicated)
Actual Projections

2011 ARTICLE IV REPORT—DEBT SUSTAINABILITY ANALYSIS CHAD
14 INTERNATIONAL MONETARY FUND
2010 2011 2012 2013 2014 2015 2016 2017 2018 2019 2020 2030
Baseline 22 21 21 21 20 19 18 17 17 17 16 12
A. Alternative Scenarios
A1. Key variables at their historical averages in 2010–2030 1 22 24 24 27 29 31 31 32 32 32 31 28A2. New public sector loans on less favorable terms in 2010–2030 2 22 22 22 22 21 21 20 19 20 19 19 17
B. Bound Tests
B1. Real GDP growth at historical average minus one standard deviation in 2011–2012 22 23 25 25 24 23 22 21 20 20 19 15
B2. Export value growth at baseline minus a one-standard-deviation lower oil price in 2011 3 22 45 68 68 67 67 65 64 63 59 54 18B3. US dollar GDP deflator at historical average minus one standard deviation in 2011–2012 22 24 24 23 23 22 21 20 19 19 18 14
B4. Net non-debt creating flows at historical average minus one standard deviation in 2011–2012 4 22 41 55 54 54 53 52 51 50 46 43 16B5. Combination of B1-B4 using one-half standard deviation shocks 22 49 63 62 62 61 60 58 58 53 49 18B6. One-time 30 percent nominal depreciation relative to the baseline in 2011 5 22 29 29 29 28 27 25 24 24 23 22 17
Baseline 48 42 45 51 55 57 58 59 59 59 60 68
A. Alternative Scenarios
A1. Key variables at their historical averages in 2010–2030 1 48 48 52 67 78 90 99 108 110 114 117 154A2. New public sector loans on less favorable terms in 2010–2030 2 48 42 47 53 57 61 64 65 66 68 70 91
B. Bound Tests
B1. Real GDP growth at historical average minus one standard deviation in 2011–2012 48 42 45 51 54 57 58 58 59 59 60 67
B2. Export value growth at baseline minus a one-standard-deviation lower oil price in 2011 3 48 185 306 355 388 416 442 456 457 446 431 209B3. US dollar GDP deflator at historical average minus one standard deviation in 2011–2012 48 42 45 51 54 57 58 58 59 59 60 67
B4. Net non-debt creating flows at historical average minus one standard deviation in 2011–2012 4 48 80 116 134 146 156 165 170 170 166 161 89B5. Combination of B1-B4 using one-half standard deviation shocks 48 114 154 178 194 208 220 227 226 221 214 112B6. One-time 30 percent nominal depreciation relative to the baseline in 2011 5 48 42 45 51 54 57 58 58 59 59 60 67
Baseline 92 74 82 86 83 84 83 80 78 73 70 53
A. Alternative Scenarios
A1. Key variables at their historical averages in 2010–2030 1 92 85 94 111 119 132 141 147 145 140 138 121A2. New public sector loans on less favorable terms in 2010–2030 2 92 76 84 89 87 90 90 88 87 84 82 72
B. Bound Tests
B1. Real GDP growth at historical average minus one standard deviation in 2011–2012 92 80 96 101 97 99 97 94 91 86 83 62
B2. Export value growth at baseline minus a one-standard-deviation lower oil price in 2011 3 92 158 259 278 276 287 294 292 283 257 238 77B3. US dollar GDP deflator at historical average minus one standard deviation in 2011–2012 92 86 92 96 92 94 93 89 87 82 79 59
B4. Net non-debt creating flows at historical average minus one standard deviation in 2011–2012 4 92 143 209 223 221 229 234 232 223 204 190 70B5. Combination of B1-B4 using one-half standard deviation shocks 92 171 239 256 253 263 269 267 257 234 217 76B6. One-time 30 percent nominal depreciation relative to the baseline in 2011 5 92 103 112 117 113 115 113 110 106 100 96 73
Table 2a. Chad: Sensitivity Analysis for Key Indicators of Public and Publicly Guaranteed External Debt, 2010–2030(In percent)
Projections
PV of debt-to GDP ratio
PV of debt-to-exports ratio
PV of debt-to-revenue ratio

CHAD 2011 ARTICLE IV REPORT—DEBT SUSTAINABILITY ANALYSIS
INTERNATIONAL MONETARY FUND 15
2010 2011 2012 2013 2014 2015 2016 2017 2018 2019 2020 2030
Baseline 3 2 2 4 5 5 6 6 6 6 6 7A. Alternative Scenarios
A1. Key variables at their historical averages in 2010–2030 1 3 2 2 3 4 4 5 5 5 5 6 9A2. New public sector loans on less favorable terms in 2010–2030 2 3 2 2 3 3 4 4 4 5 5 5 6
B. Bound Tests
B1. Real GDP growth at historical average minus one standard deviation in 2011–2012 3 2 2 4 5 5 6 6 6 6 6 7
B2. Export value growth at baseline minus a one-standard-deviation lower oil price in 2011 3 3 4 9 16 18 19 23 22 35 48 49 34B3. US dollar GDP deflator at historical average minus one standard deviation in 2011–2012 3 2 2 4 5 5 6 6 6 6 6 7
B4. Net non-debt creating flows at historical average minus one standard deviation in 2011–2012 4 3 2 4 7 7 8 9 9 14 18 18 13B5. Combination of B1-B4 using one-half standard deviation shocks 3 3 5 9 9 10 12 12 19 24 24 16B6. One-time 30 percent nominal depreciation relative to the baseline in 2011 5 3 2 2 4 5 5 6 6 6 6 6 7
Baseline 5 4 4 7 7 7 9 8 8 7 7 5A. Alternative Scenarios
A1. Key variables at their historical averages in 2010–2030 1 5 4 4 6 6 6 7 6 6 6 7 7A2. New public sector loans on less favorable terms in 2010–2030 2 5 4 4 4 5 6 6 6 6 6 6 5
B. Bound Tests
B1. Real GDP growth at historical average minus one standard deviation in 2011–2012 5 4 5 8 8 8 10 9 9 8 8 6
B2. Export value growth at baseline minus a one-standard-deviation lower oil price in 2011 3 5 4 7 13 13 13 15 14 22 28 27 12B3. US dollar GDP deflator at historical average minus one standard deviation in 2011–2012 5 4 5 8 8 8 10 9 8 8 8 6
B4. Net non-debt creating flows at historical average minus one standard deviation in 2011–2012 4 5 4 7 11 11 11 13 13 19 22 21 10B5. Combination of B1-B4 using one-half standard deviation shocks 5 4 8 12 12 13 15 14 22 25 25 11B6. One-time 30 percent nominal depreciation relative to the baseline in 2011 5 5 5 6 9 9 10 12 11 10 10 10 7
Memorandum item:Grant element assumed on residual financing (i.e., financing required above baseline) 6 11 11 11 11 11 11 11 11 11 11 11 11
Sources: Country authorities; and staff estimates and projections.
1 Variables include real GDP growth, growth of GDP deflator (in U.S. dollar terms), non-interest current account in percent of GDP, and non-debt creating flows. 2 Assumes that the interest rate on new borrowing is by 2 percentage points higher than in the baseline., while grace and maturity periods are the same as in the baseline.
4 Includes official and private transfers and FDI.5 Depreciation is defined as percentage decline in dollar/local currency rate, such that it never exceeds 100 percent.6 Applies to all stress scenarios except for A2 (less favorable financing) in which the terms on all new financing are as specified in footnote 2.
Debt service-to-exports ratio
Debt service-to-revenue ratio
Table 2a. Chad: Sensitivity Analysis for Key Indicators of Public and Publicly Guaranteed External Debt, 2010–2030 (continued)(In percent)
Projections
3 Exports values are assumed to remain permanently at the lower level, but the current account as a share of GDP is assumed to return to its baseline level after the shock (implicitly assuming an

2011 ARTICLE IV REPORT—DEBT SUSTAINABILITY ANALYSIS CHAD
16 INTERNATIONAL MONETARY FUND
Table 2b. Chad: Sensitivity Analysis for Key Indicators of Public Debt 2010–2030
2010 2011 2012 2013 2014 2030
Baseline 29 27 27 26 24 24
A. Alternative Scenarios
A1. Real GDP growth and primary balance are at historical averages 29 32 38 40 41 36A2. Primary balance is unchanged from 2010 29 35 44 50 55 97A3. Permanently lower GDP growth 1 29 28 30 31 32 173
B. Bound Tests
B1. Real GDP growth is at historical average minus one standard deviations in 2011–2012 29 31 39 42 44 97B2. Primary balance is at historical average minus one standard deviations in 2011–2012 29 38 49 48 47 42B3. Combination of B1-B2 using one half standard deviation shocks 29 36 47 47 47 61B4. One-time 30 percent real depreciation in 2011 29 34 35 33 32 31B5. 10 percent of GDP increase in other debt-creating flows in 2011 29 37 37 36 34 32
Baseline 116 89 94 95 88 89
A. Alternative Scenarios
A1. Real GDP growth and primary balance are at historical averages 116 105 134 149 154 146A2. Primary balance is unchanged from 2010 116 115 154 184 203 366A3. Permanently lower GDP growth 1 116 93 105 115 119 607
B. Bound Tests
B1. Real GDP growth is at historical average minus one standard deviations in 2011–2012 116 101 134 153 161 357B2. Primary balance is at historical average minus one standard deviations in 2011–2012 116 124 173 180 173 157B3. Combination of B1-B2 using one half standard deviation shocks 116 117 163 175 173 228B4. One-time 30 percent real depreciation in 2011 116 113 121 124 117 118B5. 10 percent of GDP increase in other debt-creating flows in 2011 116 122 130 134 127 120
Baseline 6 11 9 11 11 7
A. Alternative Scenarios
A1. Real GDP growth and primary balance are at historical averages 6 11 10 12 12 10A2. Primary balance is unchanged from 2010 6 11 10 14 15 27A3. Permanently lower GDP growth 1 6 11 10 12 13 33
B. Bound Tests
B1. Real GDP growth is at historical average minus one standard deviations in 2011–2012 6 12 11 14 15 24B2. Primary balance is at historical average minus one standard deviations in 2011–2012 6 11 11 15 15 14B3. Combination of B1-B2 using one half standard deviation shocks 6 11 11 15 15 18B4. One-time 30 percent real depreciation in 2011 6 12 11 14 14 11B5. 10 percent of GDP increase in other debt-creating flows in 2011 6 11 10 13 13 10
Sources: Country authorities; and staff estimates and projections.
2 Revenues are defined inclusive of grants.
Projections
1 Assumes that real GDP growth is at baseline minus one standard deviation divided by the square root of the length of the projection period.
PV of Debt-to-GDP Ratio
PV of Debt-to-Revenue Ratio 2
Debt Service-to-Revenue Ratio 2

Statement by the IMF Staff Representative September 7, 2011
This statement summarizes information that has become available since the issuance of the staff report (SM/11/209). The new information does not change the thrust of the staff appraisal.
President Déby was sworn in for his fifth term in early August. Subsequent cabinet changes affected key economic ministries of finance and budget, and infrastructure.
Fiscal performance through June was broadly as staff anticipated at the time of the Article IV mission. It was marked by a shortfall in non-oil revenue, higher-than-expected oil revenues, and pressures on security-related expenditure. Almost the full year’s worth of security spending was executed, while spending on health, education, and other social priorities has lagged. The non-oil primary deficit (NOPD) for the first half of 2011 exceeded the implied mid-year budget baseline by about 2 percentage points of non-oil GDP. The estimated overall fiscal position was a surplus of about 3.2 percent of non-oil GDP.
Developments in the domestic petroleum market, following the opening of the first Chadian oil refinery, raised a new policy concern. Setting petroleum product prices below the prevailing market level disrupted imports and caused shortages in the local market. The foreign partner in the joint venture refinery has expressed concern about its financial viability. The new petroleum price policy, which is due to expire in September, is currently under review. Staff has offered to provide the authorities with technical assistance on petroleum product pricing and taxation.
The authorities are concerned about the impact of the prolonged conflict in Libya. The associated disruption of trade contributed to a revenue shortfall, while the security tensions and the humanitarian crisis entail additional outlays. Half a million people, according to the authorities, await repatriation to or via Chad. Also, two Chadian banks with significant Libyan ownership have suffered an outflow of deposits and may require public sector support.
The authorities indicated that these concerns would need to be reflected in a supplementary budget, the details of which are not yet known. Staff stand ready to work with the authorities to ensure that humanitarian needs are met while safeguarding fiscal sustainability.

Public Information Notice (PIN) No. 11/127 FOR IMMEDIATE RELEASE October 12, 2011
IMF Executive Board Concludes 2011 Article IV Consultation with Chad On September 7, 2011, the Executive Board of the International Monetary Fund (IMF) concluded the Article IV consultation with Chad.1 Background Chad’s internal security situation has improved since last year’s Article IV consultations, but the crisis in Libya poses risks. Over 70,000 people fleeing violence have been repatriated to or via Chad, with the help of international agencies. The domestic political situation is relatively calm, with legislative and presidential elections having passed without serious disruption, but opposition leaders boycotted the elections and alleged fraud. To accelerate non-oil growth and stem the impact of dwindling oil reserves on income, exports, and fiscal revenues, the government has been pursuing an ambitious public investment program and welcomed foreign direct investment in industrial projects. With real GDP growth reaching 13 percent in 2010, Chad recovered strongly from the 2009 downturn. Oil production increased, as high oil prices justified additional investment to bolster extraction rates. With favorable rains and government measures to provide agricultural inputs, as well as increased cultivated area, agricultural production nearly doubled and food and consumer prices declined. Notwithstanding the increased export earnings from oil, the external current account deficit widened to 35 percent of GDP, because of the high import content of investment spending (notably, in the oil sector).
1 Under Article IV of the IMF's Articles of Agreement, the IMF holds bilateral discussions with members, usually every year. A staff team visits the country, collects economic and financial information, and discusses with officials the country's economic developments and policies. On return to headquarters, the staff prepares a report, which forms the basis for discussion by the Executive Board. At the conclusion of the discussion, the Managing Director, as Chairman of the Board, summarizes the views of Executive Directors, and this summary is transmitted to the country's authorities. An explanation of any qualifiers used in summings up can be found here: http://www.imf.org/external/np/sec/misc/qualifiers.htm.
International Monetary Fund 700 19th Street, NW Washington, D. C. 20431 USA

2 Despite some improvements, serious deficiencies in budget execution persisted. The share of spending executed with emergency procedures (“depense avant ordonnancement” – DAO) was lower in 2010 than in 2009, but still accounted for over one quarter of domestically financed discretionary spending (9.3 percent of non-oil GDP) and DAOs equivalent to 4.3 percent of non-oil GDP awaited regularization at end-2010. On the positive side, the share of contracts awarded without competitive tender fell from 85 percent in 2009 to 49 percent in 2010. The overall fiscal position improved in 2010, reflecting higher than projected oil prices and increased non-oil tax revenue, but the underlying fiscal stance, as measured by the non-oil primary deficit (NOPD), weakened from 28 percent to 31 percent of non-oil GDP. The NOPD target established in the 2010 supplementary budget was overshot by 2½ percent of non-oil GDP, mainly due to domestically-financed public investment. The level of official reserves increased, but their ratio in months of imports of goods and services (excluding oil-sector imports) weakened somewhat. Chad’s real effective exchange rate remained broadly in line with that of other CEMAC (Central African Economic and Monetary Community) countries. Broad money increased by 25 percent, in line with nominal GDP, while credit to the economy grew 19 percent, roughly in line with nominal non-oil GDP. Chad’s public finances and financial sector are overexposed to oil risk. Since the beginning of the oil era in 2003, Chad has pursued an expansionary and procyclical fiscal policy, straining the absorptive capacity of the economy and the public financial management capacity of the administration. Without a financial cushion in the form of government deposits, a shock like the one experienced in 2009 would imply a forced fiscal tightening, a significant investment slowdown, and increased domestic arrears, possibly including arrears to the central bank. In turn, government suppliers may be unable to service their debts, and, commercial banks’ nonperforming loans would rise. Although higher oil prices have relaxed short-term financing constraint, better public financial management and budgetary discipline are needed to make efficient use of finite oil resources. Executive Board Assessment Executive Directors noted that higher-than-expected oil prices in 2010 had contributed to improving Chad’s overall fiscal and external balances, while a rebound in agriculture boosted real GDP growth to 13 percent. Directors commended the authorities for the appropriate measures undertaken in response to last year’s food shortages. With these measures and favorable rains, agricultural production nearly doubled and food prices declined, cushioning Chad from the impact of rising international food prices. Directors welcomed the opening of Chad’s first oil refinery, but expressed concern that setting fuel prices below the prevailing market level had disrupted imports and caused shortages. Noting the merits of mitigating the adverse impact of high fuel prices on the most vulnerable segments of the population, Directors cautioned that such measures should be efficient, targeted, and fiscally affordable.

3 While agreeing that higher-than-expected oil prices contributed to relaxing the financing constraint in the short term, Directors noted that oil price volatility and the projected medium-term decline in oil production warrant building a savings buffer, to smooth public spending, ensure adequate resources for poverty-reduction programs, and preserve debt sustainability. In this context, Directors welcomed the authorities’ plan to increase efforts to mobilize non-oil revenue, and to reduce the non-oil primary deficit to a sustainable position over the medium term. Directors urged the authorities to improve the quality of infrastructure spending through better project selection and implementation, and by adjusting the public investment budget to the absorptive capacity of the economy. In view of the past record of optimistic revenue forecasts, Directors deemed it prudent to make a portion of the public investment program contingent on the realization of revenue plans, and encouraged the authorities to pursue a prudent nonconcessional borrowing policy. Directors also underscored the need to promote non-oil growth and diversification in the medium term. They noted the institutional weaknesses behind the difficult business climate, in general, and financial sector vulnerabilities and underdevelopment, in particular. They encouraged the authorities to implement structural reforms that would facilitate private investment and further develop financial markets, notably by streamlining regulatory processes, simplifying the business tax system, reforming key state-owned enterprises, and enhancing confidence in the judicial system. Directors encouraged the authorities to work with other CEMAC members to strengthen the regional bank supervisor’s bank resolution powers. Directors welcomed the authorities’ renewed interest in a staff-monitored program (SMP), which could pave the way to a financial arrangement under the Extended Credit Facility and to the completion point under the Enhanced Initiative for Heavily Indebted Poor Countries (HIPC). Directors stressed that progress on fiscal policy and public financial management would be key to reaching agreement on, and successful performance under, an SMP. To this effect, Directors encouraged the authorities to continue their efforts to improve the quality and timeliness of economic and financial data.
Public Information Notices (PINs) form part of the IMF's efforts to promote transparency of the IMF's views and analysis of economic developments and policies. With the consent of the country (or countries) concerned, PINs are issued after Executive Board discussions of Article IV consultations with member countries, of its surveillance of developments at the regional level, of post-program monitoring, and of ex post assessments of member countries with longer-term program engagements. PINs are also issued after Executive Board discussions of general policy matters, unless otherwise decided by the Executive Board in a particular case. The staff report (use the free Adobe Acrobat Reader to view this pdf file) for the 2011 Article IV Consultation with Chad is also available.

4
Chad: Selected Economic and Financial Indicators, 2007–11
2007 2008 2009 2010 2011
Est. Proj.
(Annual percentage change, unless otherwise indicated)
Real GDP growth 1.8 14.6 -1.2 13.0 3.1
Oil -3.9 19.2 -5.1 6.4 -1.8
Non-oil 4.4 3.3 0.0 15.0 3.6
CPI inflation (average) -7.4 8.3 10.1 -2.1 2.0
Oil production (millions of barrels) 52.6 44.3 43.6 44.7 44.2
Oil price (Doba crude, fob Kribi, $ per barrel) 60.7 82.6 55.7 73.6 99.8
Broad money 5.4 24.7 -4.0 25.4 14.0
Exports 0.1 7.1 -25.5 29.1 20.4
Imports 11.7 -9.1 -20.6 -58.9 3.6
Current account balance (percent of GDP) 13.7 8.9 -17.2 -34.6 -23.6
(Percent of non-oil GDP)
Total revenue and grants 44.3 52.0 30.7 41.8 47.0
Total expenditure 38.5 43.7 46.2 50.4 42.1
Non-oil primary balance, excluding grants -22.1 -29.1 -28.1 -31.5 -26.2
Overall fiscal balance, excluding grants, commitments basis 3.0 5.6 -20.9 -11.3 2.1
(Billions of CFAF)
Nominal GDP 3358 3741 3344 4230 4476
Nominal non-oil GDP 1840 2003 2138 2584 2912
Sources: Chadian authorities; and IMF staff projections.

Mr. Assimaidou, Executive Director for Chad and Mr. Yambaye, Alternate Executive
Director, September 7, 2011
Our Chadian authorities remain committed to pursuing a close collaboration with the Fund. They appreciate the candid dialogue they have had with Fund staff in March, April and June of this year, and continue to count on Fund policy advice in implementing their economic agenda. While policy implementation has improved in recent years, they recognize that much progress remains to be done.
On the domestic front, Chad continues to face significant infrastructure gaps (electricity, roads, agricultural capacities, etc.). The authorities intend to meet the country’s infrastructure needs gradually. However, strengthening capacities, notably putting in place a project management system would help improve both public expenditure and the quality of infrastructure. In this regard, the authorities are eager to receiving technical assistance from partners, notably the Fund. The authorities have committed to build on the steps already taken in 2010 and 2011 in strengthening budget discipline to make further inroads into improving public financial management.
The challenging external environment, marked by conflicts in three neighboring countries and lower external demand, coupled with daunting capacity constraints have contributed to spending overruns to meet security and humanitarian needs. However, the current high oil prices and good agricultural production have helped to mitigate to a certain extent the adverse financial impact. Chad’s economy and external debt remain vulnerable to a reversal of oil prices while output is sensible to bad weather conditions and other exogenous shocks. In their endeavor to tackle these vulnerabilities, the Chadian authorities greatly value Fund advice, and they seek to resume a Fund-supported program and reach the completion point under the HIPC Initiative as soon as possible. Debt alleviation would also help free up resources to tackle poverty.
Following presidential and parliamentary elections, President Deby who has been re-elected appointed a new cabinet comprising a new economic team, with the view to giving a new momentum to the policy and reform agenda. The government is committed to working closely with the development partners, notably the Fund, to raise the growth rate, reduce vulnerabilities to the economy and alleviate poverty.
I. RECENT DEVELOPMENTS AND PROSPECTS
The rebound experienced by the Chadian economy since the 2010 Article IV consultations contributed to strengthening the overall fiscal position thanks to higher-than-expected oil prices but also greater non-oil tax revenue. On spending, while weaknesses in budget execution continued, there has been encouraging progress: the share of spending executed with emergency procedures (DAOs—dépenses avant ordonnancement) decreased in 2010

2
and the first few months of 2011; majority of contracts are now awarded in a competitive tender; and budget execution improved further in 2011.
The Chadian authorities would like to underscore that the low execution of health and education spending is in large part due to weak capacities in budget commitments in the corresponding ministries as well as seasonal factors that push most of those commitments towards year-end. The authorities confirmed that health and education are top priorities in their development and poverty reduction strategy.
Regarding the debt situation, while the stock of public and publicly-guaranteed debt has risen slightly to 32.5 percent of GDP at end-2010 from 30.5 percent a year earlier, the authorities’ debt policy has remained broadly prudent. The updated DSA shows that the risk of debt distress remains moderate.
Monetary aggregates remain under control, with broad money growth in line with nominal GDP and credit to the economy raising in line with nominal non-oil GDP.
Looking ahead, the expected slight decline in oil production, combined with slower agricultural growth will contribute to moderating overall GDP growth at end-2011. Nevertheless, growth will accelerate again in 2012 partly owing to the entry into operation of the new oil refinery, new industrial projects, notably in the power and cement areas. Inflation will remain subdued in 2011 and 2012 in spite of demand pressures from public investment and wages.
II. CHALLENGES GOING FORWARD
Going forward, the authorities will build on recent progress to further improve the security situation. They also strive to respond to the spending pressures caused by other short-term priority outlays and more generally address the problem of budget discipline. They also intend to put in place a medium-term strategy to ensure fiscal sustainability. Finally, sustaining growth through both oil and non-oil activity is a key objective in Chad’s development strategy.
Reducing security-related uncertainties
The authorities are of the view that further progress in reducing security problems—often stemming from conflicts in neighboring countries—is instrumental to improving economic conditions in Chad. They stand ready to meet these needs, which can be significant, and expect that the improvement in the security situation would boost non-oil economic activity and non-oil revenue, and ultimately allow a decline in security spending.
Coping with spending pressures and improving budget discipline
Our authorities share the view that coping with spending pressures and improving budget discipline will require reforms to strengthen public financial management, including expenditure controls. They are committed to bring back as early as end-2011 the non-oil primary deficit to the level implied by 2011 budget. The intended supplementary budget

3
which is being reflected on will contain the necessary measures to meet this commitment while regularizing the extra-budgetary spending incurred in the first half of 2011.
Building on the progress already made, project contracts will follow strictly the procurement rules, and all investment spending for the rest of 2011 will be executed through the regular budget process.
The Chadian government welcomes any technical assistance from donors that would help them design the required multi-year investment framework and improve public financial management.
Ensuring medium-term fiscal sustainability
The authorities welcome and agree with Fund staff’s advice to put in place a medium-term fiscal strategy, which includes a greater control of the investment program, efforts to strengthen non-oil revenue and measures to better manage oil revenue to cushion the budget against a significant oil price reversal. Their intended medium-term fiscal framework is broadly in line with Fund staff’s.
As indicated above, procurement procedures will be followed through, and public investment better controlled to take into account the country’s limited absorptive capacity.
Efforts to improve non-oil revenue will be made through reforms in tax and customs administration. Already, customs revenue is rising owing to the new customs data and payments processing system. Other measures would include curbing tax and customs exemptions.
Sustaining growth
The Chadian authorities are fully aware that sustaining growth is predicated on efforts to deepen the financial sector and make progress on improving the business environment with the view to promote private sector development.
My authorities are cognizant of the financial sector vulnerabilities, notably the lack of financial depth, the fragile situation of some banks, and the underdeveloped regional financial markets. To address the problem of distressed banks, they will continue to work with other CEMAC members to strengthen cooperation with the regional banking supervisory body, COBAC, improve its capacity and independence, and tackle bank solvency problems.
Regarding financial sector development, the authorities have begun with the issuance of CFAF 100 billion, -five-year bonds carrying a 6 percent coupon. This operation has been encouraging as two-thirds of the issue was purchased by Chadian residents.
The authorities recognize that there is considerable room for improving the country’s business climate. Apart from efforts to enhance security and improve the soundness and functioning of the financial sector, they view the strengthening of the judiciary system and the resolution of the problems facing the energy and cotton sectors as essential for enhancing the business environment and alleviating the fiscal burden of those sectors. Furthermore, they

4
broadly agreed with Fund staff-proposed tax reforms, notably measures to reduce the corporate tax burden and harmonize it at the CEMAC level, and eliminate special administrative levies. These two actions are intended to be decided upon in the short term.
III. CONCLUSION
Following several difficult years marked by conflicts in the region, the situation in Chad has greatly improved since peace was restored, enabling the authorities to implement important economic measures which are helping the country to move towards macroeconomic sustainability. In this regard, our authorities highly appreciate the advice of the staff, and they have already started to implement many of the reform and policy measures recommended. Progress is being achieved, and it is the Chadian authorities’ intention to build on this progress and start implementing a medium term economic program that can receive Fund support under the ECF and enable Chad to reach the Completion Point under the Enhanced HIPC Initiative. Board support towards this objective will be highly appreciated.