imes discussion paper series - bank of japan discussion paper series 2008-e-12 july 2008...
TRANSCRIPT

IMES DISCUSSION PAPER SERIES
INSTITUTE FOR MONETARY AND ECONOMIC STUDIES
BANK OF JAPAN
2-1-1 NIHONBASHI-HONGOKUCHO
CHUO-KU, TOKYO 103-8660
JAPAN
You can download this and other papers at the IMES Web site:
http://www.imes.boj.or.jp
Do not reprint or reproduce without permission.
Institutions, Competition, and Capital Market Integration in Japan
Kris James Mitchener and Mari Ohnuki
Discussion Paper No. 2008-E-12

NOTE: IMES Discussion Paper Series is circulated in order to stimulate discussion and comments. Views expressed in Discussion Paper Series are those of authors and do not necessarily reflect those of the Bank of Japan or the Institute for Monetary and Economic Studies.

IMES Discussion Paper Series 2008-E-12 July 2008
Institutions, Competition, and Capital Market Integration in Japan
Kris James Mitchener* and Mari Ohnuki**
Abstract
Using a newly-constructed panel data set which includes annual estimates of lending rates for 47 Japanese prefectures, we analyze why interest rates converged over the period 1884-1925. We find evidence that technological innovations and institutional changes played an important role in creating a national capital market in Japan. In particular, the diffusion in the use of the telegraph, the growth in commercial branch banking networks, and the development of Bank of Japan’s branches reduced interest-rate differentials. Bank regulation appears to have played little role in impeding financial market integration.
Keywords: Financial Market Development; Capital Market Integration; Economic Integration; Japanese Banks
JEL classification: F21, G21, N25, O16
* Assistant Professor, Department of Economics, Santa Clara University (E-mail:[email protected]) ** Associate Director and Economist, Institute for Monetary and Economic Studies, Bank of Japan (E-mail: [email protected])
The authors would like to acknowledge the valuable comments received from Professor Yoshio Asai (Seijo University) and conference participants at the BETA Workshop in Strasbourg, France. In the quantitative analysis, the authors would like to thank Professor Yoichi Matsubayashi (Kobe University) and Assistant Professor Tomoyoshi Yabu (Tsukuba University) for their generous assistance and guidance. Views expressed in this paper are those of the authors and do not necessarily reflect the official views of the Bank of Japan. Any inaccuracies and mistakes are solely the responsibility of the authors.

1
1. Introduction
Financial historians have long been interested in explaining and analyzing the development of capital markets, and understanding the extent to which their development has a broader impact on growth rates for national economies. Recently, economists have been drawing on the insights of Schumpeter and earlier generations of scholars to re-examine the relationship between financial sector development and economic growth, and to test it using new long-run, cross-country data sets.1 This newer literature argues that a causal relationship between finance and growth exists: well-functioning capital markets make it easier to channel savings to investment projects with high rates of return, which in turn enable modern economic growth to occur. Hence, understanding the factors that encourage capital market development is a key question. The geographical mobility of capital is critical to allocative efficiency. Legal or regulatory barriers, underdeveloped banking systems or financial markets, and technological hurdles can impede the flow of capital from borrowers to lenders across regions, while institutional innovations can accelerate the development of national capital markets. To better understand how national capital markets are forged, this article examines the process of capital market integration in Japan during the late-nineteenth and early twentieth centuries.
Japan’s experience is particularly illuminating for several reasons. First, although previous studies have examined the slow emergence of a national capital market in the U.S. during nineteenth century, comparatively little is known about the formation of national capital markets in other parts of the world.2 Japan’s status as the second largest economy in the world economy and its location in Asia (where many of the fastest growing developing nations are presently located) make it a particularly interesting historical case for assessing how capital market integration takes place. Second, because the institutional development of the Japanese banking system during the late-nineteenth century differed considerably from the process taking place in the United States at that time, Japan’s experience may shed light on factors that influence the formation of national capital markets but were non-existent or unimportant in the case of the U.S. In particular, since Meiji-era policymakers were explicitly attempting to modernize the Japanese economy and break from Japan’s feudal past, they experimented with new
1 See Levine (2005) for a review of the large literature on financial development and growth. For evidence on Japan, see Rousseau (1999). 2 One exception is the case of Austria. See Good (1977).

2
institutions, including the creation of a central bank in 1882 and its regional branches shortly thereafter and the development of commercial branch-banking networks.3 Third, although existing (Japanese-language) studies by historians provide some suggestive evidence that a national capital market likely emerged in the late-nineteenth and early-twentieth centuries, our study is the first to analyze how convergence was influenced by competition, institutional developments, and a better flow of information (induced by both technological change and innovations in the banking industry such as branch banking).4
One significant impediment to understanding capital market integration in countries other than the U.S. has been the lack of regional data on capital flows, interest rates, or other series that would permit the testing of this process. Hence, to analyze capital market integration in Japan, we collected a new data set on lending rates of commercial banks from 1884 to 1925 for 47 Japanese prefectures. We combined these data with other characteristics of Japanese prefectures, including the competitiveness of the banking environment, access to information networks, and the existence of branches of the Bank of Japan.5 Unlike many previous studies on interest rate convergence, our data set permits us to use panel econometrics to test explicitly the relative importance of competing hypotheses and show how a national market became increasingly integrated over a 40-year period.
We first review the literature on capital market convergence and consider theories that may help explain the process of capital market integration in Japan. We then use fixed-effects and random-effects models to show that the establishment of branches of the Bank of Japan and the development of commercial branch-banking networks lowered the barriers to capital mobility in Japan during the Meiji and Taisho periods. These two findings suggest that institutional innovations can play a central role in forging national capital markets. Our findings also highlight the role played by information networks: the
3 A number of studies have noted that the Meiji period represents a watershed for understanding how institutions contribute to economic growth and development and in forging a modern, open Japanese economy (Rousseau, 1999; Sussman and Yafeh, 1999; Bernhofen and Brown, 2004, 2005). 4 For previous studies on Japanese financial markets and suggestive evidence of convergence during our sample period, see Lewis and Yamamura (1971), Okada (1966), Sugiyama (1965), Teranishi (2003, 2005), Tsurumi (1981, 1991), and Yamamura (1970). 5 Using time-series techniques, Mitchener and Ohnuki, (2007) show that the Japanese capital market integrated at some point between 1886 and 1922.

3
growing telegraphic transmissions of financial information appear to have accelerated capital market integration in Japan.
2. Accounting for capital market integration in Japan
Studies of capital market integration have employed a wide range of data series (prices, capital flows, and differences in savings and investment) and statistical techniques to assess the pace and timing of national integration. Although there is no single agreed upon approach for studying integration, many researchers have used the movements in asset prices (for example, interest rates) to assess capital market integration, in part because these data are often available for longer periods of time and for a variety of locations. Economic theory suggests that asset prices ought to obey the law of one price because if capital markets are perfectly competitive and no market frictions exist, arbitrage opportunities should not persist across time and space. Otherwise the arbitrage opportunities could be exploited by market participants. Much of the existing literature on capital market integration has thus analyzed the extent to which actual capital markets meet the idealized criteria of frictionless, perfectly competitive markets. For example, studies on the process of national capital market formation in the United States have emphasized a variety of regulatory and institutional characteristics that may have impeded the development of a national capital market in the nineteenth century.6
In this light, we begin our analysis of Japan’s market for loanable funds by presenting evidence of the convergence in interest rates across Japanese prefectures. Figure 1 plots the coefficient of variation, on a quarterly basis, for the 47 Japanese prefectures from the mid-1880s to the early 1920s.7 The graph suggests that interest rate differentials were narrowing over this period. By the middle of the 1890s, the Ministry of Finance’s annual report on banking stopped commenting on regional gaps in interest rates, and suggested that capital market integration had taken place: “interest-rate trends
6 For the development of the commercial paper market, see Davis (1965) and Smiley (1975); for the stock market’s role see Sushka and Barrett (1984); for legal restrictions and banking market structure see Sylla (1969) and James (1976a, 1976b); for bank failures see Rockoff (1977); and for differential risk and transportation and information costs, see Stigler (1967), Eichengreen (1984), and Bodenhorn (1995). For a more extensive review of the literature on the U.S., see Bodenhorn and Rockoff (1992). 7 See Mitchener and Ohnuki (2007) for a time-series analysis of the convergence in rates during this period.

4
in different regions are virtually the same.” 8 In the rest of this section, we suggest several hypotheses that might help account for the apparent convergence in lending rates, which we then test in the next section of the paper. The experience of the U.S. provides some guidance on what hypotheses we consider; however, the pattern and pace of convergence among Japanese prefectures is sufficiently different from what U.S. regions experienced at that time that we cast our net more broadly in order to consider additional factors. That is, although there are some surface level similarities between the development of the U.S. banking system and Japan’s in the late nineteenth century, the Meiji period in Japanese history (1868-1913) ushered in a variety of institutional innovations in banking that may have figured prominently in the development of a national market for loanable funds.
Competition in the Loanable Funds Market & Financial Innovation
All else equal, more competitive banking systems ought to exhibit lower rates on borrowing and greater loan volume than monopolistic banking systems. One explanation, then, for the persistence of high lending rates in some regions is that banks were able to take advantage of market power, and charged local customers higher prices. They effectively exploited their locational advantage to derive monopoly rents. In underdeveloped markets, banks are often able to retain significant pricing power. Distance from a central financial market therefore can often act as a barrier to entry by making it more costly for a larger, out-of-area bank to establish a branch or purchase an existing bank. For example, the Ministry of Finance reported in 1889 that “interest rates are always lower in the urban areas where there are highly developed financial institutions and higher in outlying areas that lack these institutions; this is a generally accepted economic principle.” 9 Hence, the threat of entry may have been weaker in markets located further from financial centers like Tokyo and Osaka, a hypothesis we consider in the next section of the paper. Banks may have also been able to exploit informational advantages to obtain pricing power. For example, before the telegraph was widely used, it may have been difficult for customers to have complete information about competitive lending rates.
8 “21st Annual Report of the Banking Bureau of the Ministry of Finance” (1896), p. 29. 9 “12th Annual Report of the Banking Bureau of the Ministry of Finance” (1889), p. 61. As examples, interest rates in commercial areas like Tokyo, Osaka, Kyoto and Kanagawa were the lowest in the country.

5
Another potential explanation for local market power is the role of regulation, which we will test by examining the competitive environment for banks in a given prefecture. Scholars examining the United States have noted that high initial capital requirements, restrictions on branch banking, and limitations on bank mergers or on the chartering of new banks may have impeded competition in regional banking markets. These regulations may have fostered local geographic monopolies and impeded the development of a national banking market in the U.S.10 Circumstantial evidence might suggest a similar environment in Japan. After all, shortly after the Meiji restoration, the Japanese government passed a law in 1872 authorizing the creation of national banks that were closely modeled on the United States national banking system (which had been created in 1863). But, the Japanese experiment with national banks was much smaller in scale than in the U.S. The Japanese national banking system grew more slowly than the U.S. system, it had fewer relationships with other banks in the economy, and it was abandoned soon after its creation (in 1885) in favor of other types of banking institutions.11 Summary statistics on the Japanese banking system confirm the view that national banks were not an important source of banking growth during the Meiji-Taisho period. As Figure 2 shows, the growth in savings banks, ordinary banks, and other commercial banking institutions was quantitatively more important than national banks for our sample period.
The regulatory legacy of this Japanese national banking system also turned out to be quite limited. As in the U.S. in the nineteenth century, the original authorizing legislation in Japan established minimum capital requirements for national banks in Japan. These requirements specified the capital that banks were required to have on hand in order to receive a charter from the Ministry of Finance Shiheino-kami (Chief Officer of the Paper Currency Bureau). In particular, banks in large cities (greater than 100,000 in population) needed more than 500,000 yen (roughly $453,000 at 1880 exchange rates) to receive a charter.12 Banks in medium-sized cities (between 10,000 and 100,000 people) needed a minimum of 200,000 yen. However, banks in small cities (between 3,000 and
10 James (1976a, 1976b), Sylla (1969). 11 Miyajima and Weber (2001). 12 The yen was introduced in 1867 and was initially set at par with the dollar. In the 1880s, the exchange rate fluctuated between 1.1 to 1.3 yen per dollar (Global Financial Data, www.globalfinancialdata.com). As an alternative benchmark for understanding these capital requirements, the average capital of all firms (including those in the manufacturing sector) in 1896 (the earliest year for which there are data) was 87,386 yen (Nihon Tokei Kyokai, 1987).

6
10,000 people) could receive the approval of the Ministry of Finance to operate even if they had less than 50,000 yen in charter capital, so it is likely that capital requirements were not binding in smaller towns and cities. The original law was then amended in 1876, significantly lowering the capital requirements for national banks. The amended act basically required that national banks were required to have capital of more than 100,000 yen; national banks in larger cities (with a population greater than 100,000) were required to have 200,000 yen in minimum charter capital. However, these requirements were still not restrictive, since banks with capital between 50,000 and 100,000 yen could operate given the approval of the Ministry of Finance.
Since the Ministry of Finance wanted better control of bank note issuance, it stopped chartering national banks in 1878 and redirected its attention to establishing other types of commercial banks without note issuing privileges. The Bank Act of 1890, which was created to regulate these non-national, commercial banks, established minimum capital requirements similar to those in the National Bank Act.13 It did require non-national banks to get charter approval from the Ministry of Finance, but this restriction does not appear to have limited the growth of these banks. The number of the non-national commercial banks grew rapidly, with their numbers quickly exceeding those of the national banking system at its peak (Figure 2). By the 1880s, the capital requirements were quantitatively unimportant for commercial banks and did not serve as a meaningful barrier to entry.14 In an attempt to stabilize the banking system after a financial crisis in 1901, the Ministry of Finance began to encourage mergers and consolidation in the banking industry and raised the minimum charter capital requirements for new banks to 500,000 yen.15 Although the higher minimum capital requirement and the Ministry’s policy slowed growth of the banking system (Figure 2), the number of banks had already expanded by nearly tenfold in sixteen years (from 477 to 4141). Historians have concluded that entry regulations were fairly lax through the beginning of the twentieth century.16
The Meiji-Taisho period was relatively unfettered in terms of entry regulations, with relatively free banking. Moreover, in contrast to the U.S. banking system of the late-nineteenth and early-twentieth centuries, branch banking flourished in Japan, since
13 The act was put into effect in 1893. 14 Tamaki (1994), Goto (1973). 15 See Okazaki and Sawada (2006). 16 Okazaki and Sawada (2006).

7
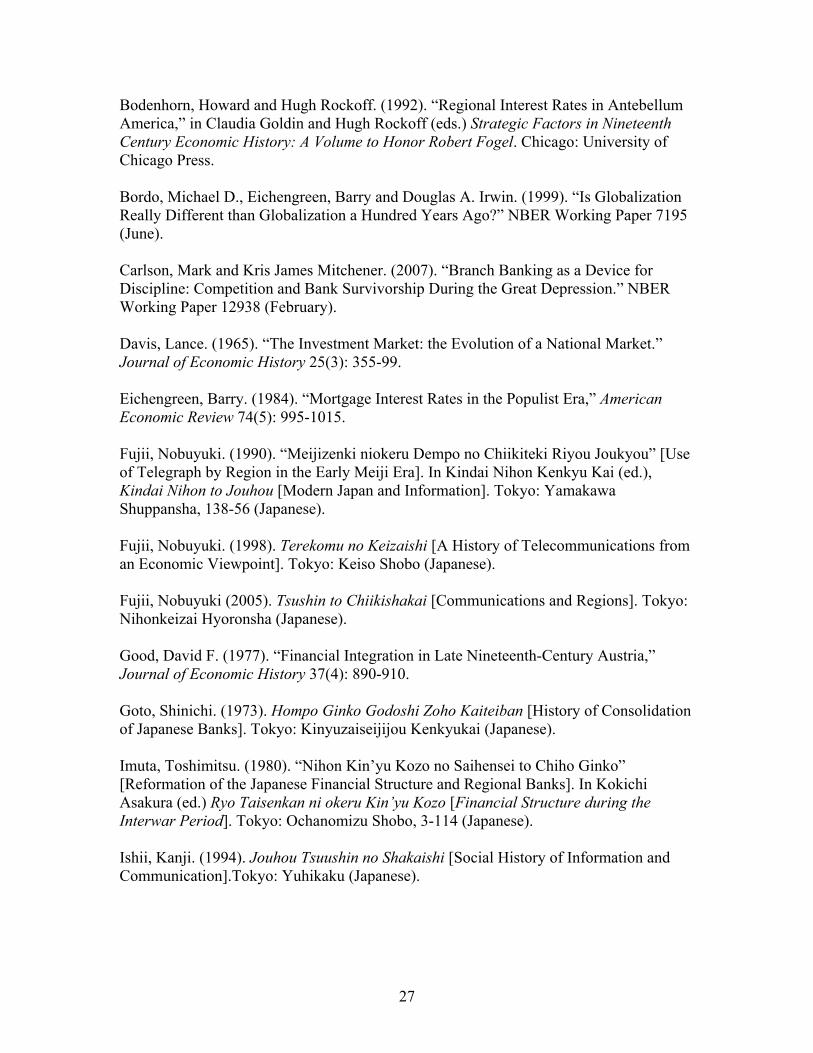
governments (either national or prefectural) imposed no restrictions on the formation of branching networks. Kazunobu Okada suggests that inter-bank transactions in the early Meiji Period and the development of the branch bank system were important in the development of a national capital market in the middle and late Meiji periods.17 From 1884 to 1925, the number of branches jumped from 122 to 6287 and the number of branches per head office increased from 0.87 to 3.77 in order to service an expanding customer base and the growing Japanese economy. According to Tetsuji Okazaki, the development of branching in Japan spurred competition in the banking sector, and that growth in branching was especially strong after 1905.18 Yoshio Asai also suggests that branching led to competition in lending rates and deposits.19 Figure 3 shows the overall growth in branching, which was not uniform across Japan. From 1884 to 1925, Tokyo and Hyogo saw the greatest increase in branch offices – from 16 to 487 and 5 to 398, respectively. On the other hand, Miyazaki and Okinawa saw branching expand the least over the same period – from 1 to 53 and 2 to 8, respectively. Some research also suggests that competition from branching may have been largely confined to major cities.20 When we analyze the process of capital market integration in the next section of the paper, we will therefore have to take into account differences in commercial branch banking across prefectures.
Commercial banks also extended their correspondent relationships during this period, and used their networks to transfer funds across regions. 21 Looking at the domestic funds transfer market in more detail, we find that, between 1877 and 1880, branch office networks and correspondent networks were built between the major urban banks and the large regional banks, and these networks were used to provide funds transfer services.22
In Tokyo, Osaka and other centers, transfer clearinghouses arose spontaneously by 1880, and served as a venue for trading transfers between banks.23 17 Okada (2001). For research into the significance of the development of the branch bank system, see Asai (1978). 18 Okazaki (2002). 19 Asai (1978). 20 Nikkei Kin’yu Shinbunsha and Chihou Kinyushi Kenkyukai (2003, pp.368-9). 21 Unfortunately, detailed prefectural data are not available on commercial bank correspondent networks, so we are not able to include this variable in our econometric model. 22 See Tsurumi (1991, pp. 117-118). 23 Little is known about transfer clearinghouses because of the paucity of documents remaining, but it is assumed that the Osaka transfer clearinghouse provided “trading in Tokyo transfers” and “inter-bank funds lending/borrowing” (see Tsurumi, 1991, pp. 130-143). Tsurumi (1991) focuses on the fact that domestic transfers were “traded” rather than “exchanged” to hypothesize that while the offsetting of transfers was the
8
However, because Tokyo-Osaka transfers were the focus of the correspondent network and only a few of the largest regional banks were able to participate in the network at all, it may not have mattered much.
In short, the lack of restrictions on entry and the innovations in Japanese banking during the Meiji period suggest that the banking system may have been more competitive than the U.S. banking system, at least through the end of the nineteenth century. In the empirical tests, we examine how differences in competition in the loanable funds market at the prefectural level may have influenced interest rate differentials.
Information Networks
Another factor that we wish to test in our statistical analysis is the role of information networks. As Michael Bordo, Barry Eichengreen, and Douglas Irwin have noted informational barriers can impede financial market integration as well, like a lack of competition. 24 Technological improvements that lower the cost of gathering information can increase the quantity of financial services and lower their prices. Improved information networks also let financial institutions gather better quality information on regional tastes and differences in risk. With lower-cost access to information, bank customers can also more easily gather information about market conditions that prevail elsewhere, allowing them to seek out competitive rates. The Meiji period witnessed a dramatic improvement in transportation and communication networks beginning in the 1870s when the telegraph, railroads, and a modern postal system were established. Nobuyuki Fujii suggests that the growth in these networks was important for economic development; it seems plausible that the development of information networks in Japan may therefore have influenced the market for loanable funds, particularly because the expansion in communication networks was uneven.25 Juro Teranishi suggests that better transportation and communications networks enhanced the development of private correspondent networks among banks.26 Kazuo Sugiyama also suggests that these developments may have been important in driving the
primary function of transfer clearinghouses, they also served as a means of investing short-term surpluses (see Tsurumi, 1991, p. 135). 24 Bordo, Eichengreen, and Irwin (1999). 25 Fujii (1998). 26 Teranishi (1982).

9
integration in commodity and goods markets within Japan.27 For example, although use of the telegraph began in 1870 in Tokyo and Osaka, the process of developing the network to cover a broader geographical area took 10-15 years.28 According to Fujii and Sugiyama, two-thirds of the private usage of the telegraph involved the transfer of information for business activities, such as commodity prices or interest rates; in 1885, the number of telegraph offices per capita varied considerably from prefecture to prefecture (Figure 4).29 We include a measure of the use of telegraphs at the prefectural level in our analysis to assess whether the diffusion of this information network contributed to the reduction of interest rate differentials.
One final advantage of branch-banking networks is that they may have allowed banks to price loans more efficiently. Branch banking networks enable head offices to obtain more detailed information on local economic conditions and local borrowers; as a result, they may be willing to extend loans over a wider geographical area.30 Although costly for banks to build, it may enable them to also obtain more customers as well as to diversify away from idiosyncratic risk associated with local lending markets. The comparative advantage that branching networks have in gathering specific information about borrowers and their investment projects may have also hastened the development of formalized lending markets in Japan by making it more difficult for informal money lenders to compete with banks, which had greater economies of scope and scale.
Bank of Japan
One final institutional change may have fostered the development of a national capital market – the Japanese government’s creation of a central bank (modeled after the Bank of Belgium). The early founding date of the Bank of Japan (1882), in comparison to the establishment of the U.S. Federal Reserve System in 1913, may have facilitated inter-regional payments and alleviated existing regional biases in the funding of loans during our sample period.
27 Sugiyama (1990). 28 Ishii (1994). 29 Fujii (1990) , Sugiyama (1990). 30 Carlson and Mitchener (2007).

10
Promoting the nationwide integration of financial markets was one of the Bank of Japan’s goals. 31 According to the “Proposal to Establish the Bank of Japan” and a supporting document entitled, “Explanation of the Establishment of the Bank of Japan,”32 the Bank was founded with five objectives in mind: (1) facilitate finance; (2) enhance funding of the national banks; (3) reduce interest rates; (4) offer treasury receipt and disbursement services; and (5) discount foreign bills. Of these goals, the first three sought to improve domestic financial intermediation functions, and the first is particularly relevant to our discussion of the Bank of Japan’s network. According to the “Explanation of the Establishment of the Bank of Japan,” the first goal, “facilitate finance,” was based on a judgment that networks of private-sector financial institutions were insufficient to adjust funding surpluses and shortfalls between regions.33 It was therefore suggested that the central bank sign correspondent contracts with national banks throughout the country so that it could unify local financial markets into a single, nationwide market.34 The use of correspondent transactions to build a network between the Bank of Japan and private-sector financial institutions was considered to be a powerful tool for the achievement of the initial objectives behind the Bank’s establishment.
According to Masayoshi Tsurumi, “spontaneous private financial markets” had existed prior to the establishment of the Bank of Japan, but domestic Japanese financial markets were not sufficiently tied together: the Bank of Japan transformed these
31 Matsukata, Masayoshi, “Explanation of the Establishment of the Bank of Japan”, Bank of Japan, Research Department (1958a, pp. 991-1007). 32 Submitted to Prime Minister Sanjo, requesting “a speedy decision on the proposal to establish the Bank of Japan and promulgation of the ordinance.” See Bank of Japan, Research Department (1958a, p. 990); Bank of Japan (1982, p. 120.) 33 The “Explanation of the Establishment of the Bank of Japan” says, “Regarding the present status of national banks, they stand in geographical confrontation to one another and have little desire to communicate or coordinate. Indeed, they move in opposition to one another and check one another. Should one bank have a surplus, it is not able to use that surplus to cover shortfalls in another bank.” See Bank of Japan, Research Department (1958a, p. 993.) 34 The “Explanation of the Establishment of the Bank of Japan” says, “The establishment of a central bank at this time would enable the sound national banks in various regions to be treated as Bank of Japan’s branch offices, with ‘correspondence’ contracts signed so as to open the first nationwide channels for the circulation of money... A central bank would play a key role in providing financial channels, observing the degree of activity of nationwide commerce and money transfers so that money surplus in one region could be transferred to the financial needs of another region, and the money surplus of that region could be lent for the financial needs of the first region. This movement and circulation would be akin to the heart pumping blood through the arteries to the limbs to enable them to move. Doing this would, for the first time, enable the volume of money to be smoothed out so that the national finances would no longer suffer from clogging and blockage.” See Bank of Japan, Research Department (1958a, p. 994.)

11
“spontaneous private financial markets” into a single market with the Bank of Japan at its core.35 Private-sector banks that signed correspondent transactions could use the Bank of Japan to transfer funds and collect bills from remote locations, and they could borrow short-term from the BOJ provided that they put up collateral.36 The Bank of Japan began to sign correspondent transactions with private-sector banks in June 1883, opening up a means of transferring funds through the Bank of Japan in addition to private payment systems. The number of correspondent contracts grew considerably after the BOJ signed its first correspondent contracts in 1883, reaching around 150 in 1890, and peaking at over 200 in 1900 (Figure 5).37 Makoto Kasuya comments that “going through the Bank of Japan helped to smooth out the movement of funds between remote locations.”38
On the other hand, the rising volume of correspondent transactions handled by the Bank of Japan had the effect of reducing the volume handled by private-sector transfer clearinghouses. According to Tsurumi, the BOJ eventually completely took over this business by around 1890.39
The branch offices of the Bank of Japan were supposed to “facilitate finance.” The Osaka Branch was established in December 1882, opening almost simultaneous to the head office in Tokyo, because of Osaka’s position as a “center of commerce.” No other branches were established immediately thereafter, however.40 At the time of the 35 As discussed in the previous section, although correspondent networks existed in Japan prior to the founding of the BOJ, these were limited in scope and function in comparison to the clearinghouses that existed in the United States at this time (Bodenhorn, 2003; James and Weiman, 2005). The slower development of clearinghouse arrangements, prior to the BOJ taking over these functions, resulted from an initially underdeveloped banking system at the start of our sample period (there were few private banks prior to the Meiji restoration) and product and labor markets that were still integrating during the 1870s, which blunted the need for interregional movements of capital. 36 Correspondent contracts were signed on a branch-office basis, not on a financial institution basis. For example, in 1883 the Mitsui Bank had seven branch offices in Hachioji, Odawara, Nagoya, Aomori and other locations that signed contracts with the Bank of Japan head office, while its Otsu office signed a contract with the Bank of Japan Osaka Branch. In other words, at this point in time, the Mitsui Bank had eight correspondent contracts with the Bank of Japan (Bank of Japan, 1982, p. 329). 37 The importance of correspondent relationships between the Bank of Japan and commercial banks declined after 1900, as shown in the Figure 5. After this date, commercial banks once again resumed an important role in establishing correspondent networks (Kamiyama, 2000, pp.102-104). 38 Kasuya (2000, p. 136). 39 Tsurumi (1991, p.136). 40 On October 20, 1882, Vice Governor Tetsunosuke Tomita, acting on behalf of the governor of the Bank of Japan, submitted an “Application to Establish an Osaka Branch” to Minister of Finance Masayoshi Matsukata (Bank of Japan Institute for Monetary and Economic Studies Archives, Document A3681). His reasons for needing a branch office in Osaka were: “Osaka is the center of commerce and a major channel for finance in western Japan as Tokyo is in eastern Japan. Maintaining close contact with it is a key point in

12
Bank’s establishment, the Ministry of Finance was concerned that “the establishment of local Bank of Japan offices may ‘impair the operations of local ordinary banks,’ and the Bank of Japan should therefore ‘initially’ sign correspondent contracts rather than establishing branch offices.”41
This was presumably why the Bank of Japan began by developing a nationwide correspondent network as a channel for circulating funds and delayed its expansion of a branching network.42
The Ministry of Finance’s policy appears to have changed its position, however, in the latter half of the 1880s. On July 30, 1889, seven years after the drafting of “Explanation of the Establishment of the Bank of Japan” by Masayoshi Matsukata, a Ministry of Finance memorandum acknowledged the need to expand the Bank of Japan’s branching network. According to the memorandum, the primary duty of the Bank of Japan was “to provide a means of funds transfers throughout the country and to facilitate market finance.” 43 This emphasis on promoting funds transfers44 was more or less the same as Masayoshi Matsukata had argued for in the “Proposal to Establish the Bank of Japan,” but the Ministry of Finance placed additional emphasis on the need to establish branch offices and agencies in order to achieve these objectives.45
the operations of the Bank, and it is considered urgent that the Bank of Japan establish a branch office there.” This application was approved on October 23. 41 Tsurumi (1991, p. 96). “Bank of Japan Ordinance” (Bill No. 330) first reading; see “Minutes of the Upper House” Volume 12, p. 526. 42 “The Bank of Japan did not have a branch office network where there was fear of encroaching upon the base of operations for national banks. Instead, it signed correspondent contracts with powerful local banks, enabling it to overcome the isolation of the national banks and achieve nationwide control.” (Tsurumi, 1991, p. 114). 43 Shigeyoshi Matsuo papers. (Writer unknown. Uses Ministry of Finance stationery). The document explains the functions of the Yokohama Specie Bank and the Bank of Japan and is entitled “Proposal for the Bank of Japan to Use the Specie Bank as a Liable Agency to Perform Foreign Exchange Services” (Bank of Japan, Research Department, 1958a, pp. 1441-1453). 44 Below are the other duties it lists: “Rediscounting and purchasing of commercial bills and promissory notes so as to enhance the funding of banks, etc.,” “regulating the ebbs and flows of finance and maintaining converged interest rates,” “discounting foreign funds transfer bills so as to enhance the convenience of domestic and foreign trade” and “planning the recovery of specie.” 45 At the bottom of the page on “providing a means of funds transfers throughout the country and facilitating market finance,” the Ministry of Finance notes, “The Bank of Japan is the central bank of Japan and at the center of monetary circulation in the Japanese financial economy. It should open a series of branch offices and agencies around the country so as to communicate and coordinate with financial companies around the country, providing a significant means of funds transfers so as to alleviate the congestion and clogging in finance by averaging the relative demand for money, for example, allowing money surplus in one region to be transferred to serve the financial needs of another region, and a money surplus in that region to be lent for the financial needs of the first region.

13
According to documents in the Bank of Japan, Institute for Monetary and Economic Studies Archives, Bank of Japan Governor Shigetoshi Yoshihara applied to Minister of Finance Masayoshi Matsukata to establish new branches on June 16, 1886.46 The application begins by noting the need to closely monitor conditions in local areas: “There has been a significant increase in the Bank’s operations with respect to its duties of handling treasury receipts and disbursements, issuing convertible banknotes and providing ‘correspondence’ services, and these services now extend throughout the country. We therefore believe it is necessary and urgent to more closely monitor local conditions and circumstances.” Governor Yoshihara went on to note that the BOJ, in its present configuration, had little scope for carrying out these aims. “The Bank only has one branch office in Osaka and engages in ‘correspondence’ financial transactions with national and private banks in other parts of the country and must rely on their communications through correspondent transactions to confirm the ebbs and flows of local commerce and finance to report to the Bank of Japan’s head office.” Governor Yoshihara thus viewed the Bank of Japan’s correspondent transactions with private-sector financial institutions as inadequate to respond to changes in local financial and economic circumstances, and he therefore argued for the establishment of “branch offices in local centers” that would “facilitate finance and balance interest rates.”47 Seven days after the application was made, the Minister of Finance, Masayoshi Matsukata, approved it.
Table 1 traces the establishment of branch and liaison offices between 1882 and 1909. In contrast to the U.S. Federal Reserve System, the BOJ’s branches were instead rolled out during the extended period of our sample.48 The regional variation in the
46 “Application to the Minister of Finance to Increase Branches” (Bank of Japan Institute for Monetary and Economic Studies Archives, Document A3681). 47 When the Bank of Japan was established, Masayoshi Matsukata commented in “Explanation of the Establishment of the Bank of Japan” on both the alleviation of regional disparities in interest rates and the alleviation of seasonal fluctuations, but there is no clear reference to “balancing interest rates.” Other important purposes for branch offices were funds payments and settlement, treasury receipts and disbursements, and banknote issuance. 48 The first application was made on April 19, 1886, but due to inadequate content (lack of branch bylaws) the Bank of Japan reapplied on June 16. The draft application of April 19 (the actual application is not in the Bank of Japan archives, only the draft) lists eight centers for the establishment of branch offices: Nagasaki, Hakodate, Niigata, Kobe, Yokohama, Akamagaseki (now Shimonoseki), Nagoya and Sendai. The application notes that they “will not be established all at the same time” but does not comment specifically on the order of establishment. The application of June 16 (which remains in the Bank of Japan

14
establishment of BOJ branches is particularly useful for testing whether they had any impact on reducing interest-rate differentials. For the first decade after its establishment, the Bank of Japan had only two branch offices, in Tokyo and Osaka, but by 1910, it had 10 offices in nine prefectures (Figure 6). The first two liaison offices were in Gifu and Wakayama in 1891; three more were established in Hokkaido in 1893.49 The second branch office to be established after Osaka was the Saibu (Kyushu) Branch, in 1893. Branch and liaison offices were established at a steady pace thereafter.50 In 1909, there were branch and liaison offices in most of the major financial centers of Japan and in Hokkaido: Osaka (1882), Saibu, Sapporo, Hakodate, Nemuro (1893), Kyoto (1894), Nagoya, Otaru (1897), Fukushima (1899), Hiroshima (1905), and Kanazawa (1909).51 For capital market integration, the key is whether branch and liaison offices provided funds transfer services. Documentary evidence collected from the “Manuals and Rules of the Bank of Japan’s Operations,” (Collection 1 Volume 1), demonstrates that they did, from the moment they were established, along with the other services they provided, such as banknotes, treasury receipt and disbursement services, and government-bond handling.52 archives) contains Masayoshi Matsukata’s signature and a note that says, “Quickly investigate the locations of branch offices and their operational bylaws and re-apply.” 49 These liaison offices were established as an emergency measure because the Mitsui Bank, which had served as the local treasury agent, resigned that position. The liaison offices were closed after a short period of time. 50 The speech given by Bank of Japan a board member Morito Yokura at the opening of the Saibu Branch remains in the Bank of Japan Institute for Monetary and Economic Studies Archives (“Speech at the Opening of the Saibu Branch” Document A3681). He says, “... the Bank... has a responsibility to facilitate the finance around Japan and enhance the convenience of private enterprise,” but in spite of this, “the circumstances were not right and the times were not ripe” for the establishment of branch offices after the opening of the Osaka Branch, but “we have begun to reform the Bank’s organization and reorganize its operations so that branches can gradually be established around the country.” 51 When local banks requested the establishment of a Bank of Japan branch or liaison office, it was common for them to emphasize the facilitation of funds transfers with other regions. A slightly later example comes from the application for the establishment of a branch in Asahikawa, Hokkaido filed on November 22, 1921 and submitted to Governor Junnosuke Inoue as a resolution of the 21st Hokkaido Bankers Conference. The application says that the establishment of a Bank of Japan branch office in Asahikawa would “contribute to the steady growth of Hokkaido, the development and progress of industry and in particular the development of modern funds transfers...it is most urgent for funds transfers to be facilitated so as to promote the development of industry.” (Bank of Japan Institute for Monetary and Economic Studies Archives, Document A3682). 52 This collection describes the operations of the Osaka Branch (opened 1882), the Gifu Liaison Office, and the Wakayama Liaison Office (opened 1891). See Ohnuki (2007) for more details on the different types of BOJ offices.

15
3. Empirical assessment of market integration
Data and Estimation
Our aim is to characterize the process of long-run integration and understand the factors that are leading to or inhibiting capital market integration. We do so by estimating the relative importance for market integration of institutions, competition, geography, and prefecture-specific factors by estimating:
(1) RATEit = β0 + β1BNKFAILit + β2RICELANDPit + β3CROPFIELDPit + β4RESIDPit
+ β5AVGLOANit + β6TELEGRAPHit + β7DISTANCEi + β8BRANCHit + β9BOJOFFICEit + β10BOJCORRit + β11BNKMERGERit + β12BNKLQDit + β13BNKENTRYit + εit.
To relate the process of financial market integration to the law of one price, we consider each prefecture’s interest rate relative to a benchmark rate, so that the dependent variable RATEit is defined as the difference between the annual average lending rate in prefecture i and year t and the average across all prefectures in year t. In order to test whether our results are sensitive to this definition, we also consider two other ways of defining the depending variable – the prefecture’s interest rate minus the rate in either Tokyo or Osaka – the two financial centers of Japan during our sample period.53
The independent variables are defined as: BNKFAILit is the percentage of existing banks (at time t-1) that failed in prefecture i at time t; RICELANDPit is the log price (measured in tan) of land dedicated to rice production in prefecture i at time t; CROPFIELDit is the log price (measured in tan) of agricultural crops other than rice in prefecture i at time t; RESIDPit is the log price (measured in tan) of residential land (outside of city centers) in prefecture i at time t;
53 We also examined the stationarity of the differenced series using ADF tests, where the number of lags used in the test was determined by the AIC criteria. More details are available upon request from the authors. For the most of the individual prefectures, we can reject the null hypothesis of a unit root for most prefectures once the series are differenced relative to Osaka, Tokyo, or the mean. Results are available from the authors upon request.

16
AVGLOANit is the (log) value of loans of all commercial banks divided by the number of commercial banks in prefecture i at time t; TELEGRAPHit is the number of domestic telegraph transmissions per capita in prefecture i at time t; DISTANCEi is the distance between the capital city in prefecture i and either Osaka or Tokyo (whichever is closest); BRANCHit is bank branches divided by total head offices in prefecture i at time t; BOJOFFICEit denotes the number of branch offices established by Bank of Japan in prefecture i at time t; BOJCORRit is the number of correspondent relationships with commercial banks that the Bank of Japan had in prefecture i at time t; BNKMERGERit is the percentage of existing banks at t-1 that merged at time t in prefecture i; BNKLQDit is the percentage of existing banks at t-1 that voluntarily liquidated at time t in prefecture i; BNKENTRY it is the number of banks that entered prefecture i at time t as a percentage of existing banks at t-1; β are estimated coefficients; and ε is a white noise error term capturing other influences on lending rates.
The dependent variable, RATEit, is constructed using annual lending rates, collected from the Ministry of Finance’s Ginkokyoku Nempo.54 According to Kokichi Asakura, the type of loans reported in this publication were often taken out by farmers with business interests in sericulture, silk reeling, tea, and rice, and who used the loans to cover the cost of variable inputs into production (such as seeds and fertilizer), capital equipment (farm machinery), land, tax payments, and living expenses.55 To create the variable RATEit, we first averaged monthly high and low values, and then averaged these monthly values over the 12 months of year t.56
54 The interest rates are described in further detail in Mitchener and Ohnuki (2007). 55 Asakura (1961). During our sample period, the tax applied to farmers was a land tax, and was payable even in the event of a bad harvest. 56 There may have been some seasonality in money demand, which in turn affected regional interest rates. For example, the demand for money may have been strong in the autumn due to the rice harvest and in the spring, summer, and autumn due to the sericulture industry. Although Finance Minister Matsukata mentioned seasonality in the “Explanation of the Establishment of the Bank of Japan,” it does not appear to

17
We gathered data from a variety of sources to construct information on regional banking markets (loan volume and loan size) as well as characteristics of bank market competition (bank branches, mergers, voluntary liquidations, and bank entry). Data on the numbers of commercial banks, number of branches of commercial banks, loans, capital, and deposits in each prefecture came from the Annual Report of the Banking Bureau of the Ministry of Finance (Ginkokyoku Nempo), Imperial Statistics (Teikoku Tokei Nenkan), Japanese Monetary Statistics (Nihon no Kinyu Tokei), Goto’s History of Consolidation of Japanese Banks (Hompo Ginko Godoshi Zoho Kaiteiban), and Banker’s Directory (Ginko Soran). Our sample of commercial banks included kokuritsu ginko (“national banks”), shiritsu ginko (“private banks”), and chochiku ginko (“savings banks”). All three types of banks made loans, although they differed somewhat in the size of loans they offered to customers. Kokuritsu ginko also had note issuing privileges until 1883, at which point these were revoked by the government. Beginning in the 1890s, kokuritsu ginko and shiritsu ginko were converted to futsu ginko (“ordinary banks”). We computed data on bank entry, mergers, and voluntary liquidations for each prefecture using information contained in from History of the Banks in Japan (Hompo Ginko Hensenshi).57
For our institutional variables, the source for the number of correspondent relationships between the Bank of Japan and commercial banks was the “Manuals and Rules of the Bank of Japan’s Operations” in Enkaku-shi, Collection 1, Volume 2 and Collection 2, Volume 3. The number of Bank of Japan offices in each prefecture came from The Bank of Japan: The First Hundred Years.
Equation 1 also includes measures for the size of informational networks. Data on the number of telegraph transmissions are from Imperial Statistics and Post and Communication Statistics (Teishinsho Nempo). We computed the distance between the capital city of a prefecture and either Osaka or Tokyo using information on road transportation networks that existed at that time, using http///www.mapfan.com/routemap/routeset.cgi. In regressions where RATE is defined relative to the mean across prefectures, we use either Tokyo or Osaka, whichever is
have been a major reason for the founding. Moreover, when we regressed each prefecture’s interest rate on monthly dummy variables, all the dummies were statistically insignificant at conventional levels of significance. We found no evidence of seasonality when we instead used quarterly dummies. Correlograms of each prefecture also showed no evidence of seasonal patterns. 57 Published by the Tokyo Bankers Association in 1998.

18
closest. When RATE is defined relative to Osaka or Tokyo, we use the distance measure with respect to Osaka or Tokyo, respectively.
We included two additional covariates to control for differences in default risk across prefectures. The first measure of risk that we compute is differences in land prices across prefectures. If land is a form of borrower’s collateral, then all else equal, higher land prices ought to be associated with lower default risk. Given the historical importance of rice in the Japanese economy and the substantial amount of land dedicated to rice cultivation, we constructed a time series for the price of land dedicated to its production. However, because not all borrowers were rice farmers or owned fields dedicated to rice production, we also constructed two other land price series: one for other types of agricultural crops and one for residential land prices. Data for all three series are taken from Tax Bureau Statistics (Shuzeikyoku Tokei Nemposho) and Imperial Statistics. Although land prices have been used to proxy risk by scholars like Eichengreen, the association between default risk (for borrowers) and land prices in Japan may be more tenuous in the Japanese case. 58 A borrowers’ personal credit history was the most important determinant of lending, and the most common form of collateral was government bonds. Some evidence from the case of Mitsui Bank (Mitsui Bunko, 1980) suggests that land was the last form of collateral that banks were willing to accept, so it is not clear, a priori, how important the land proxies are in the Japanese case.
Given the limitations of land prices, we constructed a second measure of risk based on commercial bank failures. The source of the data was Hompo Ginko Hensenshi, which included information about commercial bank entry and exit during our sample period. We adjust the bank failure series using population figures from Imperial Statistics. Other things being equal, prefectures with more bank failures per capita might have had greater underlying risks in lending. Empirical Results from Panel Models
Table 2 provides summary statistics for the variables used in our empirical analysis. Our sample covers all 47 prefectures and the years 1884 to 1925. We chose to end our study at this date since there were substantial banking reforms that began in 1926
58 Eichengreen (1984).

19
and gained momentum after the severe Showa Financial Crisis of 1927.59 Most of our specifications use fixed-effects panel models since there are likely unobserved differences across prefectures that may influence interest-rate behavior. In these, the distance measure (which remains constant over our sample period) is dropped from the reported regressions. Since Figure 1 suggests that there is a clear downward trend in rates over our sample period, we include year dummies in the regressions. Robust standard errors are reported to correct for heteroskedasticity.
Column 1 of Table 3 reports results from an OLS specification where we subtract the mean rate for all prefectures from each individual prefecture’s rate. The R-squared suggests that our model accounts for roughly 31% of the prefectural variation in interest-rate deviations from the mean rate across all prefectures. Moreover, the statistically and economically significant coefficients reported in Table 3 suggest that there are several factors that likely helped integrate the capital market during our sample period. When we include fixed effects at the prefectural level (column 2), the evidence for these factors is still there.
Specifically, prefectures with above average commercial branch banking and telegraph usage and those that had BOJ branches converged more quickly. The build out of information networks during our sample period appears to have helped a national capital market emerge. As shown in column 2, the diffusion of information helped to link regional lending markets. A one-standard-deviation increase in the volume of telegraph transfers per person lowered a prefecture’s lending rate by roughly 17 basis points (using the standard deviation shown in Table 2). In addition to facilitating the development of correspondent networks the telegraph, as we noted above, conveyed information to banks and borrowers about rates prevailing in other parts of the country thereby driving rates down in more distant markets.60
Financial innovation also played a role in the convergence of interest rates; in particular, the dissemination of branch offices appears to have lowered rates for
59 Given the significant shakeout in the banking industry and the regulatory reforms that occurred (Okazaki and Sawada, 2006), it is likely the case that rates thereafter evolve for reasons altogether different from the earlier period. Moreover, as we noted earlier, Mitchener and Ohnuki (2007) suggest that integration was occurring before this date. 60 Hokkaido’s use of the telegraph is influenced by: its unique settlement history by ethnic Japanese, which occurred much later than other prefectures, the fact that there were a lot of remotely-located villages, and the need for telegraphs beyond business use in the remote region. Moreover, the government created a special plan to promote the development of the telegraph in Hokkaido. See Fujii (2005, pp. 88-90).

20
borrowers. The coefficient shown in column 2 suggests that a one-standard deviation increase in the ratio of branch offices to head offices decreased lending rates by around eight basis points. As we suggested earlier, there are several channels through which branch banking may have accelerated convergence, by introducing more competition, by facilitating the spread of information on local economic conditions, and by helping banks allocate capital more efficiently. To provide a more direct test of the first channel, we interacted our branching variable with merger rates, voluntary liquidations, and bank entry rates to examine whether branching reduced lending by introducing more competition into local markets. The interactions were not statistically significant and the magnitude and statistical significance of the branching variable itself does not change (results not reported). It thus appears that a more likely explanation for the impact of branching on lending rates was that it encouraged the spread of information and improved the efficiency of the lending market.
One of the more interesting empirical findings relates to the unique role the Bank of Japan played in forging a national capital market. According to our estimated model, adding a branch of the BOJ lowered rates in a prefecture by roughly 21 basis points. This result is consistent with the stated goal of the Bank of Japan at that time – to provide a means of funds transfers throughout the country and to facilitate market finance. The Osaka branch nicely illustrates how BOJ branch offices played a role in integrating financial markets. Both the head office and the Osaka Branch discounted and purchased bills between Tokyo and Osaka, which Tsurumi suggests “virtually alleviated the remaining separations between the Tokyo and Osaka financial markets.”61 Toshimitsu Imuta examined a slightly later period of branch expansion, but he also emphasizes the merits to local banks when there was a Bank of Japan branch in the same prefecture.62 He suggests that the opening of a Bank of Japan branch in the same prefecture enabled local banks to deal directly with the Bank of Japan and thus eased the movement of funds to and from other regions. A BOJ branch also made it more convenient for local banks to accept Bank of Japan credits.63
61 Tsurumi (1991, pp. 238-239). 62 Imuta (1980). 63 Imuta (1980) says that “the switch from correspondent transactions to current account overdrafts that resulted from the opening of a Bank of Japan office in the same prefecture presumably increased the convenience with which Bank of Japan credits could be accepted.” (p. 52) He also emphasizes the importance to private banks of transactions with the Bank of Japan not only for funds transfers but also to take advantage of the convenience of current account overdrafts, etc. See Imuta (1980, pp. 50-52).

21
There is some evidence that local characteristics such as default risk affected lending rates, even when we condition on other variables. For example, a one-percent change in the price of land for other agricultural crops prices lowered lending rates by roughly 85 basis points relative to the mean. However, we find little evidence that the variables we used to characterize the competitive environment – merger rates, voluntary liquidation rates, and bank entry rates – shaped lending rates. Although the coefficients have the correct predicted signs (negative for bank entry and positive for voluntary liquidations and mergers), they are not statistically significant at conventional levels (column 2), and bank mergers is the only one of them that is statistically significant in the OLS specification (column 1). Their lack of statistical significance may not be surprising since entry regulations were non-binding in the Meiji-Taisho era. If we had found these variables to be statistically significant, it might have suggested that differences in regulation mattered; however, as Okazaki and Sawada and others have suggested, greater involvement in entry regulation did not occur until the time of the Showa financial crisis – after our sample period ends.64 This evidence also suggests that the Japanese capital market at the start of our period is better characterized by underdevelopment rather than lack of competition. That is, once other factors such as financial market innovation (branch banking) and institutional development are accounted for, competition is not of primary importance in explaining movements of interest rates. If we are willing to assume that the random error associated with each prefecture is uncorrelated with the independent variables, we can also estimate a random effects model (column 3). The results are robust to this specification test. The signs on the estimated coefficients for our measures of commercial bank branching, BOJ branches, and telegraph transmissions do not change, and the results are still statistically significant at conventional levels. In addition, there are additional signs that differences in risk may have been important, since two of our proxies are now statistically significant and negative (rice field land prices and farm field land prices).
As an alternative way of specifying the movement of interest rates over time, the last two columns of Table 3 define a prefecture’s interest rate relative to either Tokyo (column 4) or Osaka’s rate (column 5). Since these were the two major financial centers in Japan in the nineteenth and early twentieth centuries, these regressions test which factors accelerated or hindered the movement towards the rate that prevailed in the largest
64 Okazaki and Sawada (2006).

22
and most liquid financial markets of the nation.65 The results relative to either Tokyo or Osaka are quite similar to those shown for the regressions relative to the mean, and the explanatory variables explain a considerable amount of the variation in either of the dependent variables.66 Growth in commercial bank branches, telegraphic transmissions, and the BOJ branches all reduced a prefecture’s lending rate relative to the rate prevailing in the financial center. Moreover, all these variables are statistically significant at conventional levels.67
Corroborative Archival Evidence
Let us now take a closer look at the funds transfer services provided by a Bank of Japan branch.68 Specifically, let us examine the Bank of Japan Saibu Branch, which opened in 1893. The Saibu Branch was the second branch office after Osaka. It was initially established in Akamagaseki (now Shimonoseki) in Yamaguchi Prefecture, but in 1898, it moved to Moji (now Kitakyushu) in Fukuoka Prefecture. The major industries in this region were coal mining and rice production, and it had active financial dealings with Osaka, which served as the trade center.69
The Saibu Branch’s first manager described the local financial situation before the branch opened as “about ¥10 million a year in rice, coal and other industrial sales outside of Kyushu, with very few commodities other than these being sold. In other words, it was always a one-sided funds transfer. Even offsetting payments to the treasury in Kyushu, it was still necessary to send ¥4-5 million in cash every year from Osaka. Therefore,
65 We also considered alternative specifications to take into account the possibility of endogeneity. When we re-estimated the three fixed-effects models shown in Table 3 with lagged values of land prices, average loan size, and bank entry, the results were quite similar to those shown in the table. 66 The (within) R-squared is 0.61 when the rate is defined relative to Tokyo and 0.47 when the rate is relative to Osaka. The signs and statistical significance of the estimated coefficients is quite similar to those shown in columns 4 and 5 if a random effects model is employed (not reported). 67 In an OLS regression without fixed effects, distance is positive and statistically significant when the dependent variable is defined with respect to the rate in Osaka or Tokyo. 68 In this section, we draw on archival work found in Ohnuki (2007). For Bank of Japan funds transfers, Tsurumi (1991) uses the period from the latter half of 1883 to the first half of 1888, during which time the activities of the transfer clearinghouses declined. His analysis distinguishes between government transfers and civil transfers for transfers between Bank of Japan offices and between the Bank of Japan and private-sector banks. See Tsurumi (1991, pp. 144-151). 69 Tokyo and Osaka account for the large majority of the total funds transfers of all Bank of Japan offices.

23
interest rates were ¥0.02-0.03 per day higher than Osaka.”70 The movement of funds to the region was not necessarily sufficient to cover local demand, and higher interest rates may have reflected the risk of cash transfers or arbitrage opportunities. With the opening of the Saibu Branch, funds transfers could be made over the secure Bank of Japan network. This likely facilitated the movement of funds and drove down rates.
The details of funds transfers can be found in the “Bank of Japan Business Report.”71 While there were changes over time in the direction of funds inflows and outflows,72 the volume of funds transferred over the Bank of Japan network increased each year after a branch was established. Kasuya says that by 1902 the Moji Branch of the Mitsui Bank was “transferring enormous sums of funds over the Bank of Japan telegraphic transfers network from the head office and its Osaka branch”.73 Yurio Mukai says that “during the Meiji Period, even the zaibatsu-affiliated city banks... used the Bank of Japan branch office network for transfers of funds from the head office.”74
There is also evidence that the Bank of Japan network helped to alleviate the regional funding bias through payments-side funds transfers between remote regions. The “Osaka Bank Report” of 1907 argued that the flow of funds was substantially smoother in regions with Bank of Japan offices.75 As the report notes, “The benefits to be enjoyed by banks when transferring funds depend entirely upon whether they or the counterparty bank are located in areas where there are Bank of Japan offices.” In other words, having a Bank of Japan office facilitated the transfers of funds between local financial institutions. 70 Takahashi (1976, p. 35). Korekiyo Takahashi was the first manager of the Saibu Branch. 71 In Bank of Japan, Research Department (1957b, 1958b). The first “Bank of Japan Business Report” was issued in 1888. 72 Looking at the regional breakdown of the Saibu Branch’s flow of funds, in most years the Saibu Branch had a small net inflow of funds vis-a-vis the head office, while Kyoto, Nagoya and Fukushima had fairly consistent net outflows. By contrast, vis-a-vis the Osaka Branch there were net inflows until 1895, but this reversed in 1896 and there were large, consistent net outflows thereafter. 73 Kasuya(1991, p.178). According to the minutes of a branch managers meeting of the Mitsui Bank held in November 1905, Senshiro Kanezuka, the Manager of the Moji Branch spoke on “the reason for the recent sharp falls in interest rates in Shimonoseki and Moji and the prospects for the future.” He noted that “money is not flowing in to Kyushu from other regions but flowing out recently to other regions through the Bank of Japan so that the decline in interest rates is not unreasonable” In other words, he believed that declining interest rates for the Kyushu region were related to the relaxation of finance so that funds could be sent to other regions. This statement is also an indication that the Bank of Japan branch office network provided an important vehicle for the transfer of funds between regions at this time (Japan Business History Institute, 1977, p. 153). 74 Mukai (2000, p. 966). 75 The Osaka Banking Association (1907, pp. 21-24), published under the name of Midori Kobayashi, is contained in Bank of Japan, Research Department (1957a).

24
4. Conclusion
After the Meiji restoration, Japanese policymakers began to experiment with western institutions and technologies in order to modernize their economy, but the process was one of trial and error. Shortly after Emperor Meiji assumed the thrown, the Japanese banking system was transformed by the creation of national banks, which were modeled after institutions that went by the same name in the United States. However, recognizing the weaknesses of a banking system centered on these banks, Japanese policymakers continued their process of institutional adoption and innovation, creating a banking system that by the end of the nineteenth century looked noticeably different from the U.S. system. In particular, policymakers had replaced national banks with alternative types of commercial banks. They had encouraged these commercial banks to form branching networks, as in Canada and England. In 1882, the government created a central bank whose network of branches spread over the country by 1900.
Along with a telegraph network, these institutional innovations had important implications for the creation of a national capital market in Japan. Using a new data set of annual lending rates for 47 Japanese prefectures, we show that differences in interest rates across Japanese prefectures declined between 1884 and 1925. The reduction in interest rate differentials between outlying prefectures and financial centers was influenced by both technology and institutions. The development of information networks used for lending, such as the telegraph, played an important role in capital market integration, while branch offices allowed commercial banks to gather better information about customers and market conditions and helped banks shift funds to where they could be most efficiently employed. Meanwhile, the establishment of satellite offices of the Bank of Japan reduced lending rates by facilitating funds transfers between regions. And in contrast to the U.S., regulation played an insignificant role in impeding capital market integration.
The technological innovations and institutional developments that occurred during the Meiji and Taisho periods helped to transform Japan’s underdeveloped capital market into a more efficient, national market for lending and borrowing. This more efficient, national capital market likely proved important for Japan’s economic growth since there was relatively little foreign borrowing. However, it is still unclear whether capital market

25
integration and the development of Japan’s banking system were necessary conditions for modern economic growth in Japan, and that remains as an important topic for future research.
26
References Asai, Yoshio. (1978). 1910-20 Nendai ni Okeru Shiten Ginko Seido no Tenkai to Toshi Kinyu Shijou [Development of Branch Banking and Financial Markets in Cities, 1910-1920.] Seijo University, Economic Research Paper 59/60 (Japanese):307-340. Asakura, Kokichi. (1961). Meiji Zenki Nihon Kin'yu Kozo Shi [History of Japanese Monetary Structure in Early Meiji Period]. Tokyo: Iwanami Shoten (Japanese). Bank of Japan. (1986). Nihon Ginko Hyakunen-shi Shiryo-hen [Bank of Japan: The First Hundred Years-Materials]. Tokyo: Bank of Japan (Japanese). Bank of Japan. (1982). Nihon Ginko Hyakunen-shi dai 1 kan [Bank of Japan : The First Hundred Years] vol.1. Tokyo: Bank of Japan (Japanese). Bank of Japan, Research Department. (1957a). Nihon Kin’yu-shi Shiryo Meiji Taishohen dai 6 kan [Materials on Japanese Monetary History, Meiji and Taisho Periods]. Vol. 6. Tokyo: Bank of Japan (Japanese). Bank of Japan, Research Department. (1957b). Nihon Kin’yu-shi Shiryo Meiji Taishohen dai 10 kan [Materials on Japanese Monetary History, Meiji and Taisho Periods]. Vol. 10. Tokyo: Bank of Japan (Japanese). Bank of Japan, Research Department. (1958a). Nihon Kin’yu-shi Shiryo Meiji Taishohen dai 4 kan [Materials on Japanese Monetary History, Meiji and Taisho Periods]. Vol. 4. Tokyo: Bank of Japan (Japanese). Bank of Japan, Research Department. (1958b). Nihon Kin’yu-shi Shiryo Meiji Taishohen dai 11 kan [Materials on Japanese Monetary History, Meiji and Taisho Periods]. Vol.11. Tokyo: Bank of Japan (Japanese). Bernhofen, Daniel M. and John C. Brown. (2005). “An Empirical Assessment of the Comparative Advantage Gains from Trade: Evidence from Japan.” American Economic Review 95: 208-25. Bernhofen, Daniel M. and John C. Brown. (2004). “A Direct Test of the Theory of Comparative Advantage: The Case of Japan.” Journal of Political Economy 112: 48-67. Bodenhorn, Howard. (2003). State Banking in Early America: A New Economic History. New York: Oxford University Press. Bodenhorn, Howard. (1995). “A More Perfect Union: Regional Interest Rates in the United States, 1880 – 1960,” in Michael D. Bordo and Richard Sylla (eds.) Anglo-American Financial Systems: Institutions and Markets in the Twentieth Century. Burr Ridge, IL: Irwin Professional Publishing, 415-54.
27
Bodenhorn, Howard and Hugh Rockoff. (1992). “Regional Interest Rates in Antebellum America,” in Claudia Goldin and Hugh Rockoff (eds.) Strategic Factors in Nineteenth Century Economic History: A Volume to Honor Robert Fogel. Chicago: University of Chicago Press. Bordo, Michael D., Eichengreen, Barry and Douglas A. Irwin. (1999). “Is Globalization Really Different than Globalization a Hundred Years Ago?” NBER Working Paper 7195 (June). Carlson, Mark and Kris James Mitchener. (2007). “Branch Banking as a Device for Discipline: Competition and Bank Survivorship During the Great Depression.” NBER Working Paper 12938 (February). Davis, Lance. (1965). “The Investment Market: the Evolution of a National Market.” Journal of Economic History 25(3): 355-99. Eichengreen, Barry. (1984). “Mortgage Interest Rates in the Populist Era,” American Economic Review 74(5): 995-1015. Fujii, Nobuyuki. (1990). “Meijizenki niokeru Dempo no Chiikiteki Riyou Joukyou” [Use of Telegraph by Region in the Early Meiji Era]. In Kindai Nihon Kenkyu Kai (ed.), Kindai Nihon to Jouhou [Modern Japan and Information]. Tokyo: Yamakawa Shuppansha, 138-56 (Japanese). Fujii, Nobuyuki. (1998). Terekomu no Keizaishi [A History of Telecommunications from an Economic Viewpoint]. Tokyo: Keiso Shobo (Japanese). Fujii, Nobuyuki (2005). Tsushin to Chiikishakai [Communications and Regions]. Tokyo: Nihonkeizai Hyoronsha (Japanese). Good, David F. (1977). “Financial Integration in Late Nineteenth-Century Austria,” Journal of Economic History 37(4): 890-910. Goto, Shinichi. (1973). Hompo Ginko Godoshi Zoho Kaiteiban [History of Consolidation of Japanese Banks]. Tokyo: Kinyuzaiseijijou Kenkyukai (Japanese). Imuta, Toshimitsu. (1980). “Nihon Kin’yu Kozo no Saihensei to Chiho Ginko” [Reformation of the Japanese Financial Structure and Regional Banks]. In Kokichi Asakura (ed.) Ryo Taisenkan ni okeru Kin’yu Kozo [Financial Structure during the Interwar Period]. Tokyo: Ochanomizu Shobo, 3-114 (Japanese). Ishii, Kanji. (1994). Jouhou Tsuushin no Shakaishi [Social History of Information and Communication].Tokyo: Yuhikaku (Japanese).

28
James, John A. and David F. Weiman, (2005). “The Political Economy of the US Monetary Union: The Civil War Era as a Watershed.” American Economic Review, Papers and Proceedings 97(2): 271-5. James, John A. (1976a). “The Development of the National Money Market.” Journal of Economic History 36(4): 878-97. James, John A. (1976b). “Banking Market Structure, Risk, and the Pattern of Local Interest Rates in the United States, 1893-1911.” Review of Economics and Statistics: November: 453-62. Japan Business History Institute. (1977). Mitsui Ginko Shiryo 2 Shitencho Kaigi Kiroku (Mitsui Bank Materials 2: Records of Branch Managers Meetings). Tokyo: Zaidan Hojin Nihon Keieishi Kenkyusho (Japanese). Kamiyama, Tsuneo. (2000). “Zaisei Seisaku to Kinyu Kouzou”[Financial Policy and Financial Structure]. In Kanji Ishii, Akira Hara, and Haruhito Takeda (eds.) Nihon Keizaishi 2 Sangyo Kakumeiki [Japanese Economic History 2: Industrial Revolution Period]. Tokyo: University of Tokyo Press (Japanese). Kasuya, Makoto. (2000). “Kinyuseido no Keisei to Ginko Jourei/ Chochikuginko Jourei” [Formation of Monetary system and Bank Law/Savings Bank Law]. In Masanao Ito, Masayoshi Tsurumi, and Yoshio Asai (eds.) Kinyu Kiki to Kakushin [Financial Crisis and Innovation]. Tokyo: Nihon Keizai Hyoronsha, 1-35 (Japanese). Kasuya, Makoto. (1991). “Nihon ni okeru Yokin Ginko no Keisei Katei – Shiharai Junbi wo Chushin toshite” [Process of Establishing Deposit Banks in Japan – Focus on Cash Reserves]. Shakai Kagaku Kenkyu [Socio-scientific Research] 43(4): 85-244 (Japanese). Levine, Ross. (2005). “Finance and Growth: Theory and Evidence.” in Philippe Aghion and Steven Durlauf, Handbook of Economic Growth (eds.), New York: Elsevier. Lewis, Kenneth A. and Kozo Yamamura. (1971). “Industrialization and Interregional Interest Rate Structure: The Japanese Case, 1889 – 1925”. Explorations in Economic History 8(4): 473-99. Ministry of Finance. (1889). Dai 12 ji Ginkokyoku Nempo [Twelfth Annual Report of the Banking Bureau of the Ministry of Finance]. Tokyo: Ministry of Finance(Japanese). Ministry of Finance. (1896) Dai 21 ji Ginkokyoku Nempo [Twenty First Annual Report of the Banking Bureau of the Ministry of Finance]. Tokyo: Ministry of Finance(Japanese). Mitchener, Kris James and Mari Ohnuki. (2007). “Capital Market Integration in Japan.” Monetary and Economic Studies 25(2): 129-53.

29
Mitsui Bunko. (1980). Mitsui Jigyoushi Hompen dai 2 kan. [History of Mitsui Business]. Vol.2. Tokyo: Mitsui Bunko (Japanese). Miyamoto, Matarou. (1988). Kinsei Nihon no Shijo Keizai [The Market Economy in Tokugawa Japan]. Tokyo: Yuhikaku (Japanese). Miyajima, Shigeki and Warren E. Weber. (2001). “A Comparison of National Banks in Japan and the United States between 1872 and 1885.” Monetary and Economic Studies 19(1): 31-48. Mukai, Yurio. (2000). “Kin’yu Gyo no Tenkai” [Development of the Financial Business]. In Nishi Nihon Bunka Kyokai (ed.) “Fukuokaken-shi Tsushi-hen Kindai Sangyo Keizai 2 [Chronological History of Fukuoka Prefecture, Modern Industry and Economy]. Vol. 2. Fukuoka: Nishi Nihon Bunka Kyokai, 933-1070 (Japanese). Nihon Tokei Kyokai. (1987). Nihon Choki Tokei Soran Dai Yon-kan [Historical Statistics of Japan] vol.4. Tokyo:Nihon Tokei Kyokai (Japanese). Ohnuki, Mari. (2007). “The Bank of Japan Network and Financial Market Integration: From the Establishment of the Bank of Japan until the Early 20th Century.” Monetary and Economic Studies 25(1): 95-125. Okada, Kazunobu. (1966). “Futsuu Ginko Seido no Kakuritsu” [Development of the Commercial Banks System]. In Kinyu Keizai Kenkyusho (ed.) Nihon no Ginko Seido Kakuritsu Shi-Nihon Kin’yu Shijou Hattatsu Shi II [History of the Development of the Banking System in Japan – History of the Development of Market in Japan]. Tokyo: Toyokeizai Shinposha (Japanese), 45-191 (Japanese). Okada, Kazunobu. (2001).“Chiho Ginko Shiron” [History of Regional Banks]. Tokyo: Nihon Keizai Hyoronsha. (Japanese). Okazaki, Tetsuji.(2002). “Branch Banking and Money Flow of Mitsubishi Bank 1928-1942.” Bulletin of Mitsubishi Research Institute of Historical Materials (3):1-29. Okazaki, Tetsuji and Michiru Sawada (2006). “Effects of a Bank Consolidation Promotion Policy: Evaluating Bank Law in 1927 Japan.” CIRJE Discussion Paper F-400 (February). Nikkei Kin’yu Shinbunsha and Chihou Kinyushi Kenkyukai (2003). Nihon Chihou Kinyu Shi [Local Monetary History in Japan]. Tokyo: Nihon Keizai Shinbunsha (Japanese). Rockoff, Hugh. (1977). “Regional Interest Rates and Bank Failures.” Explorations in Economic History. 14: 90-95. Rousseau, Peter L. (1999) “Finance, Investment, and Growth in Meiji-era Japan,” Japan and the World Economy 11:185-98.

30
Smiley, Gene. (1975). “Interest Rate Movements in the United States, 1888-1913.” Journal of Economic History 35: 591-620. Stigler, George. (1967) “Imperfections in the Capital Market,” Journal of Political Economy 75 (June): 113-22. Stigler, George and Robert A. Sherwin. (1985). “The Extent of the Market.” Journal of Law and Economics 28(October): 555-85. Sugiyama, Shinya. (1990). “Jouhou Kakumei” [Information Revolution]. In Shunsaku Nishikawa and Yuzo Yamamoto (eds.) Sangyouka no Jidai Ge Nihonkeizaishi 5 [Industrialization Age: Japanese Economic History 5]. Tokyo: Iwanamishoten, 134-165 (Japanese). Sugiyama, Kazuo. (1965). “Kokuritsu Ginko no Tokeiteki Kosatsu” [Statistical Views on the National Banks], Tohata Seiichi and Takahashi Taizo (ed). “Meiji Zenki no Ginko Seido” [Banking System in early Meiji Period], Toyo Keizai Shinpo sha. Sushka, Mary E. and Brian W. Barrett. (1984). “Banking Structure and the National Capital Market 1869-1914.” Journal of Economic History 44:463-77. Sussman, Nathan and Yisheh Yafeh. (1999). “Institutions, Reforms, and Country Risk: Lessons from Japanese Government Debt in the Meiji Period.” Journal of Economic History 60(2): 442-67. Sylla, Richard. (1969). “Federal Policy, Banking Market Structure, and Capital Mobilization in the United States 1863-1913.” Journal of Economic History 29: 657-86. Takahashi, Korekiyo. (1976). Takahashi Korekiyo Jiden Gekan [Memoirs of Takahashi Korekiyo]. Vol. 2. Tokyo: Chuo Koronsha (Japanese). Teranishi, Juro. (1982). Nihon no Keizaihatten to Kinyuu [Japanese Economic Development and Finance]. Tokyo: Iwanami Shoten (Japanese). Teranishi, Juro. (2003). Nihon no Keizai Shisutemu [The Japanese Economic System]. Tokyo: Iwanami Shoten (Japanese). Teranishi, Juro. (2005). The Evolution of Economic Systems in Japan. Cheltenham, U.K.: Edward Elgar. Tsurumi, Masayoshi. (1981). Daiichiji Taisen Kinri Kyoutei to Toshi Kin’yu Shijou [Interest Rate Agreements during World War I and Its Impact on the Financial Market in the City] Kin’yu Keizai 1: 1-50 (Japanese).

31
Tsurumi, Masayoshi. (1991). Nihon Shin’yo Kikou no Kakuritsu [Establishment of Credit System in Japan]. Tokyo:Yuhikaku (Japanese). Williamson, Jeffrey G, (1974). Late Nineteenth Century Economic Development: A General Equilibrium History, London: Cambridge University Press. Yamamura, Kozo. (1970). “Nihon ni okeru Touitsuteki Shihon Shijou no Seiritsu, 1889-1925.” [Integration of the Capital Market in Japan]. Shakai Keizaishi Gaku 35(5-6): 58-85 (Japanese).

32
Figure 1. Narrowing of Interest Rate Differentials across Japanese Prefectures
0.00
0.02
0.04
0.06
0.08
0.10
0.12
0.14
0.16
0.18
0.20
1886q3
1887q3
1888q3
1889q3
1890q3
1891q3
1892q3
1893q3
1894q3
1895q3
1896q3
1897q3
1898q3
1899q3
1900q3
1901q3
1902q3
1903q3
1904q3
1905q3
1906q3
1907q3
1908q3
1909q3
1910q3
1911q3
1912q3
1913q3
1914q3
1915q3
1916q3
1917q3
1918q3
1919q3
1920q3
1921q3
1922q3
Coefficient of Variation of Average Quarterly Interest Rates for Japanese Prefectures
Notes and Sources: This graph shows the coefficient of variation of lending rates for 47 Japanese prefectures. Quarterly interest rates are three-month averages of monthly lending rates for individual prefectures based on data from the Ministry of Finance’s Ginkokyoku Nempo [Annual Report of the Ministry of Finance], and described further in the text.

33
Figure 2 Growth in banks (head office + branch)
0
1000
2000
3000
4000
5000
6000
7000
8000
900018
84
1886
1888
1890
1892
1894
1896
1898
1900
1902
1904
1906
1908
1910
1912
1914
1916
1918
1920
1922
1924
Year
National banksTotal-National banks
Source: Authors’ calculations based on data from Teikoku Tokei Nenkan [Imperial Statistics], Nihon no Kin’yu Tokei [Japanese Monetary Statistics], and Ginko Soran [Banker’s Directory].
34
Figure 3. Branch Offices in Japan
0
1000
2000
3000
4000
5000
6000
7000
1884
1887
1890
1893
1896
1899
1902
1905
1908
1911
1914
1917
1920
1923
year
Source: Authors’ calculations based on data from Teikoku Tokei Nenkan [Imperial Statistics], Nihon no Kin’yu Tokei [Japanese Monetary Statistics], and Ginko Soran [Banker’s Directory].

35
Figure 4. Telegraph offices per 100,000 people, 1885
0
1
2
3
4
5
6
7
8H
okka
ido
Aom
ori
Iwat
eA
kita
Miy
agi
Yam
agat
aFu
kush
ima
Niig
ata
Ishi
kaw
aFu
kui
Toya
ma
Ibar
aki
Gum
ma
Toch
igi
Saita
ma
Chib
aTo
kyo
Kan
agaw
aY
aman
ashi
Nag
ano
Shiz
uoka
Aic
hiG
ifuSh
iga
Mie
Kyo
toO
saka
Hyo
goW
akay
ama
Oka
yam
aH
irosh
ima
Yam
aguc
hiTo
ttori
Shim
ane
Toku
shim
aK
ochi
Ehim
eFu
kuok
aN
agas
aki
Oita
Kum
amot
oK
agos
him
aSa
gaM
iyaz
aki
Prefecture
Source: Authors’ calculations based on data from Teikoku Tokei Nenkan [Imperial Statistics] and Teishinsho Nempo [Post and Communication Statistics].

36
Figure 5. The number of Correspondent Contracts between BOJ and Private Banks
0
50
100
150
200
250
3001883
1885
1887
1889
1891
1893
1895
1897
1899
1901
1903
1905
1907
1909
1911
1913
1915
1917
1919
1921
1923
1925
Year
Source: Authors’ calculations based on the “Manuals and Rules of the Bank of Japan’s Operations” in Enkaku-shi, Collection 1, Volume 2 and Collection 2, Volume 3.

37
Figure 6. Bank of Japan’s Branches in 1909 (Shaded prefectures indicate Bank of Japan office)
1
4
5
6
7
8
910
11
12
1314
1516
17
18
19
2
3
2021
2223
24
2526
27
28
2930
3132
333435
3637
38 39
40
41
4243 44
4546
47
List of Prefectures: 1.Hokkaido 2.Aomori 3.Iwate 4.Miyagi 5.Akita 6.Yamagata 7.Fukushima 8.Ibaraki 9.Tochigi 10.Gunma 11.Saitama 12.Chiba 13.Tokyo 14.Kanagawa 15.Niigata 16.Toyama 17.Ishikawa 18.Fukui 19.Yamanashi 20.Nagano 21.Gifu 22.Shizuoka 23.Aichi 24.Mie 25.Shiga 26.Kyoto 27.Osaka 28.Hyogo 29.Nara 30.Wakayama 31.Tottori 32.Shimane 33.Okayama 34.Hiroshima 35.Yamaguchi 36.Tokushima 37.Kagawa 38.Ehime 39.Kochi 40.Fukuoka 41.Saga 42.Nagasaki 43.Kumamoto 44.Oita 45.Miyazaki 46.Kagoshima 47.Okinawa
Source: The Bank of Japan: First Hundred Years-Materials (1986).

38
Table 1. Opening of the Bank of Japan’s Branches and Offices End of year Total
Head office Branches
Local Offices
Location of Bank of Japan Branches and Offices outside of Tokyo
1882 2 1 1 0 Osaka 1883 2 1 1 0 1884 2 1 1 0 1885 2 1 1 0 1886 2 1 1 0 1887 2 1 1 0 1888 2 1 1 0 1889 2 1 1 0 1890 2 1 1 0 1891 4 1 1 2 Osaka, Gifu, Wakayama 1892 3 1 1 1 Osaka, Wakayama
1893 7 1 2 4 Osaka, Saibu, Sapporo, Hakodate, Nemuro, Wakayama
1894 8 1 2 5 Osaka, Saibu, Sapporo, Hakodate, Nemuro, Kyoto, Wakayama
1895 6 1 3 2 Osaka, Saibu, Hokkaido, Sapporo, Kyoto
1896 6 1 3 2
1897 8 1 4 3 Osaka, Saibu, Hokkaido, Nagoya, Sapporo, Kyoto, Otaru
1898 8 1 4 3
1899 9 1 4 4 Osaka, Saibu, Hokkaido, Nagoya, Sapporo, Kyoto, Otaru, Fukushima
1900 9 1 4 4 1901 9 1 4 4 1902 9 1 4 4 1903 9 1 4 4 1904 9 1 4 4
1905 10 1 4 5
Osaka, Saibu, Hokkaido, Nagoya, Sapporo, Kyoto, Otaru, Fukushima, Hiroshima
1906 9 1 4 4 Osaka, Saibu, Nagoya, Sapporo, Kyoto, Otaru, Fukushima, Hiroshima
1907 9 1 4 4 1908 9 1 4 4
1909 10 1 4 5
Osaka, Saibu, Nagoya, Otaru, Kyoto, Hakodate, Fukushima, Hiroshima, Kanazawa
Source: The Bank of Japan: First Hundred Years-Materials (1986).

39
Table 2. Characteristics of Banking Markets in Japanese Prefectures Standard Variable Mean Deviation Minimum Maximum Average Annual Lending Rate 10.69 1.62 6.33 18.00Bank Failures 0.71 4.61 0.00 100.00Log Price of Land for Rice 3.60 0.31 2.40 4.36Log Price of Land for other Agricultural Crops 2.34 0.51 0.90 3.85Log Residential Land Price 4.17 0.80 2.36 6.83Log Average Loan Size 12.61 1.41 7.56 17.28Telegraph Transmissions per capita 0.89 0.89 0.00 5.50Commercial Bank Branches 1.75 1.83 0.00 15.00BOJ Bank Branches 0.19 0.46 0.00 3.00BOJ Correspondent Relationships 3.30 3.04 0.00 22.00Bank Merger Rate 1.28 5.59 0.00 100.00Voluntary Liquidation Rate for Banks 0.69 4.10 0.00 100.00Bank Entry Rate 10.60 31.22 0.00 575.00Distance (kilometers from Tokyo or Osaka) 330.333 316.4232 0 1602.5 Sources: See the text for a detailed description of data sources.

40
Table 3. Regressions Explaining the Convergence in Interest Rates, 1884-1925
Relative to Relative to Relative toPrefectural Prefectural Prefectural Relative to Relative to
Independent Variable Average Average Average Tokyo's Rate Osaka's Rate
Bank Failures 0.0117 0.0011 0.0019 0.0014 0.0026(standard error) 0.0077 0.0069 0.0070 0.0069 0.0068
Price of Land for Rice -1.2428 *** -0.0429 -0.8496 *** 0.2783 0.03740.1549 0.5717 0.3594 0.5799 0.5687
Price of Land for other -0.2620 *** -0.8491 * -0.4410 *** -0.8243 * -0.9872 ** agricultural crops 0.0677 0.4477 0.1690 0.4489 0.4719
Residential Land Price -0.1589 ** -0.0468 -0.0535 -0.1200 -0.10200.0815 0.1037 0.0921 0.1061 0.1079
Average Loan Size -0.2237 *** 0.0215 -0.0241 0.0626 0.01460.0418 0.0616 0.0573 0.0638 0.0631
Telegraph Transmissions 0.0116 -0.1906 ** -0.1704 ** -0.2930 *** -0.2033 ** per capita 0.0696 0.0854 0.0780 0.0838 0.0956
Commercial Bank Branches -0.0958 *** -0.0450 * -0.0497 ** -0.0418 * -0.0471 *0.0179 0.0256 0.0228 0.0256 0.0259
BOJ Bank Branches -0.1093 * -0.2066 *** -0.1772 ** -0.1924 *** -0.2011 **0.0633 0.0890 0.0867 0.0888 0.0898
BOJ Correspondent 0.0113 0.0074 0.0083 0.0066 0.0067 Relationships 0.0079 0.0105 0.0095 0.0106 0.0106
Bank Merger Rate 0.0097 ** 0.0038 0.0038 0.0032 0.00400.0041 0.0034 0.0035 0.0034 0.0035
Voluntary Liquidation Rate 0.0067 0.0059 0.0059 0.0053 0.0072 for Banks 0.0066 0.0047 0.0049 0.0046 0.0046
Bank Entry Rate -0.0006 -0.0005 -0.0006 -0.0005 -0.00050.0011 0.0010 0.0010 0.0010 0.0010
Distance 0.0005 *** 0.0008 **0.0001 0.0004
Year Dummies Yes Yes Yes Yes YesNumber of Observations 1806 1806 1806 1766 1766Estimation Method Pooled OLS Fixed Random Fixed Fixed
Effects Effects Effects Effects
Notes and Sources: Column 1 estimates pooled OLS and columns 2-5 estimates panel regressions based onequation 1 in the text. In columns 1-3 the dependent variable is the annual average lending rate in prefecture i, year t, minus the the mean across all prefectures. In columns 4 and 5, the dependent variable is the annual averagelending rate in prefecture i, year t, minus the rate in Tokyo or Osaka, respectively. A constant term (not reported)was also included. See the text for variable definitions and sources. Stars indicate significance at 1(***), 5(**), and 10(*) percent levels, respectively. Robust standard errors are reported below the estimated regression coefficients.