imaging the blue mountain geothermal site using seismic ... · seismic interferometry allows us to...
TRANSCRIPT

PROCEEDINGS, 44th Workshop on Geothermal Reservoir Engineering
Stanford University, Stanford, California, February 11-13, 2019
SGP-TR-214
1
Imaging the Blue Mountain Geothermal Site using Seismic Interferometry
Eric Matzel, Dennise Templeton, Sutton Chiorini and Trenton Cladouhos
7000 East Ave, L-046, Livermore, Ca. 94550
Keywords: Blue Mountain, EGS, interferometry, microseismicity, ambient noise correlation
ABSTRACT
In this study, we demonstrate the power of seismic interferometry for use at geothermal sites. First, we applied “virtual earthquake”
techniques to seismic deployments at the Blue Mountain, Nevada geothermal site. We obtained nearly 63,000 virtual seismograms from
active source intereferometry (ASI) of the records from historical seismic surveys of the site. These allow sharp imagery of seismic
velocities and attenuation along seven 2D profiles. Next we applied ambient noise correlation (ANC) to the existing seismic monitoring
array deployed by AltaRock Energy, together with the short term array that was deployed contemporaneously by Sandia National
Laboratory. The modern networks provide hundreds of additional paths crossing the site. This mix of instruments and networks maximizes
the resolution and extends the subsurface image in 3D to depths of several kilometers. Synthetic seismograms calculated through the 3D
model capture the complexity of the direct and scattered waves that are observed in microearthquake data.
Microseismicity is a natural response to fluid injection at geothermal sites. We have identified over 1500 local events within the geothermal
region at Blue Mountain, since the deployment of the permanent array in late 2015. The rate of seismicity spikes during operational
changes, particularly during maintenance periods when injection is switched off. We located this seismicity by back-propagating through
the 3D model. The spikes in seismicity appear to follow a repeating pattern: early in the sequence, microearthquakes occur near the
junction of two major faults, and shift progressively deeper over the course of several days.
1. INTRODUCTION
This work is part of a larger project to develop methods for imaging subsurface fractures and permeability in geothermal areas by using
multiple techniques. In this paper we discuss the use of seismic interferometry to image the subsurface. These images help capture the
detailed changes in velocity and attenuation that may indicate permeable zones and potential drilling targets. In addition, this paper focuses
on the application of seismic techniques to resolve detailed geophysical parameters (Vs, Vp and Qs), and to identify, locate and
characterize local microseismicity.
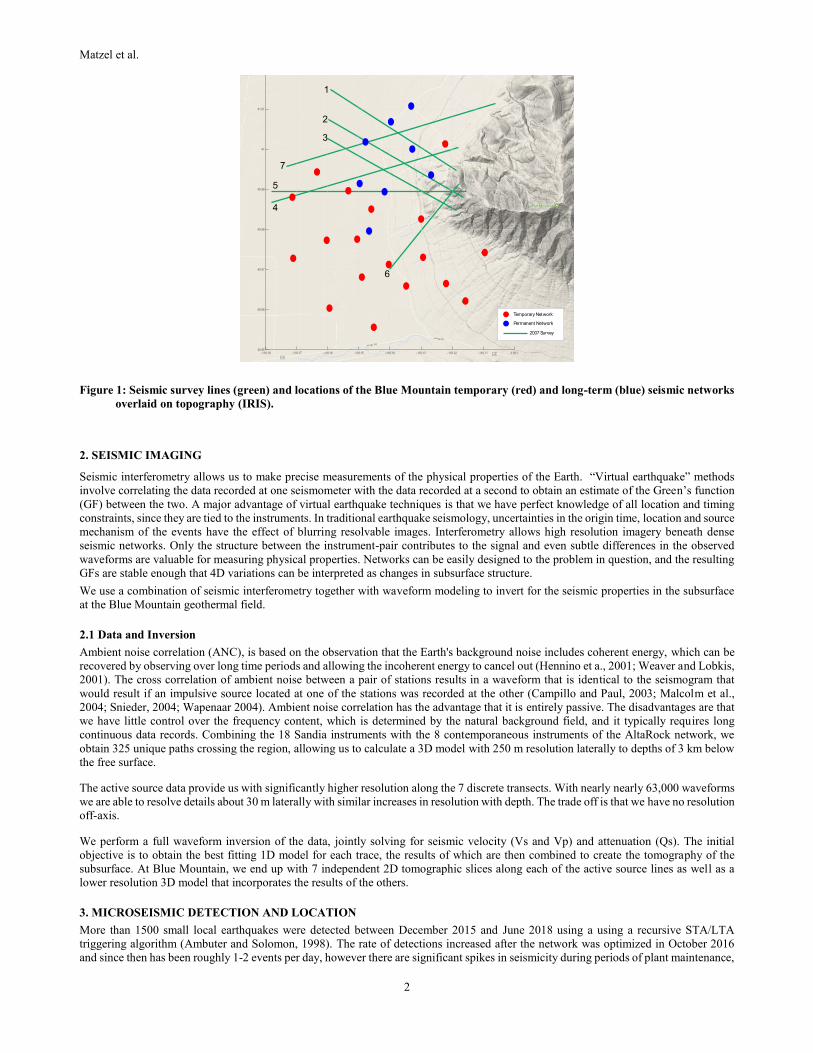
The Blue Mountain geothermal site in northern Nevada was selected as a testbed because multiple geophysical surveys have been
conducted at the site, including gravity, magneto-telluric, seismic reflection and refraction surveys. There are several sets of seismic data
that we use in our analysis, involving 3 deployments (figure 1). The first is data from the active source seismic study conducted by Optim
in 2007 and used to develop conceptual thermal models of the area ( Casteel et al. 2008, Melosh et al., 2010). This involved seven lines,
consisting of between 117 to 179 channels along a total of almost 21 miles, and provides nearly 63,000 waveforms. We use these data to
create high resolution 2D imagery along each of the 7 transects. The second deployment is a monitoring network deployed by AltaRock,
which has been recording continuously, since. This network includes 8 contemporaneous 3-component instruments. Originally deployed
in late 2015, this network was optimized in October 2016, and two of the stations were relocated to provide higher sensitivity to the local
microseismicity. This network provides the majority of the microseismic records and contributes to the 3D modeling work. The third
deployment was a temporary network set up by Sandia which recorded several weeks of continuous data between December 2017 and
January 2018 (Poppeliers and Knox, 2017). The combined Sandia and AltaRock networks were used to create the local 3D seismic model.
Matzel et al.
2
Figure 1: Seismic survey lines (green) and locations of the Blue Mountain temporary (red) and long-term (blue) seismic networks
overlaid on topography (IRIS).
2. SEISMIC IMAGING
Seismic interferometry allows us to make precise measurements of the physical properties of the Earth. “Virtual earthquake” methods
involve correlating the data recorded at one seismometer with the data recorded at a second to obtain an estimate of the Green’s function
(GF) between the two. A major advantage of virtual earthquake techniques is that we have perfect knowledge of all location and timing
constraints, since they are tied to the instruments. In traditional earthquake seismology, uncertainties in the origin time, location and source
mechanism of the events have the effect of blurring resolvable images. Interferometry allows high resolution imagery beneath dense
seismic networks. Only the structure between the instrument-pair contributes to the signal and even subtle differences in the observed
waveforms are valuable for measuring physical properties. Networks can be easily designed to the problem in question, and the resulting
GFs are stable enough that 4D variations can be interpreted as changes in subsurface structure.
We use a combination of seismic interferometry together with waveform modeling to invert for the seismic properties in the subsurface
at the Blue Mountain geothermal field.
2.1 Data and Inversion
Ambient noise correlation (ANC), is based on the observation that the Earth's background noise includes coherent energy, which can be
recovered by observing over long time periods and allowing the incoherent energy to cancel out (Hennino et a., 2001; Weaver and Lobkis,
2001). The cross correlation of ambient noise between a pair of stations results in a waveform that is identical to the seismogram that
would result if an impulsive source located at one of the stations was recorded at the other (Campillo and Paul, 2003; Malcolm et al.,
2004; Snieder, 2004; Wapenaar 2004). Ambient noise correlation has the advantage that it is entirely passive. The disadvantages are that
we have little control over the frequency content, which is determined by the natural background field, and it typically requires long
continuous data records. Combining the 18 Sandia instruments with the 8 contemporaneous instruments of the AltaRock network, we
obtain 325 unique paths crossing the region, allowing us to calculate a 3D model with 250 m resolution laterally to depths of 3 km below
the free surface.
The active source data provide us with significantly higher resolution along the 7 discrete transects. With nearly nearly 63,000 waveforms
we are able to resolve details about 30 m laterally with similar increases in resolution with depth. The trade off is that we have no resolution
off-axis.
We perform a full waveform inversion of the data, jointly solving for seismic velocity (Vs and Vp) and attenuation (Qs). The initial
objective is to obtain the best fitting 1D model for each trace, the results of which are then combined to create the tomography of the
subsurface. At Blue Mountain, we end up with 7 independent 2D tomographic slices along each of the active source lines as well as a
lower resolution 3D model that incorporates the results of the others.
3. MICROSEISMIC DETECTION AND LOCATION
More than 1500 small local earthquakes were detected between December 2015 and June 2018 using a using a recursive STA/LTA
triggering algorithm (Ambuter and Solomon, 1998). The rate of detections increased after the network was optimized in October 2016
and since then has been roughly 1-2 events per day, however there are significant spikes in seismicity during periods of plant maintenance,
-118.18 -118.17 -118.16 -118.15 -118.14 -118.13 -118.12 -118.11 -118.140.95
40.96
40.97
40.98
40.99
41
41.01
Temporary Network
Permanent Network
2007 Survey
1
2
3
7
5
4
6

Matzel et al.
3
particularly when operations are shutdown. The spikes in seismicity appear to follow a repeating pattern: microquakes early in the
sequence occur shallow, near the junction of 2 major faults, and propagate down and outward, predominantly along the major fault trends.
During normal operations, the seismicity is more widely distributed across the site. We relocated the events using back-propagation
through the 3D model testing the data against thousands of points within the local region to determine an optimal fit (figure 2).
Figure 2: Left: Vs model along seismic line 3 showing high structural resolution overlaid by back-projection of local seismicity.
Major faults and contacts from the geologic reference model are superimposed as lines. During back-projection, we test
thousands of locations in the subsurface. For this event the best fitting points fall within the junction of two fault systems.
Best performing location in blue, poorest performing locations are red. Right: records of one of the post-shutdown events
at the elements of the monitoring network.
3. CONCLUSION
Using the dense geophysical data sets available at the Blue Mountain geothermal site we are able to create high resolution imagery and
associate seismicity with operational changes. By jointly inverting for several geophysical variables we can begin to attribute geophysical
phenomena with structural interpretations. While individually these parameters have a complex relationship to geology, temperature and
composition, in combination they can illuminate fundamental structures. We expect that a hot, fractured, porous, fluid-filled media will
be characterized by low Vs, low Vs/Vp and high attenuation (low Q) relative to its surroundings. By combining the measures, we can
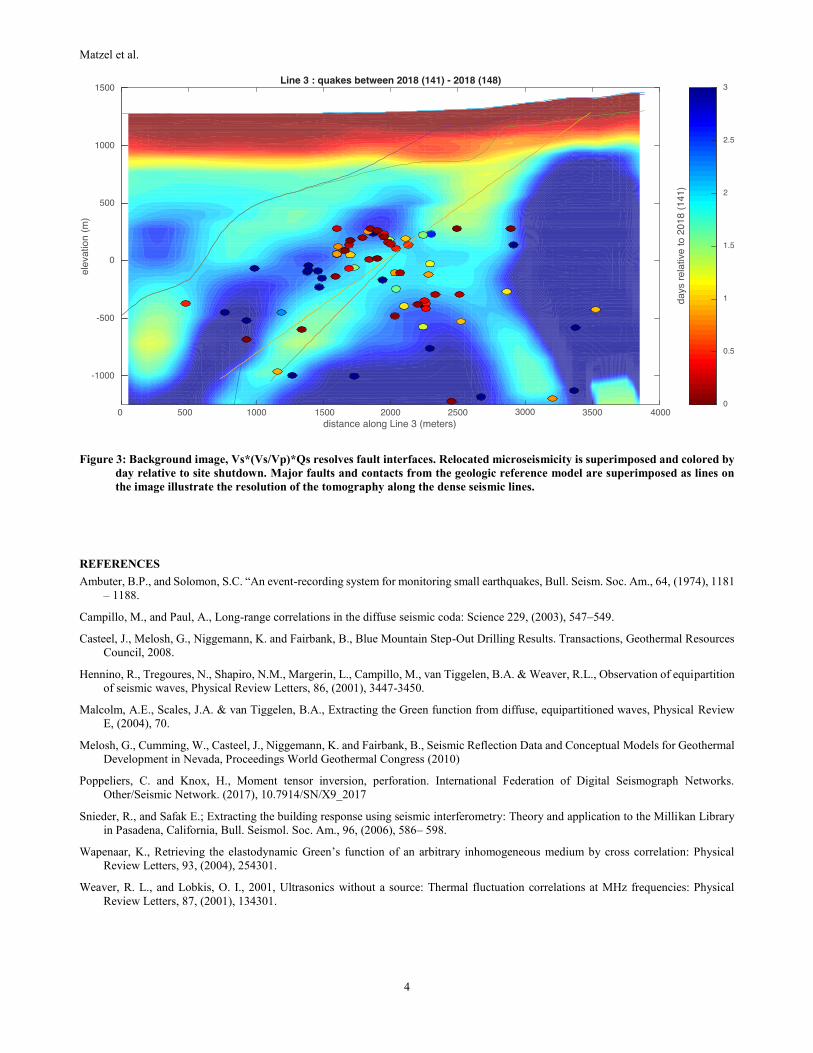
highlight the conductive fractures. In figure 3, we map Vs*Vs/Vp*Qs from the inverted model, and superimpose the sequence of seismicity
from a shutdown event in 2018. Interestingly, the best fit locations preferentially fall along the bluer (high value) regions of the model,
which are presumably more competent. One interpretation is that while the fluids travel along the weaker more attenuating regions, it is
the adjacent, more competent, “hard” rock that actually breaks during these microquakes.
This work performed under the auspices of the U.S. Department of Energy by Lawrence Livermore National Laboratory under Contract
DE-AC52-07NA27344, with funding from the Geothermal Technologies Office.
Matzel et al.
4
Figure 3: Background image, Vs*(Vs/Vp)*Qs resolves fault interfaces. Relocated microseismicity is superimposed and colored by
day relative to site shutdown. Major faults and contacts from the geologic reference model are superimposed as lines on
the image illustrate the resolution of the tomography along the dense seismic lines.
REFERENCES
Ambuter, B.P., and Solomon, S.C. “An event-recording system for monitoring small earthquakes, Bull. Seism. Soc. Am., 64, (1974), 1181
– 1188.
Campillo, M., and Paul, A., Long-range correlations in the diffuse seismic coda: Science 229, (2003), 547–549.
Casteel, J., Melosh, G., Niggemann, K. and Fairbank, B., Blue Mountain Step-Out Drilling Results. Transactions, Geothermal Resources
Council, 2008.
Hennino, R., Tregoures, N., Shapiro, N.M., Margerin, L., Campillo, M., van Tiggelen, B.A. & Weaver, R.L., Observation of equipartition
of seismic waves, Physical Review Letters, 86, (2001), 3447-3450.
Malcolm, A.E., Scales, J.A. & van Tiggelen, B.A., Extracting the Green function from diffuse, equipartitioned waves, Physical Review
E, (2004), 70.
Melosh, G., Cumming, W., Casteel, J., Niggemann, K. and Fairbank, B., Seismic Reflection Data and Conceptual Models for Geothermal
Development in Nevada, Proceedings World Geothermal Congress (2010)
Poppeliers, C. and Knox, H., Moment tensor inversion, perforation. International Federation of Digital Seismograph Networks.
Other/Seismic Network. (2017), 10.7914/SN/X9_2017
Snieder, R., and Safak E.; Extracting the building response using seismic interferometry: Theory and application to the Millikan Library
in Pasadena, California, Bull. Seismol. Soc. Am., 96, (2006), 586– 598.
Wapenaar, K., Retrieving the elastodynamic Green’s function of an arbitrary inhomogeneous medium by cross correlation: Physical
Review Letters, 93, (2004), 254301.
Weaver, R. L., and Lobkis, O. I., 2001, Ultrasonics without a source: Thermal fluctuation correlations at MHz frequencies: Physical
Review Letters, 87, (2001), 134301.