illinois cost model
TRANSCRIPT

Illinois Cost Model for Early Childhood Education and Care ServicesUpdated February 2021

2
IntroductionIllinois is committed to fulfilling its historical commitment to the care and education of its youngest children. Numerous public and private stakeholders have come together around a comprehensive vision for the state as it relates to supporting young children: We envision Illinois as a place where every young child — regardless of race, ethnicity, income, language, geography, ability, immigration status, or other circumstance — receives the strongest possible start to life so that they grow up safe, healthy, happy, ready to succeed, and eager to learn. One critical part of this vision is ensuring that families have access to early care and education services to ensure that not only do children have a strong start in life but that their parents can fully participate in the workforce knowing that that children are in safe, healthy, and high-quality care and education environments.
While Illinois’ three major funding streams for early childhood education and care provide critical services for many children, the reality is that many families are not able to access the care and education that they want and need. Additionally, the current workforce is inadequate to meet the current demand for educators, let alone what may be needed for future growth. In order to support efforts to ensure that Illinois’ vision is fulfilled, in 2019, as part of the federal Preschool Development Grant (PDG B-5) Needs Assessment, the Illinois Governor’s Office of Early Childhood Development (GOECD) requested a cost model for a comprehensive system of early childhood education and care for all children ages 0-5 in Illinois. This report describes the process for developing a comprehensive cost model as well as the findings from this work. In 2020-2021, the model was vetted by the Funding Adequacy Workgroup of the Governor’s Early Childhood Funding Commission. Recommended changes to the model that reached consensus are reflected in this updated report.
With funding from the federal PDG B-5, Illinois engaged Northern Illinois University (NIU), specifically Theresa Hawley and Kate Ritter, to analyze the cost of providing high-quality early childhood education and care (ECEC) services to all families in Illinois. The primary research question posed by the GOECD is: “what is the per child and total cost of providing high-quality early education and care services via licensed or school-based settings to all families in Illinois?” Additionally, the project was charged with addressing the use of a sliding scale for family co-pay and taking into consideration existing funding eligibility regulations.
In consultation with numerous public agencies and private stakeholders, a plan was developed and refined that addresses the following:• the need for multiple program models to support family choice and need (full day, year-round
center-based ECEC with and without enhanced comprehensive services; school-day, school-year ECEC with full comprehensive services; part-day, school-year ECEC with more limited parent education and support);
• the substantial variation in need for a more intensive and comprehensive set of services based on early life experiences and developmental needs of individual children;
• wage parity across positions and existing funding streams; • an analysis of barriers to funding and providing high-quality ECEC services and opportunities
(These amounts need to be updated by GOECD) Current Approximate Funding for Major ECE Funding Streams:
HS/EHS = $403M (27%)CCAP = $544M (36%)ECBG = $544M (36%)TOTAL = $1.382B
3
for more efficient use of resources; and• the need for a range of models for appropriately qualified support staff.
The cost model has been designed to address the above issues, and incorporates assumptions to reflect current best practices and service expectations as understood by the authors after review of the literature and consultation with the Quality Committee and Data, Research and Evaluation Subcommittee of the Illinois Early Learning Council. These assumptions and the justification for them are described in this report. It is hoped that the findings of this report will be used to: • inform the recommendations of the planned Governor’s Early Childhood Funding Commission;• inform planning for near-term expansion of early childhood education and care services; and• inform policy for Illinois Department of Human Services’ Child Care Assistance Program (CCAP)
rates, taking into account new minimum wage laws scheduled to be implemented state wide.
Also, of importance is what this model does NOT specify or identify. The staffing patterns, salaries, enhancements and other inputs included here are simply to generate a reasonable estimate of the COST of a fully-funded, high-quality ECEC system. This model and report do not suggest any specific changes to program funding, to requirements of any program standards, nor how funding should be identified or distributed. These key questions will require additional deliberation and input from a broad group of stakeholders.
Note: This updated version of the cost model and report reflects the input and deliberation of the Adequacy and Inclusion workgroups of the Illinois Commission on Equitable Early Childhood Education and Care Funding.

4
The ECEC system is incredibly complex and represents a classic market failure. Services are provided in a number of settings — schools, community-based organizations, homes — and paid for through a range of mechanisms by public/government and private actors. Further, deeply held cultural values impact funding and available options for services. Ultimately, the burden rests with individual families to identify and figure out how to pay for care and education in the early years of their children’s lives. While Illinois has been a leader in funding early childhood education and care many families still struggle to find and afford care and many if not most providers are inadequately compensated. Determining the true cost of a quality system for ECEC requires both setting a “north star” for desired end results of the system and taking into account the complex range of cost drivers for the system. This section describes both the system values represented by the cost assumptions made in this report as well as the core set of variables taken into consideration for cost models.
Values For An Equitable And High Quality SystemThe following set of guiding values reflect goals of the ECEC community for a high quality early childhood system. These values acknowledge the challenges in our current system that require funding to address if we are to put an end to inequities in quality and access and ultimately provide a more accurate estimation of the investment needed to reach a high quality, comprehensive ECEC system. The values include:• Program models that meet families’ needs and preferences for schedule and setting;• Program models that provide comprehensive services that are sufficient to address the needs
of children who are furthest from opportunity, including those in poverty or experiencing homelessness or child welfare involvement;
• Program models that are culturally and linguistically appropriate and meet the full range of special needs that young children have;
• Parity in compensation and benefits across the profession, commensurate with varying characteristics such as qualifications and role, to ensure highly qualified teachers and staff are hired and retained;
• Staffing patterns that allow for adequate time for teacher’s engagement in lesson preparation, professional development, parent engagement, and consultation services;
• Class sizes and staff-to-child ratios that reflect best practice for each age group;• Adequate infrastructure investment to ensure appropriate quality improvement supports are
available as well as opportunities to build a highly qualified workforce.
Consensus ProcessAt multiple points in the project the consultants sought input from a variety of stakeholders to share and check assumptions as well as hear other feedback.
The compensation schedule and staffing patterns were vetted by the Early Learning Council (ELC) Quality Committee and align with the Consensus Statement on Early Childhood Educator Compensation and the Achieving Compensation Parity: Illinois Goal for the Field of Early Childhood Care and Education report.
Cost Modeling Approach

5
Regional discussions with providers were conducted by the consultants in partnership with Illinois Action for Children to check assumptions used and get feedback on model development. Providers had the opportunity to review the compensation schedule, staffing patterns, and non-personnel inputs. These discussions allowed providers to give feedback on our input data to ensure the models were capturing the true cost of care.
The models were presented in their entirety to the ELC Quality Committee, the Data Research and Evaluation subcommittee and the Inter-Agency Team.1 Feedback on input data, assumptions and findings were collected both verbally and via an online form. Through the online form, we received critical feedback on the assumptions for children with disabilities, Dual Language Learners, and family child care. We met with people and agencies that submitted comments to clarify and improve our cost estimates for those types of care, ensuring that the appropriate additional costs were captured and number of children were identified. Specifically, staff from the Latino Policy Forum provided invaluable assistance with developing assumptions for cost to support young dual language learners.
In 2020, the Funding Adequacy Workgroup reviewed the model and its components in detail. The following services were added to the comprehensive model: 1) transportation for children in community-based programs (CBO), family child care programs (FCC), and school-based preK programs; 2) Early Intervention services; 3) dual language for children in school-based preK programs (additional costs to serve dual language children in CBOs and FCCs were included in the original); 4) early childhood special education (ECSE) in school-based preschool programs. The cost estimate for ECSE in CBOs was significantly revised based on data collection, meetings and feedback from statewide practitioners in ECSE. Smaller revisions were made to costs associated with CBOs, FCCs, and Home Visiting. Three focus group meetings were held to review assumptions: two with CBOs and one with districts. The full Commission reviewed and approved all recommended changes made through the Funding Adequacy Workgroup.
Data Collection To understand the current true operating expenses of early childhood education programs, Illinois Action for Children distributed a survey, developed by the consultants, to ECEC programs across the state. The survey included questions on staffing structures and education levels of staff, salary schedules, benefits, non-personnel costs, and program size. The survey was distributed to both CBOs and family child care homes (FCC) and nearly 200 surveys were completed. The use of this data is described in the relevant sections below.
A nationally recognized cost-modeling tool, the Provider Cost of Quality Calculator (PCQC), was used to supply data for non-personnel costs in CBOs and FCCs, such as marketing, printing, insurance and audit costs, that were unclear or missing from local budgets. Data from the Illinois Facilities Fund (IFF) was utilized to adjust some non-personnel costs, such as rent and depreciation.
Budget information for public preschool programs was obtained through the Illinois School Board of Education (ISBE) Evidence-Based Funding Formula (EBF). The EBF includes classroom operating costs, staffing and salary schedules for teachers and administrators, as well as information about costs for student assessment, computer/technology equipment, student activities, operations and maintenance, and central office for Pre-K through Grade 12. For more information on the EBF, see page 9.

6
Structural Drivers Of CostAs noted above the complexity of our system is a result of the range of funders, and therefore program requirements, as well as differing desires and needs of parents across Illinois. To construct the model, the following key cost drivers were taken into account to accurately reflect Illinois’ current ECEC landscape:• Mixed delivery system where services are provided in a range of settings by community-based
organizations (CBOs), public schools, and family child care homes (FCC) and at variety of intensities (part-day, school-day, full day);
• Programmatic requirements and related cost variations (e.g., staffing structure) based on funding framework, including Head Start, Early Head Start, Preschool for All, Preschool for All Expansion, Prevention Initiative, Child Care licensing rules, and varying ExceleRate Circles of Quality;
• Cost variation by geography;• Incorporation of minimum wage implementation.
Service Delivery ModelsIn a mixed delivery system, it is essential to determine a per child cost based on 1) the setting in which services are provided (either in a K-12 school or a CBO or a home), 2) the number of days per year services are provided, and 3) the number of hours the program operates (i.e., part-day, school-day, full-day). Per child costs were generated for each of the following service delivery models (for a description of “comprehensive” and “high quality” center-based models, see Staffing Structure section on page 11):
For each model an associated staffing pattern, salary schedule, and set of non-personnel costs was generated to come up with a per child cost. Salary schedules and rent (a non-personnel cost) were varied based on geographic region of the state, as described below.
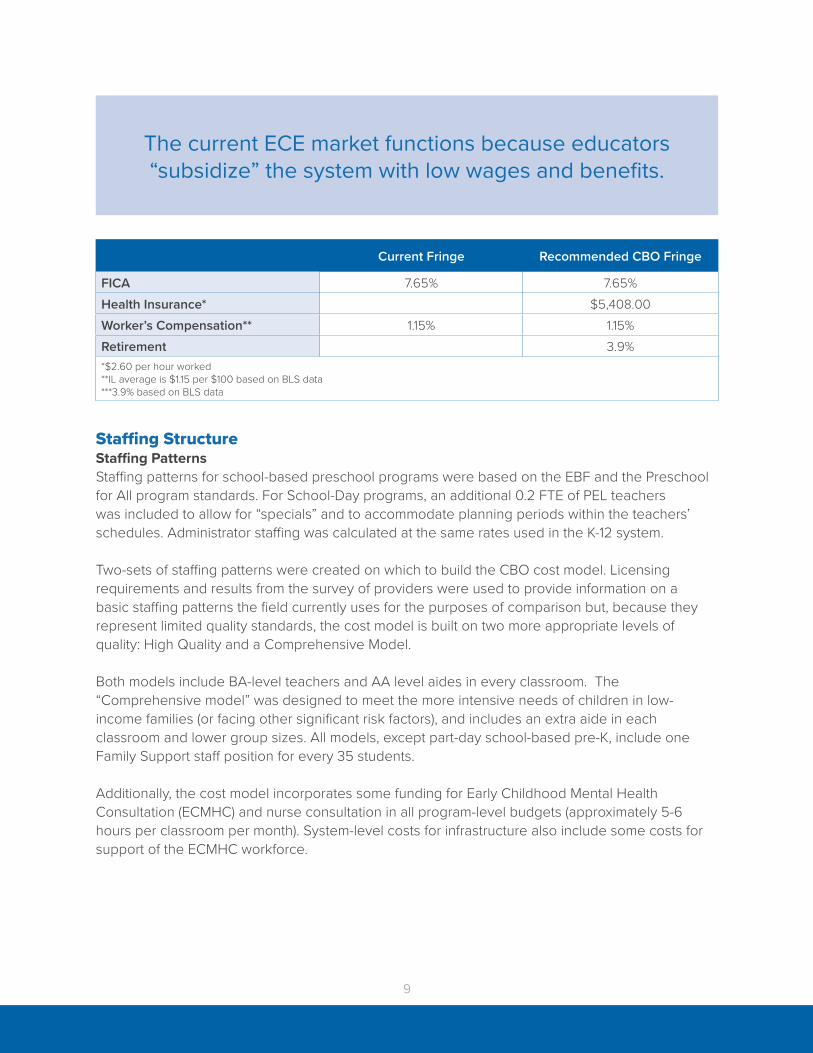
Salary Schedule & BenefitsPersonnel is the largest cost factor in ECEC, accounting for 60-80% of program expenses.3 High quality ECEC requires a well-qualified, well-compensated, and stable workforce. Unfortunately, ECEC teachers remain one of the lowest paid professions both in Illinois and nationally. The current ECEC market functions only because educators in community-based programs “subsidize”
Models2 Infants and toddlers (0-3)
Preschool age children (3-4)
Comprehensive center-based (Full day, full year with comprehensive services) 3 3High quality center-based (Full day, full year ExceleRate Gold level) 3 3
School-day, school-year ECEC (ages 3 & 4 only) 3Part-day, school-year ECEC (ages 3 & 4 only) 3Full-day, year-round family child care 3 3Home Visiting 3

7
the system through their low wages and benefits.
Rather than using the current wage and benefit structure, our model is built to estimate costs if there were greater parity in compensation (including both wages/salary and benefits) across early childhood service delivery models. Compensation parity means that the salary and benefit schedules for early childhood educators in non-school settings are built commensurate with local school district elementary educators and based on varying characteristics such as qualifications, role, and tenure.
A range of data sources were used to understand the current landscape and inform recommendations for the salary schedule for CBOs, family child care providers and home visiting staff. Current salary data from the field was collected from Illinois Network of Child Care Resource & Referral Agencies (INCCRRA) through the Gateways Registry as well as the Illinois Salary & Staffing Survey4 and labor statistics data by occupation were obtained from the Bureau of Labor Statistics (BLS) public datasets (see chart below for current salary data for each position). For the Chicago Metro area, we also relied on data from a survey we conducted in collaboration with the Mayor’s Office of Chicago-based child care programs and delegate agencies of the Chicago Department of Family & Support Services in December 2017. We then compared current wages to salaries included in the FY2020 calculations for the K-12 Evidence-Based Funding (EBF) formula as well as to average salaries across all occupations (by education level) and to upcoming changes to minimum wage in Chicago and Illinois.
Determining a “Recommended” salary structure was challenging for a number of reasons. For example, it was determined that simply using the average salary of K-12 teachers (or the teacher salary used in the EBF formula calculations) was not an appropriate benchmark for BA-level teachers without a Professional Educator License (PEL), as the majority of teachers in Illinois public schools actually have Master’s degrees, and the annual work schedule in CBO settings is not the same as in schools. The Recommended Salaries shown below were developed by consensus of the Compensation Work Group and the Quality Committee of the Illinois Early Learning Council. The following recommended salary schedule for CBOs and FCC providers reflects approximate parity with average salaries in Illinois across all fields for jobs requiring specific levels of education
Illinois’ Evidence-Based Funding Formula The Evidence-Based Funding for Student Success Act was signed into law on August 31, 2017. This law enacts evidence-based funding (EBF) and comprehensively changes the way that school districts receive the bulk of state funds. EBF implements a formula that prioritizes equity and allocates state funding to school districts based on student need.
The new formula calculates the cost of providing students with a high-quality education, the cost of adequacy, and assesses how far districts currently are from reaching that amount. The steps are:1) Give each district the same amount of state funds as previous year.2) Calculate how much it costs to educate students in each district.3) Figure out how many local resources are available for education.4) Direct new state funds to the lowest-funded districts first.

8
(AA, BA, etc.). We also ensured that wages for every staff position (i.e. janitorial/maintenance staff, cooks, etc.) would be above new minimum wage laws. For school-based positions, the salaries included in the K-12 EBF calculations were used to ensure consistency with that model. In addition, for CBO-based positions requiring a PEL, the salaries from the EBF formula were used.
The following table presents data on current average salaries, separated between the Chicago Metro area and the balance of the state, along with the recommended salary scales used in the cost model for care outside of public schools.
BLS data was used to set recommended benefit amounts for health insurance, worker’s compensation and retirement. The model does not use a standard fringe rate calculated as a percentage of salaries because wages in the industry are so low that a typical fringe percentage would not cover the true cost of providing health insurance. Actual costs for health insurance and other benefits from BLS data as shown in the table below:
Salary Scales
Balance of the State Chicago Metro
Personnel Current Average Recommended Current
Average Recommended
Site Director (PI/PFA) $49,629a $63,750 $55,393d $75,000
Site Director (Licensed) $33,195a $46,750 $39,092a $55,000
Additional Professional Staff (Out Of Classroom) $28,333a $47,500 $32,344d $55,000
Teacher (PEL) $55,806f $55,806 $65,104f $65,104
Teachers (Bachelor’s degree) $32,032a $41,650 $32,402d $52,000
Teachers (Associate Degree) $23,490a $36,550 $29,661a $43,000
Teacher Assistants $19,741a $33,150 $27,352d $39,000
Teacher Aides $17,160c $27,664 $27,040e $32,323
Lead Floater Teacher/Sub $23,000 $36,550 $28,000 $43,000
Assistant Floater Teacher/Sub $19,500 $33,150 $27,040e $39,000
Family Engagement Specialists $29,000b $39,000 $33,569b $45,000
Cook $20,000b $27,664 $29,000b $32,323
Asst Cook/Food Aide $17,160c $20,800 $27,040e $29,120
Administrative Assistant $25,500b $29,750 $30,000b $37,565
Maintenance Workers $17,160c $27,664 $27,040+ $32,323aSalary figures obtained from FY2017 Illinois Salary and Staffing SurveybSalary figures obtained from Early Childhood Workforce Consensus Statement on Early Childhood Educator CompensationcCurrent IL minimum wagedSalary figures obtained from Chicago Delegate Survey, December 2017eCurrent Chicago minimum wagefIllinois Evidence Based Funding Formula
9
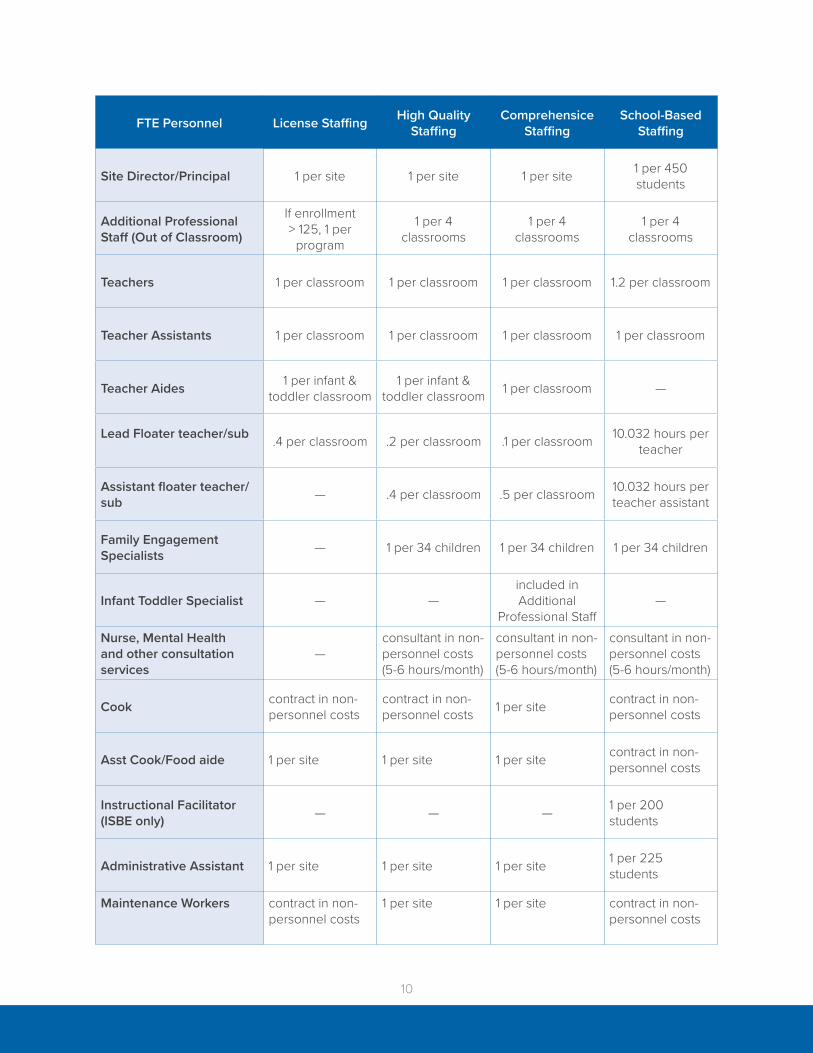
Staffing StructureStaffing Patterns Staffing patterns for school-based preschool programs were based on the EBF and the Preschool for All program standards. For School-Day programs, an additional 0.2 FTE of PEL teachers was included to allow for “specials” and to accommodate planning periods within the teachers’ schedules. Administrator staffing was calculated at the same rates used in the K-12 system.
Two-sets of staffing patterns were created on which to build the CBO cost model. Licensing requirements and results from the survey of providers were used to provide information on a basic staffing patterns the field currently uses for the purposes of comparison but, because they represent limited quality standards, the cost model is built on two more appropriate levels of quality: High Quality and a Comprehensive Model.
Both models include BA-level teachers and AA level aides in every classroom. The “Comprehensive model” was designed to meet the more intensive needs of children in low-income families (or facing other significant risk factors), and includes an extra aide in each classroom and lower group sizes. All models, except part-day school-based pre-K, include one Family Support staff position for every 35 students.
Additionally, the cost model incorporates some funding for Early Childhood Mental Health Consultation (ECMHC) and nurse consultation in all program-level budgets (approximately 5-6 hours per classroom per month). System-level costs for infrastructure also include some costs for support of the ECMHC workforce.
Current Fringe Recommended CBO Fringe
FICA 7.65% 7.65%Health Insurance* $5,408.00Worker’s Compensation** 1.15% 1.15%Retirement 3.9%*$2.60 per hour worked**IL average is $1.15 per $100 based on BLS data***3.9% based on BLS data
The current ECE market functions because educators “subsidize” the system with low wages and benefits.
10
FTE Personnel License Staffing High Quality Staffing
Comprehensice Staffing
School-Based Staffing
Site Director/Principal 1 per site 1 per site 1 per site 1 per 450 students
Additional Professional Staff (Out of Classroom)
If enrollment > 125, 1 per
program
1 per 4 classrooms
1 per 4 classrooms
1 per 4 classrooms
Teachers 1 per classroom 1 per classroom 1 per classroom 1.2 per classroom
Teacher Assistants 1 per classroom 1 per classroom 1 per classroom 1 per classroom
Teacher Aides 1 per infant & toddler classroom
1 per infant & toddler classroom 1 per classroom —
Lead Floater teacher/sub .4 per classroom .2 per classroom .1 per classroom 10.032 hours per
teacher
Assistant floater teacher/sub — .4 per classroom .5 per classroom 10.032 hours per
teacher assistant
Family Engagement Specialists — 1 per 34 children 1 per 34 children 1 per 34 children
Infant Toddler Specialist — —included in Additional
Professional Staff—
Nurse, Mental Health and other consultation services
—consultant in non-personnel costs (5-6 hours/month)
consultant in non-personnel costs (5-6 hours/month)
consultant in non-personnel costs (5-6 hours/month)
Cook contract in non-personnel costs
contract in non-personnel costs 1 per site contract in non-
personnel costs
Asst Cook/Food aide 1 per site 1 per site 1 per site contract in non-personnel costs
Instructional Facilitator (ISBE only) — — — 1 per 200
students
Administrative Assistant 1 per site 1 per site 1 per site 1 per 225 students
Maintenance Workers contract in non-personnel costs
1 per site 1 per site contract in non-personnel costs
11
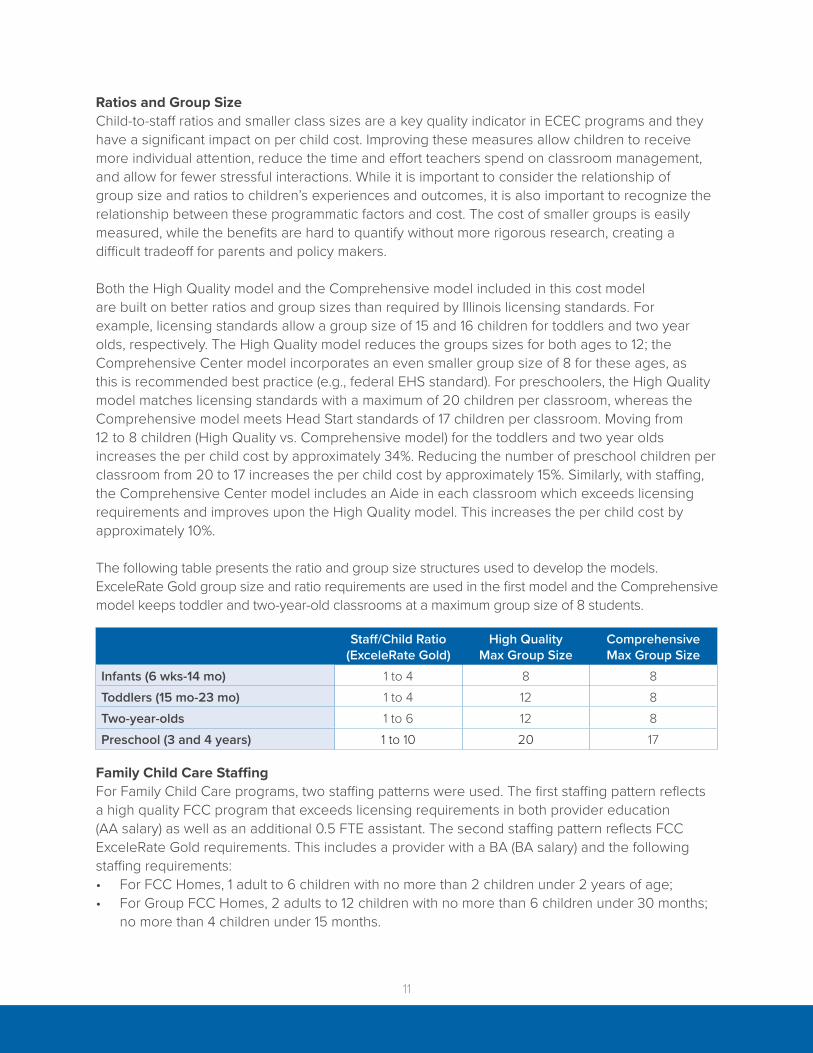
Ratios and Group SizeChild-to-staff ratios and smaller class sizes are a key quality indicator in ECEC programs and they have a significant impact on per child cost. Improving these measures allow children to receive more individual attention, reduce the time and effort teachers spend on classroom management, and allow for fewer stressful interactions. While it is important to consider the relationship of group size and ratios to children’s experiences and outcomes, it is also important to recognize the relationship between these programmatic factors and cost. The cost of smaller groups is easily measured, while the benefits are hard to quantify without more rigorous research, creating a difficult tradeoff for parents and policy makers.
Both the High Quality model and the Comprehensive model included in this cost model are built on better ratios and group sizes than required by Illinois licensing standards. For example, licensing standards allow a group size of 15 and 16 children for toddlers and two year olds, respectively. The High Quality model reduces the groups sizes for both ages to 12; the Comprehensive Center model incorporates an even smaller group size of 8 for these ages, as this is recommended best practice (e.g., federal EHS standard). For preschoolers, the High Quality model matches licensing standards with a maximum of 20 children per classroom, whereas the Comprehensive model meets Head Start standards of 17 children per classroom. Moving from 12 to 8 children (High Quality vs. Comprehensive model) for the toddlers and two year olds increases the per child cost by approximately 34%. Reducing the number of preschool children per classroom from 20 to 17 increases the per child cost by approximately 15%. Similarly, with staffing, the Comprehensive Center model includes an Aide in each classroom which exceeds licensing requirements and improves upon the High Quality model. This increases the per child cost by approximately 10%.
The following table presents the ratio and group size structures used to develop the models. ExceleRate Gold group size and ratio requirements are used in the first model and the Comprehensive model keeps toddler and two-year-old classrooms at a maximum group size of 8 students.
Family Child Care StaffingFor Family Child Care programs, two staffing patterns were used. The first staffing pattern reflects a high quality FCC program that exceeds licensing requirements in both provider education (AA salary) as well as an additional 0.5 FTE assistant. The second staffing pattern reflects FCC ExceleRate Gold requirements. This includes a provider with a BA (BA salary) and the following staffing requirements:• For FCC Homes, 1 adult to 6 children with no more than 2 children under 2 years of age;• For Group FCC Homes, 2 adults to 12 children with no more than 6 children under 30 months;
no more than 4 children under 15 months.
Staff/Child Ratio (ExceleRate Gold)
High Quality Max Group Size
Comprehensive Max Group Size
Infants (6 wks-14 mo) 1 to 4 8 8Toddlers (15 mo-23 mo) 1 to 4 12 8Two-year-olds 1 to 6 12 8Preschool (3 and 4 years) 1 to 10 20 17

12
The second staffing pattern also exceeds requirements by including an additional 0.5 FTE assistant to reflect more realistic business practices at high quality FCC programs.
Geographic Variation The model accounts for geographic variation in cost of living throughout the state by following the methodology of the Illinois Evidence-Based Funding Formula (EBF) for K-12 education. The EBF applies a regionalization factor based on cost of living factors in each county. We applied the regionalization factor to two inputs: salaries and rent/mortgage. All other costs were considered the same across the state (i.e. utilities, education supplies, professional development, etc.).Nearly all school districts in the EBF calculations fall into one of two extremes (highest or lowest possible factor), so for simplicity, the model assigns all counties to one of two regional variations. The Chicago Metro regionalization factor is 1.05. This includes Cook County and the surrounding counties (CCAP Group 1A counties). The balance of the state had a regionalization factor of 0.9 (this included CCAP Group 1B and Group 2 counties).
Accounting For Special Populations Another key component in the cost model is taking into consideration the needs of special populations and ensuring adequate resources are available to support their needs. In consultation with Committees and subcommittees of the Early Learning Council as well as other key stakeholder groups, assumptions were developed and incorporated to address the need for mental health consultation at a variety of levels of intensity, the need to support and foster the unique strengths of dual language learners, and to support children with special needs. The approach incorporated for each of these special populations is included below.
Dual Language Learners For children enrolled in preschool programs in Illinois public schools (part-day or full-school-day), ISBE’s evidence-based funding formula (EBF) for K-12 schools takes into account the cost of providing preschool services for children whose home language is something other than English. ISBE provided a tailored analysis of the costs in the FY21 EBF to determine the proportion of DLL costs attributable to PreK students. The total amount represents an assumption of resources that would be allocated to the PreK DLL student population if all districts were at 100% or more of adequate funding. ISBE notes that even if 100% of adequacy is achieved for all districts, the spending would come from a mix of resources.
Based on the FY21 data set, using proportional attribution, ISBE calculates an amount of $54.5M that is built into current Adequacy Targets for approximately 18,843 PreK DLL students. ISBE also notes that these values assume costs are proportional across all DLL grade levels which may detract from the accuracy of that number. Nonetheless, it provides a solid estimate of ISBE DLL costs for PreK students.
In ECEC settings based in CBOs, the basic staffing pattern used in the models (requirements for PFA) is intensive enough to account for supporting the diverse developing language needs of young children. However, the cost model does incorporate the following the cost of additional expenses necessary for providing bilingual education in both CBOs and FCCs5.• $500 per child for differential salaries for bilingual teachers and appropriate professional
development/credential processes;

13
• $600 per child for other additional costs related to bilingual education in preschool as mandated by administrative rules within state code (administrative rules do not include services for students 0-2, however, best practice would suggest their language services be congruent with prek and beyond). These include:
• Multilingual books • Software programs (applications and games) in multiple languages • Multicultural materials for student centers • Development or modification of student assessments and observation • Translation of information for parents in multiple languages • ESL instructional materials that are developmentally appropriate• $100 per child for screening for EL services with the Idea Proficiency Test. This includes costs
associated with ensuring all personnel conducting screenings are bilingual and materials and activities for the children are available in multiple languages and developmentally appropriate.
Total system cost for supporting Dual Language Learners (DLLs) was calculated as follows:• Approximately 30% of children live in households where another language other than English
is spoken.6 • 30% of children ages 0-5 in families <200% FPL using CBO/FCC care: 38,725 • Additional per child funding for each EL in CBO/FCC setting: $1,100 ($500 for salary & $600
for materials, assessments, translation, etc.) • Total cost for EL services in CBO/FCC setting: $42.6M
• Approximately 35% of 3-year olds need to be screened to determine if they need EL services. • 35% of 3-year olds in IL: 56,725 • Per child cost for EL screening: $100 • Total cost for EL screening: $5.7M
• TOTAL COST FOR EL SERVICES IN CBO/FCC & EL SCREENING: $48.3M
Children with Special Needs: Early Childhood Special Education (ECSE)Per the federal Individuals with Disabilities Education Act (IDEA), Local Education Agencies (LEAs) are legally responsible for providing special education and related services to children ages 3-5 in the least restrictive environment (LRE), which for most children means a classroom (or home child care) setting with typically developing peers. For preschool, under the law, settings include school and community based PreK, Head Start, and child care settings. If a child is in a community-based setting when they are identified as needing special education and related services, that is the location that should first be considered as the LRE.
The EBF for schools in Illinois includes the costs of serving preschool children with IEPs. For children with IEPs, EBF includes these children as 0.5 student in all costs except core teachers. (Note: The cost model includes the cost of core teachers in the cost of the regular preschool program that the child attends.) This report, however, includes a separate estimate of the costs of adequately providing high quality ECEC to children with disabilities in schools, based on input from school districts and advocates, that the EBF calculation currently underestimates. Furthermore, the LEAs are allotted funding based on the EBF and are obligated to provide specialized services as prescribed in the students’ IEP/IFSP, to all preschoolers who reside in their district that have IEPs/

14
IFSPs, whether they attend school-based or community-based programs. The current system, however, does not provide adequate funding or guidance to LEAs regarding services for children with IEPs/IFSPs who are in community-based settings. As a result, children in community-based programs often do not receive services in their preferred and least restrictive setting. Therefore, this cost model accounts for costs of serving children in CBOs as well as in district settings.
Funding is included for community-based organizations (CBOs) to ensure that they can support a high-quality inclusive education. This includes time to collaborate with specialized service providers, individualize instruction, attend meetings with EI and ECSE etc.7 As most children with IEPs are currently served systematically in the district setting, sample districts were surveyed to understand resources needed to serve children with IEPs. The most significant costs added for ECSE include special education teachers, aides, additional out-of-classroom professional staff, and miscellaneous non-personnel supplies. Two staffing approaches were considered as the cost model was created: 1) itinerant teacher model and 2) special education teacher/classroom model. The per child cost calculated is similar in these two models, and therefore an average was taken and is used for the per child cost for ECSE services in CBO settings, which is an additional $21,000 per child for special education specific services. That means, this amount is in addition to costs of general ECEC services for children receiving special education services. The cost model assumes 10% of children in CBO settings receive special education services.
Costs for children receiving special education services in the district setting were calculated in a similar manner — by adding incremental resources needed to serve children with IEPs. District costs were calculated for both part-day and school-day programs, and with the direct staffing model only (not itinerant teachers, as considered for CBOs). The cost model assumes 10% of children in the district setting have IEPs and are served in blended classrooms while 5% of students require self-contained classrooms with smaller number of children. These two models were created and the cost per child was used for each type of classroom for part-day and for school-day programs. Costs per child are as follows:
Given the limited data available to complete this assessment, the Commission is recommending further study on Early Childhood Special Education adequacy beyond the timeframe of the Commission.
Children with Special Needs: Early Intervention (EI)The Commission identified that the original cost model was missing costs for Early Intervention (EI) services. Accordingly, an estimate was completed to include costs for adequately serving all children eligible for services. Two major factors were considered to estimate this cost: 1) increasing access (the count of children served) and 2) increasing provider compensation (the rate at which providers are paid for services). Current assumptions are as follows:
Blended Classrooms Self-Contained Classrooms
Part-day programs $16,312 $12,978Full-day programs $24,654 $18,327

15
The Inclusion Working Group of the Commission recommended increasing the targeted percentage of children served from 3.77% to 8%, which was based on acknowledging the 14% of students in PK-12 that have IEPs, adjusted down for disabilities that cannot be diagnosed prior to age 3, including autism (1.9%) and Specific Learning Disabilities in language/reading (4%). This results in an increase in the population served by 112%. The Working Group also recommended increasing provider pay in line with private pay and insurance rates, which represents a 45% increase. The resulting cost estimate for Early Intervention services increases from today’s spending of $172M to future costs of $529M, as follows:
Similar to ECSE, given limited data availability, the Commission is recommending further study. The Commission embarked on a process to develop a survey to gather cost information from providers, but given time constraints, this was not able to be completed. Future study may utilize this survey of providers as a starting point for data gathering.
Current spending $172,000,000% increase for access 112%Total w/improved access only $364,640,000% increase for rates 45%Total w/improved rates & access $528,728,000
Current EI spending $172,000,000Current # children served8 23,092% of 0-3 children served9 3.77%

16
Per child costs were determined based on all the variables described in the previous section and are presented below by service delivery setting.
CBO MODEL Non-personnel costs used in the CBO model for the High Quality program and the Comprehensive program can be found in Appendix 1.
Group sizes and ratios that were used in the CBO models can be found in the table # on page 11. It is important to note that ratios and group size have a significant impact on per child cost as discussed in the previous section.
To account for the fact that ECEC programs do not maintain full enrollment throughout the year, we incorporated an enrollment percentage in each model. Enrollment was calculated at 90% for High Quality CBO and Comprehensive CBO for each age group.
CBO model staffing patterns and salary scales are listed in the tables on pages 8-10. The following table shows the final per child costs by age, quality level of CBO, and region of the state. As a reminder, per child costs for Chicago Metro region include a 1.05 regionalization factor and the balance of the state represents 0.9 regionalization factor.
SCHOOL MODEL Non-personnel costs used in the model for public school preschool programs can be found in Appendix 2. These cost figures were taken from the EBF. Costs for rent, utilities, insurance, administrative staff, and maintenance services are included in Central Office and Maintenance & Operations lines. As a reminder this model is for preschool age children, three- and four-year-olds, only.
Per Child Cost Based on Service Delivery Model
Per Child Cost in CBOs
High Quality Center Comprehensive Center High Quality Center Comprehensive
CenterInfant $34,396 $30,029Toddler $26,386 $37,457 $23,152 $32,419Two Year Old $23,075 $20,318Preschool $17,687 $23,933 $15,689 $20,952
Per Child Cost in Public Schools
Chicago Metro Balance of StateSchool Day $17,183 $14,927Half Day $8,999 $7,839
17
The model takes into account that for working families a school or part-day and part year program will not necessarily meet their needs for child care through counting some of those children as using relative or license exempt care in addition to a school-based program.
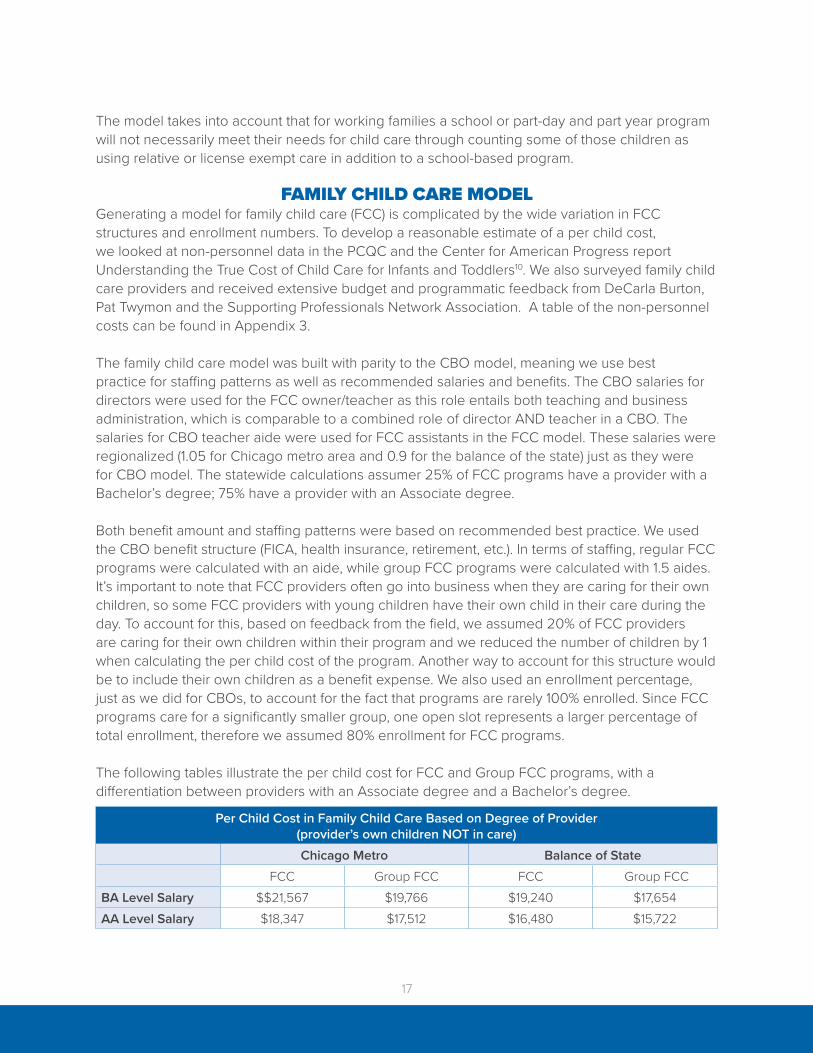
FAMILY CHILD CARE MODEL Generating a model for family child care (FCC) is complicated by the wide variation in FCC structures and enrollment numbers. To develop a reasonable estimate of a per child cost, we looked at non-personnel data in the PCQC and the Center for American Progress report Understanding the True Cost of Child Care for Infants and Toddlers10. We also surveyed family child care providers and received extensive budget and programmatic feedback from DeCarla Burton, Pat Twymon and the Supporting Professionals Network Association. A table of the non-personnel costs can be found in Appendix 3.
The family child care model was built with parity to the CBO model, meaning we use best practice for staffing patterns as well as recommended salaries and benefits. The CBO salaries for directors were used for the FCC owner/teacher as this role entails both teaching and business administration, which is comparable to a combined role of director AND teacher in a CBO. The salaries for CBO teacher aide were used for FCC assistants in the FCC model. These salaries were regionalized (1.05 for Chicago metro area and 0.9 for the balance of the state) just as they were for CBO model. The statewide calculations assumer 25% of FCC programs have a provider with a Bachelor’s degree; 75% have a provider with an Associate degree.
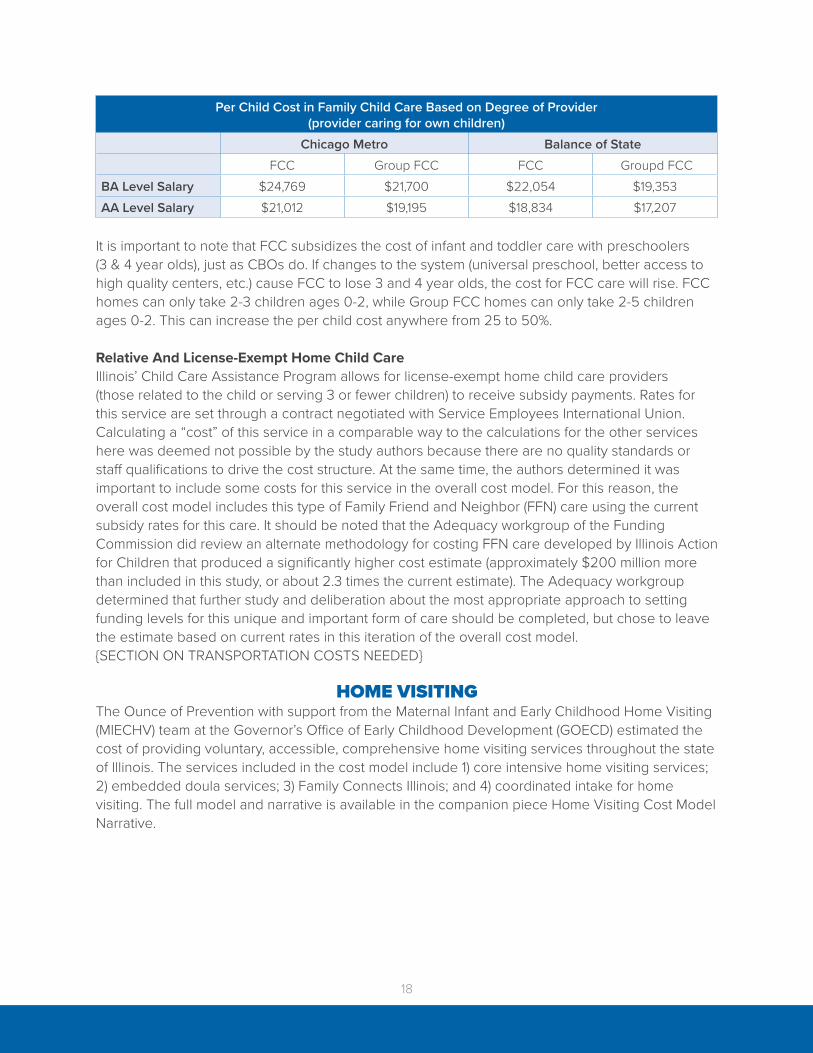
Both benefit amount and staffing patterns were based on recommended best practice. We used the CBO benefit structure (FICA, health insurance, retirement, etc.). In terms of staffing, regular FCC programs were calculated with an aide, while group FCC programs were calculated with 1.5 aides. It’s important to note that FCC providers often go into business when they are caring for their own children, so some FCC providers with young children have their own child in their care during the day. To account for this, based on feedback from the field, we assumed 20% of FCC providers are caring for their own children within their program and we reduced the number of children by 1 when calculating the per child cost of the program. Another way to account for this structure would be to include their own children as a benefit expense. We also used an enrollment percentage, just as we did for CBOs, to account for the fact that programs are rarely 100% enrolled. Since FCC programs care for a significantly smaller group, one open slot represents a larger percentage of total enrollment, therefore we assumed 80% enrollment for FCC programs.
The following tables illustrate the per child cost for FCC and Group FCC programs, with a differentiation between providers with an Associate degree and a Bachelor’s degree.
Per Child Cost in Family Child Care Based on Degree of Provider (provider’s own children NOT in care)Chicago Metro Balance of State
FCC Group FCC FCC Group FCCBA Level Salary $$21,567 $19,766 $19,240 $17,654AA Level Salary $18,347 $17,512 $16,480 $15,722
18
It is important to note that FCC subsidizes the cost of infant and toddler care with preschoolers (3 & 4 year olds), just as CBOs do. If changes to the system (universal preschool, better access to high quality centers, etc.) cause FCC to lose 3 and 4 year olds, the cost for FCC care will rise. FCC homes can only take 2-3 children ages 0-2, while Group FCC homes can only take 2-5 children ages 0-2. This can increase the per child cost anywhere from 25 to 50%.
Relative And License-Exempt Home Child CareIllinois’ Child Care Assistance Program allows for license-exempt home child care providers (those related to the child or serving 3 or fewer children) to receive subsidy payments. Rates for this service are set through a contract negotiated with Service Employees International Union. Calculating a “cost” of this service in a comparable way to the calculations for the other services here was deemed not possible by the study authors because there are no quality standards or staff qualifications to drive the cost structure. At the same time, the authors determined it was important to include some costs for this service in the overall cost model. For this reason, the overall cost model includes this type of Family Friend and Neighbor (FFN) care using the current subsidy rates for this care. It should be noted that the Adequacy workgroup of the Funding Commission did review an alternate methodology for costing FFN care developed by Illinois Action for Children that produced a significantly higher cost estimate (approximately $200 million more than included in this study, or about 2.3 times the current estimate). The Adequacy workgroup determined that further study and deliberation about the most appropriate approach to setting funding levels for this unique and important form of care should be completed, but chose to leave the estimate based on current rates in this iteration of the overall cost model.{SECTION ON TRANSPORTATION COSTS NEEDED}
HOME VISITINGThe Ounce of Prevention with support from the Maternal Infant and Early Childhood Home Visiting (MIECHV) team at the Governor’s Office of Early Childhood Development (GOECD) estimated the cost of providing voluntary, accessible, comprehensive home visiting services throughout the state of Illinois. The services included in the cost model include 1) core intensive home visiting services; 2) embedded doula services; 3) Family Connects Illinois; and 4) coordinated intake for home visiting. The full model and narrative is available in the companion piece Home Visiting Cost Model Narrative.
Per Child Cost in Family Child Care Based on Degree of Provider (provider caring for own children)
Chicago Metro Balance of StateFCC Group FCC FCC Groupd FCC
BA Level Salary $24,769 $21,700 $22,054 $19,353AA Level Salary $21,012 $19,195 $18,834 $17,207

19
To determine the overall systems cost required using the specific models developed as described previously, making assumptions about the numbers of children who would use each of the different types of care, and also considering the program supports and infrastructure that would be necessary to support a comprehensive system. This section describes the data used and assumptions made to determine the total system cost. While many assumptions used are based on distribution across the current system as it is, it is important to note that when more options are available for families they may make different choices than they currently do. Estimates were developed, as described below, for how many children across a range of family incomes, would use the following types of care.
ACCOUNTING FOR FAMILY CHOICEThe most substantial challenge in creating a statewide cost model was determining the number of children that would be enrolled in each type of program, according to age and family income. Current usage does not necessarily reflect parental preference if families had true choices among a variety of high-quality options. To develop service-level assumptions, national and state research on use of early care and education program types by parent work status and family income level were used. The following data sources and research were used to inform estimates:
1. National Household Education Survey 2016 (NHES) • Provides recent household data on type of care used by child age and family income • Limitation is data cannot be analyzed as a cross of age by family income
2. Census report: Who’s Minding the Kids 2011 • Provides a snapshot of care arrangements by age, maternal work status, poverty status
3. CCAP certificate data March 2019 for Cook County • Provides number of children enrolled in each provider type by age
Overall System Cost
Model Type Infants and toddlers (0-3)
Preschool age children (3-4)
Full day, year-round center-based ECE (with comprehensive services) 3 3Full day, year-round center-based ECE (without comprehensive services) 3 3School-day, school-year ECE (ages 3 & 4 only) 3Part-day, school-year ECE (ages 3 & 4 only) 3Full-day, year-round family child care 3 3

20
• Limitation is the data does not include children served through contracts
4. IECAM • Provides data on where children birth through age 5 live and the capacity of ECE services
available to them. It also includes demographic data, including population, poverty level, linguistic isolation, and employment characteristics of families with children.
To develop a service-level methodology, we reviewed cost models that have been conducted recently in New York11 and in California12.
NYC Under Three: A Plan to Make Child Care Affordable for New York City FamiliesIn May 2019, New York City’s Comptroller Scott Stringer introduced an initiative, called “NYC Under 3,” to improve affordability, accessibility and quality of child care for children under age 3. As a first step to improve child care options for parents of young children living within the city, New York City’s Comptroller Scott Stringer commissioned a study on the availability and true cost of child care for infants and toddlers. The study NYC Under Three: A Plan to Make Child Care Affordable for New York City Families includes a detailed methodology on the uptake rate once the initiative is fully operational. Key components of the study:• Used data from U.S. Census Bureau,
Who’s Minding the Kids? Child Care Arrangements: Spring 2011 to estimate percentage of children in families below 400% FPL by age in “organized” care;
• Assumed 10 percentage point increase in working mothers and overall 15 percentage point increase in use of center and FCC care due to care being more affordable under the plan.
• Assumed higher uptake by lowest income families;
• Assumed similar distribution of settings to current subsidy use, which is heavily weighted to FCC in NYC. (Note: this is very different from subsidy use pattern in Cook County, where use of centers is much more common.)
Breaking The Silence on Early Child Care and Education Costs: A Values-Based Budget for Children, Parents, and Teachers In CaliforniaIn July 2019, the Center for the Study of Child Care Employment in collaboration with the Economic Policy Institute released a report on what it would cost to provide high-quality and comprehensive early care and education in California. The guiding principals were to generate a true cost that does not financially burden families, supports and helps build a well-qualified workforce, and provides adequate staffing levels for recommended ratios/group sizes as well as reasonable planning and preparation time. The cost estimate used an upper, middle and lower-range estimate of the number of families choosing to participate in the system. The lower-range estimate used the current share of children under age 5 in either home-based or center-based care in CA, based on NSECE 2012 data. The mid-range estimate is based on the labor force participation of parents with children under age 5, using data from the American Community Survey. The highest-range estimate for children ages 2 and under, they used the participation rate in Denmark, a country with a comprehensive ECEC system already in place. For children age 3-4, they used the inverse of the overall homeschooling rate in the United States, which also happens to coincide with Denmark’s participation rate for this age group. Staff pay in the model mirrored that of staff in the primary and secondary school system in California.

21
ASSUMPTIONS REGARDING CHANGES IN USAGE TRENDSThe assumptions about family choice of child care arrangements outlined in this section are based on the availability of a fully funded comprehensive, high quality statewide early childhood system in Illinois. The reality is that parents make decisions about use of care based on a variety of inter-related factors and preferences for different features of child care. The NHES study13 provides the following data which offers context for current usage based on differences in age of children and family income: • Use of relative care (25%) and non-relative home care (13%) is fairly consistent across income
groups; • Center and school-based care use is much more common among the highest income families
(52% as compared with 30% for lower income families);• Center and school-based care is much more common for ages 3-5 than ages 0-2;• Many families combine home care (relative or non-relative) with school or center-based care,
especially for children ages 3-5 years old.
Based on a review of literature and data, a review of models developed by other states, and recent trends in actual usage the following assumptions for future usage, in a comprehensive system where parents have more choice, were developed: • More families at higher incomes will use full-day, year-round care because more of these
families have all parents working.• If care is affordable, families at lower incomes will start to use center-based care at levels
closer to higher income families.• All families will use center-based care more if it is affordable, both due to preferences and due
to higher maternal labor force participation.• Total use of non-relative care by low-income families for infants and toddlers will be about
40% (similar to estimate by NYC), but using Cook County and national data on type of care preference, this will break out as about 25% in centers and 15% in FCC.
ESTIMATES FOR FUTURE USAGE The following tables illustrate the percentages of care distribution used in the model:
Infants, Toddlers & Two Year OldsThe table below shows the percent (and number) of infants, toddlers and two year olds estimated to use each type of care arrangement by income level. These percentages are based on the full statewide count of infants14, toddlers and two year olds:• Total under 200% FPL: N = 187,101• Total 200-400% FPL: N = 131,392• Total over 400% FPL: N = 141,599• Total children 0-2: N = 460,092
Note: The percentages in each income level in the table do not equal 100%. There are a certain number of families that will not use non-parental care. Furthermore, there is overlap with center care/family child care and children in relative care. For example, a child may attend a center-based program during the week but may also need relative care on the weekend or at night if the parent has a non-traditional work schedule.

22
Preschoolers — Ages 3-5The table below shows the percent (and number) of preschool children estimated to use each type of care arrangement by income level. These percentages are based on the full statewide count of 3 -5 year olds15:• Total under 200% FPL: N = 192,587• Total 200-400% FPL: N = 135,246• Total over 400% FPL: N = 145,757• Total children 3-5: N = 473,590
Among the preschool children in each income category, 70% were assumed to use school-day programs and 30% were assumed to use part-day programs. These percentages were applied to the remaining percent of children in each income bracket (which differed based on CBO usage assumptions). The resulting percentages can be seen in the table below.
Note: The percentages in each income level in the table equal more than 100%. There are families that use both center or school-based programs as well as home-based care (licensed family child care or license-exempt relative care) for before/afterschool care or for weekend care.
Estimated Infant, Toddler & Two Year Old Use of Care by Setting and Income Level
Under 200% FPL 200-400% FPL Over 400% FPLCenter 25%** (39,126) 30% (33,046) 30% (35,617)Non-relative home (FCC) 15% (23,530) 15% (16,523) 15% (17,808)Relative (paid or unpaid)* 28% (43,922) 28% (30,843) 28% (33,42)*Can overlap with Center and Non-relative home**For children in families under 200% FPL, Comprehensive CBO cost was used.
Estimated Preschooler Use Of Care By Setting And Income Level
Under 200% FPL 200-400% FPL Over 400% FPL
Center — full day/year round 30%** (48,740) 35% (39,934) 35% (43,037)
School-based — PFAE/HS full day with full parent engagement 42% (68,237) 35% (39,934) 28% (34,430)
School-based — PFA part-day 18% (29,244) 15% (17,114) 12% (14,756)
Non-relative home* 12% (19,496) 12% (13,692) 12% (14,756)
Relative (paid or unpaid)* 23% (32,368) 23% (26,242) 23% (28,281)
* Can overlap with Center- and School-based** For children in families under 200% FPL, Comprehensive CBO cost was used.

23
Data from Illinois Early Childhood Asset Map (IECAM) provided the number of children in Illinois by age, county and federal poverty level. The percentages in the tables above were applied to the statewide demographic data. These data tables are available in Appendix 4.
SYSTEM INFRASTRUCTURE AND SUPPORTSTo estimate system-level costs associated with statewide early care and education infrastructure and supports, we drew from the National Academies of Sciences Transforming the Financing of Early Care and Education report. The report includes workforce development costs as well as quality assurance and improvement costs in the system-level estimate. In developing the report, the committee assumed (based on prior research practice) that these costs can be calculated using a fixed percentage of the direct costs of ECCE services. The committee applied an 8 percent system-level cost based on the total cost of services. We applied the same 8% system-level cost to our model. System Infrastructure and Supports must be further evaluated for future iterations of this cost model.
Workforce professional development is a critical component of system-level costs as Illinois strives to move toward a system that provides adequate compensation and supports growth of a qualified workforce. This level of support may not be necessary on an ongoing basis once Illinois reaches its compensation and workforce goal. However, as the National Academies report states:
“Cost components of system-level workforce development supports that may remain in a transformed ECE system include information systems, curriculum development, system evaluation, career counseling, leadership development, textbooks and scholarships for educators’ continuing professional development, and support for home-based ECE provider networks, among others.”As Illinois’ ECCE system grows to serve more families with higher quality care, an effective system of quality assurance and improvements is also critical. These system-level costs include monitoring and regulation systems, quality improvement and accountability systems, and data and information management systems. These are ongoing, annual costs of a high quality ECCE state system.
PARENT CO-PAYMENTSThe cost of ECEC continues to rise each year faster than inflation, while family income has not kept pace.16 The average cost of preschool care accounts for nearly 15% of the Cook County median family income, with infant and toddler care costing even more. Infant care in a CBO can cost as much as college tuition.17 The federal recommendation is that ECEC cost no more than 7% of family income.
We estimated the amount of family contribution to the system using the federal 7% benchmark for the highest income families (i.e. families with income > 400% FPL. Families between 200%-400% FPL were assessed a progressive co-payment that increases 1% per 25% FPL (ex. families under 250% FPL contribute 1% of their income, families under 275% FPL contribute 2% of their income. Families under 200% FPL were not assessed a co-payment. The following payment scale was applied:
Annual Parent Contribution by Income Level200% 225% 250% 275% 300% 325% 350% 375% 400% Above
400%$0 $230 $511 $1,123 $1,838 $2,655 $3,574 $4,595 $5,718 $8,576

24
According to INCCRRA data, in the CCAP system the average number of children ages 0-5 per family is 1.08.18 As a result, we used 1 child per family in our estimate. The total amount of estimated parent contribution to the system is estimated at $2B.
TOTAL SYSTEM COSTTo determine an overall system cost, the per child cost by service delivery model and geographic region was combined with the estimates outlined above of how many children in each age group would participate in each model type. Ultimately this model represents providing services to approximately 70% of children ages birth five (approximately 655,000 children).
Total Statewide Cost
Center-based $5,606,963,371Infants $694,625,585
Toddlers $1,231,528,009Two year olds $1,183,171,523
Preschool $2,497,638,255Center-based Transportation $130,388,920School-based Settings (3-and 4-year olds only) $2,827,143,993School-based Transportation $110,864,605Additional Costs for Dual Language Learners (in CBOs) $48,270,065Additional Costs for Dual Language Learners (in School PreK) $54,471,908Additional Costs for Special Needs/Inclusion (in CBOs) $503,139,578Additional Costs for Special Needs/Inclusion (in School PreK) $621,597,262Licensed Family Child Care $1,977,694,933Relative Care $292,074,395Early Intervention $528,728,000Direct Services Total $12,701,337,030Infrastructure (8% of direct service costs) $1,016,106,962Home Visiting* $619,731809Total Cost $14,337,175,801*Home Visiting model already incorporates infrastructure costs.
25
An ever-growing body of research has found that investment in high quality early childhood programs can yield a $4-$12 return for each $1 spent19, as it sets the groundwork for a child’s healthy development and learning for years to come. Illinois’ current ECEC investment is losing valuable returns and is not in line with its vision for supporting young children. We commend GOECD for requesting a cost model for a comprehensive system of ECEC as an important step toward realizing its vision.
The purpose of this model is to estimate how much it costs to fully fund a high quality, comprehensive ECEC system in Illinois; one that provides affordable and accessible ECEC to all families with a well-compensated and highly-qualified workforce. The estimates in this model are based on national best practices and competitive compensation.
Personnel is the major driving cost in ECEC, due to the small class sizes and ratios recommended for young children. As a result, in our model that uses parity in compensation across early childhood service delivery models along with recommended group sizes, the per child cost of $15,000 - $33,000 and the overall system cost of $14B ($12B with parent contribution) may seem overwhelming. However, it is also important to note that this model provides an estimate of the total cost of a fully funded, high quality ECEC system. It does not account for current federal, state and local resources and funding. This is an important next step in developing a plan for increased investments and implementation of a system that ends inequities in quality, access and compensation.
We applaud Illinois for its commitment to young children. We provide this cost model as tool and resource to help the state reach its goals of a comprehensive, high quality ECEC system that is available to all families and that ends disparities in the workforce.
Conclusion

26
Appendix 1 — Supporting Data Tables
Non-Personnel Costs In CBO Model
Expenses High Quality Center
Comprehensive Center Per Notes
Food (includes food & kitchen supplies)
5,000 2,000 per classroom
Comprehensive Center has Cook & Assistant Cook on staff; High Quality Center includes contracted service.
Office supplies & equipment 20 20 per child
Education supplies & equipment 150 225 per child
Comprehensive includes additional funds to ensure equipment and supplies for inclusive classrooms.
Child Assessment 15 15 per childMarketing, printing & postage 49 49 per child
Rent/Lease* 13.65 13.65 per square foot
*Regionalized cost (1.05 Chicago metro, 0.9 rest of state); see lines below for regional amounts.
Utilities (gas, electric, internet, phone)
2.19 2.19 per square foot
Maintenance/Repair/Cleaning
2000 500 per classroom
High Quality Center does not include Maintenance staff; this is a contracted service.
Fees/Permits/Licenses/Taxes 500 500 per site
Accounting/legal/audits 3000 3000 per site
Staff training & education 500 500 per staff
Consultation —nurse, mental health, nutrition, health, etc.
5500 5500 per class-room
Includes consultation services at 5-6 hours/month per classroom
IT support 1000 1000 per class-room
Insurance 150 150 per childTelephone & Internet 1440 1440 per site
Indirect Cost 1182 1182 per child Based on EBF

27
Non-Personnel Costs In School-Based Model
Expense Cost PerFood (include food and kitchen supplies) $4,000 per classroomEducation supplies & equipment $233 per childChild Assessment Tool $25 per childStaff training & education $125 per childConsultation (mental health, nutrition, health, etc. $5,500 per classroomIT support $285.5 per childCentral Office (includes employee benefits) $1,204 per childMaintenance & Operations (includes employee benefits) $1,404 per child
Non-Personnel Costs In Family Child Care Model
Expense Cost PerRent* $12,000 annual*Utilities $4,300 annualMaintenance/Cleaning $2,111 annualInternet $1,446 annualFood $900 per child annuallyMaterials & Admin $400 per child annuallyProfessional Development $400 per staff annuallyInsurance $1,575 annuallyUnion Dues $900 annually*expense regionalized (1.05 Chicago Metro area and 0.9 for remainder of state)
Regionalized Cost Base Cost 0.9 Rest of State 1.05 Chicago Metro*Rent/Lease 13.65 12.29 14.33

28
Estimates of Number of Children Using Services by Model, Geography, and Income Infants (under age 1)
Chicago Metro
Balance of State
Under 200% FPL
200-400% FPL
Over 400% FPL
Under 200% FPL
200-400% FPL
Over 400% FPL
Center 4,129 3,132 4,030 3,430 3,239 2,834Non-relative home (FCC) 2,477 1,566 2,015 2,058 1,620 1,417Relative (paid or unpaid)* 4,625 2,923 3,761 3,841 3,023 2,645
Estimates of Number of Children Using Services by Model, Geography, and Income Toddlers (1 year old)
Chicago Metro
Balance of State
Under 200% FPL
200-400% FPL
Over 400% FPL
Under 200% FPL
200-400% FPL
Over 400% FPL
Center 8,840 6,730 8,538 6,755 6,407 5,625Non-relative home (FCC) 5,304 3,365 4,269 4,053 3,203 2,813Relative (paid or unpaid)* 9,901 6,282 7,969 7,566 5,980 5,250
Number of Children by Family Income and Geography
Number of Children Under 1
Year
Number of
Children 1 Year
Number of Children 2
Years
Number of Children 3
Years
Number of Children 4
Years
Number of Children 5
YearsTOTAL
Under 200% Federal Poverty LevelChicago Metro 33,033 35,359 37,066 38,020 37,523 32,607 213,608Balance Of State 27,439 27,021 27,183 27,888 28,918 27,631 166,080
201-400% Federal Poverty LevelChicago Metro 20,880 22,434 23,565 24,182 23,814 20,644 135,519Balance Of State 21,596 21,356 21,561 22,100 22,851 21,655 131,119
>400% Federal Poverty LevelChicago Metro 26,864 28,459 29,731 30,499 30,238 26,617 172,408BALANCE OF STATE 18,890 18,750 18,905 19,382 20,050 18,971 114,948
TOTAL 148,702 153,379 158,011 162,071 163,394 148,125 933,682

29
Estimates of Number of Children Using Services by Model, Geography, and Income Preschoolers (Ages 3-5)
Chicago Metro
Balance of State
Under 200% FPL
200-400% FPL
Over 400% FPL
Under 200% FPL
200-400% FPL
Over 400% FPL
Center (full day/year round) 27,554 20,411 25,916 21,186 19,522 17,121
School-based (PFAE full day, full parent engagement)
55,108 0 0 42,373 0 0
School-based (PFA part-day) 0 29,159 29,618 0 27,889 19,567
Non-relative home (FCC) 11,022 6,998 8,885 8,475 6,693 5,870Relative (paid or unpaid)* 21,125 13,413 17,030 16,243 12,829 11,251
Estimates of Number of Children Using Services by Model, Geography, and Income Two Year Olds (24-35 months)
Chicago Metro
Balance of State
Under 200% FPL
200-400% FPL
Over 400% FPL
Under 200% FPL
200-400% FPL
Over 400% FPL
Center 9,267 7,070 8,919 6,796 6,468 5,672Non-relative home (FCC) 5,560 3,535 4,460 4,077 3,234 2,836Relative (paid or unpaid)* 10,378 6,598 8,325 7,611 6,037 5,293

30
• 379,565 children under age 6 live in low-income families (under 200% FPL)20 • 68% of children under age 6 at all family income levels are in families where all parents are
working21 • 42% of children under age 6 in low-income families (under 185% FPL) are in families where all
parents are working22 • Estimated 28% of infants and toddlers in low-income families need non-relative care
(calculation: IECAM estimate that 42% are in families working * NHES estimate that about 67% of working families use some non-relative care)
• Estimated 28% of preschoolers in low-income families need non-relative care (calculation: IECAM estimate that 42% are in families working * NHES estimate that about 67% of working families use some non-relative care)
• NHES survey shows use of relative care (25%) and non-relative home care (13%) is fairly consistent across income groups. Model includes a slight increase due to assumed increase in labor force participation.
• Data from child care certificates indicates that relatively few children start subsidized care under three months old.
• According to CCAP data, the average amount of care in a baby’s first year is closer to 6 months, so we counted these children at half of this participation rate.
• Currently, approximately 14-17% of low-income infants and toddlers (ages 1 through 2) are receiving CCAP certificates for center-based care (some additional are likely receiving contract care) in a typical month. The model assumes about 10% jump in use of center-based care (due to increased affordability, increased labor force participation)
• Goal is 90% participation center/school program (PFAE/HS) for children ages 3-5 from low-income families
• Estimated roughly a third of that would need to be full-day/year-round
• National “exemplar” program participation rates across 3-5 for public preschool is around 85% • Assumed at highest incomes slightly more families opting for privately funded programs
instead of the public preschool • Assumed more of the higher income families would need full-day/year-round
Appendix II — Additional Data Used to Inform the Cost Model

31
This publication was made possible by Grant Number 90TP0001-01-00 from the Office of Child Care, Administration for Children and Families, U.S. Department of Health and Human Services.
Its contents are solely the responsibility of the authors and do not necessarily represent the official views of the Office of Child Care, the Administration for Children and Families, or the U.S. Department of Health and Human Services.
1The Inter-Agency Team (IAT) was created through Illinois’ Race To The Top — Early Learning Challenge Grant to coordinate early childhood system among different state agencies. The IAT consists of early childhood leadership from the following Illinois agencies: State Board of Education, Department of Human Services, Department of Children and Family Services, Department of Public Health, and Board of Higher Education. The IAT ensures cross-agency coordination in an effort to move toward a more unified early childhood system.
2The budgets of school-based programs typically do not include costs shared across the entire K-12 school (i.e. principal’s salary, rent/utilities, maintenance, etc.) as part of the preschool specific budget. To ensure the true cost of services is being estimated, the school-based model includes the costs of these shared services.
3Center for American Progress, “Where Does Your Child Care Dollar Go? Understanding the True Cost of Quality Early Childhood Education” (2018), available at https://www.americanprogress.org/issues/early-childhood/reports/2018/02/14/446330/child-care-dollar-go/
4Illinois Salary and Staffing Survey of Licensed Child Care Facilities Fiscal Year 2017 http://www.dhs.state.il.us/OneNetLibrary/27894/documents/CCAP/2017SalaryandStaffingSurveyofLicensedChildCareFacilitiesv2.pdf
5Center for American Progress, “Where Does Your Child Care Dollar Go? Understanding the True Cost of Quality Early Childhood Education” (2018), available at https://www.americanprogress.org/issues/early-childhood/reports/2018/02/14/446330/child-care-dollar-go/
6Illinois Salary and Staffing Survey of Licensed Child Care Facilities Fiscal Year 2017 http://www.dhs.state.il.us/OneNetLibrary/27894/documents/CCAP/2017SalaryandStaffingSurveyofLicensedChildCareFacilitiesv2.pdf
7Special thanks to Early Choices (Ann Kremer & Emily Ropars), Educare West DuPage (Marcela Sweeney), and Patricia Chamberlain for their time, incredible expertise, and excellent partnership in developing a cost model for early childhood special education.
8source: IEACAM, 2019 EI Number of children served (https://search.iecam.illinois.edu/cgi-bin/iecam/search.asp)
9source: http://www.wiu.edu/coehs/provider_connections/pdf/ILSPPAPRPARTCFFY201819FINALwcharts.pdf
10https://www.americanprogress.org/issues/early-childhood/reports/2018/11/15/460970/
32
understanding-true-cost-child-care-infants-toddlers/
11https://comptroller.nyc.gov/reports/nyc-under-three-a-plan-to-make-child-care-affordable-for-new-york-city-families/
12https://cscce.berkeley.edu/breaking-the-silence-on-costs/
13https://nces.ed.gov/pubs2017/2017101REV.pdf
14According to CCAP data, the average amount of care in an infant’s first year is approximately 6 months. To account for this, we used 0.5 of the population of children < 1 year old in estimates.
15To account for children who turn 5 years old prior to the start of kindergarten, we used 0.5 of 5-year-old population in estimates.
16Illinois Action for Children, The Cost of Child Care in Cook County in 2018 (http://www.actforchildren.org/wp-content/uploads/2018/04/CookCountyReport_2018_April_Final.pdf)
17Ibid.
18INCCRRA: August 2019, 72,759 families served with 78,472 children ages 0-5.
19The Center for High Impact Philanthropy, Invest in a Strong Start for Children: High Return on Investment (2015). (https://www.impact.upenn.edu/our-analysis/opportunities-to-achieve-impact/early-childhood-toolkit/why-invest/what-is-the-return-on-investment/)
20IECAM 2016 data
21Kids Count 2017
22Estimated from IECAM 2016 data