ii - cogen · 2020-04-21 · bagasse cogeneration describes the use of fibrous sugarcane waste –...
TRANSCRIPT

II

I
Contents
Index of Abbreviations V About WADE VII Acknowledgements IX Executive Summary XI 1. Introduction 1 2. Overview of the Global Sugar Cane Processing Industry 3Price and Production Trends 4Industry Challenges 5The Sugar Production Process 6Energy Requirements 10 3. Benefits of Bagasse Cogeneration 13Bagasse Cogeneration – A Technical Overview 13Rationale for Cogeneration from Bagasse 15
Economic Benefits Social Benefits Environmental Benefits
4. India 19Electricity Production 19Cane Production 19Market Trends 20Bagasse Cogeneration: Current Status, Future Potential 21
Historical Background Potential for Bagasse Cogeneration in India

II
5. Brazil 27Electricity Production 27Cane Production 28Market Trends 29Bagasse Cogeneration: Current Status, Future Potential 30
Historical Background 6. Other Countries – A Summary 35Australia 35Belize 36Eastern and Southern Africa 36Jamaica 37Mauritius 37Nicaragua 38 7. Global Market Potential 39The Benefits Quantified - Analysis of The Indian Sugarcane Sector 41 8. Electricity Market Regulatory Issues 45Brazil 45
Short History Incentives for Bagasse Cogeneration Barriers and Constraints to Development
India 48Short History Incentives for Bagasse Cogeneration Barriers and Constraints to Development
Recommendations 50
9. Clean Development Mechanism Opportunities 51India 52Brazil 53
III
Tables and Figures
Table 1 Main Sugarcane-Producing Countries 3Table 2 Properties of Bagasse 9Table 3 Steam and Power Demands of a Typical Sugar Mill, Per Tonne of Cane
Crushed 11
Table 4 Comparison of Low- with High-Temperature and -Pressure Boilers 15Table 5 Incentives From Governmental, Fiscal & Financial Institutions, India 23Table 6 State-by-State Potential for Bagasse Cogeneration in India 24Table 7 Grid Losses in Brazil 27Table 8 Global Market Potential 39Table 9 Bagasse Recycling in India 42Table 10 Comparative Economics of Central vs Local Power 43Table 11 Emission Savings From Recycling Bagasse 43Table 12 Incentives for the Development of Bagasse Cogeneration in Brazil. 46Table 13 C02 Saving With Respect to Natural Gas CCGT 51
Figure 1 Sugarcane Production by Country 4Figure 2 Sugar Prices 1992-2002 5Figure 3 The WTO Debate 6Figure 4 The Sugar Production Process 7Figure 5 Sugarcane Processing Flowchart 8Figure 6 Other Uses of Bagasse 10Figure 7 The Bagasse Cogeneration Process 13Figure 8 Cane-Producing Areas in India 19Figure 9 Distribution of Sugar Mills in India 20Figure 10 Timeline of Events Relating to Development of the Bagasse Cogeneration
Industry in India 22
Figure 11 Theoretical Project Example - India 25Figure 12 Main Sugar-Producing Areas in Brazil 27Figure 13 Timeline of Events Relating to Development of the Bagasse Cogeneration
Industry in Brazil 31
Figure 14 Case Study: Cresciumal Sugar Mill, Brazil 32Figure 15 Case Study – Brazil 54

IV

V
Index of Abbreviations
BNDES Brazilian Infrastructure Development Bank CCGT Combined Cycle Gas Turbine CDM Clean Development Mechanism CO2 Carbon dioxide DE Decentralised Energy DG Distributed Generation ERC Electricity Regulatory Commission (India) FAO United Nations Food and Agriculture Organisation GHG Greenhouse Gas (es) Ha Hectare (1 hectare = 2.47 acres) HEP Hydro-Electric Power IPP Independent Power Producer (s) MNES Indian Ministry of Non-Conventional Energy Sources MWe / GWe Megawatt / Gigawatt of electricity capacity MWh / GWh / TWh Megawatt-hour / Gigawatt-hour / Terawatt-hour of production NOx Nitrogen oxides O&M Operation and Maintenance OECD Organisation for Economic Cooperation and Development PV Photovoltaic R$ Brazilian Real (currency) RE Renewable Energy SEB State Electricity Board (s) (India) SO2 Sulphur dioxide T&D Transmission and Distribution TCD Tonnes of Cane Crushed per Day TPH Tonnes per hour UNIDO United Nations Industrial Development Organization US$ US Dollar (currency) VR Vale do Rosario WADE World Alliance for Decentralized Energy WTO World Trade Organisation

VI

VII
About WADE
WADE is a non-profit research and advocacy organisation that was established in June 2002 to
accelerate the worldwide deployment of decentralised energy (DE) systems. WADE is now
backed by national cogeneration and DE organisations, DE companies and providers, as well as a
range of national governments. In total, WADE’s direct and indirect membership support
includes over 200 corporations around the world.
DE technologies consist of the following forms of power generation systems that produce
electricity at or close to the point of consumption:
• High efficiency cogeneration / CHP
• On-site renewable energy systems
• Energy recycling systems, including the use of waste gases, waste heat and pressure
drops to generate electricity on-site.
WADE classifies such systems as DE regardless of project size, fuel or technology, or whether
the system is on-grid or off-grid.
WADE believes that the wider use of DE holds the key to bringing about the cost-effective
modernisation and development of the world’s electricity systems. With inefficient central power
systems holding a 93% share of the world’s electricity generation, and with the DE share at only
7%, WADE’s overall mission is to bring about the doubling of this share to 14% by 2012. A
more cost-effective, sustainable and robust electricity system will emerge as the share of DE
increases.

VIII
To ensure that its goal can be achieved, WADE undertakes a growing range of research and other
actions on behalf of its supporters and members:
• WADE carries out promotional activities and research to document all aspects of DE,
including policy, regulatory, economic and environmental aspects in key countries
and regions.
• WADE works to extend the international network of national DE and cogeneration
organisations. Current WADE network members represent Europe, the USA, India,
China and Brazil.
• WADE provides a forum for DE companies and organisations to convene and
communicate.
• WADE jointly produces an industry journal – “Cogeneration and On-Site Power”
(published by James and James in association with WADE).
Further information about WADE is available at www.localpower.org or by contacting:
Michael Brown Director WADE 15 Great Stuart Street Edinburgh, EH3 7TP, UK +44 131 625 3333, fax 3334 [email protected]
Thomas R. Casten – Chairman of WADE Chairman & CEO Primary Energy LLC 2000 York Road, Suite 129 Oak Brook, Il 60523, USA +1 630 371 0505, fax 0673 [email protected]

IX
Acknowledgements
WADE would like to acknowledge contributions from the following people and organisations:
• Sunil Natu of Cogen India, for his substantial contributions to the sections on India;
• Tom Casten, for his analysis of the Indian sugarcane sector;
• Cogen SP, for their input on Brazil and market potential;
• Stephen Karekezi and Jennifer Wangeci of AFEPREN, for their input on sugarcane
and bagasse cogeneration in Africa.

X

XI
Executive Summary
Bagasse cogeneration describes the use of fibrous sugarcane waste – bagasse – to cogenerate heat
and electricity at high efficiency in sugar mills.
This report indicates that there is abundant opportunity for the wider use of bagasse-based
cogeneration in sugarcane-producing countries and to contribute substantially to high efficiency
energy production. Yet this potential remains largely unexploited. The potential for bagasse
cogeneration to make a meaningful contribution to the energy balance is especially great in Cuba,
Brazil, India, Thailand, Pakistan, Colombia and The Philippines. The potential, in absolute terms,
is also very high in China, despite being proportionally small due to the country’s massive scale
of electricity generation.
GLOBAL MARKET POTENTIAL
Sugarcane production (tonnes / yr)
Potential for electricity
production (GWh / yr)
Bagasse potential as percentage of
electricity demand
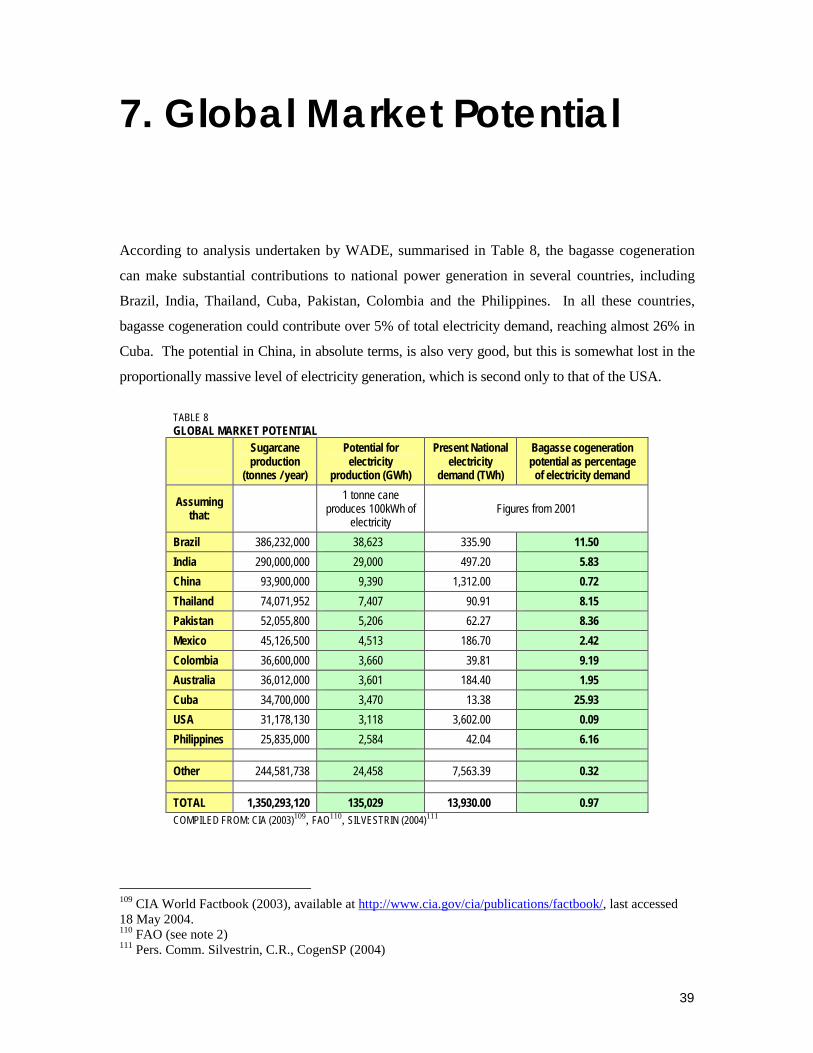
Brazil 386,232,000 38,623 11.50 India 290,000,000 29,000 5.83 China 93,900,000 9,390 0.72 Thailand 74,071,952 7,407 8.15 Pakistan 52,055,800 5,206 8.36 Mexico 45,126,500 4,513 2.42 Colombia 36,600,000 3,660 9.19 Australia 36,012,000 3,601 1.95 Cuba 34,700,000 3,470 25.93 USA 31,178,130 3,118 0.09 Philippines 25,835,000 2,584 6.16 Other 244,581,738 24,458 0.32 TOTAL 1,350,293,120 135,029 0.97

XII
Why bagasse cogeneration? The benefits include:
• Lower emissions of CO2 and other gases than from conventional fossil-fuel
generation
• Near-zero fuel costs (paid in local currency), commercial use of a waste product and
increased fuel efficiency leading to an increase in the economic viability of sugar
mills
• More secure, diverse, reliable and widespread supply of electricity for local
consumers
• Minimal transmission and distribution (T&D) costs, and reduced network losses, as
generation is located near important loads • Greater employment for local populations.
The economic development potential of bagasse cogeneration should not be under-estimated.
Most cane producing countries are poor or extremely poor, with high unemployment and low
rates of access to electricity supplies. If the measures recommended in this report can be
implemented, there is substantial scope for the technology to accelerate social and economic
development in some of the world’s poorest regions.
In addition, many cane-producing countries are heavy users of coal in the power generation
sectors, including India and China. Use of bagasse to generate electricity and heat can have a
significant impact on emissions. The application of the Clean Development Mechanism (CDM)
of the Kyoto Protocol, giving a monetary value to CO2 emission reduction, could therefore be an
important driver for bagasse cogeneration in cane producing countries. Many such countries are
also major importers of oil, giving scope for ethanol production from cane to alleviate a high
import burden and reduce emissions from oil consumption.
The amount of energy that can be extracted from bagasse is largely dependent on two main
criteria: moisture content and the technology used for energy production. The output of
electricity from bagasse cogeneration plants is fundamentally dependent on the prevailing
electricity market rules – inadequate buyback prices paid to mill owners by the utility company
create a substantial disincentive to size cogeneration plants to meet mill heat demand.
Conversely, higher rates can incentivise owners to upgrade their energy facilities to enable
maximum on-site efficiency. This is the key to enabling the potential for bagasse-based
cogeneration to be achieved.

XIII
This issue is now starting to be addressed in many countries, including Brazil and parts of India,
where the introduction of biomass feed-in tariffs are ensuring that the external benefits of bagasse
cogeneration are being recognised by markets. Analysis by WADE Chairman, Tom Casten,
indicates that, in India, realisation of the 5,000 MWe potential for bagasse cogeneration could
generate large savings in terms of both CO2 (38 million tonnes per year) and infrastructure
(US$10.8 billion). The most dramatic finding is that the cost burden to India, to the tune of
almost a billion dollars a year, will be significantly reduced by incentivising sugar mills, through
a buyback rate of 7 USc / kWh, to maximise the use of cogeneration.
A separate challenge being addressed is unavailability of fuel out of season. This is now being
increasingly resolved by enabling boilers to co-fire with other fuels such as wood or coal.
With many cane producers worldwide facing economic difficulty, bagasse cogeneration can bring
about a significant boost to the industry by providing an additional, stable revenue stream and so
increasing the competitive position of sugar mills. For those countries, notably Brazil, that
produce ethanol from sugarcane as a petroleum substitute, greater mill efficiency can reduce
ethanol costs and so accelerate the rate of substitution at a time when international oil prices are
high.
In order for bagasse cogeneration to achieve the potential outlined in this report, it is important
that certain key measures are brought forward. Building on experiences in India, Brazil and
elsewhere, WADE recommends that:
1. Planning and regulatory paths are cleared for the development of enhanced cogeneration
facilities in sugar mills. This includes ensuring fair and easy access to the grid for both
large and small generators as well as guaranteeing that incumbent generators and utilities
do not hinder these processes.
2. Financial and tax incentives, in line with other incentives for renewable energy, are
provided to boost the initial development of cogeneration facilities in sugar mills. This
would allow generators to invest in the necessary equipment and infrastructure to
maximise their electricity output whilst making the most effective use of heat and
electricity generated onsite. Financial incentives also include the provision, where

XIV
possible, of renewable energy feed-in tariffs that reflect the benefits of onsite production
and biomass combustion.
3. Where financial and tax incentives are currently unavailable, the CDM should be
promoted and developed. The CDM could provide the incentive required for the upgrade
or installation of cogeneration equipment in mills in a cost-effective manner whilst
facilitating the meeting of Kyoto Protocol commitments by Annex 1 parties.
4. Further research is carried out into bagasse gasification to fully explore its potential, so
that the best technologies can continue to be promoted and installed to reap the maximum
benefits of bagasse cogeneration.

1
1. Introduction
Cogeneration from sugarcane waste (bagasse) provides one of the best examples of renewable-
based cogeneration yet it remains largely unexploited. The advantages of bagasse as a fuel for
cogeneration are numerous, ranging from the environmental to the social and economic. Some
advantages, such as increased security and diversity of supply or the furthering of aims of
sustainable development even apply across these categories.
The sugar industry is a major worldwide industry that currently faces many problems, as sugar
prices are extremely volatile, with countries able to produce sugar most cheaply proving to be
tough competition for those less able to do so.
The sugar industry is also a large energy user. Most sugar mills already produce their own
electricity to meet on-site needs, by burning bagasse or other fuels. This, however, is often not in
cogeneration mode since, until very recently, there has been no incentive to produce electricity
efficiently due to the unavailability of tariffs for electricity produced by IPPs and sold to the grid.
Much of the potential for energy generation has thus, so far, been wasted as there was no
requirement for it. With the introduction of biomass feed-in tariffs in countries such as Brazil and
parts of India, there are now great opportunities for sugarcane-producing countries to learn from
the best practices around the world.
Until now, the potential for bagasse cogeneration has been largely un-quantified. This report was
compiled to highlight the advantages and main issues of bagasse cogeneration and the potential it
offers for electricity production.

2

3
2. Overview of Global Sugarcane Processing Industry
Sugarcane is currently grown under a wide range of conditions, in tropical and sub-tropical
regions between c. 35°N in Spain to 35°S in South Africa. As water requirements for the crop are
1.2-1.6 m/year, good distribution of rainfall is required if there is no irrigation. Sugarcane
harvesting generally occurs every 9-14 months, depending on crop variety.1
The three largest sugarcane growers in terms of production are Brazil, India and China, yielding
between them more than half of total sugar production. Table 1 and Figure 1 compare production
and yield figures for the top 11 sugar-growing countries.
TABLE 1 MAIN SUGARCANE-PRODUCING COUNTRIES
Area Harvested Yield Production (Ha)
Production ranking (tonnes/ha) (tonnes)
Australia 423,000 8 85.13 36,012,000 Brazil 5,303,560 1 73.83 386,232,000 China 1,328,000 3 70.71 93,900,000 Colombia 435,000 7 84.14 36,600,000 Cuba 1,041,200 9 33.33 34,700,000 India 4,300,000 2 67.44 290,000,000 Mexico 639,061 6 70.61 45,126,500 Pakistan 1,086,000 5 47.93 52,055,800 Philippines 385,000 11 67.10 25,835,000 Thailand 970,000 4 76.36 74,071,952 USA 403,390 10 77.29 31,178,130 Other 4,091,132 244,581,738
TOTAL 20,405,343 1,350,293,120 Average 68.53 SOURCE: FAO DATABASE2
1 Food Market Exchange, at www.foodmarketexchange.com, acc 22 March 2004 2 FAO, http://faostat.fao.org/faostat/form?collection=Production.Crops.Primary&Domain=Production&servlet=1&hasbulk=&version=ext&language=EN, accessed 22-3-2004. Figures are for 2003.

4
FIGURE 1 SUGARCANE PRODUCTION BY COUNTRY
0
1,000
2,000
3,000
4,000
5,000
6,000
Aus
tralia
Bra
zil
Chi
na
Col
ombi
a
Cub
a
Indi
a
Mex
ico
Pak
ista
n
Phi
lppi
nes
Thai
land
US
A
Oth
er
Har
vest
ed A
rea
(Tho
usan
ds o
f Hec
tare
s)
0
50
100
150
200
250
300
350
400
450
Pro
duct
ion
(Milli
on T
onne
s)
Area Harvested
Production
SOURCE: FAO3
Price and Production Trends Historically, sugar prices have been extremely volatile, affected by recurring supply and demand
imbalances. In the last forty years or so, prices have overall been relatively low as world
production exceeded demand. There have been short price booms such as in the early 1980s,
when sugar prices more than quadrupled to 103.4 USc/kg from a long-term average price of 22
USc/kg.4 Such booms were, however, typically followed by long periods of low prices, with
these occasionally dipping below production costs in the main low-cost exporting countries.
Figure 2 shows trends in sugar production, consumption and prices between 1992 and 2002.
3 FAO (see note 2) 4 Food Market Exchange (see note 1)

5
FIGURE 2 SUGAR PRICES 1992-2002
SOURCE: FOOD MARKET EXCHANGE5
The development and increased uptake of artificial sweeteners has been expected to help to
reduce price volatility; also, in recent years, growing consumption of sugar by developing
countries may have reduced the variability of prices, as markets in these countries are more price-
sensitive than their richer counterparts.
Industry Challenges Challenges for the sugarcane industry in developing countries include the requirement for the
removal of protectionist barriers in the European Union (EU) and USA6 for sugar and alcohol; in
2003, for this reason, an action was started at the WTO against the EU by a group of countries led
by Brazil (see Figure 3).
5 Food Market Exchange, at www.foodmarketexchange.com/datacenter/product/sugar/detail/dc_pi_sugar_05_04.htm, acc 22 March 2004 6 UNICA, at http://www.unica.com.br/i_pages/agroindustria_politicas.asp, acc 30 March 2004

6
Price volatility in sugar markets is a substantial
difficulty for many cane-producing countries.
This could, however, be reduced by a number
of methods that would increase revenues for
non-consumable products derived from cane:
1. Promotion of alcohol-fuelled vehicles:
Brazil already encourages alcohol as a
vehicle fuel, whilst new programmes
for alcohol use in France, Mexico,
Canada, Sweden, Australia, India,
Colombia and China indicate
favourable markets for ethanol fuels;
the USA could also be a large market in the future.8 In some countries, vehicle fuels are
blended at the pump with bio-fuels such as sugar alcohol.
2. Expansion of bagasse-based cogeneration:9 As this report makes clear, this could be
implemented through increasing the value of electricity exported by sugar mills, or
through the Kyoto Protocol’s Clean Development Mechanism (CDM), amongst others.
For bagasse cogeneration to take off, the value of electricity it generates needs to be
increased to ensure that it is worthwhile producing for sale to the grid.
The Sugar Production Process
The process of sugar production from cane is outlined in Figures 4 and 5, on pages 7 and 8
respectively.
The process is very energy-intensive, requiring inputs of both heat and power at many stages.
This is why it is so well suited to the application of cogeneration.
7 USDA, at http://www.fas.usda.gov/gainfiles/200310/145986300.pdf, acc 30 March 2004 8 UNICA (see note 6) 9 UNICA (see note 6)
FIGURE 3THE WTO DEBATE
Since 2002, a group of countries led by Brazil has claimed that EU subsidies for sugar exports distort competition conditions in the international market, damaging efficient sugar producers such as Brazil and other developing countries. The main reproaches are:
• Improper export subsidies. The EU claims that subsidised sugar exports are legitimate, as they apply to former colonies in Africa, Caribbean and the Pacific (ACP) under preferential treatment. Brazil, Australia and Thailand claim that the EU has the right to import sugar under preferential treatment, but not to export it. Brazil does not question the preferential tariff given to ACP countries. • Sugar exports. Brazil claims that the EU is double-subsidising some of its sugar exports, which is prohibited under WTO rules.
SOURCE: USDA7

7
FIGURE 4 THE SUGAR PRODUCTION PROCESS
Processing raw sugar from sugarcane
Harvesting -
Cleansing and grinding -
Juicing Extraction of juice from the pulp. The remaining pulp, or "bagasse," is dried and used as fuel.
Clarifying Addition of CO2 and lime juice to the liquid sugar, followed by heating. As the CO2 travels through the liquid, it forms calcium carbonate, which precipitates non-sugar debris (fats, gums and wax) from the juice. This precipitate, called "mud", is then separated from the juice by centrifugation. The juice is then filtered to remove any remaining impurities.
Evaporation The filtered juice is evaporated in a vacuum, concentrated at a low temperature and the sugar crystallised in vacuum pans.
Crystallisation Pulverised sugar is fed into a sterilised vacuum pan, as the liquid evaporates, a thick mass of crystals forms. The crystals are spun-dry in a centrifuge, producing raw, inedible sugar.
Refined sugar production
Affination If the refinery is part of the raw sugar production facility, the cane sugar may be washed more heavily in previous steps and the affination step omitted. Affination removes the molasses film from raw sugar with warm, almost saturated, syrup. Crystals are separated from the syrup by centrifugal washing with hot water or a high purity solution of sugar.
Clarification The main purpose of this process is to eliminate inorganic impurities present in raw sugar.
Evaporation After clarification, the syrup must again be concentrated by multiple-effect evaporators and crystallised by vacuum pans. This is the same sequence used in the raw sugar process. The process of evaporation consists of boiling and crystallisation steps.
Drying and cooling
The damp sugar from the centrifuges is then treated in a special piece of equipment usually consisting of 2 horizontal drums. In the first drum, the sugar is dried by hot air and in the second, known as the cooler, sugar crystals are dried at ambient temperature.
Screening The sugar from the dryer-cooler passes over vibrating screens, which separate out lumps that form when the sugar is sent to a hopper for bagging.
Packaging - SOURCE: FOOD MARKET EXCHANGE10
10 Food Market Exchange (see note 1)

8
v11
11 http://www.spriinc.org/buton11a.html
COMPILED FROM SPRIINC13 AND FOOD MARKET EXCHANGE (SEE NOTE 1)
Raw juice
Planting
Maturing
Harvest
CleansingCrushing
Juicing
Energy
Combustion
Paper Fuel, cattle feed
Bagasse
Wallboard
FIG URE 5 SUGARCANE PROCESSING FLOWCHART
Clarification
ExportRefined Sugar
Molasses
Screening
Cleansing Crushing
Evaporation
Clarification
Affination
Export Raw Sugar
Centrifuge
Crystallisation
Evaporation
Clarified juice
“Mud” Fertiliser
9
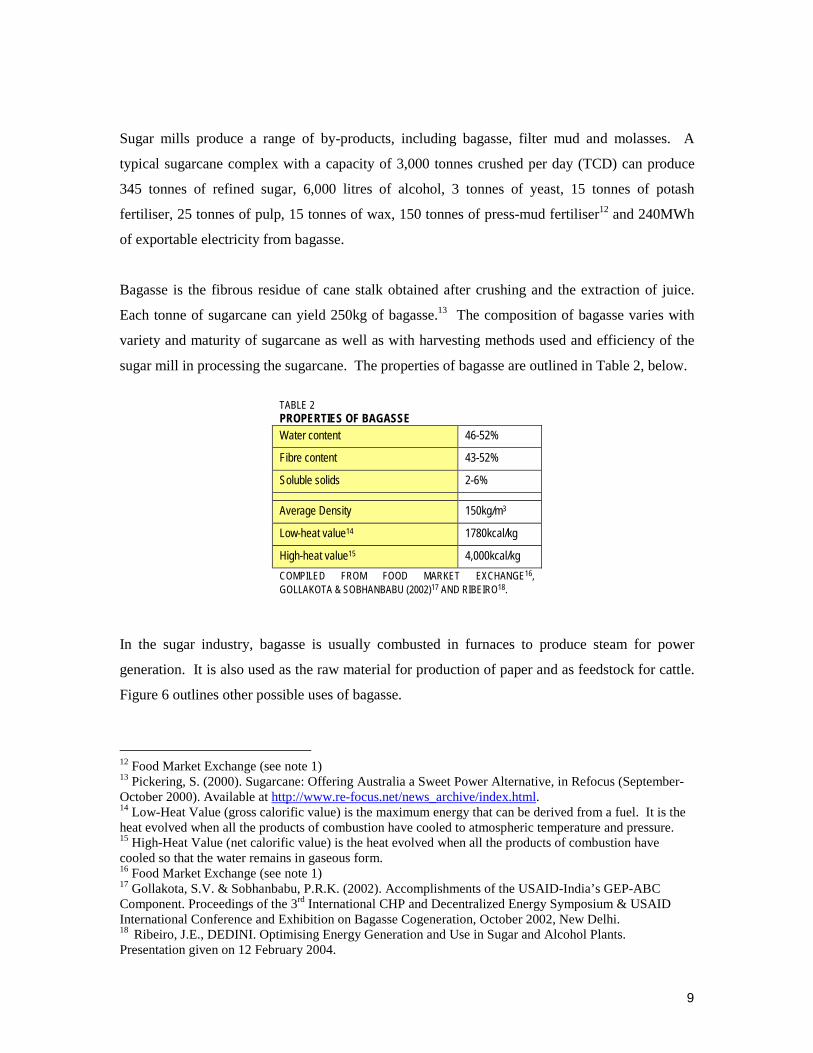
Sugar mills produce a range of by-products, including bagasse, filter mud and molasses. A
typical sugarcane complex with a capacity of 3,000 tonnes crushed per day (TCD) can produce
345 tonnes of refined sugar, 6,000 litres of alcohol, 3 tonnes of yeast, 15 tonnes of potash
fertiliser, 25 tonnes of pulp, 15 tonnes of wax, 150 tonnes of press-mud fertiliser12 and 240MWh
of exportable electricity from bagasse.
Bagasse is the fibrous residue of cane stalk obtained after crushing and the extraction of juice.
Each tonne of sugarcane can yield 250kg of bagasse.13 The composition of bagasse varies with
variety and maturity of sugarcane as well as with harvesting methods used and efficiency of the
sugar mill in processing the sugarcane. The properties of bagasse are outlined in Table 2, below.
TABLE 2 PROPERTIES OF BAGASSE Water content 46-52%
Fibre content 43-52%
Soluble solids 2-6%
Average Density 150kg/m3
Low-heat value14 1780kcal/kg
High-heat value15 4,000kcal/kg COMPILED FROM FOOD MARKET EXCHANGE16, GOLLAKOTA & SOBHANBABU (2002)17 AND RIBEIRO18.
In the sugar industry, bagasse is usually combusted in furnaces to produce steam for power
generation. It is also used as the raw material for production of paper and as feedstock for cattle. Figure 6 outlines other possible uses of bagasse.
12 Food Market Exchange (see note 1) 13 Pickering, S. (2000). Sugarcane: Offering Australia a Sweet Power Alternative, in Refocus (September-October 2000). Available at http://www.re-focus.net/news_archive/index.html. 14 Low-Heat Value (gross calorific value) is the maximum energy that can be derived from a fuel. It is the heat evolved when all the products of combustion have cooled to atmospheric temperature and pressure. 15 High-Heat Value (net calorific value) is the heat evolved when all the products of combustion have cooled so that the water remains in gaseous form. 16 Food Market Exchange (see note 1) 17 Gollakota, S.V. & Sobhanbabu, P.R.K. (2002). Accomplishments of the USAID-India’s GEP-ABC Component. Proceedings of the 3rd International CHP and Decentralized Energy Symposium & USAID International Conference and Exhibition on Bagasse Cogeneration, October 2002, New Delhi. 18 Ribeiro, J.E., DEDINI. Optimising Energy Generation and Use in Sugar and Alcohol Plants. Presentation given on 12 February 2004.

10
The value of bagasse as a fuel depends largely on its
calorific value, which in turn is affected by its
composition, especially with respect to water content
and to the calorific value of the sugarcane crop, which
depends mainly on its sucrose content21. Every tonne
of sugar has an energy potential equivalent to that of
1.2 barrels of petroleum.22
Energy Requirements
The sugar and alcohol production process is energy-
intensive, requiring both steam and electricity.23
Historically, sugar mills have been designed to meet
their energy requirements by burning bagasse: this was
seen as an economic means of producing electricity
whilst cheaply disposing of bagasse.24 However, as there was little potential for the sale of
electricity to the grid, efficiency in the process was a hindrance rather than a bonus.
In addition, over the years the energy requirements of sugar mills have increased, both in and out
of season. This has mainly been due to the development of downstream units such as distilleries
as well as ethanol, chemical, paper, effluent treatment and biogas generation plants. The
establishment of settlements around mills, with their related social, educational and commercial
activities, has also contributed to increased electricity demand. In countries such as India, this
has compelled sugar mills to buy electricity from utilities and use non cane-based fuels to meet
energy requirements, particularly out of season. In the case of the least energy-efficient mills,
such requirements can be quite high.
About one third of the bagasse produced in a mill can provide enough steam and electricity for
the mill’s requirements.25 Table 3 summarises the typical energy requirements cane mills.
19 UNICA http://www.unica.com.br/i_pages/pesquisa3.asp, acc 30 March 2004 20 UNICA (see note 19) 21 UNICA, at http://www.unica.com.br/i_pages/cana_tecnologia.asp, acc 30 March 2004 22 UNICA, at http://www.unica.com.br/i_pages/agroindustria_alta.asp, acc 30 March 2004 23 UNICA, at http://www.unica.com.br/i_pages/pesquisa5.asp, acc 30 March 2004 24 WADE (2003) Survey of Decentralized Energy in Brazil; Pers. Comm. Sunil Natu (2004).
FIGURE 6OTHER USES OF BAGASSE Research is currently being undertaken on further developing and promoting biodegradable plastics made of sugar and bagasse that break down into water and CO2 within six months instead of the hundred years or so required by conventional plastics. As it takes 17kg of cane bagasse and 3kg of sugar to make just 1kg of biodegradable plastic, bagasse-based plastics are currently niche products. However, their chemical resistance, quality and biodegradability are promising despite the higher costs associated with their development.19 In the near future, environmental requirements may accelerate a wider uptake of cane plastics. Bagasse could also compete, to some extent, with petrochemicals involved in the manufacture of adhesives, synthetic fibres, herbicides and insecticides as well as substances like ethyl ether, acetic acid, ethyl acetate and diethyl amines.20 Once again, the main advantage of bagasse in these applications would be its biodegradability.

11
TABLE 3 STEAM AND POWER DEMANDS OF A TYPICAL SUGAR MILL, PER TONNE OF CANE CRUSHED Sugar Mill Efficiency Low-to-High
Steam requirement c.500kg (low and high efficiency)
Electricity requirement 15kWh (low) to 34.5kWh (high)
COMPILED FROM ECOINVEST26, SHIRGAOKAR (2002) 27
Boilers employed in non-cogeneration sugar mills have historically been rather inefficient, using
pressures of only 20-45kg/cm2 with matching backpressure turbine generators. In such mills,
steam produced at comparatively higher pressures is passed through steam turbines, generating
electrical power for the milling process. Backpressure steam at 1.5kg/cm2 and small quantities of
medium-pressure backpressure steam (7kg/cm2) are used for process requirements.
25 Casten, T (2004). The DG Revolution – A Second Indian Miracle. Available at http://www.localpower.org/pdf/DG%20Revolution%20Tom%20Casten.pdf 26 Ecoinvest, 2000, at http://www.ecoinv.com/english/Projects/Sugarcane/sugarcane.htm, acc 2 April 2004 27 Shirgaokar, R.V. (2002) Case Study: Upgraded Bagasse Cogeneration. Proceedings of the 3rd International CHP and Decentralized Energy Symposium & USAID International Conference and Exhibition on Bagasse Cogeneration, October 2002, New Delhi.

12

13
3. The Benefits of Bagasse Cogeneration
Bagasse Cogeneration - A Technical Overview
Bagasse cogeneration was pioneered in Mauritius and Hawaii. By 1926-27, 26% of Mauritius’
and 10% of Hawaii’s electricity generation was from sugar factories.28
The process of bagasse cogeneration is sketched out in Figure 7, below.
The new generation of high-efficiency boilers being installed on grid-connected bagasse
cogeneration plants, produce extra-high pressures and temperatures rated at respectively 60-80
kg/cm2 and 490-520°C and above, compared to current settings of around 20 kg/cm2 and 300°C.
The rationale for using such boilers is summarised in Table 4.
28 Report of the First National Forum on Small-Scale Renewable Energy in Belize, 6th July 2001, available at http://www.bun-ca.org/publicaciones/18.pdf, acc 11 March 2004.
Boiler Bagasse Steam Turbo Generator
Steam Mill Drives
Steam & Power
Surplus electricity to grid
Sugar Process
FIGURE 7 THE BAGASSE COGENERATION PROCESS

14
TABLE 4 COMPARISON OF LOW- WITH HIGH-TEMPERATURE AND -PRESSURE BOILERS Low T and P High T and P
Power Generation (kWh/TC) 20-30 90-160
Net Power from Bagasse (kWh/tonne) 60 370-510
Heat rate, processing (kcal/kWh) 21,000 6,000-8,000
SOURCE: GOLLAKOTA & SOBHANBABU (2002) 29
In order to maximise the amount of electricity sold to the grid, it is also important to minimise the
process use of steam and power through the use of energy conservation techniques and
management as well as energy efficient equipment. In India, such policies have included
conversion of mills from steam-driven to electricity-driven, use of steam-saving equipment in
boiler houses and energy-efficient pumps and motors.
The Rationale for Cogeneration from Bagasse
From a financial point of view, bagasse cogeneration is a classic win-win for the sugar industry,30
as it boasts numerous advantages over traditional generation. Cogeneration of energy from
bagasse is attractive as it combines low cost, efficiency and social benefits with the provision of
clean, renewable energy.
Bagasse cogeneration, especially in high-temperature and pressure configurations, could play an
important role in encouraging much more efficient use of resources and ensuring widespread
access to electricity services. Unfortunately, insufficient incentive to supply electricity to the grid
because of low or inexistent buyback rates has meant that, until recently, around two thirds of
harvested bagasse was wasted.31 This situation is now set to improve, with the introduction of
more effective biomass feed-in tariffs in countries such as Brazil and India.
29 Gollakota & Sobhanbabu (see note 17) 30 Ghosh, S. (2002). Bagasse Cogeneration – A Bank’s Perspective. Proceedings of the 3rd International CHP and Decentralized Energy Symposium & USAID International Conference and Exhibition on Bagasse Cogeneration, October 2002, New Delhi, p 120. 31 Casten (see note 25)

15
1. Economic Benefits
Benefits and advantages of bagasse cogeneration include:
a. Increasing the viability of sugar mills
b. Near-zero fuel costs, paid in local currency and valuation of bagasse as a waste
product
c. Increased fuel efficiency
d. Increasing diversity and security of electricity supply
e. Location at the point of energy demand, leading to minimal transmission and
distribution (T&D) costs.
a. Increasing the Viability of Sugar Mills
The long-term economic viability of sugar mills has become more vulnerable, mainly due to
fiercely competitive domestic and global sugar markets. The inherent energy inefficiency of
design and operation as well as the industry’s high energy requirements are also factors of
growing importance. Appropriate remuneration of electricity from bagasse cogeneration would
increase the added value to the alcohol and sugar sectors.32 This is especially valid as sugar-
milling seasons often coincide with peak demand loads. In countries such as Brazil, where peak
power can be up to ten times costlier that off-peak power,33 sugar mills can thus benefit
immensely from the opportunity to sell electricity to the grid.
b. Fuel Costs
The capital costs of bagasse cogeneration plant are the lowest of all renewable forms of power
generation, equal to those of biomass gasification projects, whilst generation costs, despite being
higher than biomass gasification projects, small hydroelectric (HEP) and photovoltaic (PV), are
on par with biomass power and lower than wind.34 Bagasse cogeneration projects also have short
development periods, as the technologies used are proven and well established.
c. Diversity and Security of Supply
The use of a local fuel source guarantees a certain degree of security of energy supply, improving
and increasing the trade balance with imported fuels. Onsite crop use ensures that delivery times 32 Ottenheym, R., Cogen SP (2003). Promoting Energy Cogeneration in São Paolo. 33 WADE (see note 24) 34 Majumdar, D. (2002). Financing of Bagasse Cogeneration – Issues and Opportunities. Proceedings of the 3rd International CHP and Decentralized Energy Symposium & USAID International Conference and Exhibition on Bagasse Cogeneration, October 2002, New Delhi.

16
are short and costs are kept low. Out of season, biomass co-firing with green wood or eucalyptus,
for instance, is now possible in many cases, being factored into the design of new bagasse
cogeneration plants. This enables bagasse cogeneration plants to operate beyond the crushing
season for up to 300-330 days / year.
The advantages of bagasse cogeneration in increasing security of power supply issues also
include the capacity to generate during the dry season,35 when, for example, HEP sites are not
operational. Sugar mills that produce and export electricity also increase grid stability and
reliability as well as decreasing the need for costly capital investments in grid upgrading in these
areas.36 In Brazil, for instance, São Paolo State has already developed all its large economically
viable HEP sites, so the promotion of electricity from bagasse cogeneration is seen as a means of
avoiding electricity imports from other regions to meet the State’s demand.
d. Location
As a decentralised mode of electricity generation, bagasse cogeneration reduces T&D losses by
supplying electricity near its generation point whilst reducing loads on grid wires.37 This could
be most significant in large countries such as India and Brazil, where average T&D losses
account for around 23% and 16% of centrally generated electricity respectively,38 mainly due to
long distances between generation and end-users. Bagasse cogeneration will thus benefit
customers who do not have to bear the costs of such high T&D losses.
Integration of cogeneration technologies in the sugar industry, especially in extra-high pressure
and temperature configurations, will almost certainly be essential for the long-term growth and
economic survival of the sugar industry in many cane producing countries. The ability to meet all
of the mill’s increased energy needs as well as the promise of additional revenues from the sale of
exportable surpluses to utilities or third parties could become key factors in securing the sugar
industry’s viability.
35 de Hollanda, J. & Poole, A., INEE (2001). Sugarcane as an Energy Source in Brazil. Available at http://www.inee.org.br/down_loads%5Cabout/SUGARCANE&ENERGY.pdf, acc 2 April 2004 36 Ottenheym, R., Cogen SP (2003). Promoting Energy Cogeneration in São Paolo. 37 Casten (see note 25) 38 Casten (see note 25)

17
2. Social Benefits
The social benefits of onsite bagasse-fired cogeneration are:
a. Greater employment for local populations
b. More widespread availability of electricity
c. More secure and reliable supply of electricity for existing consumers.
a. Employment
Bagasse cogeneration has the potential to boost employment for neighbouring populations,
increasing income for farmers. It will also allow operational personnel to develop skills to use
local equipment and technologies, improving the local socio-economy.39
b. Availability of Electricity
As sugar mills tend to be located in rural areas, near sugarcane plantations, bagasse cogeneration
will prove beneficial to local populations by contributing to expanding access to electricity
supplies in areas otherwise distant from the grid. The advent of links to the network will facilitate
the collection of electricity payments by electricity boards in rural areas whilst electricity boards
will be able to better serve rural consumers through the upgrade of local and rural networks.
c. Quality of Electricity
The simultaneous increase in reliability and quality of power in the area will enhance quality of
life whilst reducing voltage and frequency variation and the associated damages that these cause
to network equipment.
As it is a locally sourced fuel, bagasse will increase the reliability of electricity supply by
diversifying sources and reducing fossil fuel dependence. This is particularly true of countries
heavily dependent on HEP, such as Brazil, where bagasse cogeneration could reduce the risks of
electricity shortages in dry years.
39 Ribeiro (see note 18)

18
3. Environmental Benefits
As a biomass fuel, bagasse supplies a raw material for the production of natural, clean and
renewable energy, enabling its use to further government targets for renewable energy use. In
brief, the environmental advantages of bagasse cogeneration are:
a. Low emission of particulates, SO2, NOx and CO2 compared to coal and other
fossil fuels
b. In GHG terms, bagasse combustion emits less than composting.
c. Fuel efficiency.
a. Emissions
Bagasse combustion is environmentally friendly because it boasts low particulate and CO2
emissions. This is especially true where bagasse cogeneration replaces carbon-intensive fossil
fuel generation. For instance, in India and China, bagasse could displace coal, which amongst
other problems has very high levels of ash.
b. Combustion versus composting
In terms of CO2 and other GHG, bagasse cogeneration would add no net emissions: bagasse is
viewed as a waste product that needs to be disposed of – either by decomposition (composting) or
combustion, both of which would release, as CO2, the carbon contained in bagasse.40 Besides, if
the bagasse were to be composted, it would also release methane, a GHG 27 times more potent
than CO2.41
These benefits will enable bagasse cogeneration to be a potentially significant player in
international carbon credit markets in the future, with sugar industries reaping the social and
financial benefits of the added revenues (see sections 7 and 9).
c. Fuel efficiency
Cogeneration is a highly efficient energy conversion process. The same amount of bagasse will
yield more power (heat as well as electricity) in cogeneration mode than in conventional
combustion processes that do not recover heat. More efficient fuel use can thus also further
countries’ sustainable development goals.
40 Ribeiro (see note 18) 41 Casten (see note 25)

19
4. India
Electricity Production
India’s total electric generation capacity is 120.3GWe.42 The current prevailing energy mix,
consisting of 65-70% fossil fuel based thermal energy, is expected to remain at this level over the
next 10-20 years.
T&D and commercial losses are very large, amounting to around 40% of the total electricity
generated centrally. For this reason, 1kWh generated locally can be taken to be roughly
equivalent to 1.5-1.8 generated centrally.43
Cane Production
India has just over 500 sugar mills,45 with
nine states (Uttar Pradesh, Bihar, Punjab and
Haryana in the northern region; Maharashtra
& Gujarat in the western region and Andhra
Pradesh, Tamil Nadu and Karnataka in the
southern region, Figure 8) holding 95 % of
them. Most mills are either privately owned
or co-operatives.46 Figure 9 gives details of
the distribution of sugar mills in India.
In India, the crushing season lasts 100-250
days per annum depending on the region,
42 USDOE, http://www.eia.doe.gov/pub/international/iea2002/table64.xls, last accessed 27-May-2004 43 Casten (see note 25) 44 USDA, at http://www.usda.gov/oce/waob/jawf/profiles/graphs/ind/indsugc.gif, acc. 19-April-2004 45 National Federation of Co-operative Sugar Factories Ltd., New Delhi. Co-operative Sugar, June 2003. 46 The Sugar Technologist’s Association of India. List of Cane Sugar Factories & Distilleries (2002-2003)
FIGURE 8CANE-PRODUCING AREAS IN INDIA
SOURCE: USDA44

20
weather, irrigation and cultivation practices as well as cane availability, in itself a function of the
prices paid to cane growers.
Sugar mills have capacities
ranging from below 1,250 TCD
to 10,000 TCD. The Indian
Government has now established
minimum capacity criteria for
new sugar mills standing at 2,500
TCD.
Market Trends
The economic and commercial
performance of the Indian sugar
industry has generally been poor
and subject to wide fluctuation.
The complexities of regional,
socio-economic and political
linkages of the different
ownership sectors of sugar mills
present severe challenges for survival and growth.
Indian sugar mills are currently self-sufficient in energy, already using bagasse to meet their
steam and power requirements. As only 20-30% of all bagasse is used for these purposes, this
suggests that the remaining 2/3 of bagasse is currently being “wasted”,48 as it is being incinerated
for disposal purposes rather than energy recovery.
Greater sector efficiency, higher quality and integration are challenges for the industry to improve
the strength and capacity built in the last seventy years. These aims can be achieved through:
47 Sugar Technologist’s Association of India (see note 46) 48 Casten (see note 25)
FIGURE 9DISTRIBUTION OF SUGAR MILLS IN INDIA
0
20
40
60
80
100
120
140
160
Mah
aras
htra
Utta
r Pra
desh
And
hra
Pra
desh
Kar
nata
ka
Tam
il N
adu
Bih
ar
Guj
arat
Pun
jab
Har
yana
Mad
hya
Pra
desh
Oris
sa
Oth
er S
tate
s
State
Num
ber o
f Mill
s
>5,000 TCD3,500 to 5,000 TCD2,500 to 3,500 TCD1,250 to 2,500 TCD< 1,250 TCD
SOURCE: THE SUGAR TECHNOLOGIST’S ASSOCIATION OF INDIA (2002-03)47

21
• Substantial improvements in cane development and management including cultivation
practices, crop variety and water management to improve yields and recovery without
affecting the average fibre content.
• Improvements in both sugar and by-product manufacturing, achieved through operational
and energy efficiency improvements, will contribute to making the best use of bagasse.
• Capacity expansion and diversification into cogeneration and alcohol/ethanol production
projects in order to maximise the value of sugar whilst adding security to sugar markets
through diversification of products.
Bagasse Cogeneration: Current Status, Future Potential Historical Background Since the early 1990s, in recognition of the advantages of bagasse cogeneration relative to current
regimes of centralised generation in India, several governmental, national and international
agencies and financial institutions have been acting to promote and develop cogeneration power
projects in Indian sugar mills. In addition to its wider benefits, bagasse cogeneration is seen as a
potential means of meeting India’s renewable energy targets,49 set at 10% of total installed grid
capacity by 2012.50 A timeline of the industry’s development is given in Figure 9.
In 1994, the Indian Ministry of Non-Conventional Energy Sources (MNES) started the process of
helping bagasse cogeneration to take off by urging State Electricity Boards (SEB) to purchase
power from local generators at full avoided costs whilst contributing half of grid connection
costs. Eligibility criteria cover a wide range of configurations, broadening the Programme’s
applicability. The implementation of this regime in Maharashtra was particularly advantageous,
with a buyback rate of 6.7 USc / kWh. After regulators became convinced that such distributed
generation could provide a cost-effective and environmentally friendly solution, this eventually
resulted in 710MWe of new capacity being built, planned or contracted.51 Since then, objectives
and policy strategies have been altered to meet changing markets and new challenges whilst
governmental, fiscal and financial institutions have developed further incentives. Current
incentives are summarised in Table 5.
49 Majumdar (see note 34) 50 Gollakota & Sobhanbabu (see note 17) 51 Casten (see note 25)

22
52 Co-operative Sugar (see note 45) 53 www.mercindia.com
29 Number of Mills152 5061,176 Cultivated Area (Thousand Hectares) 4,500
36 Cane Production (Million Tonnes) 295 1.3 Cane crushed (Million Tonnes) 1.35 110 Season (Number of Days) 531 180
0.12 Sugar Production (Million Tonnes) 13.2 8.96 Average % of Cane Recovered 9.95
Electricity Bill passed by Indian
Parliament; Central and State
Electricity Regulatory
Commissions become functional.
2003
Maharashtra Electricity
Regulatory Commission
issues incentive
tariffs for the buy-back of electricity
from bagasse
2002
Some states go back on
purchase policies
2000-2003
2001-2003
Power sector reform slows
project commissioning 14 states
announce power
purchase policies
1998-1999
1998
De-licensing of sugar industryNational
Programme on Promotion of
Biomass Power / Bagasse based cogeneration
1992
FIGURE 10 TIMELINE OF EVENTS RELATING TO DEVELOPMENT OF THE BAGASSE COGENERATION INDUSTRY IN INDIA.
COMPILED FROM NATIONAL FEDERATION OF CO-OPERATIVE SUGAR FACTORIES LTD (2003)1, PERS.COMM, SUNIL NATU (2004), MERC
First Indian
sugar mill
1930 2004
506 sugar mills operating; 100
in pipeline

23
TABLE 5 INCENTIVES FOR BAGASSE COGENERATION FROM INDIAN GOVERNMENTAL, FISCAL & FINANCIAL INSTITUTIONS Incentive: Description:
Capital Subsidy for CHP projects in co-operative/public sector sugar mills, through Joint Venture (JV) or IPP mode, equivalent to 3,500,000-4,500,000 Indian Rupees (c. US$ 77,000 – 100,000) / MW of exportable surplus, depending upon level of pressure / temperature configuration. Interest Subsidy for commercial biomass power / CHP projects through leading financial institutions, at 2-3 % or 1-3% depending on biomass category and level of pressure / temperature configuration. Financial assistance under National Biomass Resource Assessment Programme, up to 90% of the cost.
National Programme on Promotion of Biomass Power / Bagasse-based Cogeneration
Financial support to research projects proposed by industry – laboratory / academic institution consortia.
Accelerated Depreciation
100% depreciation in the first year can be claimed for the following power generation equipment: 1. Fluidised Bed Boilers 2. Back pressure, pass-out, controlled extraction, extraction and condensing turbines for power
generation with boilers 3. High efficiency boilers 4. Waste heat recovery equipment
Income Tax Holiday Five year tax holiday with 30% exemption
Customs Duty 20% duty levy for New and Renewable Sources of Energy power projects of less than 50MWe capacity (under Project Import Category). This covers machinery and equipment component parts required for generation of electric power.
Central Excise Duty Exempted for renewable energy devices, including raw materials, components and assemblies.
Central Sales Tax Exempted for renewable energy devices, including raw materials, components and assemblies.
General Sales Tax Exemption is available in certain States. COMPILED FROM PERS.COMM. SUNIL NATU (2004)
The adoption by SEB of such promotional programmes has triggered the uptake of bagasse
cogeneration projects. Indeed, since the first SEB implemented this policy, 87 new bagasse
projects have been developed or started, adding almost 1% to total Indian generation capacity.54
54 Casten (see note 25)

24
Potential for Bagasse Cogeneration in India: Projections for India’s potential for bagasse cogeneration range from 3.5GW55-5.2GW56 (2002
projection) to at least 5GW (2004 projection). This potential is expected to be tapped by 2012,
resulting in annual savings of $923 million / year whilst reducing annual CO2 emissions by 38.7
million tonnes.57
Table 6 illustrates the potential, State
by State, for producing exportable
surpluses from sugar mill
cogeneration. Figures are based on
current mill numbers, capacities,
efficiencies and cane availability as
well as future prospects in terms of
modernisation for optimisation of
export potential. The potential is to
be achieved mainly through
improvements in energy efficiency
and adoption of extra-high pressure
(>60 kg/cm2) and temperature configurations. Despite adding to the mills’ demand for steam and
power, the corresponding increase in power output would in itself so big as to make this
worthwhile from a financial stance. More potential could also be achieved by always considering
co-firing with other available fuels as an option, as this would enable mills to continue exporting
power out of season.58 In addition to those mentioned in Table 6, 38 projects with equivalent exportable surplus capacity
of 335.17 MW are currently at various stages of implementation.
55 Majumdar (see note 34) 56 Shiralkar, S.V. (2002). CHP and Decentralized Energy in India – Benefits and Challenges. Proceedings of the 3rd International CHP and Decentralized Energy Symposium & USAID International Conference and Exhibition on Bagasse Cogeneration, October 2002, New Delhi. 57 Casten (see note 25) 58 Casten (see note 25)
TABLE 6STATE-BY-STATE POTENTIAL FOR BAGASSE COGENERATION IN INDIA
State
Potential (MW)
Commissioned exportable capacity, as of 31 December 2003
(MW) Maharashtra 1,250 21.0 Uttar Pradesh 1,250 75.0 Tamil Nadu 500 105.0 Karnataka 500 125.0 Andhra Pradesh 300 49.3 Bihar 300 Nil Gujarat 250 Nil Punjab 150 Nil Other 500 Nil Total 5,000 375.9 (7.5%) SOURCE: MNES, NEW DELHI

25
Figure 11 gives the cost of generation for a typical project, based on a set of givens and
assumptions outlined in the left-hand column.
FIGURE 11 THEORETICAL PROJECT EXAMPLE - INDIA There are several models for sugar mill cogeneration projects, with outputs varying most with crushing capacity and technologies used. The project mill has the following features: • 2,500TCD capacity • 67kg/cm2 pressure, 495°C temperature extraction-
condensing turbine, operating both in and out of season.
• Boiler capacity: 80 TPH • Installed total generating capacity for cogeneration:
18MWe • Generation capacity: 15MW, 10MW of which are
exportable in season (180 days) and 15MW out of season (120 days).
• Capacity utilisation: 85%. • Total power exports: 73.44MWh per year, shared
equally between the crushing and non-crushing seasons.
Exchange rate taken: 1 Indian Rupee = US$ 0.022, given to the nearest dollar.
COST US$
Capital cost (cost / MW installed capacity)
119,403 (6,634)
Cost of generation • 70% debt (interest rate 16%) 13,378 • 30% equity (interest rate 12%) 4,290 • Depreciation (5.28% of capital cost) 6,302 • O & M cost
(% of capital cost) 4,179
(3.5%) • Admin overheads
(% of capital cost) 907
(0.75%) • Interest on working capital - 3% spares @ 15% 531 - 3 months debtors @ 15% 2,145 • Loading of fuel cost for cogeneration, in season • (MT of bagasse @ US$8.85 / MT)
1,504 374
• Off-season fuel cost • (MT of procured bagasse / equivalent biomass or
coal @ US$14.37 / MT)
16,208
2,492 • Total 49,442 Cost of generation (US$ / kWh) 0.067
SOURCE: COGEN INDIA, PERS. COMM. SUNIL NATU
The potential for bagasse cogeneration in Indian sugar mills is therefore great, with expanded use
providing increasing economic value and returns from higher efficiency in generation,
distribution and equipment use. Energy audits, careful implementation, maintaining efforts for
energy conservation and above all, building capacity and culture for the purpose, will go a long
way to achieve these goals.

26

27
5. Brazil
Brazil has a population of 170 million people, mostly concentrated along the southeast coast. By
2002, approximately 95% of homes had access to electricity services, but in remote areas of
Brazil for which connection to the national grid is uneconomic, rural communities rely on
decentralised renewable energy projects for electrification. Electricity consumption is
concentrated in the industrialised southern coastal regions.59
Electricity Production
Brazil’s generating capacity is currently around 74GWe,
95% of which is generated centrally by HEP.61 Vast
distances separate the HEP schemes from end-users and,
consequently, T&D system losses are amongst the
highest in the world at an average of 16%.62 Table 7
gives a breakdown of losses in the Brazilian T&D
system.
In order to meet electricity demand during prolonged periods of low rainfall, large surpluses of
water were traditionally maintained in hydropower reservoirs.63 However, with demand for
electricity forecast to rise by 3% per annum until 2020,64 the Brazilian government is striving to
provide new security to the electricity sector whilst delivering greater access to rural populations.
Over-reliance on HEP was an underlying factor behind the 2001 electricity crisis, as low rainfall
led to low storage levels in reservoirs.
59 WADE (see note 24) 60 USAID Programs: the Leader With Associates (LWA) Program and the Brazil Clean Energy and Energy Efficiency Program (BCEEP), U. S. Agency for International Development; and WINROCK International. 61 UNICA (see note 23) 62 WADE (see note 24) 63 UK Trade and Investment (2002). Power Market in Brazil: Overview. Available at http://www.tradepartners.gov.uk/energy/brazil/profile/overview.shtml, last accessed 17 May 2004. 64 WADE (see note 24)
TABLE 7GRID LOSSES IN BRAZIL Consumption Losses Off-grid Systems 2% 29.6%
Grid systems North 14.9% North East
19% 19.3%
South-East / Central
16.0%
South 79%
11.9% Average 16.0% COMPILED FROM BNDES AND USAID60

28
Cogeneration currently represents around 3% of total electricity generation. Of this, biomass
accounts for two thirds with coal and gas making up the remainder. Most biomass cogeneration
is based on bagasse use in sugar mills.
Cane Production
In Brazil, cane is produced on only 1%
of the land suitable for farming.66 It is
grown in both the south-central and
north-northeast regions, allowing for
two harvest periods and a continuous
production. Figure 12 illustrates the
main sugar-growing areas of Brazil.
Depending on planting time, sugarcane
takes between twelve and eighteen
months to mature, but a plantation can
then be harvested up to five times on
condition that significant investments
are made at each cycle to maintain
productivity.67
Brazil’s sugarcane industry employs a total of 1 million people.68 São Paulo State alone employs
about 400,000 in its plantations and mills, representing 40% of the State’s rural employment69 for
the combined production of sugar, ethanol, energy and electricity associated with sugarcane.70
Currently, 80% of harvesting is manual but mechanisation is advancing, especially in São Paulo
State, where this now reaches 25%.71 For manual harvesting, the cane trash is burnt prior to
harvest, as this makes safer and more productive for cane cutters. This method, however, leaves
little scope for energy production from bagasse.
65 USDA http://www.usda.gov/oce/waob/jawf/profiles/graphs/brz/brzsugc.gif Acc. 19-April-2004 66 UNICA (see note 22) 67 UNICA (see note 22) 68 UNICA http://www.unica.com.br/i_pages/cana_corte.asp, acc 30 March 2004 69 UNICA http://www.unica.com.br/i_pages/sociedade_desenvolv1.asp, acc 30 March 2004 70 UNICA (see note 69) 71 UNICA (see note 68)
FIGURE 12MAIN SUGAR-PRODUCING AREAS IN BRAZIL
SOURCE: USDA65

29
Market Trends
Brazil is the world’s largest sugar producer and exporter,72 with half of its production going to a
host of countries led by Russia and Nigeria.73 Sugar exports contributed US$1.2 billion to the
trade balance in the year 2000. São Paulo State, on its own, produces 60% of all Brazilian sugar
and accounts for 70% of national exports.74 Brazil is able to remain competitive in international
markets due its use of advanced technology and management methods that enable it to have the
world’s lowest production costs. Besides, the leveraging of exports by the devalued Real with
respect to the U.S. dollar has also maintained its position in the competitive international
market.75
With its high population and a long tradition of high per capita sugar consumption (52kg
compared to a world average of just 22kg76), Brazil has a high domestic annual consumption,
which, in spite of macroeconomic problems, is inelastic.77
Around 55% of Brazilian sugarcane is converted into alcohol for fuel.78 As alcohol and sugar
prices rise and fall in relation to each other, the conversion to alcohol rises or falls according to
the optimal balance for revenue maximisation. Alcohol content in domestic gasoline is high and
is set by the government. Since June 2003, this has been 25%.79
72 UNICA http://www.unica.com.br/i_pages/acucar_tecnologia.asp, acc 30 March 2004 73 Food Market Exchange http://www.foodmarketexchange.com/datacenter/product/sugar/detail/dc_pi_sugar_05_03.htm, acc 22 March 2004 74 UNICA (see note 72) 75 USDA (see note 7) 76 UNICA (see note 72) 77 USDA (see note 7) 78 UNICA (see note 22) 79 USDA (see note 7)

30
Bagasse Cogeneration: Current Status, Future Potential Historical Background
The development of bagasse cogeneration was initially prompted by the 1970s oil crises, when
Brazil was highly dependent upon petroleum. Sugar mills were then encouraged to generate
electricity for their own consumption.
As, until July 1999, power exports from mills were not possible, the industry developed low
pressure, low efficiency 2-100MWe units for self-supply only80 to ensure that excess bagasse
could not accumulate and become a disposal problem. Almost all sugar mills and alcohol
distilleries in Brazil employed small bagasse-fired steam turbine systems – supplied with steam at
21kg/cm2 – to provide just enough steam and electricity to meet onsite factory needs.81 Most of
these units date from about 20 years ago.82
Figure 13 summarises a time-line of the main events affecting the development of bagasse
cogeneration in Brazil.
80 WADE (see note 24) 81 Ecoinvest (see note 26) 82 WADE (see note 24)

31
a83
83 UK Trade and Investment (see note 63)
Vale do Rosario sugar mill wins
“Best CDM Project”
2002
Creation ofPROINFA
Power exports by IPPs
becomes possible
1999
1995-2000 Electricity sector
reform gives access to T&D
network
1970s
Development of bagasse cogeneration following oil
shocks
1535
First Brazilian sugar mill
FIGURE 13 TIMELINE OF EVENTS RELATING TO DEVELOPMENT OF THE BAGASSE COGENERATION INDUSTRY IN BRAZIL
2004
Publication of PROINFA
Tariffs
COMPILED FROM WADE (2003), UK TRADE AND INVESTMENT (2002)81

32
Most of Brazil’s biomass
cogeneration is in São Paulo
State, where 40 sugar mills
use 1.2-1.5GW of capacity for
auto-consumption and 158
MW for sale to the grid.85 A
further 1.3GW are to be
installed in 2004 in São Paulo
State alone.86 In total, the
Brazilian cane industry has a
potential equal to 12GW,87 of
which 6GW in São Paulo
State,88 which can be
exploited cost-effectively through the use of higher-pressure boilers, conservation practices and,
in the longer term, through the development of new gasifying technologies. Figure 14 analyses a
case study for the Cresciumal Sugar Mill, showing the increased generation capacity potentially
achieved through some of the measures stated above.
In the current Brazilian energy policy climate, surplus electricity can be sold to electricity
distributors89 – this is, in fact, promoted by various government incentive programmes, described
further in section eight. One of these, PROINFA, provides a feed-in tariff for renewable
generation including bagasse cogeneration (see Table 12). The release of these tariffs, set at
R$93.77-169.08 (US$32.17-58.00) per MWh, could give the impetus required to kick-start the
development of efficient bagasse cogeneration in Brazil, greatly enhancing the prospects of the
sugarcane industry.
Bagasse cogeneration is being strongly promoted in Brazil for reasons other than simply avoiding
CO2 emissions. Brazil’s reliance on hydropower so far has meant that in certain areas – São
Paolo State, for instance – all large economically viable HEP sites are already developed90 and
84 Ribeiro (see note 18) 85 UNICA, http://www.unica.com.br/i_pages/cana_produtos.asp, acc 30 March 2004 86 Pers. Comm. CogenSP (2004) 87 UNICA, http://www.unica.com.br/i_pages/cana_produtos.asp, acc 30 March 2004 88 Ottenheym (see note 32) 89 UNICA (see note 21) 90 Ottenheym (see note 32)
FIGURE 14CASE STUDY: CRESCIUMAL SUGAR MILL, BRAZIL
OLD SYSTEM
• Bagasse power production • Consumed • Surplus • TOTAL bagasse production • Bagasse used • Excess bagasse/surplus
4.5MW 3.5MW 1MW
82t/ha 76t/ha 6t/ha
NEW SYSTEM – NEAR FUTURE
• Bagasse power production • Consumed • Surplus • TOTAL bagasse production • Bagasse used • Excess bagasse/surplus
30MW 5MW 25MW
88t/ha 82t/ha 6t/ha
Increasing focus on production of steam
for condensing.
Decreasing drive and process steam.
Increasing power
consumption, steam pressure, boiler efficiency,
steam temperature, total steam production.
Increasing total surplus power.
NEW SYSTEM – MEDIUM-TERM
• Bagasse power production • Consumed • Surplus • TOTAL bagasse production • Bagasse used • Excess bagasse/surplus
36MW 6MW 30MW
98t/ha 92t/ha 6t/ha
COMPILED FROM RIBEIRO84
33
neighbouring producer regions currently have to supply to make up the deficit. This is not an
ideal situation for supply, as it increases distances to end-users and thus grid losses, as well as the
need for investment in T&D networks. If, however, local cogeneration – for instance from
bagasse – were to provide new capacity, this would help to avoid heavy new investment in the
grid and so reduce network costs.91
Bagasse cogeneration is being further encouraged through projects qualifying for the Kyoto
Protocol’s Clean Development Mechanism (CDM).92 Indeed, 11 sugar/alcohol mills are
developing agreements under the CDM. Some of these are outlined in section Nine. However,
with the advent of the PROINFA feed-in tariffs and other policy incentives, producers may find
that there are fewer advantages arising from CDM opportunities. Proposals under the CDM may
therefore decrease in the future.
91 Ottenheym (see note 32) 92 UNICA, http://www.unica.com.br/i_pages/artigos_palavra.asp, acc 30 March 2004

34

35
6. Other Countries – A Summary
Australia
Australia has 37 sugar mills, of which all bar one are in Queensland or near its border. The mills
crush over 40 million tonnes of cane each year, producing 6 million tonnes of raw sugar of which
80% are exported.93
Bagasse combustion has long been a part of the Australian sugar industry but, until recently,
output was only consumed as waste heat. Rocky Point sugar mill was Australia’s first bagasse
cogeneration project. It generates up to 180GWh per year of electricity from bagasse,94 providing
an annual supply of electricity to more than 10,000 homes, steam and electricity to the nearby
Beenleigh Rum Distillery whilst reducing GHG emissions by up to 155,000 tonnes. As cane
crushing is a seasonal event, Rocky Point sugar mill is configured to co-fire with green waste and
wood waste to ensure year-round operation.
Since bagasse cogeneration can add significant value to sugar production, electricity sales can
potentially match or even surpass revenues from Australian sugar sales.95 Bagasse cogeneration
can also reduce the capital costs of future sugar mill expansions by pushing for greater economies
of scale. Both these arguments suggest that bagasse cogeneration offers a viable and realistic
mechanism by which to ensure the long-term economic sustainability of the sugar industry, not
only in Australia but also worldwide.
Australia has not ratified the Kyoto Protocol but does have renewable energy (RE) targets for
which bagasse cogeneration can qualify. Indeed, bagasse cogeneration has the potential to deliver
93 Pickering, S. (2000). Sugarcane: Offering Australia a Sweet Power Alternative, in Refocus (September-October 2000). Available at http://www.re-focus.net/news_archive/index.html. 94 Sims, R.E.H. (2002) Bagasse and Green Waste Cogen Plant; Rocky Point Sugar Mill, Australia. Cogeneration and Onsite Power Production, 3(1), Jan-Feb 2002, pp39-42. 95 Pickering (see note 93)
36
a large share of the 2% increment in RE required to meet Australia’s target of 12.5% electricity
from RE by 2010.96
Belize Belize produces just over 1 million tonnes of sugarcane per year97. Belize Sugar Industries are
pursuing bagasse cogeneration for its potential for expansion of the sugar industry, recognising
the advantages of bagasse cogeneration and including in these the efficient disposal of excess
bagasse in an environmentally friendly manner. In Belize, it is estimated that a cogeneration
plant sited next to a sugar factory can provide steam and electricity to the plant whilst exporting
up to 18-20MW of electricity to the national grid in season (December to June).98
Eastern and Southern Africa99 Countries of eastern and southern Africa have a very large potential for producing electricity from
bagasse, due to long crushing seasons (8-9 months instead of a typical 6-7 months). The highest
potential is in Sudan, which could produce over 40% of its electricity from bagasse cogeneration.
Many eastern and southern African countries would benefit greatly from bagasse cogeneration
due to their low electrification rates – especially in rural areas – and their dependence upon HEP.
The use of bagasse cogeneration could help to save HEP resources by providing a cheap means of
generating electricity during a substantial part of the year, so that there would be less strain on
HEP during periods of low rainfall. This point particularly applies to Kenya, where sugarcane
plantations are situated in a different climatic zone to the country’s HEP plants, making it less
likely that both will be affected by drought simultaneously. Bagasse cogeneration would also
provide electricity at a stable price compared to fossil fuel-based generation that is dependent on
foreign exchange rates and world oil price fluctuations.
96 Pickering (see note 93) 97 FAO (see note 2) 98 First National Forum on Small-Scale Renewable Energy in Belize (see note 28) 99 AFEPREN (2003). AFEPREN Occasional Paper 21: Opportunities for Cogeneration in a Reforming African Power Sector. Available at http://www.afrepren.org/Pubs/Occasional_Papers/pdfs/op21.PDF , last accessed 1 June 2004.

37
Sale of electricity to the grid is already possible in Zimbabwe, Zambia, Tanzania and Kenya.
However, there are certain problems with bagasse cogeneration that could stunt its development
in eastern and southern African countries:
• Bagasse cogeneration can be expensive compared to HEP schemes already in place
(6USc / kWh compared to 3USc / kWh) and compared to cheap electricity from the
Southern African Power Pool. Therefore, electricity boards may be unwilling to set feed-
in tariffs to the higher level required by sugar mills.
• Poor management of some sugar mills has caused the sugar industry to run into
difficulties; some sugar mills – especially in Kenya and Tanzania – have been closed
down as a result of this, limiting the scope for bagasse cogeneration in these countries.
• As in many other countries, sugar mills often require refurbishment and upgrading to
ensure that they are energy-efficient so that they can profit from electricity generation.
Low sugar prices in world markets mean that sugar mills often have little money to invest
in such schemes.
Jamaica
Jamaica produces around 2.5 million tonnes of sugarcane per year.100 The All-Island Jamaica
Cane Farmers Association is calling for factories to produce their own electricity in order to lower
the cost of sugar and of the electricity they consume as well as increasing revenues by selling
electricity to the grid. It is estimated that each factory could produce around 40MW of
electricity.101
Mauritius
Mauritius produces just under 5 million tonnes of sugarcane each year.102 Bagasse cogeneration
was partly pioneered in Mauritius and, by 1926-27, 26% of Mauritius’ electricity generation was
in sugar factories.103 Bagasse cogeneration is an ideal source of energy for Mauritius, as the
100 FAO (see note 2) 101 James-King, E. (2004). Fuel Bill Still Too High. Jamaica Gleaner, 22February 2004. Available at http://www.jamaica-gleaner.com/gleaner/20040222/news/news1.html 102 FAO (see note 2) 103 First National Forum on Small-Scale Renewable Energy in Belize (see note 28)
38
country has no indigenous oil, natural gas or coal deposits and currently needs to import 75% of
its primary energy requirements.104
The Mauritian government has recently asserted that the country wants to further develop local
energy sources, including biomass, to keep increasing demands for petroleum imports under
control.105 Bagasse cogeneration projects co-firing with coal are being developed to ensure year-
round operation. Incentives for the further development of bagasse cogeneration have previously
included:
• Performance-linked rebates for surplus bagasse production and power from bagasse
cogeneration
• Tax exemptions
• Incentive tariffs for bagasse-cogenerated power.
The responses to such incentives have been increased energy and resource efficiency, including
enhancing the calorific value of bagasse to maximise its energy density.106
Nicaragua
Nicaragua produces around 3.25 million tonnes of sugarcane per year.107 One of its mills, the San
Antonio sugar mill, was converted to a 15MW sugarcane and eucalyptus wood co-firing unit in
2000. Observed social, environmental and economic benefits include a tripling of employment
compared to previously, when the mill was fuel oil fired. CO2 and acidifying emissions have also
dropped by a factor of 30. Bagasse cogeneration projects are expected to increase electricity
availability in Nicaragua, where in 2001 only 48% of the population were grid-connected with
60% of electricity generated from petroleum products (mainly imported oil).108
104 Bhalla, N. (2004). Mauritius Aims to Develop Renewable Energy Sources. Reuters News Service, 23 April 2004. 105 Bhalla (see note 104) 106 Deepchand, K. (2001). Bagasse-Based Cogeneration in Mauritius – A Model for Eastern and Southern Africa, available at http://www.afrepren.org/, last accessed 28 April 2004. 107 FAO (see note 2) 108 Best, G. (2001) The Energy Function of Sugar Mills: Case Study in Nicaragua. In SD Dimensions, Sustainable Development Department of the FAO, March 2001. Available at http://www.fao.org/sd/2001/EN0302a_en.htm , last accessed 21 April 2004
39
7. Global Market Potential
According to analysis undertaken by WADE, summarised in Table 8, the bagasse cogeneration
can make substantial contributions to national power generation in several countries, including
Brazil, India, Thailand, Cuba, Pakistan, Colombia and the Philippines. In all these countries,
bagasse cogeneration could contribute over 5% of total electricity demand, reaching almost 26% in
Cuba. The potential in China, in absolute terms, is also very good, but this is somewhat lost in the
proportionally massive level of electricity generation, which is second only to that of the USA.
TABLE 8 GLOBAL MARKET POTENTIAL
Sugarcane production
(tonnes / year)
Potential for electricity
production (GWh)
Present National electricity
demand (TWh)
Bagasse cogeneration potential as percentage
of electricity demand
Assuming that:
1 tonne cane produces 100kWh of
electricity Figures from 2001
Brazil 386,232,000 38,623 335.90 11.50 India 290,000,000 29,000 497.20 5.83 China 93,900,000 9,390 1,312.00 0.72 Thailand 74,071,952 7,407 90.91 8.15 Pakistan 52,055,800 5,206 62.27 8.36 Mexico 45,126,500 4,513 186.70 2.42 Colombia 36,600,000 3,660 39.81 9.19 Australia 36,012,000 3,601 184.40 1.95 Cuba 34,700,000 3,470 13.38 25.93 USA 31,178,130 3,118 3,602.00 0.09 Philippines 25,835,000 2,584 42.04 6.16
Other 244,581,738 24,458 7,563.39 0.32
TOTAL 1,350,293,120 135,029 13,930.00 0.97 COMPILED FROM: CIA (2003)109, FAO110, SILVESTRIN (2004)111
109 CIA World Factbook (2003), available at http://www.cia.gov/cia/publications/factbook/, last accessed 18 May 2004. 110 FAO (see note 2) 111 Pers. Comm. Silvestrin, C.R., CogenSP (2004)

40
The figure obtained for world bagasse potential, as a percentage of total electricity production
may – like China’s – appear small, but is highly significant in terms of the current market share of
renewable energy, representing 135TWh of electricity that may otherwise be generated by fossil
fuels. This is roughly equivalent to the total annual electricity demand of Sweden112 or around
one third of the total worldwide output of wind power projected for 2012.
If projects and incentives like those offered by Brazil, parts of India and Mauritius, amongst
others, were to be replicated in all sugarcane producing countries, the scope for efficient,
competitive and environmentally friendly electricity production could be sizeable. In regions of
Eastern and Southern Africa, for instance, the 16 million tonnes of bagasse left behind annually
after sugar processing could potentially generate up to 5.5TWh of electricity if modern
cogeneration technologies were employed.113 This corresponds to more than half of the total
combined electricity generation of Kenya, Tanzania and Uganda. 114
Being the world’s largest sugarcane producer, Brazil has an opportunity to exploit its large
potential for bagasse cogeneration. With electricity consumption in Brazil projected to grow by
3% yearly between 2000 and 2030, there is ample scope for renewable sources such as biomass to
play an increasingly important role, even if large part of demand growth is met by HEP, gas
cogeneration and CCGT. This will be especially true if sugar mills deliver their full potential,
believed to be up to ten times their current electricity production in some cases. Indeed, the
development and implementation of high-pressure and temperature systems and the maximisation
of energy efficiency could lead to the development of around 10GWe of cogeneration in Brazilian
sugar mills alone. This would be a large proportion of the identified potential of 11-17GWe by
2010.115
112 DOE, http://www.eia.doe.gov/pub/international/iealf/table62.xls, last accessed 28 May 2004. Figures for 2002. 113 Deepchand (see note 106) 114 DOE (see note 109) 115 WADE (see note 24)

41
The Benefits Quantified - Analysis of the Indian
Sugarcane Sector
Tom Casten, the Chairman of WADE, has analysed the potential benefits of bagasse cogeneration
in India in his paper, “The DG Revolution – A Second Indian Miracle”.116 The paper is derived
from modelling a situation whereby bagasse cogeneration displaces coal-fired central generation.
The results of the modelling, displayed in Tables 9, 10 and 11, show that bagasse cogeneration in
sugar mills could generate large savings, in terms of both CO2 (38 million tonnes per year) and
infrastructure (US$10.8 billion) if full potential is achieved.
But the most dramatic finding is that the cost burden to India, to the tune of almost a billion
dollars a year, will be significantly reduced by incentivising sugar mills, through a buyback rate
of 7 USc / kWh, to maximise the use of cogeneration.
This analysis also proposes a further advantage of bagasse cogeneration, stating that added
revenues from sale of electricity to the grid will aid the growth of the sugar-ethanol vehicle fuel
market. Extra revenues can lower the net cost of producing ethanol from molasses and second
cane pressings, potentially leading to some mills finding it economic to manufacture only ethanol
to compete with conventional petroleum-based motor fuels.
116 Casten (see note 25)

42
TABLE 9 BAGASSE RECYCLING IN INDIA
Item Unit of Measurement Current
Contracted Bagasse
Generation
Potential Bagasse
Generation
Generating capacity Megawatts 710 5,000 Full load equivalent operation Percent of year 68% Delivered useful power / year Gigawatt-hours 4,229 29,784
Equivalent Need for Central Generation, Transmission and Distribution Losses from central stations Percent of generation 23% Avoided central capacity Megawatts 922 6,494 Avoided central generation Gigawatt-hours/year 5,492 38,681 Avoided generator capacity US$ per kW $1000 Total avoided central capacity US$ millions ($922) ($6,494) Avoided T&D cost US$ per kW $750 Avoided T&D with local generation Percent T&D avoided 90% Total avoided T&D US$ millions ($622) ($4,383) Total avoided capital US$ millions ($1,544) ($10,877)
Capital Amortisation Allowed utility rate of return Percent 12% Time to amortise investments Years 25 Annual capital charge if central US$ millions ($197) ($1,387) Avoided capital amortisation US Cents per delivered kWh 4.7
Avoided Fuel Central generation fuel @ 33% efficiency MMBTU millions 56.8 399.9 Central fuel cost US$ per MMBTU $4.00 Total central fuel cost/year US$ millions $225 $1600 Central fuel/delivered kWh US Cents per delivered kWh 5.4
Total Avoided Cost Avoided central power / separate heat generation costs US Cents per delivered kWh 10.1 SOURCE: CASTEN (2004)117
117 Casten (see note 25)

43
TABLE 10 COMPARATIVE ECONOMICS OF CENTRAL VS LOCAL POWER
Contracted Bagasse
Generation
Potential Bagasse Generation
Total cost of central power US Cents per delivered kWh 10.1 Paid to sugar factories US Cents per kWh 7.0 Societal savings per kWh US Cents per kWh 3.1 Cost per year for central power US$ millions $427 $3,008 Payments/year to sugar factories US$ millions $296 $2,085 Annual savings to Indian society US$ millions $131 $923 Savings as % of central power Percent 31% SOURCE: CASTEN (2004)118
In terms of emissions, bagasse emits negligible amounts of NOx, SO2 and ash compared to coal,
the fuel most widely used in India. CO2 will be released from the carbon stored in bagasse
regardless of how it is disposed of. Additionally, composting bagasse rather than burning it
would yield CO2 and methane, whose greenhouse factor is 27 times more potent.
TABLE 11 EMISSION SAVINGS FROM RECYCLING BAGASSE
Contracted Bagasse
Generation
Potential Bagasse
Generation Avoided CO2 per MWh Metric tones 1.0 Total avoided CO2 Million Metric Tonnes/Year 5.5 38.7 Avoided SO2 per MWh Pounds per MWh 12.7 13.7 Total avoided SO2 Metric tonnes/year 31,705 240,874 Avoided NOx per MWh Pounds per MWh 4.7 Total avoided NOx Metric tonnes/year 11,733 82,636 SOURCE: CASTEN (2004) 119
118 Casten (see note 25) 119 Casten (see note 25)

44
45
8. Electricity Market Regulatory Issues
Brazil The Brazilian power grid is a vast interconnected system linking the southern, southeastern and
central states that account for 98% of the electrical market. In these areas, the transmission
network – to which access is now available for a fee – is regulated as a natural monopoly.
Several small isolated systems supply electricity in the north of the country.120
Short History: A summary of events affecting bagasse cogeneration in the Brazilian electricity sector is given in
figure 13, on page 31. Since the 1950s, when private foreign-owned utilities cut investments in
power generation, forcing the Government to develop mass electricity supply, Brazil has
successfully implemented central power planning on a very large scale.
Between 1995 and 2000, the electricity sector went through a comprehensive process of
institutional and regulatory change that introduced free competition in the generation market,
enabling the participation of new actors with a more open policy for access to transmission and
distribution networks.121 This, in theory, allowed IPPs to sell electricity to the grid. This is the
key issue that determines the commercial viability of the expansion of bagasse cogeneration.
By the end of the 1990s, however, the electricity sector was under increasing strain, as lack of
investment in new capacity coupled with increasing energy demand had led to a situation where
there was little reserve margin between peak consumption and production capacity.122 By 2001,
low rainfall had depleted reservoirs, causing a near-collapse in the electricity system.
120 WADE (see note 24) 121 UK Trade and Investment (see note 63) 122 Ecoinvest (see note 26)

46
As a consequence of this, the regulatory framework considered DE more favourably than in the
past, but many decisions are still taken based on the false understanding that central power is the
optimal solution. Despite official policy to strengthen the opportunity for IPPs, many utilities and
policy-makers still see HEP as the best route for expansion. Not all fully understand the
advantages of the relative economics of DE and central power.123
Incentives for Bagasse Cogeneration
Despite constraints in other areas, discussed below, there are growing opportunities for Brazilian IPPs
– including bagasse cogenerators – to sell the electricity they generate, enabling even remote
producers to access promotional mechanisms. Brazilian IPPs are legally permitted to sell electricity
to:
• Licensed electricity supply companies or network operators
• Large consumers who have free choice of electricity suppliers
• Consumers of cogenerated electricity
• Consumer co-operatives (provided permission is granted by the local power utility).
Most incentives applying to bagasse cogeneration exist in the form of schemes for the promotion
of electricity from biomass. Table 12, below, summarises the available incentives, PROINFA
being of crucial importance because it provides incentives for the sale of electricity to the grid.
TABLE 12 INCENTIVES FOR THE DEVELOPMENT OF BAGASSE COGENERATION IN BRAZIL.
“Program for Incentive of Alternative Electric Energy Sources” (PROINFA)
PROINFA was created in April 2002 to increase the share of wind, biomass and small-scale hydropower systems in the Brazilian energy generation mix from Autonomous Independent Producers (PIA)124. The first phase of PROINFA aims to integrate 3.3GWe of capacity through contracts between Eletrobrás (the State electricity company) and PIA lasting up to 15 years. The second phase will guarantee that, after the initial 20-year period, these technologies will supply 10% of annual electricity demand, accounting for at least 15% of market growth. The feed-in tariffs under PROINFA, made public in March 2004, are currently set at R$93.77-169.08 (US$32.17-58.00) per MWh for biomass generation. This corresponds to approximately 80% of the national end-user average tariffs.
Energy Reallocation Mechanism (ERM)
ERM is the financial mechanism by which the risks of HEP are shared amongst the participants of the central dispatching system. Developing grid-connected generation from wind, biomass and qualified cogeneration allows for the mitigation of such risks.
Global Reversion Reserve
This is a resource managed by Eletrobrás, aimed at promoting wind, solar, biomass, thermal and small hydro projects.
COMPILED FROM WADE (2003)125, UNIDO (2003)126, FALCAO (2002)127, GALDINO & LIMA (2001)128 AND TRENCH ET AL (2004)129
123 WADE (see note 24) 124 Under Brazilian Law, PIA are companies in which stock control does not belong to any generation, transmission or distribution utility. 125 WADE (see note 24)

47
Also, as the Brazilian natural gas infrastructure is not yet fully developed, many areas are still
without a competitively priced supply. In areas where this is the case, bagasse cogeneration can
provide a cost-effective source of electricity and perhaps even heat to industrial and commercial
users.
Barriers and Constraints to Development While the regulatory environment for bagasse cogeneration appears to be improving, there remain
some key issues that should be addressed if the full potential is to be achieved. These are:
• Detailed rules for interconnection apply only to central power, whilst interconnection
arrangements for on-site systems in general remain to be clearly defined.
• Utilities often apply old system rules that do not permit ‘inside-the-fence’ generators to
run in parallel with the grid.130 Open access to the electricity system is thus only
facilitated for central power. This is likely to predominantly affect the smallest sugar
mills that have less weight than larger players such as the Vale do Rosario sugar mill,
described in chapter 9.
• Requirements for connection protection and measurement are still strict, causing
difficulties and added expense that affect small IPPs in particular.131
126 UNIDO (2003) “CDM Investor Guide, Brazil”, p. 108. (Vienna, Austria 2003). 127 Falcão, R.L. (2002). Proceedings of the Second International Seminar on Cane and Energy, 29 August 2002. Available at www.inee.org.br/down_loads%5Ceventos/Apresentação%20Seminário%20Cana%20e%20Energia_Versão%20Renata3.ppt 128 Galdino, M.A. & Lima, J.H.G. (2001) “PRODEEM – O Programa Nacional de Eletrificação Rural Baseado em Energia Solar Fotovoltaica”. 129 Trench, Rossi e Watanabe (2004). PROINFA Finally Unleashed: Opportunities for Alternative Sources of Energy. Legal alert, 19 April 2004. 130 WADE (see note 24) 131 WADE (see note 24)

48
India
Short history
A summary of events affecting bagasse cogeneration in the Indian electricity sector is given in
Figure 10, on page 22. In 1994, the Ministry of Non-Conventional Energy Sources issued
guidelines requiring States to fix prices for the purchase of electricity from, amongst others,
sugarcane bagasse cogeneration. These were to include periods of low-cost financing,
arrangements for third-party sale and limited wheeling,132 escalated feed-in tariffs, payment
guarantees by State Electricity Boards (SEB) and guarantees that SEB would bear the costs of
grid-connection.
Thus, up to 2000, 14 States adopted and adhered to electricity purchase policies, which helped to
promote and develop the bagasse cogeneration sector. However, between 2000 and 2003, the
impacts of power sector reform in India led most States to retire the policies they had previously
announced for the purchase of bagasse-generated electricity. This consequently slowed the
anticipated development of bagasse cogeneration capacity.
In 2003, a new Electricity Bill was passed in Parliament and the Central and State Electricity
Regulatory Commissions (ERC) became functional, triggering new regulatory processes for the
purchase of bagasse power in a number of States. The Electricity Bill will, in a sense, aid bagasse
cogeneration by granting easy and fair access to the grid, calling for a mandatory provision of at
least 10% of renewable power in the electricity system and empowering regulatory commissions
to decide on feed-in tariffs for electricity generated from renewable sources.
The Maharashtra Electricity Regulatory Commission (MERC)133 led the way in 2002 by issuing
its incentive tariffs at highly attractive rates, after a time-consuming and comprehensive
regulatory process.
132 A process by which cogenerators are able to sell electricity directly to other customers 133 Maharashtra Electricity Regulatory Commission , at www.mercindia.com

49
Incentives for Bagasse Cogeneration
State Electricity Boards set their own feed-in tariffs for electricity from biomass sources. MERC
was the first to release its tariffs to be implemented by the Maharashtra SEB. These now stand at
3.05 rupees (6.7 US cents) / kWh for the first year of commissioning, with a 2% escalation in
each subsequent year. This policy has, so far, proved very positive and conducive to the
development of renewable energy projects such as bagasse cogeneration.
Barriers and Constraints to Development These are as follows:
• SEBs are still reluctant to buy power from biomass projects, despite the good example set
by MERC with its regulatory process and the provision of the Electricity Act. Many
States and SEBs remain unaware of the opportunity for DE.
• In many States, there is neither the assurance that electricity can be sold to the grid nor, in
fact, any guarantee of timely payment for electricity generated by non-utilities.
• Compensation for failure to supply or fluctuation in grid supply by SEBs is, more often
than not, unavailable. This provides little incentive for forward planning of demand and
production among non-utility electricity generators.
The ERCs in states other than Maharashtra now need to be encouraged to propose feed-in tariffs.
Similarly, regulatory processes in other States need to be initiated and strengthened in order to
produce favourable policies comparable to those applying in the State of Maharashtra, as
encouraged by institutions such as Cogen India.
50
WADE Recommendations
In order for bagasse cogeneration to achieve the potential outlined in section 7, it is important that
certain key measures are brought forward. Building on experiences in India, Brazil and
elsewhere, WADE recommends that:
1. Planning and regulatory paths are cleared for the development of enhanced cogeneration
facilities in sugar mills. This includes ensuring fair and easy access to the grid for both
large and small generators as well as guaranteeing that incumbent generators and utilities
do not hinder these processes.
2. Financial and tax incentives, in line with other incentives for renewable energy, are
provided to boost the initial development of cogeneration facilities in sugar mills. This
would allow generators to invest in the necessary equipment and infrastructure to
maximise their electricity output whilst making the most effective use of heat and
electricity generated onsite. Financial incentives also include the provision, where
possible, of renewable energy feed-in tariffs that reflect the benefits of onsite production
and biomass combustion.
3. Where financial and tax incentives are currently unavailable, the CDM should be
promoted and developed. The CDM could provide the incentive required for the upgrade
or installation of cogeneration equipment in mills in a cost-effective manner whilst
facilitating the meeting of Kyoto Protocol commitments by Annex 1 parties.
4. Further research is carried out into bagasse gasification to fully explore its potential, so
that the best technologies can continue to be promoted and installed to reap the maximum
benefits of bagasse cogeneration.

51
9. CDM Opportunities
The Clean Development Mechanism (CDM) is a process by which OECD Annex 1 countries can
implement greenhouse gas (GHG) mitigation in non-Annex 1 countries to meet part of their
Kyoto Protocol emissions reduction commitments. Potential CDM Projects go through a variety
of stages, namely Design, Validation / Registration, Monitoring, Verification / Certification and
Issuance.134
The multiple environmental and social benefits offered by bagasse cogeneration projects,
described in section 3, would suggest that such projects could be strong contenders to qualify as
CDM opportunities. Table 14 identifies the potential global savings offered by bagasse
cogeneration in terms of reducing CO2 emissions. Note that the basis of comparison is highly
conservative, with a power generation comparison with gas-fired CCGT (in many countries,
including India and China the fuel used is coal). The savings identified, of 40.2 million tonnes of
CO2 per year, equate to almost 20% of the total emissions required to be made by European
signatories to the Kyoto Protocol by 2008-2012. Given our conservative assumptions, this share
is in reality likely to be closer to 25-30%.
TABLE 13 C02 SAVING OF BAGASSE COGENERATION COMPARED TO GAS-FIRED CCGT Technology Gas CCGT Bagasse Cogeneration Gross Efficiency 55% Network Losses 12% Emissions (gCO2 / kWh Delivered) 372 0
Total Worldwide Bagasse Potential for Electricity Generation (TWh)
135 Total Worldwide Exportable Electricity from Sugar Mills (TWh), based on 20% self-use
108 Total CO2 Emissions Avoided by Bagasse Cogeneration (tonnes / year)
40.2 million
134 UNFCCC, http://cdm.unfccc.int/pac/index.html

52
India
India is currently thought of as the country with the most CDM potential. As a developing
country, India offers excellent potential for GHG emission reductions through the promotion of
energy efficiency and renewable energy, improvements in fossil fuel based generation and the use
of cleaner technologies in industries dealing with such services as air-conditioning and
refrigeration.
In spite of the huge potential and focused promotional efforts, achievements in the field of
bagasse cogeneration have so far been minimal, primarily due to complex socio-economic policy
issues creating barriers as well as reluctance to invest in what can seem a risky venture. In such a
climate, CDM could prove an effective tool to mobilise resources internationally.
A reasonable and achievable potential for emission trade by the year 2010 is expected to be
around 9.75 million tonnes of CO2 per year, based on the assumption that bagasse cogeneration
plants would operate for 250 days each year, generating 2GW of exportable surplus electricity in
SEB grids whilst the current balance of fossil fuel generation remains at 70%. At an average
emission trade price of US$5 per tonne of CO2, this equates to revenues of US$50 million per
year.
A potential CDM project in India is the Balrampur Chini Mills in Haidergarh. This is one of the
UK-based Agrinergy’s potential CDM opportunities. This bagasse cogeneration unit, likely to be
operational in 2005, is expected to gain carbon credits by reducing greenhouse gas emissions by
85,000 tonnes per year. 135
135 Point Carbon (2004) “Agrinergy planning CDM projects”, 20 January 2004. Available at http://www.pointcarbon.com/article.php?articleID=3111&categoryID=147

53
Brazil The Brazilian sugar industry can also benefit greatly from the CDM. So far, in Brazil, 11 sugar
and alcohol mills are currently developing agreements under the CDM.
Brazil, like India, is not required to reduce emissions as part of the Kyoto Protocol agreement. In
effect, as it stands, Brazil has one of the least carbon intensive energy sectors in the world due to
its high reliance on hydropower and, increasingly, bio-fuels.
While Brazil’s emission baseline is consequently very low, the country could, however, benefit
from foreign investments that the CDM would generate. Furthermore, the increased development
of biomass cogeneration would benefit sugar and ethanol production, the latter providing a viable
substitute for fossil fuels for vehicles. Figure 15 summarises one of the most important CDM
projects based on bagasse cogeneration in Brazil.

54
136 Econergy Brazil & Cia Acucareira Vale do Rosario (2003). Vale do Rosario Bagasse cogeneration: A GHG Emission Reductions Project Activity in Brazil; CDM Project Design Document. Available at http://www.pointcarbon.com/wimages/FS_408387121.pdf 137 Point Carbon (22.4.04), Brazilian Sugar Bagasse Wins "Best CDM Project" available at http://www.pointcarbon.com/article.php?articleID=3549&categoryID=147 138 Blackburn, P., Reuters (2001). Brazil sugar mill plugs into powerful future. In Planet Ark, available at http://www.planetark.com/dailynewsstory.cfm/newsid/13531/newsDate/3-Dec-2001/story.htm 139 http://www.winrock.org/REEP/PDF_Pubs/icen95.pdf 140 http://r0.unctad.org/ghg/sitecurrent/download_c/pdf/Catanduva%20Sugarcane%20Mill%20Project.pdf
FIGURE 15 CDM CASE STUDY – BRAZIL
Vale Do Rosario, Brazil – Econergy Brazil (approved CDM Project) Founded in 1964, Vale Do Rosario (VR) is a private company with 104 shareholders, most of whom are farmers and sugarcane producers. The region had previously focused only on coffee production, but as this had become unprofitable, VR was established in addition to the coffee industry to provide economic stability to the region. Vale de Rosario raised the project equity with debt financing being covered by the Brazilian Infrastructure Development Bank (BNDES). VR has aimed to industrialise sugarcane processing whilst maintaining the regional land maintenance and rural traditions of the area. The mill was thus developed like a country factory, independent of worker towns or other dependencies typically found in large, modern agricultural farms. The VR bagasse cogeneration project aims to increase the surplus electricity sold to the grid by expanding VR’s electric power generation capacity, thus operating more rationally under current electric power sector circumstances that recognise the role of Independent Power Producers (IPPs). As the largest Brazilian sugar mill energy exporter, VR is expected to generate annual savings amounting to 650,000 tonnes of CO2 over the 2001-2008 period. The credits obtained from these emissions reductions will be attributed to the Swedish International Environmental Investment Programme of the Swedish Energy Agency In 2004, Vale do Rosario was awarded the Best CDM Project by a panel of experts at the Carbon Market Insights conference. Other Brazilian CDM Projects include:
• Santa Elisa Bagasse Cogeneration • Corona Bagasse Cogeneration Project • Equipav, Bagasse Cogeneration Project • Nova America, Bagasse Cogeneration Project • Alta Mogiana Bagasse Cogeneration Project • Moema Bagasse Cogeneration Project • Cantaduva Sugarcane Mill Expansion Project
COMPILED FROM ECONERGY BRAZIL & CIA ACUCAREIRA VALE DO ROSARIO (2003)136, POINT CARBON (2004)137, PLANETARK138, THE WINROCK FOUNDATION139 AND UNCTAD140.

55
56
WWWAAADDDEEE
111555 GGGrrreeeaaattt SSStttuuuaaarrrttt SSStttrrreeeeeettt
EEEdddiiinnnbbbuuurrrggghhh
EEEHHH333 777TTTPPP
SSScccoootttlllaaannnddd,,, UUUKKK
TTTeeelll::: +++444444 111333111 666222555 333333333333
FFFaaaxxx::: +++444444 111333111 666222555 333333333444
iiinnnfffooo@@@lllooocccaaalllpppooowwweeerrr...ooorrrggg
wwwwwwwww...lllooocccaaalllpppooowwweeerrr...ooorrrggg