igor bagayev electricity (in)efficiency in · pdf fileon the role played by firm...
TRANSCRIPT

355
REVIEW PAPERuDK:620.9:336]:005.336.1(1-773)"2008/2009"
date of Receipt: december 6, 2012
Introduction: Energy in transition
The energy efficiency is a crucial question for the next decade. Not only for environmental and health priorities but also for the competiveness of firms. The European Union fixed a set of energy objectives for 2020 among them is the reduction of energy consumption [12]. In this paper we will use the firm level statistics from new EU members and transition economies.
Transition economies were well known for large energy expenditures during the pre-transition period. In transition countries, the energy waste is a legacy of the planned economy. Those countries use over seven times more energy to produce each unit of GDP comparing to the Western Europe levels. Energy inefficient productive processes and obsolete technologies characterize their industrial sector. Insufficiently implemented market constraints and a lax institutional framework do not allow them to struggle against energy waste and misallocation. Furthermore, many of those countries have based their growth strategies on extremely energy-intensive sectors. This policy is inherited from the socialist planed economy, which favoured the development of heavy industry used to over-consume low-cost raw materials and energy [10].
Enterprises in central planned economies experienced large energy costs due partly to technology backwards but also low energy prices [11]. They benefit from large subsidies (soft budget constraint) and still today, in some sectors and some countries, do not consider as priority to reduce energy costs.
AbstractThe paper describes the main determinants of electricity efficiency / ineffi-ciency in 27 transition economies. We use the BEEPS enterprise survey done in 2008-2009 over 2400 enterprises. We provide a detailed analysis of the enterprise electricity intensity patterns. In particular, we shed light on the role played by firm characteristics and some key economic drivers, such as bad management and local financial constraint. We present an original analysis and findings on the effect of the poor access to electri-city supply on firm’s electricity costs.
Key words: Electricity costs, electricity efficiency, local electrici-ty constraint, financial constraint, institutional reforms, transi-tion economies
SažetakU ovom članku predstavljamo osnovne faktore energetske efikasnosti / neefikasnosti u 27 zemalja u tranziciji. Koristimo podatke iz ankete pre-duzeća BEEPS sprovedene u periodu od 2008-2009 u 2400 preduzeća. Ispitujemo energetsku efikasnost preduzeća kao udeo troška električne energije u ukupnim prihodima (energetska intenzivnost). Pružamo de-taljnu analizu obrasca troška električne energije. Naročito ukazujemo na ulogu karakteristika same firme i nekih ključnih ekonomskih parameta-ra kao što su kvalitet upravljanja i finansijsko ograničenje. Predstavljamo originalnu analizu i nalaze u vezi sa efektima lošeg snabdevanja na tro-šak električne energije u preduzeću.
Ključne reči: troškovi energije, energetska efikasnost, lokalne ba-rijere, finansijsko ograničenje, institucionalne reforme, tranzicio-ne ekonomije
JEL: Q4, P28
Igor Bagayev (uPEC, TEPP)
Boris Najman (uPEC, CES, CASE)
ELECTRICITY (IN)EFFICIENCY IN TRANSITION ECONOMIES: EVIDENCEFRoMAFIRM’SSuRVEy
Energetska (ne)efikasnost u tranzicionim ekonomijama, sa osvrtom na istraživanje sprovedeno u preduzećima
* Wewant to thank Richard Pomfret and Gael Raballand, for their firstremarks and encouragements, and Pierre Blanchard for his economet-ricadvices.Wepresentafirstversionofthepaperatthe InternationalConference on “Environment and Natural Resources Management in developing and Transition Economies” at CERdI and we are particularly grateful to the conference committee for inviting us.

EKONOMIKA PREDUZEĆA
356
If all of those countries reached West European levels of energy efficiency, the global energy consumption might decrease of 7%, despite a relatively small share of the production of this region in worldwide GDP [8]. But, the forecasted needs of transition countries are expected to increase their energy consumption by over 60 to 80% during the 20 next years [9].
There are three main barriers to energy efficiency in Eastern Europe and Former Soviet Union according to the 2010 World Bank report: energy prices, lack of information and inadequate financing. More precisely, the report shed light on the enormous energy saving potential of those countries and, besides, emphasizes the business obstacle representing by electricity supply.
In this paper, we use firm-level information from the Business Environment and Enterprise Performance Survey (BEEPS) database to focus on several electricity related issues in new EU new members, CIS and SEE (South Eastern Europe) countries. First, we shed light on some patterns of electric consumption in the macroeconomic and microeconomic levels, as well the electric reform changes in those countries. Secondly, and more generally, we explore the determinants of energy intensity of firms. Our empirical approach is inspired by the recent literature. As regarding the issues of this paper and the used dataset, the work of Bloom et al. [4] and Martin et al. [19] served as reference for the econometric specification. We want to assess the role played by many previously used firm characteristic variables. In particular, the firm size, the size of locality, the age, the ownership structure and other inputs are taken into account. We also expect to identify the key economic forces driving changes in electricity intensity. Specifically, this paper focuses on the impact of bad management, quality of the access to electric power and regional financial constraint.
The world development report 2013 underlines the importance of the financial access and the power shortage for the development of enterprise [30]. Financial constraint represents the most binding constraint on formal private sector businesses. And the electricity access is the second top constraint declared by enterprise managers.
We study the energy intensity, defined as energy costs over total sales. This measure is a standard manner for
any input in the production process. We use electricity as the main energy source because electricity has the same quality, apart the delivery, which is sometime problematic. We also use electricity, because it is not possible to stock electricity.
Our main findings are that poor access to local finance and local constraint on electricity increase the energy inefficiency of firms. The same factors also increase the share of electricity cost in total variable costs.
We also find out micro-level evidence that insufficiently reformed power sector leads to an inefficient use of electricity by firms.
The paper is organized in five parts: next section discusses the main contributions of the literature on energy efficiency on the firm level. We present in section 3 the main descriptive statistics for energy intensity, and in section 4 we discuss the methodology and we describe the database. In the section 5, we discuss in detail our econometric results and the last section conclude.
Literature review: Explaining the firm-level energy efficiency determinants
There is a wide energy economics literature dealing with the relationship between energy consumption and growth, the price elasticity of the energy demand, the relationship between energy consumption and the climate change, etc. Because it is the closest to our research question and the policy issues at stake, for our purpose, it seems enough to focus on the studies treating the firm level energy efficiency determinants and drivers.
A large strand of energy literature focuses on the factors influencing energy efficiency in microeconomic perspective. This approach is, from our point of view, the most interesting because it goes to the roots of the issue. We can subdivide this literature in two groups. Some papers focus only on energy intensity relation to firm characteristics, while others also try to provide an identification of barriers to improvement of energy efficiency. This is privilege way for our research and our paper is contributing to the discussion on the characteristics and barriers to improve firm energy efficiency.

I. Bagayev, B. Najman
357
Firm characteristics and energy intensityThere are several papers on firm level energy intensity determinants made on India. After Kumar [18], Sahu and Narayanan [22], [23] and Golder [15] have investigated this question. Departing from a reduced form model of the determinants of the energy intensity in industrial firms, they have applied multiple regression analysis to identify the main firm characteristics related to Indian manufacturing energy intensity. A very similar empirical strategy has been undertaken by Papadogonas et al. [21] to analyse the energy intensity of Greek manufacturing firms. The energy intensity variable is approximated by the fuel and power expanses over total sales ratio. The evidences about the main firm-level channels influencing energy inefficiency are summarized below.
The results strongly indicate that when firms are more capital intensive, they are more energy intensive. Capital intensity seems to be positively related with energy intensity, as well as expenditure on repairs and the age of firms. It can be argued that capital-intensive industries use more energy due to complementarities between both factors. Repairing implies older and worn plant and machinery, which are probably less energy efficient. And past and more energy intensive processes characterize aged firms.
The relationship between the size and the energy consumption is not obvious from those papers. Indeed, larger firms have an energy cost advantage only in the low energy consuming industries since Papadogonas et al. [21]. A negative relationship is found in Kumar [18] and Golder [15]. Bigger firms may benefit from economies of scale with decreasing returns in the use of energy, but this effect is not strongly related in those papers. We probably should take into account labour and capital factors in the estimation to shed light on this effect.
Foreign firms are more energy efficient in Kumar [18], Sahu et al. [22] and Golder [15] but not in Sahu et al. [23]. The impact of foreign ownership on energy consumption is not obvious regarding those results. It could depend on the country environmental regulation and energy prices. Moreover, it should be interesting to look at the impact of ownership structure on energy efficiency, as differences can emerge between private and public structures.
Drivers and barriers to energy efficiency improvementsUsing a different approach compare to the previous set of papers, other authors tries to analyse the most relevant drivers and barriers influencing the firm-level energy intensity. This is the core set of references for our paper.
Vanden et al. (2004) uses a structural model of a Cobb-Douglas cost function for the functional form of their estimation to identify drivers determining the decrease in energy intensity of 2500 medium and large-sized Chinese industrial firms. From a cost minimization program, they derive the firm-level factor demand for energy. They have found that changes in relative energy prices and R&D expenditures are the main contributors to the decline in firm-level energy intensity. To a lesser extent, shifts in output across industry, in ownership and region have contributed to the variation in energy intensity.
Morikawa [20] underlies a positive relationship between population density and the energy efficiency consumption in service enterprises. When the population density of the locality doubles, the author estimates a 12% decrease of firm-level energy intensity in services sector. He also emphasizes a negative link between capital and labour intensities and energy efficiency.
A large economic literature tries to understand the so-called “energy-efficiency gap”. This term refers to the difference between cost-effective energy efficient investments and the level of such investments actually implemented. Related academic papers disentangle the barriers explaining this gap between market failures, market barriers [7], [5] and, more recently, management practices [1], [19]. Market failures refer to all the situations violating the neoclassical assumptions (rationality, perfect information and no transaction costs). The market barriers to energy-efficient use concern three main problems: the low priority of energy issues, incomplete markets for energy efficient products and the capital market obstacles.
Barriers related to access to capital have been stressed as very critical. Energy efficiency technologies and investments need funds to be implemented. But, lack of capital limit funds to be devoted to energy efficiency measures, which are furthermore considered as low on priority list [7]. The paper of Trianni and Cagno [25] also highlights this kind

EKONOMIKA PREDUZEĆA
358
of evidence departing from an investigation of Italian small and medium sized firms. They find, after controlling for some firm’s characteristics, that access to finance is the more severe obstacle to energy efficiency investments. In over than 128 interviewed manufacturing enterprises, the lack of capital is perceived as the main constraint to energy efficiency measures.
Finally, recent empirical papers emphasize the crucial role of organizational structures and management best practices on enhancing firm-level energy efficiency. Using information about firm’s managerial quality and census data containing energy consumption expenditures of UK establishments, Bloom et al. [4] find that better-managed plants are significantly less energy intensive. This relationship seems to be related to the firm’s productivity. Better-managed firms adopt modern and energy-efficient measures, which increase their productivity. The authors estimate that an improvement from the bottom to the top quartile of their management variable is associated with a 17% increase in energy efficiency.
The paper of Martin et al. [19] provides further evidence about the negative link between management practices and energy intensity. They argue that better management is also related to the firm’s energy efficiency innovations (process and product). Moreover, they provide another finding about the role played by organizational structure. Firms where energy issues are devoted to the environmental manager (when such a function exists) have more climate-friendly management practices.
Bloom et al. [4] and Martin et al. [19] used two different proxies for energy intensity. Both energy cost over total sales and energy cost over total variable cost are used in their regressions. In order to ensure for the robustness of our results we also run our analysis with both variables.
To summarize, energy intensity is related to some firm characteristics, such as input composition, firm’s size and age, the ownership structure and the population density. Moreover, several economic factors such as financial constraints, management practices or other market barriers seem to be important drivers of firm-level energy efficiency. In order to explain the determinants of firms’ electricity intensity in Transition economies, we will try to assess those different effects in our regressions.
In the next section, we present the main country and sector features of electricity intensity across Transition countries.
Electricity intensity trends and power sector reform evolutions
In this section, we want to address an overall overview of the pattern of the electricity consumption, at the country and sector levels, and the evolutions of power sector reforms in our sample of countries. At first, we will look at the macro trends of electricity intensity. From 1990 to 2009, except for the group of South Eastern European countries, the overall electricity intensity has decreased for all the countries. But, since 2005 there is a slow-down of this decrease, while the overall level of consumption is still, by far, higher than the OECD average level. In a second part of this section, we look more closely to the pattern of electricity intensity inside the manufacturing sector. Finally, in the last sub-section we look at the evolution of power sector reform indicator since 1990. Regarding this indicator, the groups of CIS and South Eastern European countries perform less well than the EU new member countries.
Electricity intensity: A macro perspectiveWe present, first, the electricity intensity data from 1990 to 2009 (World Development Indicators, World Bank).
The figure 1 shows the results for three groups of countries over the region, EU new members, CIS and Mongolia group, and countries from South Eastern Europe. Detailed country figures for SEE and the list of countries are displayed in the appendixes (see tables 6 and 7, figure 5).
The evolutions in the figure 1 are pretty consistent with the global trends – convergence – in those economies. Comparing to the rest of the region, the EU new members group has the lower electricity intensity. But in recent years, since 2007, we can see a stabilization of the electricity intensity evolution. The EU new members are converging with one clear outlier: Bulgaria. Bulgaria, and, to a lesser extent, Romania and Czech Republic, have not improved so quickly their electricity efficiency. Possible

I. Bagayev, B. Najman
359
the same convergence as EU countries. The main reason is probably the wars in former Yugoslavia (1991-1999). Serbia is a clear example of war outliers. The war period had created unrecorded economy, electricity trade and enormous efficiency losses. In 2009, Serbia is still one of the less efficient countries in our sample, due to its
Figure 2: Electricity intensity (Electric power consumption in kWh per constant 2000 US$) by country, in 2009
0 2 4 6 8 Electricity intensity
TurkeySlovenia
PolandLatvia
CroatiaSlovak Republic
LithuaniaHungary
AzerbaijanRepublicCzech
RomaniaAlbaniaEstonia
ArmeniaTurkmenistan
BelarusBosnia and Herzegovina
GeorgiaMacedonia
BulgariaMoldova
UzbekistanKazakhstan
Russian FederationUkraine
SerbiaKyrgyz Republic
Tajikistan
OECD
Source:WDI,WorldBank,authors’calculations
Figure 1: Electricity intensity (Electric power consumption in Kwh per constant 2000 US$) during the period 1990-2009
0
1
2
3
4
Elec
tricit
y int
ensit
y
1990 1995 2000 2005 2010Year
CIS+Mongolia
EU new membersOECD
SEE
Notes:Tajikistan&KyrgyzRepublicareexcluded;FyRMacedonia&MontenegroaremissingduetodataunavailabilitySource:WDI,WorldBank,authors’calculations
reasons are the lack of foreign investment, but also the delay in implementing reforms in the electricity sector. An additional reason may be the development of the unrecorded economy, which is using electricity without declaring any output [17].
South East European countries did not experience

EKONOMIKA PREDUZEĆA
360
implication in three different conflicts between 1991and 1999 (see figure 5 in appendixes).
Finally, CIS countries are by far the less efficient countries among transition economies. As in SEE, the countries with an experience of war have the worse results (i.e. Tajikistan). But the first period of transition (1990-96) was also, for those economies, a shock in terms of electricity intensity. Most of the countries have only improved their situation after 1995. It can be noted that there are two outliers – Tajikistan and the Kyrgyz Republic – with electricity intensity up to nine times higher than some CIS countries.
Overall, we observe for all the groups a slow-down or a little increase (for SSE) of the electricity intensity evolution, whereas all the countries of the region are still far from the average level of electricity consumption intensity of OECD countries. We can also notice a break in 1994-1995 of the evolution of electricity intensity and economic growth in the whole region.
The figure 2 confirms the overall high level of electricity consumption in the CEEC, CIS and SEE countries. In 2009, the less electricity intensive country (Slovenia), has still consumed more electricity in order to produce one dollar of production, compare to the average of OECD countries. Looking carefully at the figure, it may be noted that non EU countries have more electricity oriented economies and, there is no doubt that those countries, especially CIS and SEE countries, carry a high level of waste and inefficiency in their use of electric power.
The electricity intensity in the industrial sectorIn this section we focus only on the different sub-sectors composing manufacturing activity of those countries. In order to compute our sectoral electricity intensities, we use both data of sectoral electricity consumption from IEA (International Energy Agency) and sectoral value-added information from UNIDO (United Nations Industrial Development Organization). The IEA and UNIDO datasets use different industrial classification standards and different levels of disaggregation, 2-digit ISIC rev.2 and 4-digit ISIC rev.4 respectively. We should therefore rearrange both databases in order to have a valid measure of industrial electricity intensity.
Table 1 provides the ranking of sectoral electricity intensities. Scores are averaged across the countries and over the period.
We can see that four sectors are on the top of the distribution: non-specified industry, chemicals, manufacture of basic metals and non-metallic minerals. The “non-specified industry” is an aggregate of several sub-sectors, which can be particularly electricity intensive such as rubber and plastic products or recycling industries. Overall, this ranking is in line with some evidence highlighted by UNIDO [26] about manufacturing energy intensity. Indeed, the four sectors cited below are among the most energy intensive sectors in the whole manufacturing activity. Such inter-sectoral variations call to add industry dummies in our regressions.
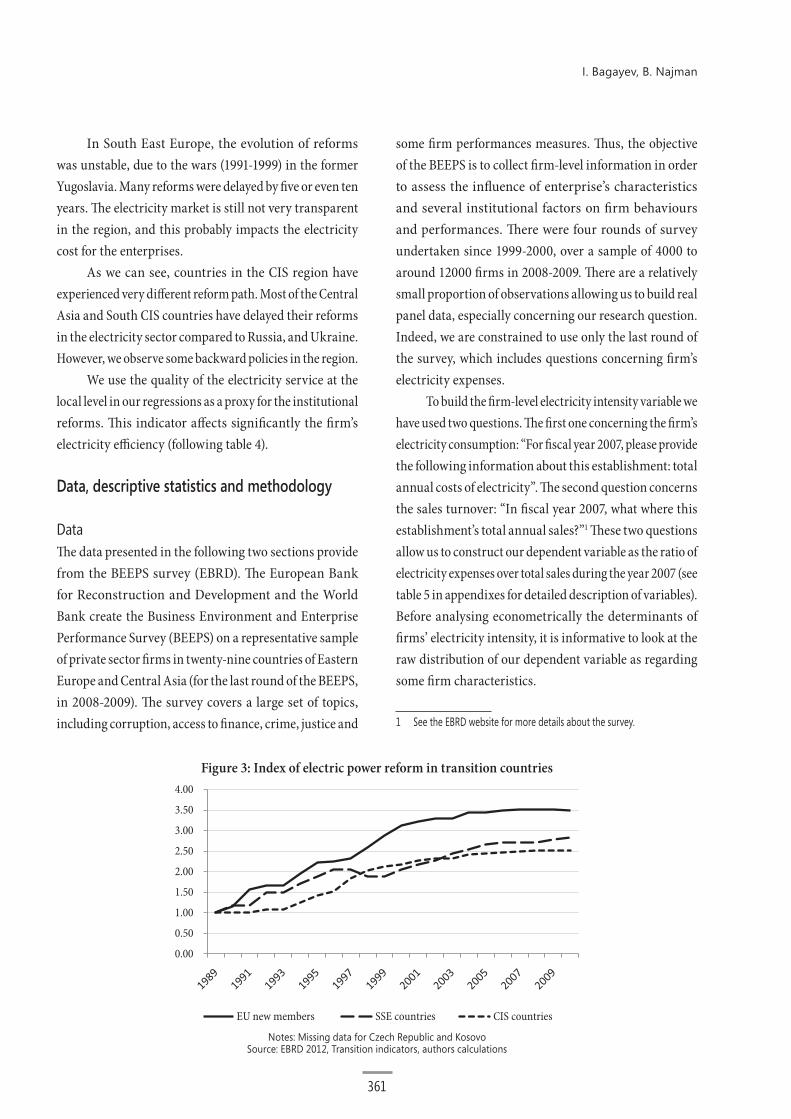
Institutional and reform changes in transition economiesFigure 3 presents the evolution of electric power reforms in transition economies. In each country, the electric power reform index assesses the independence of the electricity regulator, the tariff setting rules and the market liberalization of the sector. The EU countries (see table 7 in appendix for the list of countries) do have the best results mainly due to the acquis communautaire regulations. However some countries may experience a reverse reform process, for example Hungary or Estonia. The institutional framework is crucial for the energy pricing and the quality of the services.
Table 1: Average electricity intensity (electric power consumption in kWh per constant 2005 US$ of value
added) by sector, over the period 2004-2007UNIDO-IEA mix (ISIC rev.4 &
ISIC rev.2)Average score
Non-specified industry 9,02
Chemicals 7,11
Manufacture of basic metals 6,11
Non metallic minerals 5,82
Machinery 1,88
Paper, pulp and print 1,81
Wood and wood products 0,94
Food and Tobacco 0,79
Transport equipment 0,59
Textile and leather 0,50
Source:IEA,unido,author’scalculations
I. Bagayev, B. Najman
361
In South East Europe, the evolution of reforms was unstable, due to the wars (1991-1999) in the former Yugoslavia. Many reforms were delayed by five or even ten years. The electricity market is still not very transparent in the region, and this probably impacts the electricity cost for the enterprises.
As we can see, countries in the CIS region have experienced very different reform path. Most of the Central Asia and South CIS countries have delayed their reforms in the electricity sector compared to Russia, and Ukraine. However, we observe some backward policies in the region.
We use the quality of the electricity service at the local level in our regressions as a proxy for the institutional reforms. This indicator affects significantly the firm’s electricity efficiency (following table 4).
Data, descriptive statistics and methodology
DataThe data presented in the following two sections provide from the BEEPS survey (EBRD). The European Bank for Reconstruction and Development and the World Bank create the Business Environment and Enterprise Performance Survey (BEEPS) on a representative sample of private sector firms in twenty-nine countries of Eastern Europe and Central Asia (for the last round of the BEEPS, in 2008-2009). The survey covers a large set of topics, including corruption, access to finance, crime, justice and
some firm performances measures. Thus, the objective of the BEEPS is to collect firm-level information in order to assess the influence of enterprise’s characteristics and several institutional factors on firm behaviours and performances. There were four rounds of survey undertaken since 1999-2000, over a sample of 4000 to around 12000 firms in 2008-2009. There are a relatively small proportion of observations allowing us to build real panel data, especially concerning our research question. Indeed, we are constrained to use only the last round of the survey, which includes questions concerning firm’s electricity expenses.
To build the firm-level electricity intensity variable we have used two questions. The first one concerning the firm’s electricity consumption: “For fiscal year 2007, please provide the following information about this establishment: total annual costs of electricity”. The second question concerns the sales turnover: “In fiscal year 2007, what where this establishment’s total annual sales?”1 These two questions allow us to construct our dependent variable as the ratio of electricity expenses over total sales during the year 2007 (see table 5 in appendixes for detailed description of variables). Before analysing econometrically the determinants of firms’ electricity intensity, it is informative to look at the raw distribution of our dependent variable as regarding some firm characteristics.
1 See the EBRd website for more details about the survey.
Figure 3: Index of electric power reform in transition countries
0.00
0.50
1.00
1.50
2.00
2.50
3.00
3.50
4.00
EU new members SSE countries CIS countries
Notes: Missing data for Czech Republic and kosovoSource: EBRd 2012, Transition indicators, authors calculations

EKONOMIKA PREDUZEĆA
362
Descriptive statisticsFigure 4 shows the average distribution of firm electricity intensities conditional to the size of locality, the size and the age of the firm and the way the firm was established.
As we can see in small cities, the use of electricity is rather inefficient compare to big cities. Transition appears to be more “succesful” in large cities, where also probably technologies and electric sector are more developped.
We can also remark, that private de novo firms are on average by far the more electricity efficient. As expected state-owned and formerly state-owned firms are the more electricity intensive, due probably to a weaken budget constraint and remaining consumption behaviors from the planned economy system.
Following the figure, the enterprise’s age affects efficiency in two different ways. We observe that the
Figure 4: Firm characteristics and average electricity intensity from BEEPS (2009) data
.02
.03
.04
.05
.06
capita
l city
city w
ith populat
ion over 1 m
illion
over 250,000 to
1million
50,000 to 250,000
less th
an 50,000 populat
ion
Locality size
.02
.03
.04
.05
.06
originally
private
, from tim
e of st
art up
private
subsid
iary o
f a form
erly sta
te-owned �rm
joint venture
with fo
reign
partner(
s)
privati
zation of a
state-
owned �rm
state-
owned �rm other
Way the �rm was established
.02
.03
.04
.05
.06
<=5 years
>5 and <=10 ye
ars
>10 and <=15 ye
ars
>15 and <=20 ye
ars
>20 years
Firm age
.02
.03
.04
.05
.06
less th
an 5
small
>=5 and <=19
medium >=20 and <=99
large
>=100
Firm size
Source:BEEPSsurvey,2009,EBRD,authors’calculations

I. Bagayev, B. Najman
363
more energy intensive firms are at the extremes of the age distribution. Enterprises created before the USSR collapse (more than twenty years ago) are more energy intensive maybe due to their overall specialization in energy intensive sectors, and also because of inherited obsolete processes and technologies. In the other side, the younger firms are less energy efficient, probably because of a scale effect accompanying a smaller size on average of younger companies. Between those two extremes, firms seem to be more energy efficient without real gaps across the groups.
Finally the energy intensity is negatively correlated with firms’ size. Large enterprises tend to be more efficient in their use of energy. Beneffiting of economies of scale, large firms are more able to implement new technologies and increase their overall productivity.
A simple empirical modelTo investigate the determinants of firms’ electricity intensity and assess specific effects of power sector and financial constraints, we consider the following econometrical specification:electricity intensityijc= β0+β1 yijc+β2 lijc+β3 kijc+δZijc+Dj+Dc+uijc (1)where electricity intensity = electricity expenditure over total sales, Y = total sales, L = labour (number of employees), K = capital (net book value of machinery, vehicles, equipment, land and buildings). Lower case letters indicate natural logarithms, for example y = ln(Y). Z is a vector of control variables that could affect electricity intensity, i.e. a set of firms’ characteristics (age, share of employees with university degree, ratio of current annual sales to annual sales three years ago, way the firm was established) and a proxy for population density (dummy variable for the size of the locality). The estimation also includes 2-digit industry dummies and country dummies respectively indexed by j and c. The detailed description of variables is given in appendixes.
There is no selection bias due to the fact that almost no enterprise declares zero electricity costs (1,7 % answered they have zero electricity costs).
Our specification is based on the approach adopted in the energy related literature [4], [19],[20]. Nevertheless, from our electricity cost share equation might arise a number
of concerns2. We repeat our regressions using different specifications and it does not change fundamentally our main findings3.
In the following section, we present our first regression’s results and we discuss and comments them.
Regressions results (see tables 2 to 4)4
We organise the econometric analysis in the following way: first we present a simple specification with and without a management variable, then we include the local financial obstacle and finally we include the constraint of electricity access at the local level.
Preliminary regression’s results (see table 2)We have more than 2300 observations on the enterprise level. The basic results are displayed in table 2. We can control for sectors and countries specific effects. We present the results without dummies for countries and sectors (column 1) and controlling for industry dummies (column 2), country and industry dummies (columns 3 and 4). Except for employment size the results are similar for the electricity intensity and the share of electricity cost.
We found out that the enterprise number of employees does significantly affect the electricity intensity. When we take into account for country and sector fixed effects the number of employees is significant and increases the inefficiency. Furthermore, the amount of capital tends
2 Because in theBEEPSdatasetwedonothavefirm specificprices, ourdependent variable captures both variations in quantities and prices. Electricityintensivefirmsmightbeabletochargehigherpricesfortheirproductsandthusreducingtheelectricitycostshare,asexpressedabove.In order to take into account such a mark-up effect, we use an alternative measureofelectricityintensity,theelectricityexpendituresovervariablecosts (total cost of labour, intermediates, fuel, power and other utilities) as the dependent variable. (see our working paper for the detail results).
Second, to ensure that our results are not driven by the choice of variablesusedinourbasicspecificationwerepeatourregressionswithanalternativespecification.Themain justification forusingthecostshareequation(1)isthatsuchaspecificationisinlinewiththe usual translog factor demand equation. But, we also try to test ourresultswithanothereconometrical specification, includingaproxy forwageand investmentmeasures insteadof labourandcapital variables.
3 Results are available in the working paper version.4 All the variables are in local currency unit, when we use a common cur-
rency the results remains very similar. Country dummies capture almost all the nominal effects.

EKONOMIKA PREDUZEĆA
364
to increase the inefficiency. Capital and labour seems not to be used in order to produce at lower energy costs. It seems that more labour and capital intensive firms are more electricity intensive. Similar relationships were fund by Bloom et al. [4] and Morikawa [20] between energy intensity, capital and labour variables. Those results also echo the empirical evidence of Berndt and Wood [3] among others. They found that energy and capital are complementary and that energy and labour are weakly
separable. This last point implies that more employment also needs more energy consumption5.
The age of the firm does not have any statistical significance; there is probably a non- linear effect of age on the energy efficiency (see figure 4 in the previous section).
5 Therehasbeenextensiveresearchonthesubstitutabilityorcomplemen-tarity between energy and other inputs. unfortunately, our database limitationsdonotallowustostronglyrelateourfindingstothisliterature.Indeed, we are unable to deal properly with the issue of elasticity be-tween energy and other production factors because we lack input prices information.
Table 2: Dependent variable: log electricity intensity, i.e. log electricity cost over total sales (OLS)
Log elec. cost over total sales (1) (2) (3) (4)Log total sales -0.288 -0.284 -0.661 -0.662
(11.89)*** (12.23)*** (25.15)*** (24.27)***Log number of employees 0.006 0.005 0.503 0.490
(0.18) (0.15) (13.10)*** (12.00)***Log capital 0.207 0.198 0.122 0.121
(9.22)*** (9.13)*** (6.12)*** (5.90)***Firm age -0.001 -0.001 0.001 0.001
(0.87) (0.66) (0.77) (0.46)Univ. level in total employment -0.002 -0.001 -0.002 -0.002
(1.00) (0.58) (0.98) (0.96)Log enterprise performance -0.163 -0.169 -0.075 -0.066
(4.73)*** (4.88)*** (2.64)*** (2.31)**Management quality certification 0.096
(1.60)Way the firm was established (ref=state owned or privatization of a state owned)Originally private, from start up -0.558 -0.549 -0.341 -0.368
(7.05)*** (7.26)*** (5.15)*** (5.53)***Priv. subsidiary of a state-owned firm -0.352 -0.303 -0.246 -0.227
(1.72)* (1.51) (1.26) (1.14)Joint venture with foreign partner(s) -0.287 -0.257 -0.079 -0.177
(1.62) (1.51) (0.49) (1.06)Other type of establishment -0.083 -0.123 -0.225 -0.260
(0.41) (0.60) (1.06) (1.22)Size of locality dummy (ref=capital city)Over 1 million – other than capital -0.264 -0.298 0.056 0.032
(2.33)** (2.66)*** (0.54) (0.31)Over 250.000 to 1 million 0.034 0.024 -0.078 -0.099
(0.32) (0.23) (0.79) (0.98)50.000 to 250.000 0.106 0.087 0.065 0.046
(1.23) (1.08) (0.87) (0.59)Less than 50.000 0.085 0.093 0.025 0.014
(0.96) (1.05) (0.33) (0.17)Constant -2.207 -2.384 4.840 5.220
(9.36)*** (10.38)*** (8.22)*** (9.95)***With industry
dummiesWith country and industry dummies
With country and industry dummies
R2 0.19 0.20 0.36 0.36N 2,344 2,344 2,344 2,261
Robust standard errors clustered by country-industry in brackets* p<0.1; ** p<0.05; *** p<0.01

I. Bagayev, B. Najman
365
A more optimistic result is provided by the sales: larger sales tend to increase the efficiency. We are probably capturing some economies of scale. In addition, the performance of the firm in terms of actual sales compared to three years ago seems to reduce the inefficiency. A possible explanation is that firm performance decreases the electricity intensity through its effect on total sales.
Originally, private firms (from start up) are less spending on electricity per unit sold. This finding is strong, significant and stable over all of our estimations. This result echoes previous literature treating of the effect of de novo privatization on different variables of firm’s performances like growth, productivity, innovation, etc. [13].
Our paper contributes to the discussion on the management quality and allocation of resources; we do not find any significant effect of the management on the electricity efficiency neither on the share of electricity cost. This result might differ from the previous studies of Bloom et al. [4] and Martin et al. [19] because of our proxy of management quality6.
All our results remain stable with or without Russia; this robustness check is important since Russia is a much larger country compared to others in our sample7.
Local indicators of financial and electricity constraints (see tables 3 and 4)Following a recent World Bank report [30], finance and electricity are among the most severe obstacles faced by firms. In this section, we try to test whether financial and electric local constraints are related to firms’ ability to use electricity efficiently.
The role of local financial constraint on electricity efficiencyOne of the main obstacles to energy efficient use is the financial constraint facing by firms [29]. The quality of the financial intermediation could be a prerequisite to enhance energy intensity. Indeed, standard financial theory emphasizes two main advantages of efficient
6 The variable of management is a dummy equal to 1 if the establishment hasaninternationally-recognizedqualitycertification(likeISo9000or14000forexample).
7 Results are available upon request to the authors.
financial markets. On the one hand, the financial sector development allows slacking firms’ budget constraints and on the other, it plays a role of screening and monitoring efficient investment projects.
Hence we may have several potential drivers explaining a positive impact of financial markets on energy efficiency. An easier access to financial system may allow to finance new and energy saving technology i.e. to replace obsolete machinery or to invest in a new one. In a long run perspective, if firms perform better, efficient financial markets may be able to select and finance energy saving projects and favour the less energy intensive enterprises. This is crucial, especially in countries where energy supply is a major issue.
The BEEPS dataset contains information about how far access to finance represents a binding constraint for a firm. Unfortunately, it is not an exogenous variable indicating the financial development environment facing by firms.
To deal with this issue, we use the method developed by Guiso et al. [16]. Distinguishing differences in financial development between different regions of Italy, their paper highlights the positive impact of the development of local financial markets on several microeconomic variables (competition, entry of new firms, growth). This approach estimates regional financial development indicators by adding regional dummies in individual subjective assessments of financial obstacle in order to obtain regional scores. Ranking those regional dummies allows having a good proxy for regional financial development. This method has been used by Villegas-Sanchez [28] to highlight the role of local financial markets in externalities conveyed by the FDI.
Following this literature, we have estimated, from the base of BEEPS 2002, 2005 and 2009, a regional financial constraint indicator. To do this, we calculated, with a probit model, the probability that access to finance is a binding constraint for a company8. The econometric specification of the firm-level determinants of financing obstacles is based on the paper of Beck et al. [2].
There are several advantages of using, in our regressions, a regional indicator of financial development, instead of the direct answer. First, companies whose report may be constrained by access to finance are more
8 Results are available in the working paper version

EKONOMIKA PREDUZEĆA
366
likely to need financing. This is the case for the most growing firms. And we can expect those companies to be more energy efficient. This implies a downward bias of the impact of access to financial markets on electricity consumption, the less electricity intensive firms declaring to be constrained by external funding needs. On the other
hand, electricity intensive firms might plausibly be less productive overall. If the financial market is able to detect firms’ productivity levels, we can expect the less electricity efficient firms to get a lower access to external finance. A difficult access to financing is also more crucial for small firms and younger firms. So, using the direct measure of access to financial markets implies restricting the analysis on small and young businesses, which are more energy intensive. The direct approach might therefore have an important endogeneity bias (downward and upward) with our dependant variable. By cons, information reported by firms is still a valid measure of the variation of inter-regional access to finance. In addition, the database used to construct regional indicators is much larger (there are almost three times more observations), which enhances the quality of the estimated coefficients.
Furthermore, to check for the robustness of our local financial indicator, we rebuilt the same variable but using exclusively the BEEPS of 2002 and 2005 rounds. As there is a very little number of overlapping firms in the different rounds of this survey, this allows us to compute an indicator based on completely different set of observations and in a previous time span.
Main results (see table 3)The main results of the impact of local financial
constraint on firm’s electricity intensity are given in the table 3.
Our results are robust if we compare column 1 and columns 2 and 3. We find similar coefficient even when we introduce the financial constraint estimated indicator. When the local access to finance is more difficult, the energy intensity of firms is significantly higher (column 2). To test the robustness of our financial indicator, we use an alternative variable of local financial constraint (local financial constraint (t-1)), measured exclusively from the previous rounds of the BEEPS9 (column 3). By using a local financial indicator over a previous period, we can check for some endogeneity problem that could arise in column 2. Furthermore, the local financial constraint (t-1) avoids the potential effect of the global financial crisis of 2007-2008. Therefore, this second variable of local
9 Thefirststepestimationisnotreportedhere.Resultsareavailableuponrequest to the authors.
Table 3: Dependent variable: log electricity intensity, with local financial constraint indicators (OLS)
Log elec. cost over total sales (1) (2) (3)Log total sales -0.284 -0.308 -0.342
(12.23)*** (14.91)*** (14.46)***Log number of employees 0.005 0.027 0.056
(0.15) (0.95) (1.66)*Log capital 0.198 0.203 0.217
(9.13)*** (10.00)*** (9.29)***Firm age -0.001 -0.001 -0.001
(0.66) (0.76) (0.75)Univ. level in total employment -0.001 -0.002 -0.004
(0.58) (1.45) (2.00)**Log enterprise performance -0.169 -0.166 -0.149
(4.88)*** (5.07)*** (4.03)***Local financial constraint 0.431
(3.80)***Local financial constraint (t-1) 0.563(from BEEPS 2002 & 2005 exclusively) (3.43)***Way the firm was established (ref=state owned or privatization of a state owned)Originally private, from start up -0.549 -0.514 -0.471
(7.26)*** (6.57)*** (5.07)***Priv. subsidiary of a state-owned firm -0.303 -0.343 -0.197
(1.51) (1.53) (0.71)Joint venture with foreign partner(s) -0.257 -0.139 -0.009
(1.51) (0.74) (0.04)Other type of establishment -0.123 -0.167 -0.307
(0.60) (0.90) (1.25)Size of locality dummy (ref=capital city)Over 1 million – other than capital -0.298 -0.172 0.231
(2.66)*** (1.73)* (1.55)Over 250.000 to 1 million 0.024 0.050 -0.052
(0.23) (0.50) (0.41)50.000 to 250.000 0.087 0.171 0.094
(1.08) (1.91)* (0.94)Less than 50.000 0.093 0.148 0.018
(1.05) (1.65)* (0.18)Constant -2.384 -2.455 -2.188
(10.38)*** (11.30)*** (8.86)***With
industry dummies
With industry dummies
With industry dummies
R2 0.20 0.22 0.25N 2,344 2,081 1,401
Bootstrapped standard errors in brackets (non-parametric bootstrap with 500 replications)
* p<0.1; ** p<0.05; *** p<0.01
I. Bagayev, B. Najman
367
financial constraint also indicates a 1% significant effect. It is supporting our assumption that financial access is crucial for firm investment in energy savings.
The size of the estimated effect is substantial. An improving of the financial constraint indicator from the top quartile (the more financially constrained) to the bottom quartile (the less financially constrained) is associated with a 17.3% increase in electricity efficiency10. The magnitude is even larger in column 3: increasing the financial constraint (t-1) variable from the 25th to 75th percentile is associated with a 20.8% reduction of electricity intensity. Our results have some policy implications: if transition countries want to improve the firm’s energy efficiency, they need to facilitate the access to finance for new investment and to promote high labour productivity activities. The relation between banks and firms is essential for the improvement of energy uses by firms.
The electricity supply constraint at the local level and firm-level electricity intensityThe energy intensity related literature [6] highlights the role played by the electricity sector in maintaining high levels of energy consumption in Transition economies. In the same way, the EBRD [11] special report argues that power sector underdevelopment is one of the main drivers explaining electricity inefficiency in this region, especially in former Soviet Union countries. Indeed, insufficient reforms and underinvestment in the electricity sector could lead to the deterioration of the electric power supply. In this case, a low electricity price goes hand in hand with low quality of the provided service, involving disruptions, inadequate quality and bureaucratic disturbances.
In this last sub-section, we try to test whether firms facing higher regional power sector underdevelopment experience higher electricity intensity –or inefficiency. To deal with this issue, we have decided to keep the same methodological approach as previously. Using in our estimation the direct response of the firms’ constraint can lead to some endogeneity concerns, as electricity intensive firms might feel more constrained when the
10 Theestimatedeffectisgivenby:[exp(0.371*0.431)-1]*100=17.3%,where0.371istheinterquartilerangeofthelocalfinancialconstraintindicatorand0.431 isthecoefficientofthe localfinancialconstraint indicator intable 3, column 2.
supply of their main input is problematic. In order to take into account for the quality of electricity supply faced by firms, we compute a regional indicator reflecting local electric power underdevelopment. This approach seems to be particularly fitting for the structure of the electricity sector. Indeed, inside each country, we can expect a large variation of the quality of the electricity service depending of the local development of the electricity market and infrastructures.
To catch up these regional effects, we computed the probability that electricity is a major or very severe obstacle to the current operations of a firm11. As previously, we used region dummies to compute our indicator of local electricity access. The increase of the local electricity constraint variable indicates a deteriorating development of the electricity sector at the local level.
Main results (see table 4, columns 1 and 2)In table 4, we present the results of the regression,
where we include the quality of the electricity service at the local level. Our main finding is that poor access to electricity supply tends to increase the inefficiency at the enterprise level (column 2). All the other results in table 4 are stable compared to the results from the basic specification (column 1).
The quality of the electricity service at the local level is for us a good proxy of the institutional reforms in the electricity sector. Hence, our results provide an instructive and original finding about the firm’s behaviour in front of electric power local access. Moving from the 25th to the 75th percentile of the electricity sector constraint distribution predicts an 11.5 percentage points increase of the firm-level electricity intensity12.
Country power sector reforms and electricity intensity (see table 4 columns 3 and 4)
The negative effect of local electricity sector underdevelopment on electricity intensity should be related to the level of institutional reforms undertaken in the power sector. Indeed, insufficiently reformed power sector is characterized by tariff below the cost
11 Results are available in the working paper version.12 The estimated effect is given by: [exp(0.217*0.497)-1]*100 = 11.5%,
where 0.217 is the interquartile range of the local financial constraintindicator and 0.497 is the coefficient of the local electricity constraintindicator in table 4, column 2.

EKONOMIKA PREDUZEĆA
368
recovery, inadequate supply and bad infrastructures. Thus, insufficient reforms (in the power sector) will lead at the same time to firms’ electricity over-consumption and a bad quality of the provided service. We expect to find a negative impact of local power sector underdevelopment on electricity efficiency only in low reformed countries. For this purpose we split our sample according to the level of undertaken power reforms in 2008 as indicated by the EBRD reform indicator.
The threshold level is 3: insufficiently reformed = [2;3] and “well” reformed = ]3;4[. The choice of this threshold is based on two different reasons. We believe that an insufficiently reformed power sector corresponds to an indicator equal or inferior to 313. It may be noted
13 The power sector is still a state-owned monopoly, the rules for cost-re-flectivetariffsettingarenotformulatedorimplementedandthereisnoregulator, at least an independent one.
Table 4: Dependent variable: log electricity intensity, with local electricity constraint indicator (OLS), countries with well/insufficiently reformed power sector
Log elec. cost over total sales (1) (2) (3) (4)Country sample Overall Overall Well reformed Insufficiently reformedLog total sales -0.284 -0.310 -0.315 -0.306
(12.23)*** (14.59)*** (10.63)*** (10.05)***Log number of employees 0.005 0.030 0.017 0.076
(0.15) (1.05) (0.43) (1.77)*Log capital 0.198 0.203 0.201 0.194
(9.13)*** (9.65)*** (7.17)*** (6.44)***Firm age -0.001 -0.001 -0.001 0.001
(0.66) (0.61) (0.48) (0.44)Univ. level in total employment -0.001 -0.002 -0.000 -0.006
(0.58) (1.50) (0.14) (2.08)**Log enterprise performance -0.169 -0.167 -0.176 -0.151
(4.88)*** (4.88)*** (3.94)*** (3.00)***Local electricity constraint 0.497 0.064 1.072
(2.54)** (0.28) (3.05)***Way the firm was established (ref=state owned or privatization of a state owned)Originally private, from start up -0.549 -0.523 -0.681 -0.283
(7.26)*** (6.42)*** (6.23)*** (2.38)**Priv. subsidiary of a state-owned firm -0.303 -0.356 -0.239 -0.345
(1.51) (1.50) (0.46) (1.36)Joint venture with foreign partner(s) -0.257 -0.163 -0.510 0.055
(1.51) (0.88) (2.06)** (0.22)Other type of establishment -0.123 -0.109 -0.115 -0.206
(0.60) (0.56) (0.40) (0.65)Size of locality dummy (ref=capital city)Over 1 million – other than capital -0.298 -0.240 -0.139 0.122
(2.66)*** (2.44)** (1.15) (0.58)Over 250.000 to 1 million 0.024 0.063 0.221 0.005
(0.23) (0.63) (1.67)* (0.03)50.000 to 250.000 0.087 0.168 0.287 0.121
(1.08) (1.81)* (2.33)** (0.92)Less than 50.000 0.093 0.140 0.419 -0.084
(1.05) (1.66)* (3.38)*** (0.67)Constant -2.384 -2.382 -2.113 -2.757
(10.38)*** (10.23)*** (6.58)*** (7.82)***With industry
dummiesWith industry
dummiesWith industry
dummiesWith industry
dummiesR2 0.20 0.22 0.22 0.22N 2,344 2,108 1,244 864
Bootstrapped standard errors in brackets (non-parametric bootstrap with 500 replications)* p<0.1; ** p<0.05; *** p<0.01

I. Bagayev, B. Najman
369
that almost all the new EU members are comprised in the “well” reformed group, except Slovenia14.
When we divide the sample according to the quality of the reforms in the electricity sector, we find very interesting and convincing results (columns 3). If one is in the group of countries without doing reforms in the power sector (column 4), the local constraint to access electricity is increasing the electricity intensity. The effect of the local constraint is not significant anymore for the group of countries implementing the power sector reforms (column 3). This provides micro-level evidence that insufficiently reformed power sector leads to an inefficient use of electricity by firms.
Conclusions and policy recommendations
Our main findings are that good access to local finance and local constraint on electricity increase the energy inefficiency of firms. The same factors also increase the share of electricity cost in total variable costs.
The financial development at the local level seems to be a crucial driver of electricity efficiency improvement. We estimated a potential reduction of one-fifth of firms’ electricity intensity associated with an improvement from the 25th percentile to 75th percentile of the distribution of the local financial access variable.
We also find out micro-level evidence that insufficiently reformed power sector leads to an inefficient use of electricity by firms.
Transition countries also need to improve the access to electricity at the local level, especially when the power sector is not reformed, or when the local firms are more than twenty years old.
Our policy recommendations are in line with the World Bank reports of 2012 and 2010 and the EBRD report 2011. We underline the importance of reforms in the power sector especially the problems of competition [11] and shortages in power supply. We also link the energy efficiency with the access to bank credits and good quality of financial intermediation.
14 We also try to split our sample between countries belonging to the Eu and countries outside the Eu, but this last partition provides less robust results.
References1. Backlund, S., Thollander P., Palm J., Ottosson M. (2012),
“Extendingtheenergyefficiencygap”,Energy Policy, 51, 392-396.2. Beck, T., demirgüc-kunt, A., Laeven, L., Maksimovic, V.
(2004),“Thedeterminantsoffinancingobstacles”,Journal of International Money and Finance, 25, no. 6 (2006), 932-952.
3. Berndt, E. R., Wood, d. O. (1975), “Technology, prices, and the derived demand for energy”, The Review of Economics and Statistics, 57(3), 259-268.
4. Bloom, N., Genakos, C., Martin, R., Sadun, R. (2010), “Modern Management: Good for the Environment or Just Hot Air?”, The Economic Journal, 120 (544), 551-572.
5. Brown, M. A. (2001), “Market failures and barriers as a basis for clean energy policies”, Energy Policy, Vol. 29, No.14, 1197-1207.
6. Cornillie, J., Fankhauser, S. (2004), “The energy intensity of transition countries”, Energy Economics,Vol.26,No.3,283–295.
7. DeCanio,S.J.(1998),“Theefficiencyparadox:bureaucraticandorganizationalbarrierstoprofitableenergy-savinginvestment”, Energy Policy, 26 (5), April, 441-454.
8. Energy Information Administration. (2011), World Energy Outlook 2011, Washington, EIA.
9. European Bank for Reconstruction and development. (2006), Energy Policy Operations 2006, London, EBRd.
10. European Bank for Reconstruction and development. (2009), Transition report 2009: transition in crisis, London, EBRd.
11. European Bank for Reconstruction and development. (2011), Special report on Climate Change: The Low Carbon Transition, London, EBRd.
12. Eurostat.(2012),“Europe2020Strategy–towardsasmarter,greener and more inclusive Eu economy?”, Statistic at Focus, Issue number 39/2012, available at http://epp.eurostat.ec.europa.eu/cache/ITY_OFFPuB/kS-SF-12-039/EN/kS-SF-12-039-EN.PdF.
13. Fischer, S., Sahay, R. (2000), “The transition economies after ten years”, NBER Working Paper, 7664, Cambridge, National Bureau of Economic Research.
14. Gelb, A., Ramachandran, V., Shah, M. k., Turner, G. (2008), “What Matters to African Firms? The Relevance of Perceptions data.”, World Bank Policy Research Working Paper Series. The World Bank.
15. Golder, B. (2011), “Energy Intensity of Indian Manufacturing Firms Effect of Energy Prices, Technology and Firm Characteristics”, Science Technology & Society, Vol.16, No. 3, 351-372.
16. Guiso,L.,Sapienza,P.,Zingales,L.(2004),“Doeslocalfinancialdevelopment matter?”, The Quarterly Journal of Economics, Vol 119, No. 3, 929-969.
17. Kaufmann,D.,Kaliberda,A.(1996),“Integratingtheunofficialeconomy into the dynamics of post-socialist economies: A framework of analysis and evidence”, World Bank Policy Research Working Paper No. 1691, available at http://papers.ssrn.com/sol3/papers.cfm?abstract_id=620508.
18. Kumar,A.(2003),“Energyintensity:aquantitativeexplorationfor Indian manufacturing”, IGIDR Working Paper No. 152, Indira GandhiInstituteofDevelopmentResearch(IGIDR)–Economics.

EKONOMIKA PREDUZEĆA
370
19. Martin,R.,Muûls,M.,dePreux,L.B.,Wagner,u.J. (2012),“Anatomyofaparadox:Managementpractices,organizationalstructureandenergyefficiency”,Journal of Environmental Economics and Management, 63, 2, March, 208-223.
20. Morikawa,M.(2012),“Populationdensityandefficiencyinenergyconsumption: An empirical analysis of service establishments”, Energy Economics, 34, 5 (September), 1617-1622.
21. Papadogonas, T., Mylonakis, J., Georgopoulos, d. (2007), “EnergyconsumptionandfirmcharacteristicsintheHellenicmanufacturing sector”, International Journal of Energy Technology and Policy, Vol. 5, No. 1, 89-96.
22. Sahu, S. k., Narayanan, k. (2009), “determinants of Energy Intensity: A Preliminary Investigation of Indian Manufacturing”, MPRA Paper 16606, university Library of Munich.
23. Sahu, S. k., Narayanan, k. (2011), “determinants of Energy Intensity in Indian Manufacturing Industries: A Firm Level Analysis”, Eurasian Journal of Business and Economics, Vol. 4, No. 8, 13-30.
24. Saunders, M., Schneider, k. (2000), “Removing energy subsidies in developing and transition economies”, ABARE Conference Paper 2000.14, available at http://www.earthtrack.netwww.earthtrack.net/files/Saunders_Schneider.pdf.
25. Trianni, A., Cagno, E. (2012), “dealing with barriers to energy efficiencyandSMEs:Someempiricalevidences”,Energy, 37 (1), January, 494-504.
26. united Nations Industrial development Organization. (2011), “Energyefficiencyindevelopingcountriesforthemanufacturingsector”, Development Policy, Statistics and Research Branch Working Paper 15/2011, available at http://www.unido.org/fileadmin/user_media/Services/Research_and_Statistics/WP152011_Ebook.pdf.
27. Vagliasindi, M. (2004), “The role of investment and regulatory reforms in the development of infrastructure across transition economies”, Utilities Policy, Vol 12, No. 4, 303-314.
28. Villegas-Sanchez, C. (2008), “FdI spillovers and the role of localfinancialmarkets:evidencefromMexico”,Europeanuniversity Institute, available at http://www.iadb.org/intal/intalcdi/PE/2008/02222a05.pdf.
29. World Bank. (2010), Lights out? The outlook for Energy in Eastern Europe and the Former Soviet Union, Washington, International Bank for Reconstruction and development / World Bank.
30. World Bank. (2012), World Development Report 2013 on Jobs, Washington d.C., International Bank for Reconstruction and development / World Bank.
Appendixes
Table 5: Description of variablesVariable Definition/description Related label
in the BEEPSExpected sign
Log electricity intensity Logarithm of the ratio of electricity expenses to sales n2f/d2
Log number employees Logarithm of the number of employees l1 -
Firm age Difference between the firm year creation and the year of the survey a14y - b5 +
Log total sales Logarithm of the total sales d2 -
Log capital Logarithm of the net book value of the capital (n6a + n6b) -
Univ. level in total employment Share of university level employees in total employment ecaq69 -
Log enterprise performance Logarithm of the ratio of total sales during the last fiscal year to sales 3 years ago d2/n3 -
The way the firm was established Dummy variable for the initial (or after privatization) status of the establishment ecaq5
Size of locality Locality size dummy variable a3a -
Industry Industry dummy (12 sectors) a4b
Country Country dummy variable a1
Table 6: Countries included in the study
EU new members in 2008 South Eastern Europe (SEE) Commonwealth of Independent States (CIS)
Bulgaria*, Czech Republic, Estonia*, Hungary*, Latvia*, Lithuania, Poland*,Romania*, Slovak Republic* and Slovenia*,
Albania***, Bosnia and Herzegovina***, Croatia**, FYR Macedonia** , Serbia***, Montenegro*** Turkey **
Armenia, Azerbaijan, Belarus, Georgia, Kazakhstan, Kyrgyzstan, Moldova, Russia, Tajikistan, Turkmenistan, Ukraine and Uzbekistan
*Eu new members, ** Eu candidates and *** Potential Eu candidates
I. Bagayev, B. Najman
371
Table 7: List of countries included in the OECD mean calculation
Counterfactual: High Income OECD members For ease of comparison the following OECD members were excluded:
Australia, Austria*, Belgium*, Canada, Denmark*, Finland*, France*, Germany*, Greece*, Iceland, Ireland*, Israel, Italy*, Japan, Korea Republic, Luxembourg*, Netherlands*, New Zealand, Norway, Portugal*, Spain*, Sweden*, Switzerland, United Kingdom*, United States
Czech Republic*, Chile, Estonia*, Hungary*, Mexico, Slovak Republic*, Slovenia*
*Eu new members
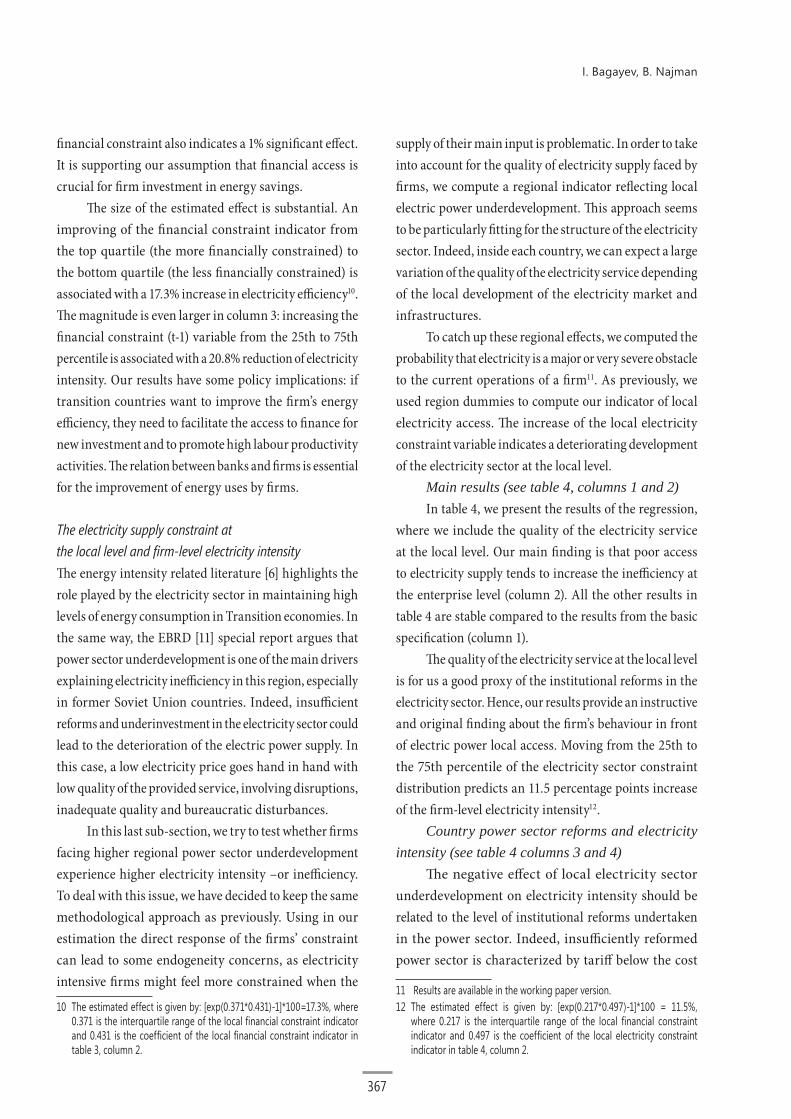
Data:The electricity intensities are computed as a ratio of GDP to country level electricity consumption. The GDP is
expressed in constant 2000 US$ and the electric power consumption in kWh. Data come from the World Development Indicators and are extracted online from the World Bank data service.
Figure 5: Electricity intensity (Electric power consumption in kWh per constant 2000 US$) in South Eastern Europe, 1990-2009
0
2
4
6
Elec
tricit
y int
ensit
y
1990 1995 2000 2005 2010Year
Albania
Bosnia and Herzegovina
Croatia
Serbia
Turkey
OECD mean
Igor Bagayev
is a PhD candidate in the University of Paris-Est. He was graduated from the University Paris 1 Panthéon-Sorbonne with a master degree, in International and Development Economics (2010-2011). He currently has a teaching assistant position in applied econometrics, statistics, microeconomics and development studies. His fields of research concern transition economics, energy efficiency, international specialization, financial development and growth economics.
Boris Najman
is Associate Professor at Paris East University. He is an economist with an extensive research track record in the area of labour market, migrations, public finance and banking. Since 1994, he has been active in research and policy-advising in several CIS, Western Balkan and Middle East countries. He is a Research Fellow at ERUDITE (Paris East), CASE (Poland) and CES (Centre d’Economie de la Sorbonne). He is the director of the «International Economic Studies» Master.