igf pas activity in wp4 - sheer project 4-5-6/lasocki2.pdf · physical processes controlling...
TRANSCRIPT
First Annual Meeting Napoli - June 7-9, 2016
Hotel Palazzo Esedra, Piazzale Tecchio, 50 – 80125
M. Staszek, B. Orlecka-Sikora, S. Lasocki, K. Leptokaropoulos, J. Mirek, H. Marcak, IGF PAS, Napoli
This project has received funding from the European Union’s Horizon 2020 research and innovation programme under grant agreement No 640896.
SHale gas Exploration and Exploitation induced Risks
IGF PAS activity in WP4
Presentation plan
Topics currently realized by IGF PAS within WP4:
1. Seismic interferometry for monitoring of S-wave velocity changes in the reservoir due to fluid injection.
2. Multi-dimensional clustering in equivalent dimensions for identification of physical processes controlling seismogenesis.
3. Static stress drop distribution and its application in seismic hazard assessment.
2
1. Seismic interferometry Goal: use of ambient seismic noise for monitoring of S-wave velocity changes due to hydraulic fracturing at Wysin site
Small velocity perturbations from correlations of seismic noise can be a useful tool for studying the contiuous time evolution of stress regime in the vicinity of seismogenic faults.
Brenguier et al., 2008. Science
measure changes between cross-correlation functions of ambient seismic noise
computed for different dates for the same receiver pair determine changes in
seismic velocity …
3
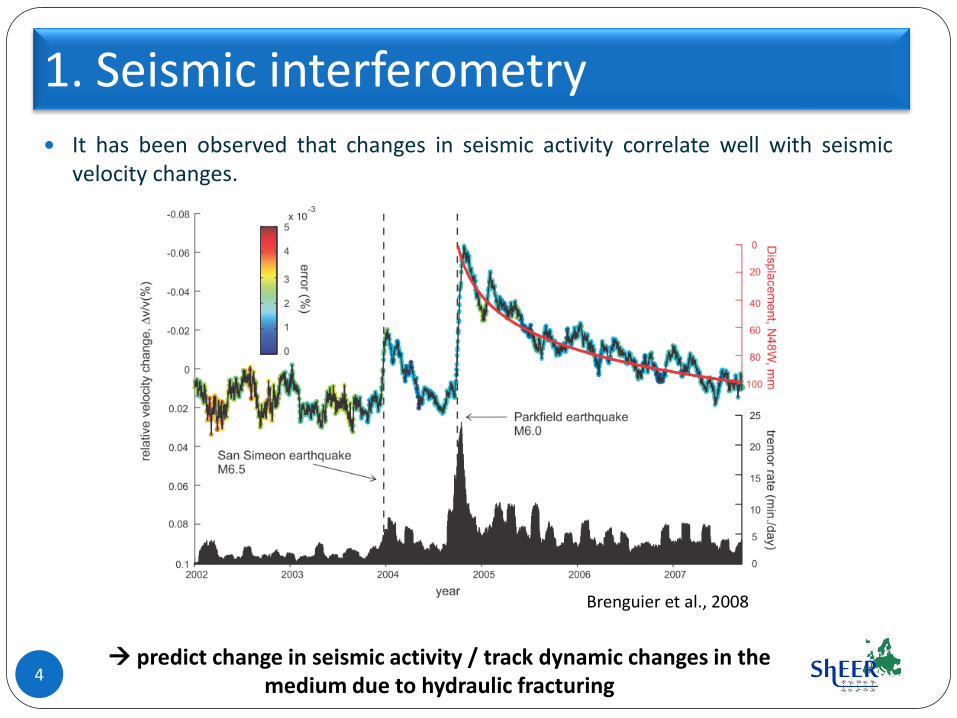
1. Seismic interferometry It has been observed that changes in seismic activity correlate well with seismic
velocity changes.
4
Brenguier et al., 2008
predict change in seismic activity / track dynamic changes in the medium due to hydraulic fracturing
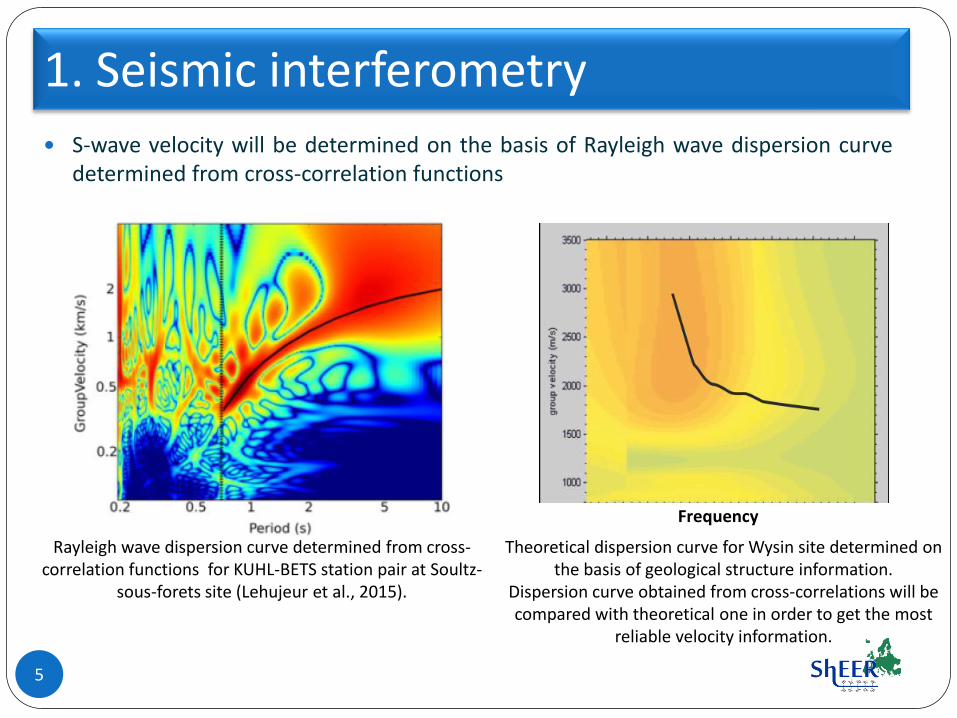
1. Seismic interferometry S-wave velocity will be determined on the basis of Rayleigh wave dispersion curve
determined from cross-correlation functions
5
Rayleigh wave dispersion curve determined from cross-correlation functions for KUHL-BETS station pair at Soultz-
sous-forets site (Lehujeur et al., 2015).
Theoretical dispersion curve for Wysin site determined on the basis of geological structure information.
Dispersion curve obtained from cross-correlations will be compared with theoretical one in order to get the most
reliable velocity information.
Frequency
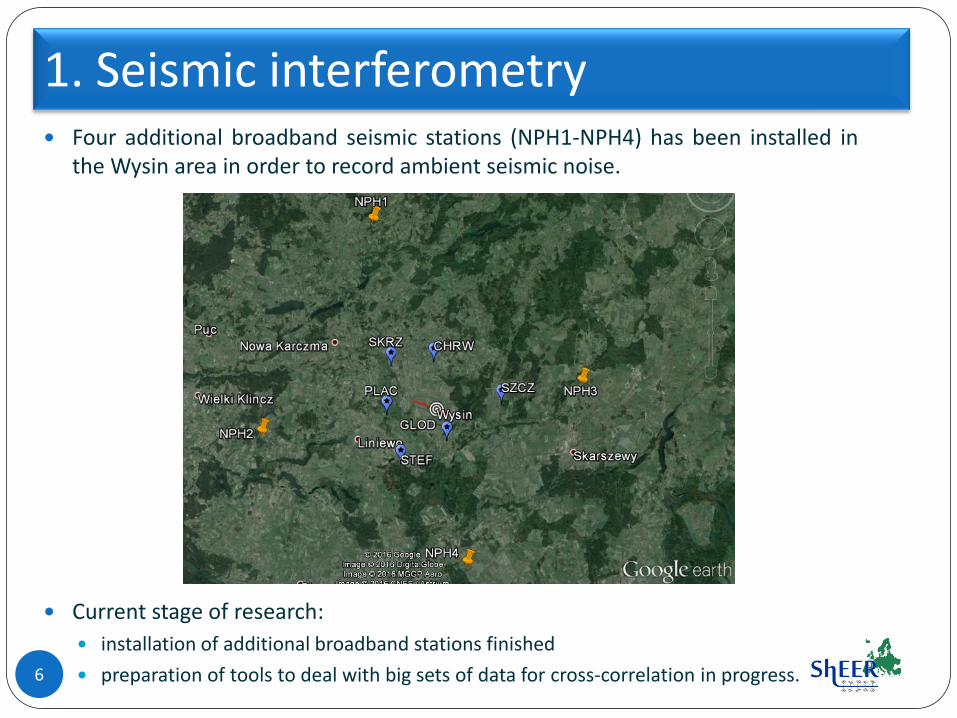
1. Seismic interferometry Four additional broadband seismic stations (NPH1-NPH4) has been installed in
the Wysin area in order to record ambient seismic noise.
Current stage of research:
installation of additional broadband stations finished
preparation of tools to deal with big sets of data for cross-correlation in progress.
6
2. Multi-dimensional clustering
Goal: use of multi-dimensional clustering in equivalent dimensions for identification of physical processes controlling seismogenesis at The Geysers geothermal site
The analysis is perfomed using methodology proposed by Lasocki (2014):
transformation of multi-dimensional dataset into equivalent dimensions
identification of clusters using Ward’s hierarchical method (Ward, 1963)
7
2. Multi-dimensional clustering
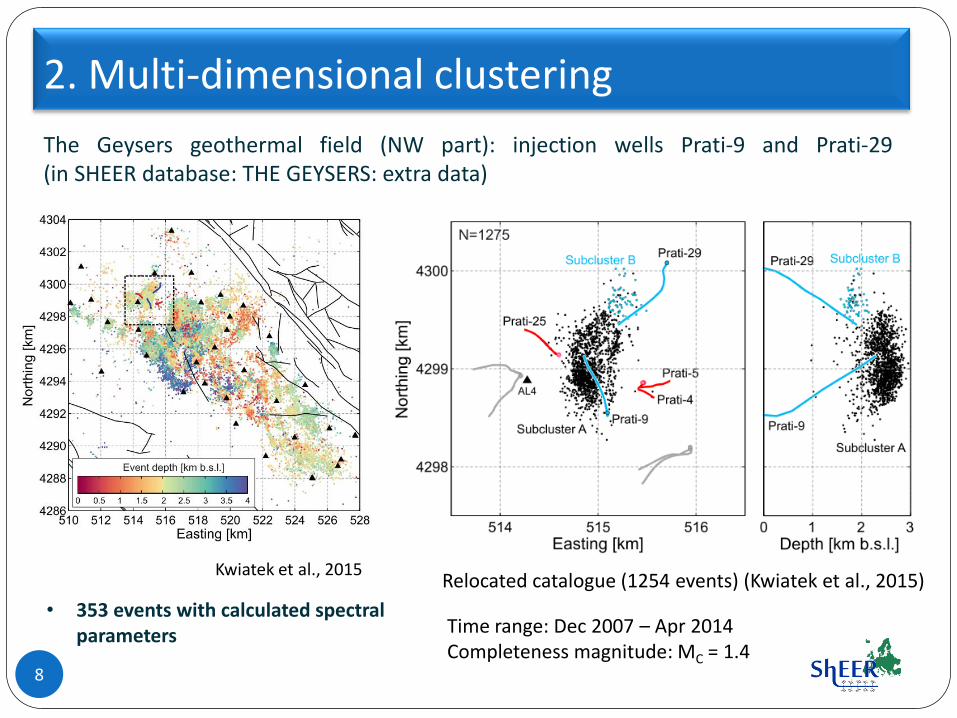
The Geysers geothermal field (NW part): injection wells Prati-9 and Prati-29 (in SHEER database: THE GEYSERS: extra data)
8
Kwiatek et al., 2015 Relocated catalogue (1254 events) (Kwiatek et al., 2015)
Time range: Dec 2007 – Apr 2014 Completeness magnitude: MC = 1.4
• 353 events with calculated spectral parameters
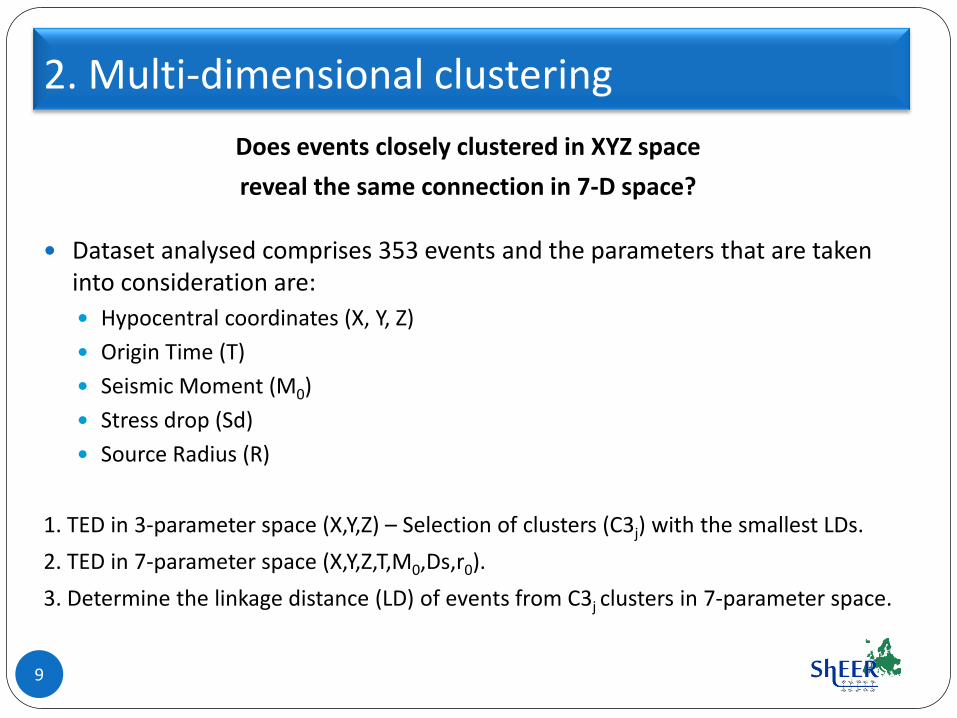
2. Multi-dimensional clustering
Does events closely clustered in XYZ space
reveal the same connection in 7-D space?
Dataset analysed comprises 353 events and the parameters that are taken into consideration are:
Hypocentral coordinates (X, Y, Z)
Origin Time (T)
Seismic Moment (M0)
Stress drop (Sd)
Source Radius (R)
1. TED in 3-parameter space (X,Y,Z) – Selection of clusters (C3j) with the smallest LDs.
2. TED in 7-parameter space (X,Y,Z,T,M0,Ds,r0).
3. Determine the linkage distance (LD) of events from C3j clusters in 7-parameter space.
9
2. Multi-dimensional clustering
10
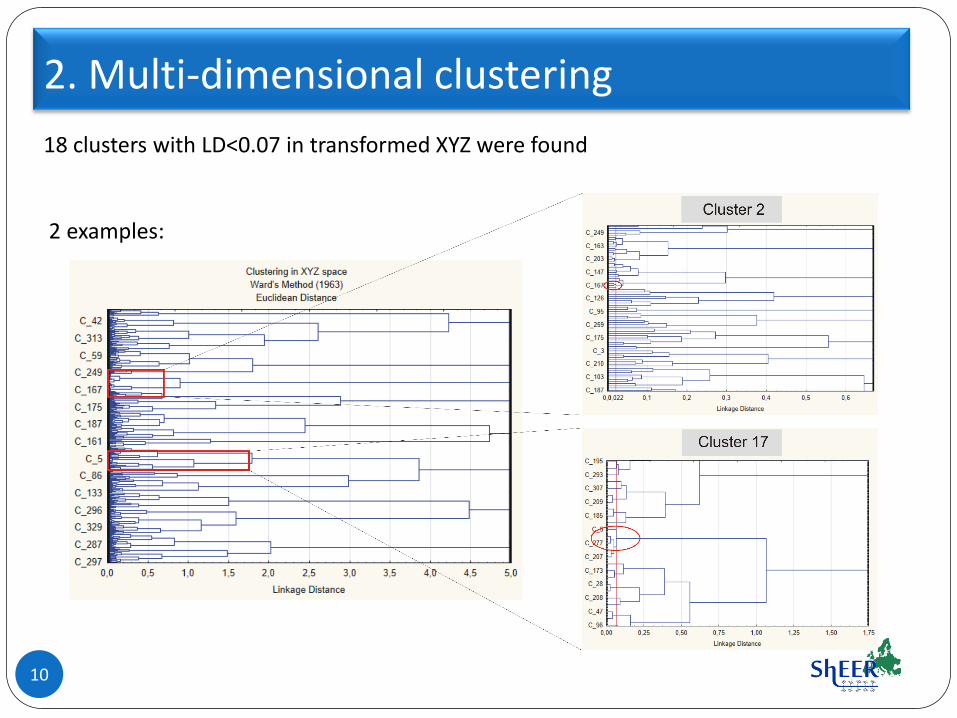
18 clusters with LD<0.07 in transformed XYZ were found 2 examples:
2. Multi-dimensional clustering
11
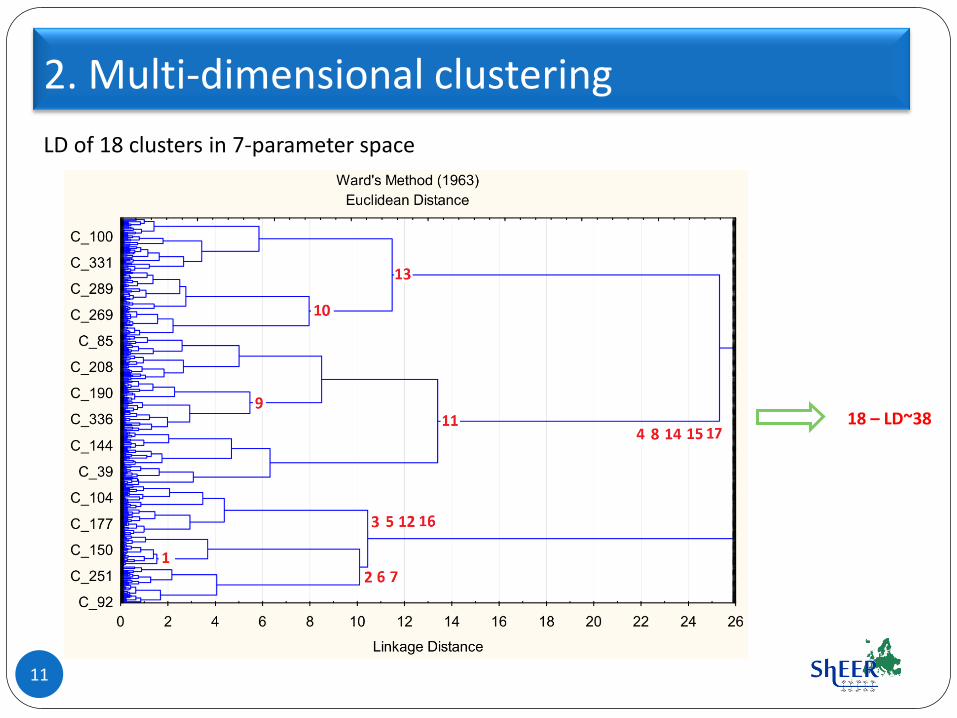
LD of 18 clusters in 7-parameter space
18 – LD~38
2. Multi-dimensional clustering
12
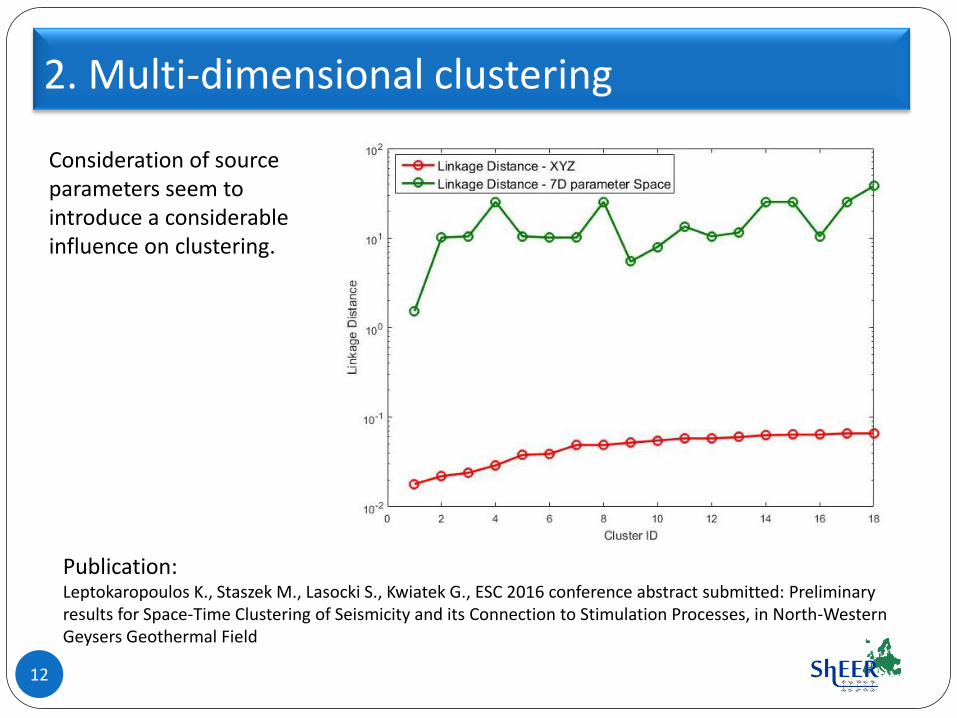
Consideration of source parameters seem to introduce a considerable influence on clustering.
Publication: Leptokaropoulos K., Staszek M., Lasocki S., Kwiatek G., ESC 2016 conference abstract submitted: Preliminary results for Space-Time Clustering of Seismicity and its Connection to Stimulation Processes, in North-Western Geysers Geothermal Field
3. Static stress drop distribution
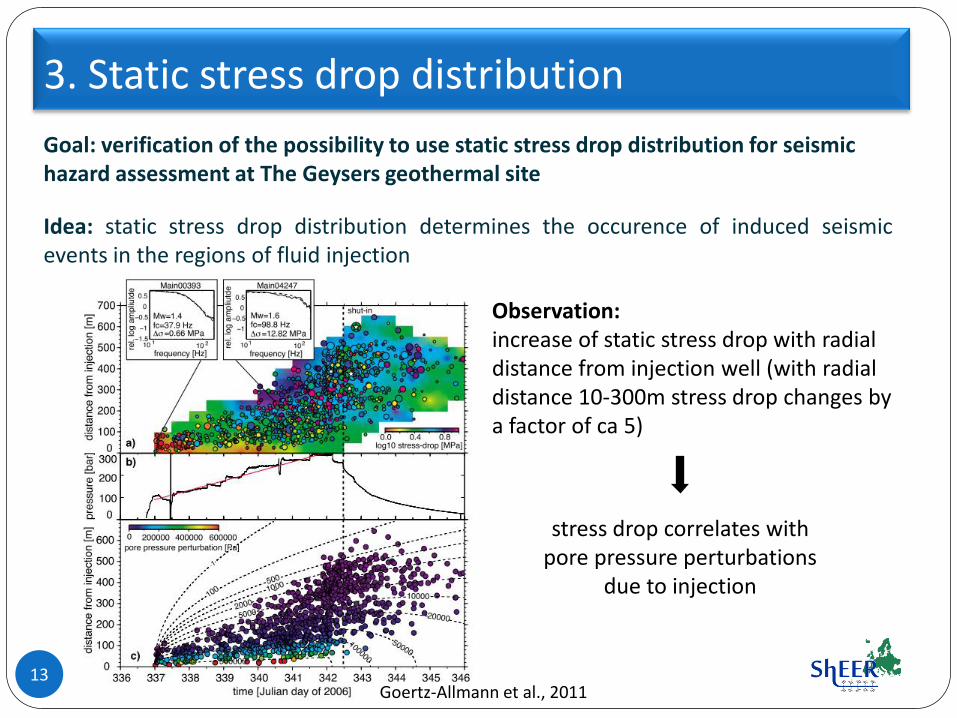
Goal: verification of the possibility to use static stress drop distribution for seismic hazard assessment at The Geysers geothermal site
Idea: static stress drop distribution determines the occurence of induced seismic events in the regions of fluid injection
13 Goertz-Allmann et al., 2011
Observation: increase of static stress drop with radial distance from injection well (with radial distance 10-300m stress drop changes by a factor of ca 5)
stress drop correlates with pore pressure perturbations
due to injection
14
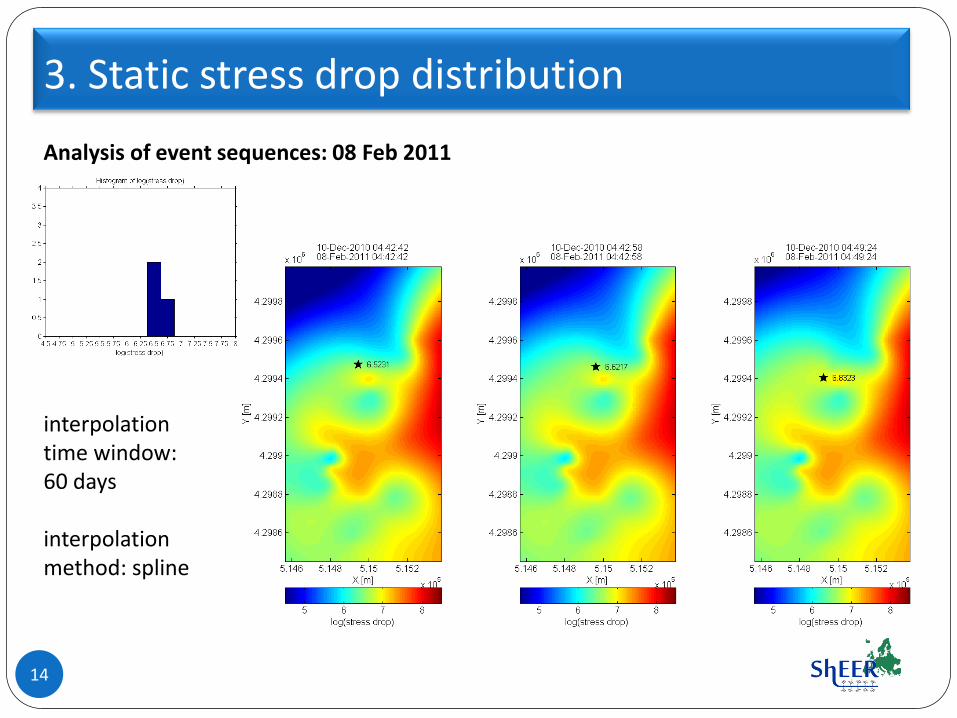
3. Static stress drop distribution
Analysis of event sequences: 08 Feb 2011
interpolation time window: 60 days interpolation method: spline
15
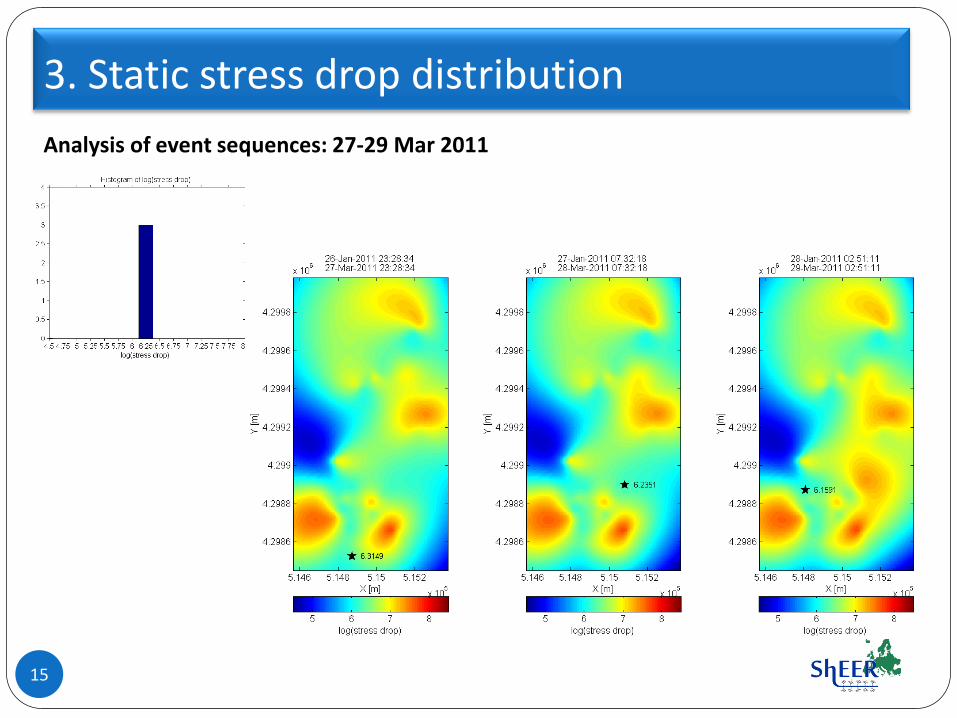
3. Static stress drop distribution
Analysis of event sequences: 27-29 Mar 2011
16
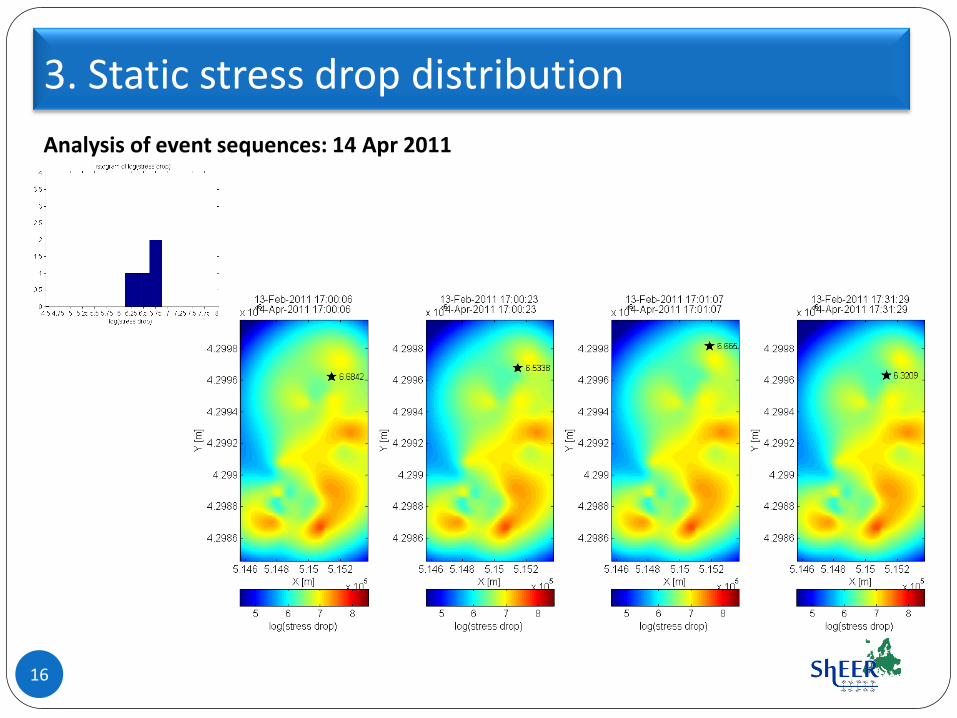
3. Static stress drop distribution
Analysis of event sequences: 14 Apr 2011
17
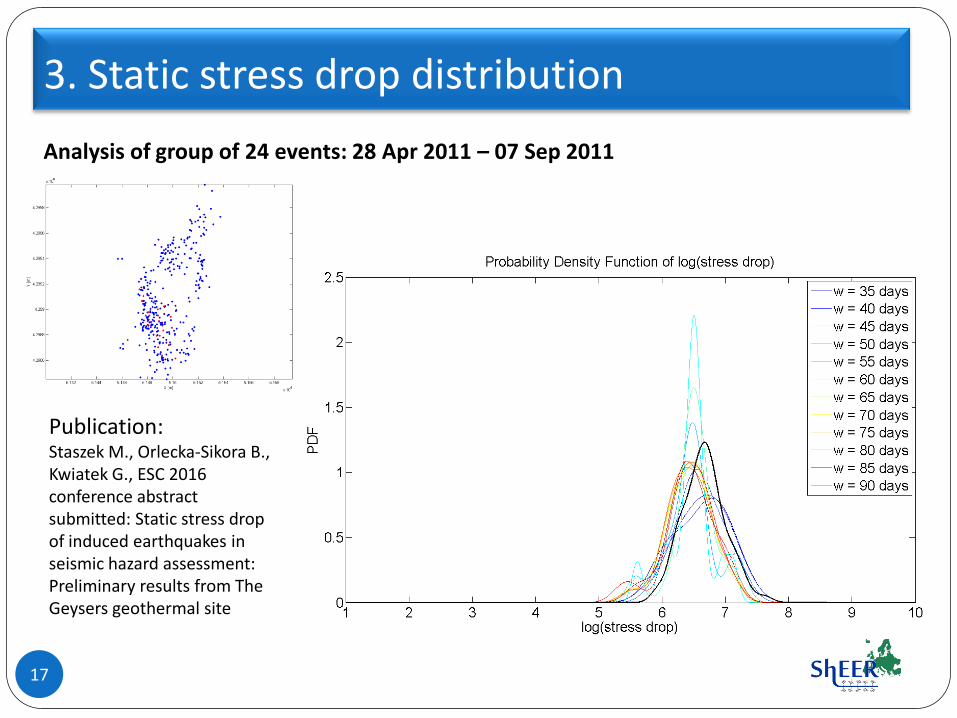
3. Static stress drop distribution
Analysis of group of 24 events: 28 Apr 2011 – 07 Sep 2011
Publication: Staszek M., Orlecka-Sikora B., Kwiatek G., ESC 2016 conference abstract submitted: Static stress drop of induced earthquakes in seismic hazard assessment: Preliminary results from The Geysers geothermal site
References 1. Brenguier F., Campillo M., Hadziioannou C., Shapiro N. M., Nadeau R. M., Larose E., 2008. Science 321:
1478-1481.
2. Goertz-Allmann B., Goertz A., Wiemer S. (2011), Stress drop variations of induced earthquakes at the Basel geothermal site. Geophysical Research Letters, 38, L09308, doi:10.1029/2011GL047498.
3. Kwiatek G., Martínez-Garzón P., Dresen G., Bohnhoff M., Sone H., and Hartline C. (2015), Effects of long-term fluid injection on induced seismicity parameters and maximum magnitude in northwestern part of The Geysers geothermal field. J. Geophys. Res. Solid Earth, 120, doi:10.1002/2015JB012362.
4. Lasocki, S. (2014), Transformation to equivalent dimensions – a new methodology to study earthquake clustering, Geophys. J. Int., 197, 1224-1235.
5. Lehujeur M., Vergne J,, Schmittbuhl J., Maggi A., 2015. Characterization of ambient seismic noise near a deep geothermal reservoir and implications for interferometric methods: a case study in northern Alsace, France. Geothermal Energy 3:3.
6. Martínez-Garzón P., Kwiatek G., Sone H., Bohnhoff M., Dresen G., and Hartline C. (2014), Spatiotemporal changes, faulting regimes, and source parameters of induced seismicity: A case study from The Geysers geothermal field. J. Geophys. Res. Solid Earth, 119, 8378 – 8396, doi:10.1002/2014JB011385.
7. Ward, J.H., 1963. Hierarchical grouping to optimize an objective function. J. Am. Stat. Assoc., 58, 236–244.
18