ifad’s 2020 results-based programme of work and regular
TRANSCRIPT

Note to Governors
Focal points:
Technical questions: Dispatch of documentation:
Saheed Adegbite Director Office of Strategic Budgeting Tel.: +39 06 5459 2957 e-mail: [email protected]
Deirdre Mc Grenra Chief Institutional Governance and Member Relations Tel.: +39 06 5459 2374 e-mail: [email protected]
Francesco Ranalletta Senior Budget Specialist Tel.: +39 06 5459 2257 e-mail: [email protected]
Oscar A. Garcia Director Independent Office of Evaluation of IFAD Tel.: +39 06 5459 2274 e-mail: [email protected]
Governing Council — Forty-third Session
Rome, 11-12 February 2020
For: Approval
Document: GC 43/L.6 /Rev.1
E
Agenda: 9
Date: 12 February 2020
Distribution: Public
Original: English
IFAD’s 2020 results-based programme of work and regular and capital budgets, the IOE results-based work programme and budget for 2020 and indicative plan for 2021-2022, and the HIPC and PBAS progress reports
GC 43/L.6/Rev.1
i
IFAD’s 2020 results-based programme of work and regular and capital budgets, the IOE results-based work programme and budget for 2020 and indicative plan for 2021-2022, and the HIPC and PBAS progress reports
1. The attached document sets forth IFAD’s 2020 results-based programme of work
and regular, capital and special expenditure budgets, the targeted capacity
investment, the budget of the Independent Office of Evaluation of IFAD (IOE) for
2020 and indicative plan for 2021-2022, and the progress reports on IFAD’s
participation in the Heavily Indebted Poor Countries (HIPC) Debt Initiative and
implementation of the performance-based allocation system (PBAS).
2. The programme of work for 2020 was approved by the Executive Board at its 128th
session in December 2019. A level of SDR 760 million (US$1,062 million) in
nominal terms was approved for planning purposes, subject to a review of the
resources available for commitment during the course of 2020.
3. The Executive Board also reviewed the progress reports on IFAD’s participation in
the HIPC Debt Initiative and on the implementation of the PBAS and its addendum,
containing the 2019 country scores and 2019-2021 country allocations, and
recommended that both progress reports be transmitted to the Governing Council
for information.
4. In accordance with article 6, section 10 of the Agreement Establishing IFAD and
regulation VI of the Financial Regulations of IFAD, and on the recommendation of
the Executive Board, IFAD’s 2020 results-based programme of work and regular
and capital budgets, the programme of work and budget of IOE for 2020 and
indicative plan for 2021-2022, and a targeted capacity investment of IFAD for 2020
are transmitted to the Governing Council for approval.
5. Accordingly, it is recommended that the Governing Council adopt the attached draft
resolution, approving IFAD’s 2020 regular and capital budgets, the programme of
work and budget of IOE for 2020 and indicative plan for 2021-2022, and a targeted
capacity investment of IFAD for 2020 in the amounts indicated.

GC 43/L.6/Rev.1
ii
Contents
Executive summary v
Recommendation for approval 1
Part one – IFAD’s 2020 results-based programme of work and
regular, capital and special expenditure budgets 1
I. Context 1
II. Current perspective 3
A. Update on 2019 programme of loans and grants 3 B. 2018 and 2019 net regular budget usage 4 C. 2018 carry-forward allocation 6
III. Gender sensitivity of IFAD’s loans and grants and regular budget 6
IV. 2020 programme of work 8
V. 2020 net regular budget 10
A. Introduction 10 B. Budget process 10 C. Assumptions 12 D. Proposed staffing level 13 E. Cost drivers 15 F. Net regular budget proposal 17 G. Gross budget proposal 21 H. Efficiency ratios 21
VI. Capital budget for 2020 23
VII. Targeted capacity investment 24
VIII. Special expenditure budget for IFAD12 28
Part two - Results-based Work Programme and Budget for 2020,
and Indicative Plan for 2021–2022 of the Independent Office of
Evaluation of IFAD 29
I. Introduction 29
II. Progress of activities in 2019 29
A. Selected evaluations from 2019 work programme 29 B. 2019 budget utilization 30 C. Utilization of the 2018 carry-forward 31
III. IOE strategic objectives 31
IV. 2020 work programme 31
V. 2020 resource envelope 34
A. Staff resources 34 B. Budget requirements 34
VI. IOE budget proposal and considerations for the future 38
Part three – Heavily Indebted Poor Countries Initiative progress report
for 2019 40
I. Introduction 40
II. Progress in HIPC Initiative implementation 40
GC 43/L.6/Rev.1
iii
III. Total commitment to the HIPC Initiative 41
IV. Financing debt relief 41
Part four – Progress report on implementation of the
performance-based allocation system 42
I. Application of the performance-based allocation system in 2019 42
II. Country lending terms for 2019 42
Part five – Recommendations 44
Draft resolution .../XLIII 45
Annexes
I. Indicative list of countries with projects in the pipeline for 2020
(new projects and additional financing for ongoing projects) 47
II. Regular budget by cost category and department, 2019 approved
and realigned budget versus 2020 proposal 48
III. Indicative breakdown of 2020 regular budget by results pillar
and institutional output group 50
IV. Indicative 2020 staff levels, regular budget only 52
V. Indicative 2020 staffing by department and grade 53
VI. Staff costs 54
VII. Capital budget (excluding CLEE), 2008-2019 55
VIII. Carry-forward funds allocation 56
IX. Estimate of direct charges on investment income 57
X. IOE Results Measurement Framework for 2016-2018
(extended to 2020) 58
XI. IOE reporting on achievements 59
XII. IOE proposed evaluation activities for 2020 and indicative
plan for 2021-2022 63
XIII. IOE staffing for 2020 67
XIV. IOE proposed budget for 2020 68

GC 43/L.6/Rev.1
iv
Abbreviations and acronyms
ARRI Annual Report on Results and Impact of IFAD Operations
ASAP Adaptation for Smallholder Agriculture Programme
CLEE Corporate-level Evaluation of IFAD’s Institutional Efficiency and
the Efficiency of IFAD-funded Operations
COSOP country strategic opportunities programme
CSD Corporate Services Department
CSSG Corporate Services Support Group
ECG Environment, Climate, Gender and Social Inclusion Division
ERG External Relations and Governance Department
FAO Food and Agriculture Organization of the United Nations
FOD Financial Operations Department
FTE full-time equivalent
GEM Global Engagement and Multilateral Relations Division
HIPC Highly Indebted Poor Countries
HRD Human Resources Division
ICO IFAD country office
ICT information and communications technology
IFAD10/11/12 Tenth/Eleventh/Twelfth Replenishment of IFAD's Resources
IOE Independent Office of Evaluation of IFAD
IOGs institutional output groups
LEG Office of the General Counsel
M&E monitoring and evaluation
OPV Office of the President and Vice-President
OSB Office of Strategic Budgeting
PBAS performance-based allocation system
PMD Programme Management Department
PoLG programme of loans and grants
PRM Partnership and Resource Mobilization Office
SKD Strategy and Knowledge Department
SSTC South-South and Triangular Cooperation
WFP World Food Programme
WIGSI within-grade step increment

GC 43/L.6/Rev.1
v
Executive summary
1. The 10-year countdown to achieve the Sustainable Development Goals begins in
2020. IFAD will need to redouble its efforts if it is to play a significant role in
meeting these global development priorities.
2. Major reforms and institutional exercises to improve efficiency were undertaken in
2019, including: (i) consolidating IFAD's decentralized structure; (ii) recalibrating
business processes; (iii) delegating responsibility to the front lines; (iv) making
headquarters fit for purpose; and (v) further strengthening IFAD's institutional
focus on results. Through this programme of ambitious reforms, IFAD has made
significant strides towards changing its way of doing business, introducing for
instance a more streamlined project design process for efficiency and quality of
delivery. In 2020 IFAD will operationalize the lessons learned from this initial phase
of implementation and strive for greater impact within the context of the IFAD
Strategic Framework 2016-2025.
3. Notwithstanding significant progress in many areas, IFAD still faces multiple
challenges that need to be addressed urgently: 2020 will be a key year for the
implementation of an effective and efficient business model that delivers value for
money and catalyses investments. In light of the current landscape, there is
growing appetite from Member States for IFAD to extend its range of operations,
deepen its engagement with governments and the private sector, and diversify its
products. Greater efforts are required to enhance the quality of the project
portfolio and strengthen implementation of ongoing projects. Key issues include
rural transformation; mainstreaming gender, nutrition, climate and youth;
strengthening IFAD's performance as a strategic partner; and leveraging increased
operational and policy engagement.
4. Activities related to the Consultation on the Twelfth Replenishment of IFAD's
Resources (IFAD12) will be a top priority, including engagement with a growing
number of stakeholders. The added complexity that this entails has also made
comprehensive internal control and enterprise risk management frameworks
necessary. Following the independent assessment conducted by Marsh Risk
Consulting in 2019 and the update of the corporate risk dashboard, Management
will need to make further improvements to its risk assessment methodology in
2020 to ensure rigorous and accurate risk monitoring processes are in place. In
addition, it will be critical for the Fund’s long-term financial sustainability to ensure
effective implementation of the proposed reform of the Debt Sustainability
Framework.
5. The projected programme of loans and grants (PoLG) for 2020 is US$1 billion,
composed of 35 new projects and additional financing for two ongoing projects.
Following the frontloading of investments in 2019, priority will be given to
implementation by ensuring effective project start-up and continuing to focus on
strengthening performance and quality during implementation with a view to
achieving IFAD11 targets. This will require a more balanced delivery of new project
financing over 2020 and 2021, while keeping the IFAD11 PoLG target unchanged at
US$3.5 billion. Management will continue its efforts to ensure quality at entry,
maintaining a sound 36-month rolling efficiency ratio within the IFAD11 target of
12.9 per cent.
6. The primary cost drivers for the 2020 budget are: (i) additional staffing to support
the regional hubs and IFAD country offices (ICOs) and, in line with the capacity
gaps identified in the recently conducted study on IFAD human resources
composition, staffing to strengthen the enterprise risk management function,
development finance and programmatic operations, legal and oversight activities,
private sector engagement, mainstreaming of priority themes and social inclusion,
and IFAD information technology (IT) architecture; (ii) increased depreciation;

GC 43/L.6/Rev.1
vi
(iii) rental and administrative ICO costs resulting from higher occupancy of hosted
decentralized offices; and (iv) engagement with governing bodies.
7. As indicated in the high-level preview, real cost increases have been fully absorbed
by reductions in staff and non-staff cost categories following a systematic review of
departmental requests.
8. The 2020 net regular budget is proposed at US$157.9 million, representing a
0.19 per cent nominal decrease vis-à-vis the 2019 budget of US$158.21 million
(compared with 1.49 per cent in the high-level preview). The nominal decrease of
0.19 per cent derives from the net effect of inflation, within-grade step increment
adjustments, realignment of standard staff costs and exchange rate adjustments.
The exchange rate used for the final budget proposal is
EUR 0.885:US$1 (compared to EUR 0.841:US$1 used in the preview), more than
5 per cent higher than the exchange rate for 2019. While cost-cutting measures
have been – and continue to be – in place, the overall budget for 2020 has
benefited from the effect of a much stronger United States dollar. This level of
budget reduction may not be possible going forward and a reversal in the
EUR:US$ exchange rate could result in budgetary increases in the future.
9. The zero real increase is the net effect of: (i) net real staff cost increases
(US$2,090,000), (ii) depreciation (US$100,000); (iii) estimated rent, common
services and running costs of ICOs (US$200,000); and (iv) incremental travel and
administrative expenditures for increased engagement with governing bodies in
preparation for IFAD12 (US$330,000), offset by a real decrease in consultancy and
other costs (approximately US$3.3 million).
10. In regard to the gross budget for 2020, the proposed amount of US$162.6 million
includes US$4.7 million to cover the cost of managing operations funded by
supplementary funds, which are external but complementary to the PoLG. This
amount can be fully recovered from the annual allocable portion of the fee income
generated by supplementary funds management.
11. This ambitious and necessary agenda has highlighted the need for IFAD to assess
whether it has the right human capital, skills mix and policy flexibility to deliver on
the programme of work now and under IFAD 2.0. To this end, IFAD hired McKinsey
& Company to conduct a comprehensive human resources study of workforce
composition focusing on: (i) capabilities and capacities; (ii) employee value
proposition; and (iii) the human resource enablers deemed necessary for
enhancing performance and delivery. Gathering insights from the human resources
study, Management is now in a position to make informed decisions on where
investments are required to address emerging gaps and mismatches in the three
key areas covered in the assessment.
12. Therefore, to support the path of ambitious reforms IFAD has embarked upon, a
targeted capacity investment is proposed to address the added complexity and
ambition. This reshapes IFAD's human capital model, re-adapting it to ensure it
has the right size, skills and technology capacity to meet current operational needs
and realize its future vision ahead of the start of IFAD12.
13. This set-aside reserve fund of up to US$12 million for a two-year targeted capacity
implementation plan is proposed to cover necessary investments to address gaps
identified in the human resources study and leverage investments in automation
and non-IT solutions to improve business processes, as well as enhance the
Enterprise Risk Management Framework to enable meaningful risk oversight by the
Audit Committee and Executive Board to effectively manage the risks associated
with IFAD’s evolving business model. IFAD Management will prioritize eligible quick
wins to ensure momentum and focus on developing a detailed two-year
implementation plan, indicating specific actions to be undertaken in 2020 and
2021, or crossing both years, for presentation to the Executive Board.

GC 43/L.6/Rev.1
vii
14. The 2020 capital budget envelope amounts to US$4.445 million, encompassing a
portion covering cyclical IT operations and maintenance of headquarters and ICO
enhancements (US$2.22 million) and up to US$2.225 million for substantial
investment in financial systems. As foreseen in the preview and as recommended
by the Corporate-level Evaluation (CLE) on IFAD's Financial Architecture and
Alvarez & Marsal’s external risk review, dedicated funds have been earmarked for
system enhancements for a strategic re-shaping of IFAD’s financial architecture.
This includes the treasury and risk management system, completion of the
Flexcube upgrade and the adaptation of IT tools to new lending terms.
15. In line with Governing Council resolution 181/XXXVII, the Executive Board will be
requested to approve the appropriation for a special expenditure budget for the
IFAD12 replenishment exercise. A final estimate of US$1.1 million is proposed for
IFAD12.
16. In accordance with regulation VII of the Financial Regulations of IFAD, medium-
term budgetary projections on the basis of projected income flows from all sources,
along with projected disbursements based on operational plans covering the same
period, are shown in table 1 below. These projections are indicative and intended
for information purposes only. The format of the table has been aligned with that of
the Resources Available for Commitment document.
Table 1 Medium-term budgetary projections on the basis of projected inflows and outflows (all sources) (Millions of United States dollars)
2018
(actuals)* 2019
(projected) 2020
(projected)
Liquidity at beginning of period 1 348 1 037 989
Inflows
Loan reflows 342 354 375
Encashment of contributions** 296 373 301
Borrowing 119 235 127
Investment income 1 23 7
Outflows
Disbursements (826) (910) (924)
Borrowing obligations (debt service and fees) (1) (5) (17)
Heavily Indebted Poor Countries Initiative impact (11) (2) (3)
Administrative expenses and other budgetary items*** (158) (172) (177)
Fixed assets (5)
Intrafund movement and foreign exchange (68)
Other cash flows 56 (3)
Liquidity at end of period 1037 989 675
* Source for 2018: audited 2018 consolidated financial statements of IFAD. ** Excluding the Adaptation for Smallholder Agriculture Programme. *** Other administrative expenses include one-time budgets and carry-forward resources.

GC 43/L.6/Rev.1
1
Recommendation for approval
The Governing Council is invited to approve the recommendation as contained in part
five of this document and to adopt the draft resolution contained in page 44.
Part one – IFAD’s 2020 results-based programme of work and regular, capital and special expenditure budgets
I. Context 1. The State of Food Security and Nutrition in the World 2019 report shows a
continuous rise in world hunger, mainly concentrated in low and lower middle-
income countries that are often in fragile situations and highly vulnerable to climate
change. These conditions are accompanied by the complex challenges of extreme
rural poverty, gender inequality, malnutrition, migration, youth unemployment and
financial instability. In this context, demand for development assistance in the
global arena is increasing: Member States, beneficiary countries and other
development actors are requesting greater efforts from development institutions.
With a strategic role to play in responding to these needs, IFAD is under pressure
to continually improve its internal efficiency and project performance.
2. In 2019, in the context of a zero-growth budget, IFAD has been managing a higher
target programme of loans and grants (PoLG) of US$1.76 billion by designing fewer
but bigger projects in the face of increasing external challenges. As evidenced in
recent analyses conducted by the Independent Office of Evaluation of IFAD (IOE),
improving the quality of a larger programme of work with fewer resources is a
challenging task and necessitates trade-offs. In 2020, as the 10-year countdown
begins for the achievement of the Sustainable Development Goals, IFAD needs to
redouble its efforts and set clear priorities in order to become “bigger, better and
smarter”.
3. For IFAD, 2020 will be a year to operationalize the lessons learned from an initial
phase of implementation of corporate initiatives, aimed at: (i) bolstering the
decentralized structure; (ii) recalibrating business processes; (iii) delegating
responsibility to the front lines; (iv) making headquarters fit for purpose; and
(v) further strengthening the institutional focus on results.
4. Decentralization and organizational realignment have been key elements of the
reform agenda. In 2018 and 2019, the ratio of budgeted staff positions in IFAD
country offices (ICOs) rose significantly as the percentage of positions located in
the field increased from 18 per cent to 30 per cent. This helped re-energize
delivery teams on the ground by bringing IFAD closer to the rural areas and
beneficiaries it serves. An initial lessons learned exercise was conducted this year
to gather feedback from the regional hubs and South-South and Triangular
Cooperation (SSTC) and knowledge centres. As decentralization deepens in 2020,
the percentage of staff located in the field will rise to 33 per cent. Follow-up
missions will take place during the year to gather feedback on potential areas of
improvements in ICOs.
5. During the Tenth Replenishment of IFAD's Resources (IFAD10) and continuing into
2019, systematic efforts have been invested in mainstreaming climate, gender,
nutrition and youth into country programmes and projects to multiply the impact of
IFAD's investments and address the most pressing challenges, including food
insecurity and fragility. Cognizant of significant challenges in this regard,
Management is developing a framework for implementing transformational

GC 43/L.6/Rev.1
2
approaches to the four priority themes. The mainstreaming agenda as established
in the four mainstreaming action plans is key to moving to a more ambitious
transformational approach that utilizes the synergies generated by interaction
among the four priority areas. This will enable IFAD to achieve greater relevance
and efficiencies on both its lending and non-lending priorities and contribute to
tangible project outcomes.
6. Maintaining a highly efficient organization while achieving efficiency gains and
savings will continue to be the thrust of budget management in 2020. IFAD’s ratio
of administrative expenditure to PoLG was 7.8 (or 12.9 per cent) during the IFAD10
period. The 2019 budget document indicated that this ratio has improved further to
approximately 11.3 (or 9 per cent), and the projected efficiency ratio for 2020
calculated on the basis of the proposed administrative budget and estimated PoLG
is 14 per cent. During the entire IFAD11 period, IFAD will continue its efforts to
maintain this trend and contain the administrative budget while focusing on PoLG
targets. Overall, as recognized by the Multilateral Organization Performance
Assessment Network assessment in 2017-2018, IFAD’s results culture is growing
and the evaluation and accountability functions continue to be robust, including the
established basics of results-based budgeting.
7. Notwithstanding the progress made in a number of areas, IFAD still faces a number
of challenges. Moving into the second year of the IFAD11 period, greater efforts are
required to ensure successful start-up of the large number of new projects,
enhance project portfolio quality, monitor results, strengthen performance as a
strategic partner and leverage increased operational and policy engagement.
Furthermore, while the equity position remains strong, it will be critical for the
recently proposed reform to the Debt Sustainability Framework (DSF) model to be
effectively implemented and for adequate resources to be invested in enhancing
the financial architecture and preparing for a potential diversification of funding
sources to meet the increasing demand for development projects.
8. In 2020, in line with the risk appetite statement developed in 2019 and a review of
enterprise risk management governance, additional efforts will be needed to instill
a holistic and systematic approach to risk in IFAD strategy and operations. This will
leverage strengthened internal capacities, in particular the Risk Management Unit,
to complete the corporate risk dashboard and mechanisms for mitigating financial,
operational and strategic risks. This is a necessary step to further strengthen the
financial architecture as the organization seeks to leverage on existing core
resources in order to implement the new IFAD Private Sector Engagement Strategy
2019-2024. A core element of the 2020 budget will be preparations for IFAD12:
one of the main lessons learned from prior exercises is the need for IFAD to engage
with the growing number of stakeholders earlier and more substantively. This is
reflected in the departmental requests for 2020 and an effort has been made to
accommodate the cost increases related to increased engagement with governing
bodies while maintaining zero real growth.
9. In working towards these objectives, an immediate requirement for IFAD is to align
workforce capacities and capabilities to internal and external trends affecting the
volume and nature of its work now and in the years to come. In 2019, IFAD hired
an external consulting firm – McKinsey & Company – to conduct a comprehensive
review of its workforce, strategic human resources and technology enablers and
employee value proposition, looking at the implications for delivering the
organization’s current and future programme of work and considering a potential
shift in the organization’s strategy and operating model. The findings identify skills
gaps in a number of areas, including communication, strategic mindset, analytical
skills, policy dialogue, problem-solving and leadership, and in specific skills groups
such as legal, oversight and integrity, management, technical specialists and
financial operations management.

GC 43/L.6/Rev.1
3
10. In view of this projection, IFAD needs to begin a gradual implementation of the
recommended changes to workforce distribution across skills groups and translate
the findings of the human resources study into a two-year plan to close the
identified capacity and capabilities gaps, enhance compensation packages to attract
and retain talent, improve human resources performance and consequence
management, upgrade human resources technology and reinforce automation. It
will be of the utmost importance for resources to be allocated in 2020 and 2021 to
realign IFAD’s workforce and accelerate investments leading up to IFAD12. Any
delay in following up on the recommendations could mean losing the momentum of
institutional change underpinning the drive towards operational excellence,
potentially leaving IFAD unfit to cope with the demands and challenges ahead.
11. As the second year of IFAD11, 2020 will be pivotal for delivery of the programme of
work. Following a record delivery of new project financing in 2019, the 2020 PoLG
is projected at US$1 billion, reflecting Management’s intention to balance delivery
of new projects and focus on the quality and performance of projects under
implementation, with a view to achieving IFAD11 targets.
12. To summarize, IFAD’s primary objectives for 2020 will be to: (i) achieve the
planned PoLG with high-quality and relevant projects while ensuring improvements
in portfolio quality; (ii) engage effectively with a growing number of stakeholders,
including the governing bodies as part of the IFAD12 Consultation and the private
sector in the context of the new IFAD Private Sector Engagement Strategy
2019-2024; (iii) consolidate internal reforms through an extensive lessons learned
exercise on decentralization, business process reviews and regular mobility
exercises; (iv) revamp the financial architecture, including preparations for a
potential diversification of funding sources to meet increasing demand for
development projects; and (v) design and implement a comprehensive action plan
to address the recommendations of the human resources study on workforce
capacity and capability shortages.
13. IFAD’s programme of work is a comprehensive package of measures aimed at
improving organizational efficiency, addressing the adequacy of human resources
and maximizing results. Management intends to deliver on this ambitious agenda
by coupling a cost-effective approach and alignment of resources to strategic
priorities with a targeted capacity investment budget to prepare IFAD to face the
emerging operational opportunities and challenges ahead and achieve
transformative impact.
II. Current perspective
A. Update on 2019 programme of loans and grants
14. As at 2 October 2019, the projected PoLG for 2019 is US$1.76 billion, comprised of
37 new projects and additional financing for 12 ongoing projects. Among the
additional financing proposals: (i) five are to fill already identified financing gaps;
(ii) three are to scale up ongoing operations; and (iii) four include both financing
gaps and plans to scale up successful operations.
15. This target, representing approximately 50 per cent of the PoLG for IFAD11, is
consistent with the target presented in the high-level preview in
September 2019 – a historic level of delivery for the first year of a replenishment
cycle.
16. Under the global, regional and country grant programme, between 30 and 35
grants are expected to be approved by the end of 2019, for an approximate value
of US$58 million.
Portfolio
17. As at 2 October 2019, there are 235 projects in the portfolio for a value of
US$8 billion. The active grant portfolio comprises 159 grants valued at

GC 43/L.6/Rev.1
4
US$201 million. Projected disbursements for the year are estimated at
US$910 million.
B. 2018 and 2019 net regular budget usage
2018 actual utilization
18. Actual expenditures against the 2018 regular budget amounted to
US$146.95 million or 94.5 per cent of the approved budget of US$155.54 million.
The slightly lower utilization (compared to 97.3 per cent in 2017) is primarily due
to the results of the reassignment exercises and decentralization having delayed
the release of vacancies and thus generating savings on the staff budget
component, as well as efficiency gains generated by internal reforms.
Table 1 Regular budget utilization – actual 2017-2018 and forecast 2019 (Millions of United States dollars)
2017 full year 2018 full year 2019 forecast
Budget Actual Budget Actual Budget Forecast
Regular budget 149.42 145.33 155.54 146.95 158.21 151.53
Percentage utilization 97.3 94.5 95.8
2019 forecast
19. Following a year of transition, and in light of increased efforts to deliver on the
aggressive PoLG target of US$1.76 billion, budget utilization in 2019 is expected to
be around US$151.53 million or about 95.8 per cent, compared to the 97 per cent
estimate in the high-level budget preview.
20. The slightly lower projection is based on the latest actual utilization up to
June 2019 and projections for the rest of the year, and reflects a lower usage of
full-time equivalents (FTEs) due to vacant positions resulting from reassignment
exercises and normal recruitment time lags. In addition, the strengthening of the
United States dollar vis-à-vis the euro in 2019, with the current exchange rate of
0.90:1 being significantly higher than the rate of 0.841 assumed for the 2019
budget preparation, has had a positive impact on the euro components of staff
salaries and other euro-denominated expenses. This may continue to result in
lower costs in dollar terms during the fourth quarter, hence a slightly lower budget
execution.
21. Table 2 shows both 2018 actual expenses and the 2019 forecast broken down by
department.
Table 2 Regular budget usage by department, 2018 actual, 2018 budget and 2019 forecast (Millions of United States dollars)
Department Actual 2018
Budget 2019
Budget 2019
(realigned)* Forecast
2019
Percentage 2019
forecast vs. realigned budget
Office of the President and Vice-President (OPV) 2.32 2.60 2.78 2.76 99
Corporate Services Support Group (CSSG) 6.77 9.21 8.92 8.51 95
External Relations and Governance Department (ERG) 15.93 18.33 17.36 16.58 96
Strategy and Knowledge Department (SKD) 13.47 15.92 15.84 15.02 95
Programme Management Department (PMD) 58.95 65.23 63.23 59.71 94
Financial Operations Department (FOD) 11.68 13.63 13.63 13.22 97
Corporate Services Department (CSD) 28.18 26.66 26.40 26 98

GC 43/L.6/Rev.1
5
Corporate cost centre 9.65 10.07 10.07 9.73 97
Planned reductions - (3.43) - - -
Total 146.95 158.21 158.21 151.53 95.8
*The realigned budget reflects the revised organizational structure effective on 30 April 2019.
22. The relatively higher utilization compared to 2018 arises largely from a higher fill
ratio during 2019, although the capacity to fill newly created decentralized
positions and the relatively longer time lag to recruit local staff has impacted the
budget execution of departments where these positions are located, mainly PMD
and SKD.
23. Overall, the projected lower percentage utilization of some departments in 2019 is
primarily due to vacant positions but also to Management's efforts to reduce costs
across the board through institutional reforms and improvements to business
processes. The efficiency gains introduced by the revised organizational structure
exercise launched in the second quarter of 2019 started to materialize in the third
quarter of the year, and the merger of the Office of Partnership and Resource
Mobilization Office (PRM) and the Global Engagement and Multilateral Relations
Division (GEM) to create the Global Engagement, Partnership and Resource
Mobilization Division has produced cost savings in ERG. Similarly, the
reconfiguration of the Office of Strategic Budgeting (OSB) and resulting
redistribution of the organizational development function has generated savings in
the (CSSG).
24. Management's efforts to achieve savings by controlling costs and seeking efficiency
gains, while ensuring delivery of the programme of work, will result in lower
utilization in 2019. The final year-end utilization will depend on the results of these
efforts and other factors.
25. The flexibility to carry forward an amount in excess of the usual 3 per cent has
proved pivotal in helping Management address new strategic priorities during 2019.
As in the 2019 budget proposal, Management requests authority to use savings
from a lower budget utilization, up to a maximum of 5 per cent, to fund new
strategic initiatives in 2020 and support unforeseen and compelling priorities from
planned operations and activities. In accordance with standard practice, details of
the allocation of all carry-forward funds will be provided to the Executive Board.
This request has been included in the draft Governing Council resolution for the
2019 budget, which is provided in part V of this document.
C. 2018 carry-forward allocation
26. The 3 per cent carry-forward rule, in place since 2004, states that unobligated
appropriations at the close of the financial year may be carried forward into the
following financial year up to an amount not exceeding 3 per cent of the approved
annual budget of the previous year.
27. For 2019, the Governing Council approved that unobligated appropriations at the
close of financial year 2018 be carried forward into the 2019 financial year up to an
amount not exceeding 6 per cent of the corresponding appropriations to fund new
initiatives and provide the necessary flexibility to fast-track the implementation of a
higher mandatory age of separation.
28. As the actual utilization for 2018 amounted to 94.5 per cent, the carry forward
available was US$8.59 million or 5.5 per cent of the total 2018 approved budget,
less than the maximum of 6 per cent. As of mid-October, US$8.14 million had been
allocated, of which approximately US$3.9 million has already been utilized
(i.e. 52 per cent). As a number of commitments and important activities will need
to be undertaken during the fourth quarter, it is expected that the 2018
carry-forward resources will be fully utilized. Any unallocated and unused balance
will revert back to IFAD's regular resource pool.

GC 43/L.6/Rev.1
6
29. The slightly larger 2018 carry forward provided additional room to accommodate a
high level of departmental requests related to important and urgent deliverables
that were not foreseeable at the time of budget preparation. Important strategic
undertakings included complementary measures to enhance PoLG quality, critical
operational capacity enhancement at hub level, financial architecture and financial
risk management enhancements, the IFAD 2.0 study and replenishment
preparations.
30. Key activities have been identified and are being implemented by the Human
Resources Division (HRD) in regard to staff performance evaluation, staff capacity
and skills development. In addition, an action plan to meet urgent needs identified
as a result of the 2019 Global Staff Survey was also resourced from the carry-
forward envelope up to US$1.48 million, including the IFAD Innovation Challenge
and a staff exchange programme. The Innovation Challenge was intended to
generate and promote ideas among IFAD staff around leveraging partnerships,
eliminating bureaucracy, enhancing connectivity and integrating data analytics.
Also, through the staff exchange programme, IFAD has started to set the stage for
building capacities and synergies with other international financial institutions. A
table showing the use of the 3 per cent carry-forward resources and the prioritized
activities financed by each department is provided in annex VIII.
31. These high-priority items would otherwise have increased pressure on IFAD's
regular budget in 2020 and postponed delivery of the targets set. One important
lesson learned from previous cycles is that a carry-forward exercise can create an
incentive for generating savings throughout the year in order to enable the
strategic repurposing of unobligated appropriations of previous financial years.
32. In light of the benefits observed this year with a higher cap on carry-forward
allocation, Management proposes to regularize this approach. For 2020,
Management is requesting the authority to use savings from a lower budget
utilization, up to a maximum of 5 per cent (beyond the normal 3 per cent
carry-forward), to fund new strategic initiatives.
III. Gender sensitivity of IFAD’s loans and grants and
regular budget 33. Pursuant to the United Nations System-wide Action Plan on Gender Equality and
Empowerment of Women, IFAD is continually seeking to improve its resource
allocation to gender activities. The increase in the number and deployment of
gender and social inclusion analysts and specialists in each of the five regions is
steering the organization in this direction.
34. The 2020 budget retains the methodology developed in 2013 to: (i) determine the
gender sensitivity of loans and grants; and (ii) capture gender-related elements of
the regular staff budget. The new budget planning system introduced in 2019 is
designed to facilitate the mapping of staff and non-staff costs to the mainstreaming
themes. As this new functionality is refined and implemented in the coming years it
will allow for a more precise, system-based capture of resource allocation by
mainstreaming theme.
35. The outcome of this year’s exercise is outlined in the following paragraphs.
Gender sensitivity of IFAD loans
36. The gender sensitivity of IFAD's loan portfolio is measured at design stage in terms
of value (figure 1). Out of 40 loans approved in 2018, totalling US$1.025 billion,
28 projects or approximately US$868 million qualified for the analysis and
71.4 per cent of the loan value was rated moderately satisfactory and above
compared to 80 per cent in 2017 and 82 per cent in 2016.

GC 43/L.6/Rev.1
7
37. The proportion of the total loan value classified as gender transformative declined
to 14.6 percent compared to 23 per cent in 2017 and 26 in 2016, 21 per cent in
2015 and 18 per cent in 2014.
38. These trends are partly due to: (i) more stringent criteria for gender
transformativity; and (ii) a reduced focus on in-depth gender equality and women's
empowerment assessments during missions.
Figure 1 Distribution of total approved loan value by gender score (Percentage of total loan value)
Gender sensitivity of IFAD grants
39. A gender sensitivity analysis of the 35 grants approved in 2018 for a total value of
US$52 million (figure 2) reveals that 85 per cent of grants by value are rated
moderately satisfactory or above, compared to 72 per cent and 80 per cent in 2017
and 2016. The proportion of grants classified as gender transformative is
27 per cent, the same as in 2017 and much higher than the 8 per cent posted in
2016.

GC 43/L.6/Rev.1
8
Figure 2 Distribution of total grant value approved in 2014-2017 by gender score (Percentage of total grant value)
Capturing gender-related and supporting activities in the regular budget
40. The first attempt to quantify the gender sensitivity of IFAD’s regular budget was
presented in the 2014 budget document. A more accurate method of capturing
gender-related data with better attribution was integrated into the 2015 and 2016
budget preparation processes. This captured gender sensitivity in IFAD’s regular
budget more comprehensively, within the constraints of currently available
systems. As part of IFAD’s drive to improve its approach and data collection, for
the 2017 budget the OSB collaborated with IFAD's gender specialists to review the
gender allocation for each staff position in the organization to ensure that the data
more accurately reflect the gender component of staff time. In preparing the 2020
analysis, the impact of the net increase in positions has been layered onto the
2019 baseline.
41. The overall result of this year’s exercise points to a continuing positive trend in the
percentage of the total staff cost spent on gender-related activities: from
8.9 per cent in 2018 to 9.1 per cent in 2019 and 9.3 per cent in 2020. On a
departmental basis, the highest gender mainstreaming rate is in SKD, at
16.7 per cent, primarily due to the key focus on gender within the Environment,
Climate, Gender and Social Inclusion Division (ECG). The second highest is in the
PMD, at 13.4 per cent on average considering all divisions and 14 per cent or
higher for the regional divisions.
42. IFAD will continue to improve its approach and validate its data to further enhance
reporting on gender sensitivity by seeking inputs from other organizations
undertaking similar work, leveraging the new budget software now being
implemented.
IV. 2020 programme of work 43. Following a record delivery of new project financing in 2019, IFAD’s portfolio of
projects under implementation is expected to reach unprecedented levels. This will
require stronger focus on targeted start-up support and implementation to improve
performance and quality – which is reflected in an increased budget for supervision
and implementation support and enabling programme functions (see annex III).
44. Given the focus on implementation, and as an effort to balance the delivery of new
projects over the remainder of IFAD11, the POLG for 2020 is planned at
US$1 billion. IFAD will continue to make a concerted effort to supplement this core
programme with approximately US$90 million in IFAD-managed funds mobilized
from other sources, bringing the total PoLG to US$1.15 billion. IFAD has already
0 10 20 30 40 50 60
Not relevant
Gender aware (score = 3)
Partial g mainstreaming (score = 4)
Gender mainstreaming (score = 5)
Gender transformative (score = 6)
2018
2017
2016
2015 (July-Dec)
2014-15

GC 43/L.6/Rev.1
9
built up its pipeline for 2020 based on cross-departmental subregional hub plans
and in-country consultations.
45. Management continues to put emphasis on quality at entry and on improving the
performance of projects under implementation with a view to achieve IFAD11
targets, including in the four mainstreaming areas. This includes increased
supervision and implementation support to problem projects.
Table 3 Actual and projected PoLG (Millions of United States dollars)
Actuala Forecast Planned
2016 2017 2018 2019 2020
IFAD loans (including loan component grants) and DSF grants 741 1 293 1 137 1 701 1 004
IFAD grants 48 51 52 58 58
Total IFAD PoLG 789 1 344 1 189 1 759 1 062
Other funds under IFAD managementb 69 63 104 74 90
Total PoLG 859 1 408 1 293 1 833 1 152
Cofinancing, international (net of IFAD-managed cofinancing) and domestic 486 914 1 229 3 265 876
Total programme of work 1 345 2 322 2 523 5 098 2 028
Portfolio under implementation 6 860 6 846 7 051 n.a. n.a.
a Source: Grants and Investment Projects System as at 2 October 2019. Current amounts reflect any increase (decrease) in financing during implementation, including additional domestic and international cofinancing. b Other funds managed by IFAD, including the Adaptation for Smallholder Agriculture Programme (ASAP), the Spanish Food Security Cofinancing Facility Trust Fund (Spanish Trust Fund), Global Environment Facility/Least Developed Countries Fund, Global Agriculture and Food Security Program, European Commission and European Union, and the Green Climate Fund, in addition to bilateral supplementary/complementary grants.
46. Some 35 new projects and programmes and two additional financing proposals are
being prepared for approval during 2020 (see annex I).
47. IFAD is enhancing its operational tracking systems to better calculate the indicative
distribution of its pipeline of investments by thematic focus/mainstreaming themes
and linkages to Sustainable Development Goals. The high-level distribution of the
current portfolio by sector is as follows:
Table 4 High-level distribution of the current portfolio by sector IFAD current portfolio financing by sector as at 31 Dec 2018
Sector Percentage
Agriculture and natural resource management 34
Rural financial services 19
Market and related infrastructure 14
Community-driven and human development 7
Policy and institutional support 8
Small and micro enterprises 6
Other* 13
Total 100
Source: Annual Report 2018. * Includes: disaster mitigation, energy production, knowledge management, monitoring and evaluation (M&E) and other project management costs.
48. The estimated number of global/regional grants in 2020 is between 30 and 35, for
a total of US$58 million. The priority areas of IFAD’s grant programme for
IFAD11 remain:
(i) Production for food security, nutrition and income generation;
(ii) Climate change, resilience and environmental sustainability;
(iii) Gender equality and women’s empowerment;

GC 43/L.6/Rev.1
10
(iv) Opportunities for youth; and
(v) Business opportunities and partnership with private sector.
49. Other grant proposals may be developed to address strategic corporate priorities
such as systems-related aspects defined in the IFAD11 commitments, including
M&E, information and communications technology for development, corporate
citizenship and transparency, as well as other emerging innovations that have clear
potential to contribute to IFAD operations.
V. 2020 net regular budget
A. Introduction
50. The 2020 budget addresses the primary objectives for the organization as outlined
in section I, ensuring the focus of resources on:
(i) Implementation and delivery of the planned PoLG with enhanced quality of
the project portfolio including rural transformation and mainstreaming
gender, nutrition, climate and youth;
(ii) Effective engagement with a growing number of stakeholders, including
governing bodies in connection with the IFAD12 Consultation and the private
sector in the context of the new IFAD Private Sector Engagement Strategy
2019-2024;
(iii) Consolidation of internal reforms through an extensive lessons learned
exercise on decentralization, business process reviews and introduction of
regular reassignment exercises;
(iv) Revamping of IFAD financial architecture including preparations for a potential
diversification of funding sources, technology and innovation through
accelerated investments;
(v) Implementation of a comprehensive action plan to address capacity and
capability gaps, enhance strategic human resource enablers and improve the
employee value proposition.
51. While there are a number of real cost drivers such as additional staffing to further
reinforce IFAD’s field presence and capacity in ICOs and SSTC centres, they have
been fully offset through reductions in several other cost categories to achieve zero
real growth and contain any inflationary adjustment in the 2020 budget.
B. Budget process
Strategic prioritization
52. Pursuant to recommendations from multiple reviews completed in 2018, an
enhanced strategic prioritization and budgeting process was introduced in 2019 to
create a stronger alignment between resource allocation decisions and strategic
priorities. As such, the mid-year review and carry-forward exercise for 2019 were
conducted in line with the most pressing priority activities identified by senior
Management. In preparation for the 2020 budget cycle, these priorities were
consolidated, weighted based on their relevance to IFAD’s corporate direction and
financial implications for the 2020 budget and communicated to departments to
inform their budget submissions.
53. Identified priorities cover the key focus areas for strengthening IFAD’s
organizational base, diversifying the resource base and increasing impact.
Highlights are as follows:
(i) Programmatic activities;
(ii) Human resources enhancement, encompassing talent and performance
management as well as right-sizing both in level and staffing;

GC 43/L.6/Rev.1
11
(iii) Risk management;
(iv) Increased engagement in the context of the IFAD12 Consultation and the
Private Sector Engagement Strategy; and
(v) Mainstreaming of gender, nutrition, youth, climate and environment.
54. The exercise also shed light on a number of instances where investments could be
spread out over several years or savings could be achieved through efficiencies to
increase the amount of resources invested in the priority areas. These include:
(i) Knowledge management and research;
(ii) Logistics with regards to the establishment and set-up of ICOs as one-off
implementation costs incurred in previous years are now expected to be
amortized through efficiency gains;
(iii) Active participation in non-strategic network events; and
(iv) Internal workshops and business meetings.
55. In reviewing individual proposals, OSB adopted a clearly defined holistic approach
to identify commonalities among submissions and promote savings by reducing or
eliminating activities duplicated across the house or already covered by other
funding sources. Embedding strategic prioritization within the budget process is
enhancing intra- and interdepartmental cohesion for proposal submission, thereby
ensuring that resource allocations focus on what is required to deliver on
organizational strategic objectives and ultimately achieve greater impact.
56. Since the introduction of institutional output groups (IOGs) three years ago, IFAD
has accumulated data on the distribution of administrative resources and is now
able to focus on constructive analysis of trends. As part of the newly introduced
strategic prioritization process, plans call for further expanding the scope of this
analysis by linking corporate priorities to institutional outputs so as to better set
the drivers for organizational growth and resource distribution.
Staff budget process
57. The process for ensuring workforce alignment with corporate priorities in terms of
numbers, competencies and skills was streamlined in 2019. The responsibility for
addressing workforce matters has been redistributed among three key players,
i.e. OSB, HRD and the newly established Change Delivery and Innovation Unit
(CDI).
58. As part of the 2020 budget preparation process, departments were invited to
submit their staffing requirements through IFAD’s new budget planning software –
Oracle Hyperion - bearing in mind that any incremental request would need to be
offset by either a proposed reduction of an existing vacant position within their
department or a decrease in their non-staff costs requests relative to 2019. The
departments distributed their staff costs using IOGs.
59. The requests were reviewed by the HRD and CDI teams in the context of the recent
lessons learned exercise on the outcome of decentralization, corporate priorities
and organizational needs.
60. Taking into consideration the findings of the human resources study, an effort has
been made to address some of the capacity gaps identified in areas such as
development finance, legal and risk, using the regular budget. The proposed 2020
staffing complement is detailed in section D.

GC 43/L.6/Rev.1
12
Non-staff budget process
61. Budget preparation guidelines for non-staff costs were provided to each
department, and included budget parameters and overall non-staff cost envelopes
for each department, based on the realigned 2019 budget. With a new system in
place and an enhanced focus on strategic prioritization of planned activities, OSB
and information and communications technology (ICT) worked closely with
departments as they planned for 2020, seeking to prioritize within a context of zero
real growth budget.
62. As indicated, submissions were prepared using the same IOGs as the previous year
and no new IOGs were introduced for 2020. A list of the IOGs, together with an
indicative budgetary breakdown, is provided in annex III.
63. A separate submission was required for incremental activities to be charged to
complementary and supplementary funds management fees, for inclusion in the
gross budget for 2020.
64. OSB reviewed all budget submissions in the context of corporate priorities and
directions set by Management. As in previous years, a review of the timelines for
completion of ongoing capital projects was undertaken, and the corresponding
recurrent costs and depreciation for 2020 were estimated on the basis of actual
depreciation incurred up to June 2019. An in-depth analysis was conducted to
review the general inflation and price adjustments applicable to specific cost items,
in particular travel and consultancy.
65. Finally, the guidance, feedback and inputs provided by the Audit Committee and
Executive Board during their deliberations on the high-level preview in September
were taken into account in preparing the final budget. A systematic effort was
made to analyse the root causes of the nominal increase presented in the
high-level preview and realign assumptions based on accurate calculations of
trends in actual expenditures.
C. Assumptions
Exchange rate and inflation rate assumptions
66. Using the agreed foreign exchange rate calculation methodology1, the exchange
rate for 2020 is EUR 0.885:US$1, compared to last year's exchange rate of
EUR 0.841:US$1, also used in the high-level preview. This strengthening of the
United States dollar against the euro has had a significant impact on the 2020
budget proposal, primarily by lowering the cost of euro components of staff salaries
and allowances, and other euro-denominated expenditures. This has been factored
into standard staff costs.
67. The inflation adjustment for the 2020 budget is based on the agreed methodology,
using specific inflation numbers for several line items and a weighted average of
the world and Italian consumer price indexes for all other costs.2
68. A detailed review was performed of the actual consultancy and travel costs incurred
between 2018 and 2019 to determine the inflationary components of such drivers.
For consultancies there has been a minor increase in average contract value of
approximately 2.5 per cent, possibly resulting from higher average daily fees. This
percentage has been used as an inflation adjustment for consultancy costs.
69. Regarding travel costs, extensive implementation of decentralized ticketing has not
only generated efficiencies and reduced travel costs but also allowed more travel
data to be captured by corporate systems. An overall minor increase of
1.5 per cent was seen, mainly due to increases in travel tickets and the daily
1 The average of the United Nations Operational Rates of Exchange for the period October 2018 to September 2019. 2 Italian CPI and world CPI as of June 2019, as published by IMF: respectively 1.1 per cent and 3.9 per cent.

GC 43/L.6/Rev.1
13
subsistence allowance (DSA) for some locations. This percentage has been used as
an inflation adjustment for the travel cost component.
70. A weighted average of 1.88 per cent was adopted for all other costs.
Staff cost assumptions
71. Staff costs for the 2020 budget are based on the following assumptions:
(i) As in previous years, standard staff costs were developed separately for each
grade level, adjusted for the weighted distribution by salary step based on an
analysis of statistical data of the actual IFAD staff population. An in-depth
analysis of standard staff costs was performed for General Service and
Professional staff categories located at both headquarters and ICOs, by
reviewing actual payroll costs – available in IFAD systems for headquarters
and obtained from the United Nations Development Programme for field-
based staff - and analysing the trend in post adjustments and exchange rates
applicable to field-based staff. The analysis factored in increased mobility
among Professionals and related allowances, embedding potential raises in
salary scales and/or salary components (pensionable remuneration) and
including the effects of the normal within-grade step increment (WIGSI) and
the EUR/US$ exchange rate.
(ii) The standard costs for 2020 incorporate the following:
a) Average post adjustment variation including multipliers applicable to all
locations where IFAD has staff (impact on standard costs - decrease);
b) WIGSI (impact on standard costs-base salary – increase);
c) Increase in pensionable remuneration for Professionals and above as
normally applied by the International Civil Service Commission in
February (impact on standard costs – slight increase);
d) Increase in General Service secondary scale usually applied in April
every year (impact on standard costs – minor increase);
e) Salary scales and exchange rate variation applicable to field-based
General Service and National Professional staff (impact on standard
costs – significant decrease); and
f) Exchange rate of EUR 0.885:US$1 for 2020 (impact on standard costs –
substantial decrease, especially for General Service staff).
(iii) While there is no change in salary structure, the normal WIGSI constitutes a
price increase.
D. Proposed staffing level
72. The approved 2019 level of 632.5 FTEs was used as the baseline for 2020. This
included 632.5 FTEs funded from the regular budget and 1.0 FTE performing core
functions funded from other sources.
73. The proposed staffing level for 2020 is 658 FTEs, or a net increase of 25.5 FTEs.
The increase is the net effect of 44 new staff positions proposed for 2020, less staff
reductions arising from the organization's efforts to reduce costs and improve
efficiency following the results of fit-for-purpose reviews conducted in 2019,
amounting to 18 FTEs.
74. The 44 new staff positions across different departments can be summarized as
follows:
(i) Seventeen FTEs in PMD located in the field, including administrative positions
providing cross-departmental support and country programme managers,
required to complete the staffing of hubs and SSTC decentralized offices;
GC 43/L.6/Rev.1
14
(ii) Two positions dedicated to the enterprise risk management framework
functions to be located in OPV;
(iii) Four positions in SKD to boost IFAD’s private sector strategy, mainstreaming
activities and investment in ICT4D;
(iv) Three positions in FOD to strengthen the development finance area and
reinforce financial and fiduciary activities at field level;
(v) One position dedicated to the areas of compliance and control applicable to
FOD and Office of Audit and Oversight activities, as well as one position in
Office of the General Counsel (LEG) to support corporate matters as well as
programme-related operations;
(vi) Two positions in the Communications Division to enhance communication
capacity in the field;
(vii) Three positions in ICT to adequately support and maintain the portfolio of
services and applications; and
(viii) Eleven FTEs in accordance with the fit-for-purpose reviews conducted in 2019
and organizational changes made in 2018.
75. The total reduction of 18 FTEs as part of IFAD's drive for efficiencies includes both
Professional and General Service staff. The reductions result from: (i) mergers and
consolidation of divisions and units; and (ii) phasing out of field and headquarters
positions as a result of streamlining and decentralization, the outcomes of the fit-
for-purpose exercise and a review of organizational needs at ICOs. A number of
these reductions have already been implemented in 2019 through reassignment
exercises.
76. As of 2019, only one position is currently funded from supplementary fund fees
(28 positions have already been absorbed into the regular budget over the last five
years). It is proposed that this position continues to be funded from supplementary
fund fees as it directly supports the related activities.
77. Of the total staff numbering 658 FTEs funded by the regular budget, an estimated
217 positions will be based in the field in 2020, compared to 111 positions
outposted in 2017 before the decentralization exercise began. This will bring the
total number of outposted staff to 33 per cent of total IFAD staff (compared to
30 per cent last year), combining an enhanced field presence with a lean and
efficient headquarters structure.
78. The number of positions chargeable to management fees and funded from the
gross budget will be 15.25 FTEs. This is a net increase of one FTE compared to
2019, resulting from the planned reduction of one position in PMD and two
additional positions in LEG and FOD, respectively, to address incremental work
related to supplementary funds management and increased engagement with
donors and the private sector.

GC 43/L.6/Rev.1
15
Table 5 Indicative staffing requirements, 2017-2020 (Full-time equivalents)
Approved
Department 2017 2018
(realigned) 2019 2019
(realigned) Proposed
2020
Total change 2019
(realigned) vs. 2020
Office of the President and Vice-President 11 12 12 14 15.5 1.5
Corporate Services Support Group 94 43 48 46 45 (1)
Partnership and Resource Mobilization Office 20 - - - - -
External Relations and Governance - 82 94 85 83 (2)
Strategy and Knowledge Department 25 76 78 78 82 4
Programme Management Department 283.9 242.8 263 235 249 14
Financial Operations Department 66 68 74 74 77 3
Corporate Services Department 103.5 103.5 103.5 100.5 106.5 6
Positions to be reduced - - (40) - - -
Total staff funded by regular budget
603.4 627.3 632.5 632.5 658 25.5
Staff FTEs funded by other funding sources 1.50 1 1 1 1 1
Total staff funded by regular and other sources
604.9 628.3 633.5 633.5 659 26.5
Staff FTEs chargeable to management fees* 13.25 13.25 14.25 14.25 15.25 1
* Staff with coterminous contracts funded from the gross budget.
79. Indicative 2020 staffing levels funded by the regular budget and by department
and grade are set out above and in annexes IV and V. Departmental figures are
gross of planned reductions. The cost implications of the staff budget exercise are
set out in subsection E below. The funding and recruitment of new positions will be
carefully planned and prioritized during 2020 in accordance with operational needs.
E. Cost drivers
80. The final real and price-driven cost drivers for the 2019 budget proposal are as
follows:
(i) Real cost drivers:
Staff costs
Additional staffing relates to: (i) support needed in regional hubs and
ICOs to complete the mapping of decentralized offices and improve
programme delivery; (ii) strengthening of the enterprise risk
management framework; (iii) the increased emphasis on private sector
engagement, ICT4D, mainstreaming themes and social inclusion;
(iv) support to IT architecture and evolving needs; (v) legal, compliance
and control activities; (vi) enhanced development finance and fiduciary
support in the field; and (vii) the findings of the fit-for-purpose reviews.
This will result in 44 additional positions.
Staff position reductions arise from: (i) the merger of GEM and PRM;
(ii) rationalization of front office functions at headquarters; and (iii) the

GC 43/L.6/Rev.1
16
result of workforce realignment due to corporate reviews and reforms.
This will result in a reduction of 18 FTEs.
The overall net impact is estimated at 25.5 FTEs for a US$2.09 million
real increase in staff costs. In an effort to minimize this impact, it is
proposed that some of the additional new positions be deferred in line
with operational needs and the time needed to find and attract the right
expertise. The relatively small increase compared to the number of FTEs
is due to the fact that the majority of the new positions are local
recruits based in the field and the cost implications of the remaining
International Professional positions have been lowered by proposing the
deferral of recruitment.
Depreciation and other recurrent expenses related to capital
budgets
The net increase in depreciation in 2020 (net of fully depreciated capital
budgets) will be approximately US$100,000, due to costs related to the
ongoing annual and cyclical approved projects as estimated in the high-
level preview.
Incremental costs related to increased engagement with
governing bodies
Additional costs totalling approximately to US$330,000 are attributable
to more frequent meetings with governing bodies involving senior and
middle Management across departments, primarily materializing in a
slight increase in travel costs and administrative expenses.
IFAD’s decentralized offices
Estimated rent, common services and running costs of ICOs have been
adjusted to reflect the actual occupancy levels of hosted offices,
resulting in a net increase of approximately US$200,000.
81. The above real increases will be more than fully offset by a real reduction of
US$3.3 million, especially in consultancy and other administrative costs.
(i) Price drivers:
Staff costs
Staff costs for the 2020 budget were based on revised assumptions
compared to 2019. The overall net price-related adjustment in staff
costs amounts to US$1.04 million, or 1.09 per cent below 2019 staff
costs, primarily due to the revision of standard costs in line with
updated parameters. An overall WIGSI of approximately
US$0.63 million, compared to US$1.35 million estimated at the preview
stage, was embedded in the revised standard costs, partially offsetting
the effect of exchange rate variation and other factors.
Other costs
Based on the agreed methodology, using specific inflation numbers for
several line items and a weighted average of the world and Italian
consumer price index for all other costs will result in price increases.
Inflation adjustments to consultancy and travel cost components have
been reviewed by analysing data available in the relevant systems,
particularly trends in average consulting fees, travel tickets and DSA for
some locations.
82. The overall net price increase in the budget is US$0.3 million, which is materially
lower than the preview estimate as it now includes the significant impact of the
exchange rate changes and revised standard costs.
GC 43/L.6/Rev.1
17
F. Net regular budget proposal
83. As noted above, feedback from the Audit Committee and Executive Board on the
high-level preview has been taken into account in preparing the 2020 net regular
budget proposal. The latest budget estimates are based on detailed submissions
provided by the departments, which have been rigorously reviewed. In addition,
detailed costing was carried out, especially with regard to the impact of the
exchange rate.
84. The 2020 net regular budget is proposed at US$157.9 million, representing a
0.19 per cent nominal decrease compared to the 2019 budget of US$158.21 million
(vis-à-vis the 1.49 per cent nominal increase estimated in the high-level preview).
In addition to containing the real increase at zero as announced, an effort was
made to fully absorb price increases with additional reductions in non-staff costs.
This was facilitated by the effect of the revised exchange rate on euro-denominated
budget requirements. The baseline for comparison is the 2019 net regular budget,
realigned to reflect the impact of organizational structural changes performed
during 2019.
85. As indicated above, the zero real increase is the net effect of: (i) net real staff cost
increases (US$2,090,000); (ii) depreciation (US$100,000); (iii) estimated rent,
common services and running costs of ICOs (US$200,000); and (iv) incremental
travel and administrative expenditures for increased engagement with governing
bodies in preparation for IFAD12 (US$330,000), offset by a real decrease in
consultancy and other costs (approximately US$3.3 million).
Budget proposal by department
86. The budget proposal by department is set out in table 6.
Table 6 Regular budget by department, 2019 and 2020 (Millions of United States dollars)
Department Approved
2019 2019
(realigned) Proposed
2020 Total
change Change
(percentage)
Office of the President and Vice-President 2.6 2.78 3.18 0.40 14.4
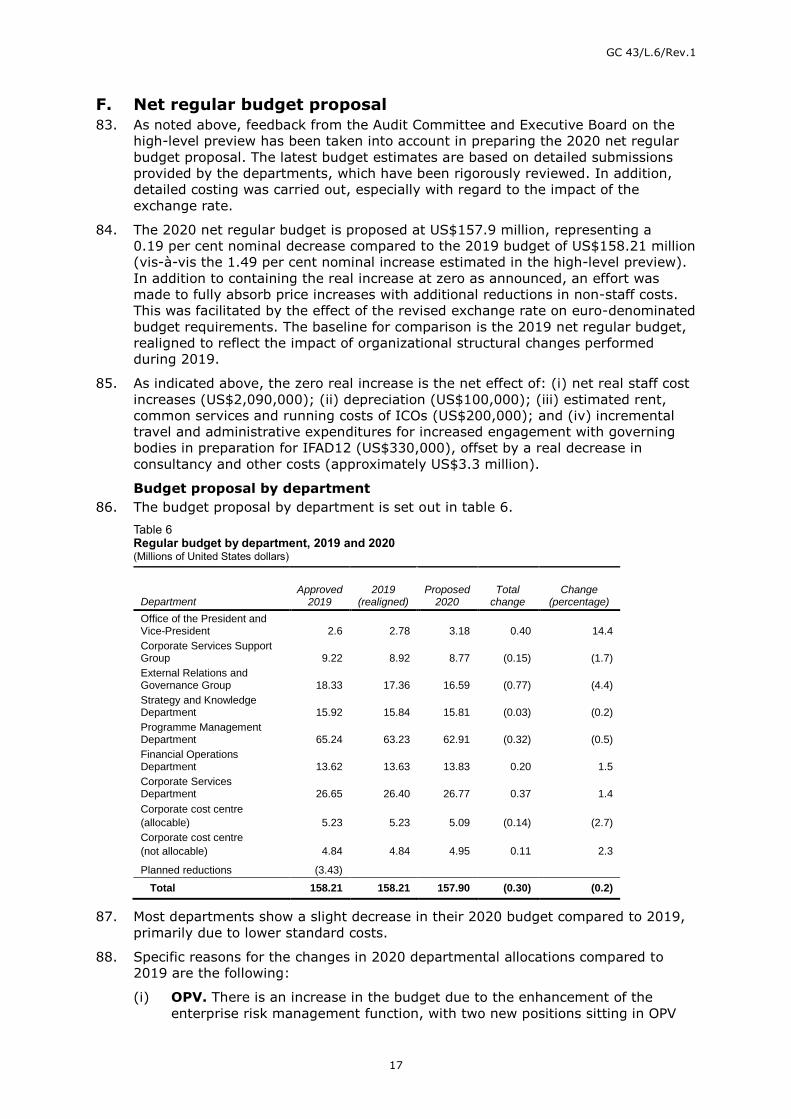
Corporate Services Support Group 9.22 8.92 8.77 (0.15) (1.7)
External Relations and Governance Group 18.33 17.36 16.59 (0.77) (4.4)
Strategy and Knowledge Department 15.92 15.84 15.81 (0.03) (0.2)
Programme Management Department 65.24 63.23 62.91 (0.32) (0.5)
Financial Operations Department 13.62 13.63 13.83 0.20 1.5
Corporate Services Department 26.65 26.40 26.77 0.37 1.4
Corporate cost centre
(allocable) 5.23 5.23 5.09 (0.14) (2.7)
Corporate cost centre
(not allocable) 4.84 4.84 4.95 0.11 2.3
Planned reductions (3.43)
Total 158.21 158.21 157.90 (0.30) (0.2)
87. Most departments show a slight decrease in their 2020 budget compared to 2019,
primarily due to lower standard costs.
88. Specific reasons for the changes in 2020 departmental allocations compared to
2019 are the following:
(i) OPV. There is an increase in the budget due to the enhancement of the
enterprise risk management function, with two new positions sitting in OPV
GC 43/L.6/Rev.1
18
but serving a corporate need for the whole organization. Additional non-staff
budget requirements have also been identified for increased engagement with
governing bodies in light of the IFAD12 Consultation and IFAD 2.0 agenda.
(ii) CSSG. There is a slight decrease in the CSSG budget compared to 2019, from
US$8.92 million to US$8.77 million. This net decrease is due to lower staff
costs being applied to existing positions, partially offset by an additional
position in LEG and a minor injection of non-staff costs to adequately fund
the incremental need for enhanced quality assurance activities along project
pipelines.
(iii) ERG. The decrease of US$0.77 million in the ERG budget is primarily due to
additional reductions in staff positions, including a Front Office Assistant, a
Budget and Administrative Officer and two Global Engagement Senior
Technical Specialists, resulting from fit-for-purpose reviews and the merger of
PRM and GEM into a single division.
(iv) SKD. Incremental positions have been absorbed within SKD’s budget
envelope by lowering consultancy and travel costs. Overall, SKD’s budget
remains relatively constant vis-à-vis 2019, although key activities such as
mainstreaming themes, impact assessment and private sector have been
adequately resourced.
(v) PMD. The minor decrease of 0.5 per cent is the result of departmental efforts
to contain cost increases and to fund new positions in the field by shifting
internal priorities, as well as the effect of lower standard costs. Within the
constraints of a zero real growth budget, PMD sought opportunities for
efficiency gains while increasing resources for activities directly contributing
to programme quality and delivery, and building ICO capacity, as well as
spreading investments in non-lending activities over the period 2020-2021.
(vi) FOD. The additional positions in the Financial Management Division will help
reinforce IFAD capacity in the development finance area, as well as ensure
adequate fiduciary support to programme operations. An effort was made to
accommodate core budget requirements, while lowering consultancy and
travel costs in other areas in order to offset the costs of the additional
positions. Overall the 2020 budget of FOD increases by 1.5 per cent.
(vii) CSD. The overall 2020 budget of CSD had to be adjusted compared to 2019
to include new positions created following the reassignment exercise and fit-
for-purpose reviews. In addition, in an effort to improve the organization's
capacity to maintain the portfolio of IT services and applications, three
additional ICT Specialist positions are being proposed in exchange for a
reduction in consultancy costs in excess of the incremental request. Overall
CSD envelope and non-staff cost components have been revised downwards
while ensuring due attention to corporate priorities such as implementation of
the Global Staff Survey Action Plan, human resource management and
performance evaluation, and recalibration of business processes.
(viii) Corporate cost centre. Costs under this heading are split between those
centrally managed institutional costs that are allocable, such as recruitment
and assignment costs, IFAD Client Portal recurrent costs and Microsoft
licensing costs, and those that are centrally managed but not allocable, such
as other depreciation and after-service medical costs.
The net increase of US$100,000 in non-allocable corporate costs is
primarily due to a rise in depreciation costs related to ongoing annual
and cyclical approved projects;

GC 43/L.6/Rev.1
19
The decrease in allocable corporate costs is primarily due to a minor
reduction in recruitment and assignment costs and other centrally
managed costs.
Budget proposal by summary cost category
89. The breakdown of the 2020 budget proposal across major cost categories is shown
in table 7. Annex II shows the departmental breakdown by cost category. The final
budget by cost category differs somewhat from the high-level preview as a result
of better cost estimates and cost reduction efforts and has been revised in
accordance with the exchange rate of EUR 0.885:US$1.
Table 7 Analysis of budget by summary cost category, 2019 and 2020 (Millions of United States dollars)
Cost category Approved
2019 Proposed
2020 Total
change Change
(percentage)
Staff 93.31 94.32 1.01 1.1
Consultants 22.94 22.51 (0.43) (1.9)
Duty travel 9.38 9.60 0.22 2.4 ICT non-staff costs 5.45 5.45 - -
Other costs 27.12 26.02 (1.10) (4.1)
Total 158.21 157.90 (0.30) (0.2)
90. Pursuant to the commitment made in 2019, consultancy costs for 2020 have been
lowered further, from US$22.94 million to US$22.51 million. The overall decrease is
1.9 per cent or around US$0.43 million. In addition to continually reviewing and
monitoring the use of external experts to contain related costs, consultancy costs
have been kept at a level that provides optimum value for money without having
any adverse impact on delivery levels and quality.
91. Duty travel shows a slight increase due to the upward trend in the cost of travel
tickets and DSA in certain locations where IFAD operations are located. The
inflationary effects have been contained by lowering travel costs to the extent
possible while considering the need for IFAD Management to enhance visibility and
outreach with Member States and partners.
92. Recurrent non-staff costs for ICT remain static compared to 2019, although major
efforts are expected to enhance and maintain overall ICT infrastructure.
93. The decrease in other costs is mainly due to the impact of the exchange rate
revision on euro-denominated expenditures and efficiency gains introduced to
business processes and operating procedures. In addition, a slight decrease in
assignment and recruitment costs has contributed to levelling down this cost
category.
Moving from clusters to pillars
94. IFAD constantly strives to be on the cutting edge in its approach to corporate
planning and budgeting, with the aim of effectively focusing resources on meeting
its strategic objectives. The shift from clusters to pillars three years ago has
improved the effectiveness of corporate planning and budgeting processes and
allowed for an enhanced focus on results.
95. As three years have now passed since the introduction of IOGs, cumulative data is
becoming available to analyse trends and draw meaningful conclusions on how
shifting areas of focus could translate into changes in spending and allocation
patterns. For this year’s budget process, IOGs were linked more closely to strategic
priorities and their relative contributions weighted. This information was
communicated to departments at the beginning of the budget process to inform the

GC 43/L.6/Rev.1
20
selection of IOGs in the preparation of budget requests and as a basis for
establishing a corporate approach to mapping costs to IOGs.
96. Table 8 below shows the 2019 budgets of departments and offices broken down by
pillar.
Table 8 Indicative breakdown of regular budget by results pillar, 2020 (Millions of United States dollars)
Pillar 1 Pillar 2 Pillar 3 Pillar 4
Department
Country programme
delivery
Knowledge building,
dissemination and policy
engagement
Financial capacity
and instruments
Institutional functions, services
and governance Total
Office of the President and Vice-President
0.10 0.22 0.04 2.82 3.18
Corporate Services Support Group 2.19 0.25 0.44 5.88 8.77
External Relations and Governance 0.95 6.68 3.21 5.75 16.59
Strategy and Knowledge Department 6.93 7.38 0.69 0.81 15.81
Programme Management Department 56.36 3.39 1.71 1.45 62.91
Financial Operations Department 6.38 0.02 6.40 1.03 13.83
Corporate Services Department 3.76 1.46 2.86 18.70 26.77
Corporate cost centre: 3.59 - 0.20 6.25 10.04
Corporate cost centre costs (allocable) 3.49 - 0.20 1.40 5.09
Corporate cost centre costs (unallocable) - - - 4.95 4.95
Subtotal 80.24 19.42 15.4 42.84 157.9
Percentage allocation 51 12 10 27 100
Total 157.9
97. The above table shows that 51 per cent of the total budget is in pillar 1, while
pillars 2- 4 account for 12 per cent, 10 per cent and 27 per cent respectively. The
breakdown is similar to 2019, with pillar 1 and pillar 4 showing a slight decrease of
1 per cent each compared to 2019, and pillar 2 and pillar 3 an equivalent increase
of 1 per cent. This minor redistribution can be explained as the result of
institutional efficiencies, mainly deriving from the front office harmonization
exercise conducted in 2019 and the enhanced focus on resource mobilization,
financial risk management and strengthening of financial architecture in 2020.
98. The breakdown of the budget for each pillar by IOG is shown in annex III, including
a comparison to the 2019 and 2018 budgets. Interesting insights can be drawn
from observing the trends in IOG distribution over the last three years. In line with
Management’s commitment in 2020 to engage with a growing number of
stakeholders and with the private sector, the IOGs related to communication and
outreach, replenishment and global policy engagement and global partnership all
show an increase from 2019 to 2020. SSTC is also among the activities for which
the amount of allocated resources has risen and investments in impact
assessments are growing to meet the demand for specialist expertise in this field.
Moreover, the stronger focus on start-up support and implementation to improve
the quality of the existing portfolio is reflected in an increased budget allocation for
supervision and implementation support and enabling programme functions.
99. As part of the IFAD11 Consultation, Management undertook a commitment to

GC 43/L.6/Rev.1
21
develop a tailored system to quantify the full costs of key business processes. The
initial groundwork for a new approach to tracking such costs was prepared in 2019.
This system will need to be further developed in 2020 in light of the ongoing
business process review of all core support processes, including consultant
recruitment and travel.
G. Gross budget proposal
100. IFAD implements and manages a number of operations for third parties that are
external but complementary to the PoLG. These operations are financed from
supplementary funds. Engaging in these partnerships involves additional
incremental costs for design, implementation, supervision and administration.
These costs are usually funded from management fee income through the
supplementary fund agreements.
101. The gross budget includes the net regular budget as well as resources required to
administer and support incremental work related to supplementary funds. The work
to carry out the core PoLG and related activities will continue to be funded by the
net regular budget. Separating the gross and net budgets ensures that fluctuations
in the workload related to supplementary funds do not affect the regular budget on
a yearly basis. Only incremental costs to support supplementary fund-related
activities for ASAP, the European Union, the Spanish Trust Fund and other bilateral
supplementary funds are included in the gross budget.
102. For 2020, the cost of supporting supplementary-fund-related work is
US$4.7 million over and above the net regular budget of US$157.9 million,
unchanged from 2019. This amount can be fully recovered from the annual
allocable portion of the fee income generated by ASAP, the Spanish Trust Fund, the
European Union and other bilateral contributions for which projected inflows are
expected to increase in 2020 with increased engagement with other donors.
103. As a result, the gross budget proposed for 2020 amounts to US$162.6 million
compared with US$162.91 million in 2019 and US$4.5 million in the preview
document. Approval is being sought only for the proposed net regular budget of
US$157.9 million. Table 9 provides a summary of the gross and net regular budget.
Table 9 Indicative gross and net budget for 2019 (Millions of United States dollars)
Cost category Approved 2019 Proposed 2020
Gross budget 162.91 162.6
Costs to support supplementary fund activities (4.70) (4.70)
Net budget 158.21 157.9
104. Management has updated IFAD’s guidelines on cost recovery from supplementary
funds. The new guidelines have already introduced greater harmonization with
other international financial institutions and United Nations agencies while
supporting IFAD's resource-mobilization goals and ensuring cost recovery in line
with Governing Council resolutions. As part of the business process review
exercise, IFAD administration and management of supplementary resources is
currently subject to a thorough review, aiming to further streamline the allocation,
monitoring and execution of supplementary funded activities.
H. Efficiency ratios
105. For the overall IFAD10 period the ratio of total PoLG (including other IFAD-
managed funds) to gross budget (efficiency ratio 1) is 13 per cent. For 2020, based
on a PoLG of US$1 billion and the proposed gross budget of US$162.6 million, the
administrative efficiency ratio for 2020 is expected to be 14 per cent. This increase
compared to 9 per cent in 2019 is due to the front loading of PoLG in the first year
of IFAD11 and Management’s decision to phase out the financing of new projects in

GC 43/L.6/Rev.1
22
order to support active portfolio implementation and strengthen its quality and
performance. The three-year rolling efficiency ratio for the period 2018-2020 is
currently projected at 11.9 per cent, below the IFAD10 rolling average and in line
with the IFAD11 target of 12.9 per cent.
106. If cofinancing is included, efficiency ratio 2 – based on the total programme of
work – is projected at 8 per cent in 2020, compared to 3 per cent in 2019 and
7 per cent for the IFAD10 period.
107. Efficiency ratio 3 was introduced in 2016 to measure the amount of portfolio
managed per dollar of budget expenditure. The monetary value of the current
portfolio at the end of 2018 was US$7.1 billion and hence the portfolio value as a
ratio of total costs was US$46 for every US$1 of budget expenditure. The amount
of portfolio managed per dollar of budget expenditure has increased, from
US$43 during the IFAD9 period to US$46 for IFAD10.
Table 10 Efficiency ratios (Millions of United States dollars)
Actual
2016 Actual
2017 Actual
2018 IFAD10 periodc
Projected 2019
Projected 2020
Programme of work
PoLG 789 1344 1189 3 323 1 759 1 062
Other IFAD-managed funds 69 63 104 237 74 90
Subtotal 859 1408 1293 3 560 1833 1152
Cofinancinga 486 914 1229 2 630 3 265 876
Total POW 1 345 2 322 2 523 6 189 5 098 2 028
Value of portfolio under implementation at end of period
6 860 6 846 7 051 n/a n/a
Total costs
Regular budget 141.8 145.3 146.95 434.08 158.2 157.9 Costs to support
supplementary fund activities 5 6 5.1 16.1 4.7 4.7
Total costs 146.8 151.33 152.05 450.18 162.9 162.6
Efficiency ratio 1: Total costs/PoLG incl. other IFAD-managed fundsb 17% 11% 12% 13% 9% 14% Efficiency ratio 2: Total costs/PoW 11% 7% 6% 7% 3% 8% Efficiency ratio 3: Portfolio/total costs 47 45 46 46 n/a n/a
a Amounts shown as cofinancing with other IFAD-managed funds reflect a revised cofinancing ratio target of 1:1.2 of PoLG. b Efficiency measure agreed as part of IFAD9. C Sourced from the Grants and Investments Projects System as at 2 October 2019. Actual amounts reflect any increase/decrease in financing during implementation, including additional domestic funding and cofinancing. Hence, some numbers may be different from those presented in the 2019 budget document.
108. Despite the 14 per cent total costs/PoLG efficiency ratio in 2020, current
projections indicate that efficiency ratio 1 for the overall IFAD11 period will be
similar to or slightly better than for IFAD10, and will remain within the target of
12.9 per cent. Maintaining a similar efficiency ratio throughout the IFAD10 and
IFAD11 periods would provide a solid baseline for improved efficiency ratios in
IFAD12, with increased resource mobilization and programme delivery.
109. In future years, the aim is to achieve a more client-responsive approach to PoLG
planning and pipeline development, and increase the elasticity of IFAD's
administrative budget. Accordingly, Management is focusing on target
administrative efficiency ratios, considered on a 36-month rolling basis as per the
Results Management Framework, as key parameters for the annual budget

GC 43/L.6/Rev.1
23
exercise. As IFAD seeks to address the human capital and technology capacities
and capabilities needed for its future operating model, holding efficiency ratios
steady will remain a strategic priority.
110. However, the goal of zero real growth and a flat budget trajectory in future years
should be reassessed in the context of the size of the overall portfolio and the need
to boost programme delivery, together with the evolving targets for efficiency.
VI. Capital budget for 2020 Regular 2020 capital budget request
111. As proposed in prior years, the capital budget will be split into two categories,
namely: (i) an annual capital budget to cover capital expenditures that are cyclical
or regular in nature and have an economic life of more than one year (e.g. normal
replacement of desktop and laptop computers undertaken every year and software
licence upgrades, and replacement of vehicles in ICOs); and (ii) a capital budget to
fund major IT and other investment projects, in line with available capacity for
undertaking such projects.
112. As IFAD moves strategically to enhance its financial risk management capacity and
strengthen its financial funding model by tapping the potential for more diversified
sources of funding, it is critical that the systems and business processes in support
of this paradigm shift are robust and fit for purpose, as well as being perceived as
positive by external credit rating agencies.
113. For 2020, an overall capital budget of US$4.445 million is proposed, comprising of
US$2.22 million to cover regular capital expenditures and an additional investment
of US$2.225 million for systems and upgrades related to the strategic re-shaping of
IFAD financial architecture. As foreseen in the preview and in line with the
recommendations of the corporate level evaluation (CLE) on IFAD’s financial
architecture and Alvarez & Marsal’s external risk review, opportunities for major
system enhancements have been identified to complete IFAD’s robust financial IT
architecture.
114. Of the total capital budget envelope, US$2.225 million will be dedicated to:
(i) Addressing the need for an enhanced treasury management system and
expanding electronic platforms to support financial portfolio management
operations, trading and compliance, fully integrating front and middle office
systems and thus enhancing data analytics and reporting needs across the
financial functions of the organization (US$800,000); and
(ii) Upgrading IFAD’s core banking system for lending activities management
(Flexcube) to support expanded borrowing requirements and comply with
industry recognized security standards (US$1,250,000). This also includes
support for the project pre-financing facility (PFF) for faster implementation
of project start-up (FIPS), which forms part of a transformative package
composed of IFAD’s enhanced business model and greater responsiveness to
borrowers and recipients (US$175,000).
115. The remaining US$2.22 million will cover the following expenditures:
(i) Cyclical IT infrastructure and hardware replacement (US$980,000), brought
down to a minimum through less frequent hardware replacements;
(ii) ICO enhancements including vehicle replacement (US$500,000);
(iii) Institutional efficiency initiatives including the development of a corporate
application for managing client and stakeholder relationships in an integrated
and consistent manner (US$200,000); and
(iv) Extraordinary maintenance for headquarters facilities and infrastructure,
including vehicles and enhancements to physical security of the headquarters

GC 43/L.6/Rev.1
24
building through replacement of the existing closed circuit television system
(US$540,000).
116. A number of capital budget requests have been deferred pending further evaluation
and as a result of efforts to limit the capital budget and related depreciation and
recurrent costs.
117. Based on the current accounting standards being applied by IFAD, depreciation is
charged on a straight-line basis over the estimated useful economic life of four
years for client hardware and six years for infrastructure hardware, up to a
maximum of 10 years for software development costs. Accordingly the incremental
depreciation for capital expenditure projects based on the current schedule of
completion is an estimated US$100,000 in 2020.
Table 11
Capital budget request, 2020 (Thousands of United States dollars)
2020 proposed
(a) Annual capital budget
IT regular hardware replacement 980
ICO set up, enhancement and vehicle replacement
500
(b) Other capital budget
Borrowing and financial risk management systems
2 225
Institutional efficiency 200
Facilities/infrastructure, HQ Vehicles and Security
540
Total 4 445
VII. Targeted capacity investment
118. IFAD has undertaken a path of ambitious reforms in recent years, which has
changed its way of doing business and expanded the kinds of support it provides to
countries. Important milestones were reached, including the decentralization of
IFAD’s business model, reviews of core business processes paving the way for
enhanced operational and institutional efficiency and a thorough assessment of
institutional risks leading to the establishment of a robust enterprise risk
management framework. Although this represents significant progress in the way
IFAD does business, its scale could prove inadequate in addressing current and
future challenges, in light of the enormous efforts needed to deliver on the
replenishment commitments and to meet the Sustainable Development Goals
(SDGs) by 2030. Management is cognizant that if the matter is not addressed in a
timely manner, costs could escalate in the future as the issues become
compounded.
119. Like other IFIs such as the International Finance Corporation (IFC), which in 2019
launched an extensive workforce planning exercise to “ensure the right people with
the right skills at the right seniority levels are in the right places to support
implementation of IFC 3.0 and boost WBG collaboration”,3 IFAD Management
initiated an organization-wide study on the organization’s current and future
workforce composition. The aim was to obtain clarity on the organization’s current
workforce composition and future human capital requirements to deliver on its
mandate.
120. The human resources study focused on three distinct areas, (1) strategic workforce
planning – to create a comprehensive view on the capabilities and capacities at
3 Strategy and Business Outlook Update FY20-FY22: Gearing up to Deliver IFC 3.0 at Scale.

GC 43/L.6/Rev.1
25
IFAD today and the implications for delivering the organization’s current and future
programme of work; (2) employee value proposition, to compare IFAD’s ability to
attract and retain key talent with that of similar institutions; and (3) strategic
enablers deemed necessary to realize the aspirations resulting from areas (1) and
(2) – performance management and technology required to catalyse overall
impact.
121. The study reveals gaps in meta skills and a number of specific skills groups such as
legal, oversight and integrity and technical specialists, and points to a lack of
capacity for the future as well as the growing need for adaptability to data-related
skills. The report also highlights differences in compensation packages compared to
other IFIs as a potential cause of the current difficulty in attracting specialized
talent. Options for addressing other relevant enablers affecting IFAD human
capital, such as performance and consequence management and associated
technology enhancements, are identified and proposed for consideration.
122. Following the results of this study and taking into consideration feedback received
from the Executive Board, Management intends to develop a comprehensive two-
year plan, indicating specific actions expected to take place in 2020 and 2021 or
crossing both years.
123. IFAD sought members’ endorsement of a reserve budget of up to US$12 million for
the targeted capacity investment and reform, based on the understanding that
access to these funds will be subject to the Executive Board’s approval, in April
2020, of a detailed two-year implementation plan for the targeted capacity
investment. The Board will then decide the exact amount to be drawn down from
the set-aside reserve funds for 2020 at its April session. Member States will have
the opportunity to review the two-year implementation plan during informal
Executive Board consultations in January 2020 prior to the formal approval of the
2020 budget at the regular Governing Council session in February of the same
year.
124. Based on the findings of the HR study and the business process review, IFAD has
begun to identify a number of quick win opportunities that are proposed for
immediate implementation as of January 2020. Given the conditionality to only
draw funds from the targeted capacity investment once the detailed action plan is
approved, IFAD will fund these from up to 25 per cent of the carry-forward budget
in order to use the existing momentum of its transformation process. The identified
quick wins are primarily in the areas of performance and consequence
management together with those optimizations of business processes that do not
require investments in IT.
125. More stringent performance and consequence management will support the right-
sizing of IFAD. The goal of the targeted capacity investment is to form a workforce
that is able to cope with the challenges ahead. The proposed measures would allow
IFAD to achieve this goal through upskilling of staff, attraction of key specialists
and addressing underperformance. In this context, HR technology is seen as an
enabler to facilitate high-quality performance monitoring and consequence
management.
126. The enhanced ERM Framework will enable meaningful risk oversight by the Audit
Committee and Executive Board and allow Management to effectively manage the
associated risks of IFAD’s evolving business model. It will help identify risk
interdependencies and link strategy with IFAD’s risk profile and risk capacity,
change the risk culture and effectively enable informed risk-taking while
communicating risk-taking boundaries across the organization.
127. Business process-related quick wins have been identified in:

GC 43/L.6/Rev.1
26
(i) Travel – reduction of error rates on expense reports, simplification of
reconciliation of flight ticket costs and reduction of last-minute travel
requests.
(ii) Recruitment – enhancement of candidate pre-screening, enhancement of
applicant awareness of recruitment process, improvement of Personal History
Form, reduction of the number of approval steps, faster processing of post-
panel candidate reports and enhancement of salary information in vacancy
adverts.
(iii) Procurement – lessons learned review for selected procurement campaigns,
capacity-building for the Contracts Review Committee and creation of a
continuous improvement portfolio.
(iv) Consultancy – change to 240/960-day rule, improvement of consultancy
tracking and the creation of a responsibility assignment (RACI) matrix.
(v) Loan disbursements – optimization of risk controls, enhancement of IFAD
Client Portal and shift from paper-based to electronic withdrawal applications,
removal of duplicates in records management system and the design and
implementation of additional KPIs for performance monitoring.
(vi) Document processing – voice-of-the-customer research to identify
Executive Board needs, amending of guidelines, publication of easy-to-
understand clarifications for originators, improvement of document
templates, creation and implementation of document tracking KPIs and
application of cost-recovery for late document submissions.
(vii) Supplementary funds – alignment of the supplementary funds strategy
with core funding.
128. The overall outcome of such a targeted capacity investment will allow IFAD to have
a tailored structure (workforce and processes) already in place for IFAD12, rather
than a phased implementation over two replenishment cycles, both to manage and
expand business opportunities and to maximize the impact of delivered results.
129. Table 12 provides an indicative action plan for the targeted capacity investment to
be revised and delineated with full details in the two-year implementation plan that
will be presented to the Executive Board.

GC 4
3/L
.6/R
ev.1
Table 12 Indicative Plan for Targeted Capacity Investment
25% CF funding TCI funding
Capacities
Capabilities
Business
Process
Review
HR
Technology
Automation
Change
Management
ERM
Framework
Employee
Value
Proposition
EB approves 2-year
implementation plan
Strategic
Workforce
Planning
HR
Performance
&
Consequence
Management
Quick Wins in Travel, Recruitment, Procurement, Consultancy, Loan Disbursement, Document Processing,
Change Management
Detailed assessment of automation potential and validation with business
Implementation of automation technology with integration into existing systems
Rebuttal Policy
Performance Improvement Plans
Removal of cap on ratings and introduction of career review group
New reward and recognition framework
Divisional Workshops for objective setting and dev. plans
Introduction of bonus and reward system
Detailed assessment of HR technology and validation with business owners
Implementation of HR technology with integration into existing systems
Definition of targets by division, job family and HQ:Field ratio
Development of detailed position-level plan by division
Implementation of position plan by division (not to be funded by TCI)
Refine individual mapping of skills, critical roles and
Define overall training plan
Conduct trainings to upskill and re-skill identified staff
Recruitment of already identified critical priority positions
Identify functions in need for talent acquisition and
Development of risk metrics, thresholds, quantitative risk appetite levels and training material
Delivery of risk trainings to managers in HQ and hubs
0

GC 43/L.6/Rev.1
28
VIII. Special expenditure budget for IFAD12
130. In line with Governing Council resolution 181/XXXVII, the Executive Board is
requested to approve the appropriation for the replenishment special expenditure
budget for the IFAD12 Consultation.
131. As indicated in the high-level preview, the budget for the IFAD12 period is
proposed at the same level as for IFAD11, adjusted for inflation. The proposed
amount is US$1.1 million, which will be used to cover the costs of the
replenishment exercise, including the external chair, replenishment sessions and
the preparation of replenishment documents.
Table 13 Estimated special expenditure budget for the IFAD12 replenishment exercise (Millions of United States dollars)
Description IFAD11 approved IFAD11 forecast IFAD12 proposed
Language services and conference-related costs 0.45 0.37 0.40
Staff costs 0.13 0.20 0.22
Administration costs 0.09 0.11 0.10
Consultancy and travel costs (including External Chair) 0.28 0.30 0.30
Midterm review 0.08 0.05 0.07
Contingency/miscellaneous 0.01 0.00 0.01
Total 1.04 1.03 1.10

GC 43/L.6/Rev.1
29
Part two – Results-based Work Programme and Budget
for 2020, and Indicative Plan for 2021–2022 of the Independent Office of Evaluation of IFAD
I. Introduction 132. This document provides the results-based work programme and budget for 2020,
and indicative plan for 2021–2022 of the IOE. It was informed by extensive
consultations carried out by IOE with IFAD’s governing bodies and Management. In
addition, this document is informed by the external peer review of IFAD’s
evaluation function and proposes to incorporate changes suggested by the external
peer review report. Subject to the Executive Board’s approval of IOE’s joint action
plan with IFAD Management on implementation of external peer review
recommendations, additional changes will be elaborated in 2020.
133. This document illustrates the linkages between IOE’s work programme and
expenditures, and details the breakdown of budgeted costs – particularly non-staff
costs – including those for consultants. In addition, the document provides details
of actual expenditures for 2018, budget utilization up to September 2019 and a
current estimate of expected 2019 year-end utilization.
134. In line with the IFAD Evaluation Policy,4 the IOE budget is developed independently
of IFAD’s administrative budget.5 The proposed budget is based on the same
budgeting principles and parameters (i.e. exchange rate, standard costs for staff
positions and inflation factor) used by IFAD Management in preparing its own
administrative budget for 2019.
II. Progress of activities in 2019
A. Selected evaluations from 2019 work programme
135. IOE expects to implement all activities planned in the 2019 work programme by
the end of the year. Selected achievements to date include:
Finalization of the corporate-level evaluation (CLE) on IFAD’s
engagement in pro-poor value chain development. The evaluation
findings and recommendations were presented to the Evaluation Committee
in June 2019 and to the Executive Board in September 2019. An internal
learning event was held in September 2019 to discuss the findings and
lessons of the CLE.
Undertaking the CLE on IFAD’s support to innovation and productivity
growth for inclusive and sustainable smallholder agriculture. The
approach paper6 for the CLE was presented at the 105th session of the
Evaluation Committee in June 2019 and finalized accordingly. The evaluation
is now in progress and field visits are being undertaken.
External peer review of IFAD’s evaluation function. The final report of
the external peer review of IFAD’s evaluation function was presented at the
106th session of the Evaluation Committee and 127th session of the
Executive Board in September 2019.
Finalization of country strategy and programme evaluations (CSPEs).
National roundtable workshops for Mexico and Sri Lanka took place at the
beginning of the year. The Burkina Faso, Kenya and Tunisia CSPEs were
discussed at the March session of the Evaluation Committee. The 2019 CSPEs
4 See IFAD Evaluation Policy (https://webapps.ifad.org/members/eb/102/docs/EB-2011-102-R-7-Rev-3.pdf). 5 See IFAD Evaluation Policy, para. 38: “The levels of the IOE component and IFAD’s administrative budgets will be determined independently of each other”. 6 See https://webapps.ifad.org/members/ec/105/docs/EC-2019-105-W-P-4.pdf.

GC 43/L.6/Rev.1
30
are being implemented as planned. Based on its experience in conducting
CSPEs, IOE also participated in informal sessions of the Executive Board on
country strategic opportunities programmes (COSOPs) and CSPEs in March
and July respectively.
The impact evaluation (IE) of the Food Security and Development Support
Project in the Maradi Region (PASADEM) in Niger will be presented at the
October session of the Evaluation Committee. IOE has started preparations
for the next IE on the Community-based Integrated Natural Resource
Management Project in Ethiopia in collaboration with the International Food
Policy Research Institute.
136. Reporting. The 2016-2018 Results Measurement Framework, IOE’s monitoring
and reporting framework for that period, is included in annex X. Progress in
implementing planned evaluation activities for 2019 is summarized in table 1 of
annex XI. The data reveal that the activities are on track.
B. 2019 budget utilization
137. Table 1 reports IOE budget utilization in 2018 and 2019 until September 2019, as
well as the year-end projection.
Table 1 IOE budget utilization in 2018 and projected utilization in 2019 (as of September 2019)7
Evaluation work Approved
budget 2018
Budget utilization
2018
Approved budget
2019 Commitment as of
September 2019 Expected utilization
as of year- end 2019
Non-staff costs
Staff travel 460 000 419 075 440 000 254 650 440 000
Consultant fees 1 400 000 1 480 575 1 440 000 1 352 891 1 430 000
Consultant travel and allowances 380 000 335 608 360 000 304 395 360 000
In-country CSPE learning events 45 000 37 714 - - -
Evaluation outreach, staff training and other costs 220 390 197 876 270 390 208 683 265 000
Subtotal 2 505 390 2 470 848 2 510 390 2 120 619 2 495 000
Staff costs 3 307 259 3 260 299 3 473 221 3 369 307 3 369 307
Total 5 812 649 5 731 147 5 983 611 5 489 926 5 864 307
Utilization (percentage) 98.48 91.75 98
External peer review (2018 portion of the total cost) 100 000 99 404 200 000 115 349 120 000
Total 2019 budget 6 183 611
7 It will not be possible to report on this in the future because of a change in the budget reporting process; staff and non-staff costs may be reported separately. 8 This utilization rate is based on data from IFAD's business intelligence system in which the disbursement rate is calculated using standard staff costs and non-staff costs. Euro-denominated transactions are reflected in United States dollars at the existing exchange rate. However, IFAD’s Office of Strategic Budgeting has provided data on actual utilization of staff and non-staff costs in United States dollars, which indicates that IOE has utilized 92.8 per cent of its allocated US$5.91 million. This was predominantly driven by: a lower-than-expected utilization of staff costs (86.5 per cent) due to extended absence of staff; and lower actual staff costs compared to standard staff costs (as captured in the business intelligence system). A full carry-over of 3 per cent was provided to IOE.

GC 43/L.6/Rev.1
31
138. Against an approved budget of US$5.98 million for 2019, utilization (in terms of
commitments) as of mid-September 2019 stood at US$5.48 million or
91.75 per cent. This is in line with the normal business cycle since most
evaluations are launched in the first part of the year. Overall utilization of the total
2019 IOE budget at year-end is currently projected at US$5.86 million,
representing 98 per cent of the approved budget.
C. Utilization of the 2018 carry-forward
139. The carry-forward from 2018 has been granted for the entire permissible
3 per cent of the IOE regular budget of 2018, which is US$177,379. This carry-over
has been partly used to produce the book entitled Information and Communication
Technologies for Development Evaluation, published by Routledge. This book
brings together the experiences of numerous development evaluation actors in
using technology for evaluation work. Carry-over funds have also been used to
finance a joint stocktaking exercise of country programme evaluations among
evaluation units of international financial institutions in the Evaluation Cooperation
Group.
III. IOE strategic objectives 140. As agreed with the Executive Board in December 2013, IOE aligns its strategic
objectives (SOs) with IFAD replenishment periods to ensure a more coherent link
between IOE’s SOs and corporate priorities. The following were proposed for 2016-
2018 (the Tenth Replenishment of IFAD's Resources [IFAD10]), approved by the
Board in December 2015 and extended to 2019 and 2020:
(i) SO1: Generate evidence through independent evaluations of IFAD’s
performance and results to promote accountability; and
(ii) SO2: Promote evaluation-based learning and an enhanced results
culture for better development effectiveness.
141. These two SOs should allow IOE to achieve the overarching goal set for
independent evaluation: increasing the impact of IFAD’s operations for sustainable
and inclusive rural transformation through the promotion of accountability and
learning. IOE will retain these SOs for 2020 until a new multi-year evaluation
framework in line with recommendations of the external peer review can be
finalized.
IV. 2020 work programme 142. In 2020, IOE will introduce the new thematic evaluation (TE) product. This is in
response to the preliminary recommendations of the 2019 external peer review,
which advises greater focus on cross-cutting and thematic issues in IFAD. TEs will
examine IFAD's results and performance in a given thematic area. They will focus
on sectors and themes of interest to IFAD, and its strategic engagement in them.
Thematic areas with high potential for learning will also be considered for these
evaluations. CLEs will focus on the performance of IFAD corporate policies and
strategies.
143. Consultations with governing bodies and IFAD Management highlighted the need to
undertake a TE of IFAD’s contribution to smallholders’ adaptation to climate
change. This evaluation will specifically examine IFAD’s role in: (i) supporting
smallholders to manage climate change risks; (ii) mainstreaming climate change
adaptation into its programmes and projects; (iii) advocating for climate-sensitive
policies and strategies at the national and global levels; and (iv) testing and scaling
up climate-sensitive approaches.
144. Consultations with IFAD Management and governing bodies have also highlighted
the importance of collaboration among the Rome-based agencies (RBAs) of the
United Nations in achieving the targets of Sustainable Development Goal 2: End

GC 43/L.6/Rev.1
32
hunger, achieve food security, improve nutrition and promote sustainable
agriculture. Collaboration at the headquarters and country levels is of paramount
importance to meet these targets. Therefore, in 2020 IOE proposes to launch a
joint CLE with the evaluation offices of the Food and Agriculture Organization of the
United Nations (FAO) and the World Food Programme (WFP) on collaboration
among the RBAs. This evaluation will be completed in 2021.
145. The aim of CSPEs is to assess the results and impact of IFAD’s partnerships with
governments in reducing rural poverty, and provide the building blocks for
preparing an IFAD strategy in each country. In 2020, IOE will complete the CSPEs
begun in 2019 in Madagascar and Sudan. Based on thorough consultations with
Management, IOE plans to launch five new CSPEs in Burundi, Morocco, Niger,
Pakistan and Uganda. As in the past, IOE has consulted with IFAD Management on
the COSOPs due for renewal over the subsequent three-year period and, based on
regional division and IOE priorities, has selected the countries.
146. Next year, IOE will finalize the 2019 IE in Ethiopia. IEs conducted by IOE were not
included in the set of evaluations undertaken by IFAD Management in the IFAD9
and IFAD10 periods. IOE’s main objectives in conducting IEs are to: test innovative
methodologies and processes for assessing the results of IFAD operations more
rigorously; and contribute to ongoing dialogue on IE approaches in IFAD and
internationally. IOE will undertake a new IE in 2020 on a project to be decided in
early 2020. Pending deliberations of the Evaluation Committee on the findings and
recommendations of the external peer review of IFAD’s evaluation function, IOE
envisages changes in the way IEs are undertaken. IOE will undertake IEs to fill
specific knowledge gaps and promote innovation through the use of information
and communication technologies, and novel methodologies. IEs will also feed into
higher-level evaluations such as CLEs, CSPEs, TEs and evaluation synthesis reports
(ESRs). For example, the ongoing IE in Ethiopia is expected to feed into the TE on
IFAD’s contribution to smallholders’ adaptation to climate change in 2020. IEs
afford IOE the opportunity to collect evidence of a breadth and depth that would
not be possible through other evaluations such as project performance evaluations.
147. ESRs are largely based on existing evaluation evidence and serve to consolidate
lessons and good practices that can inform the development and implementation of
IFAD policies, strategies and operations. In 2020, IOE proposes to undertake one
ESR on rural infrastructure. Selected CSPEs, project-level evaluations and IEs
provide an evidence base on this sector that covers US$1.1 billion of the
US$7.9 billion in current IFAD financing.9,10 On a pilot basis and depending on the
methodology adopted, IOE plans to reinforce the ESR with selected field visits,
which will provide evidence on a cluster of projects. In addition to reinforcing the
ESR, the cluster approach will also provide a foundation for IFAD to pilot more
thematic and sector-specific evaluations as recommended by the external peer
review.
148. IOE plans to undertake six project performance evaluations (PPEs) on selected
projects. The objectives of PPEs are to: (i) assess the results of the projects;
(ii) generate findings and recommendations for the design and implementation of
ongoing and future operations in the country; and (iii) identify issues of corporate,
operational or strategic interest that merit further evaluation. They also serve as
critical inputs for the CLEs, CSPEs and the Annual Report on Results and Impact of
IFAD’s Operations (ARRI). The six PPEs proposed for 2020 is a reduction from the
eight PPEs IOE undertook in 2019; it has been proposed to use the savings as a
buffer for unforeseen evaluation work. In 2020, part of this buffer may be used to
reinforce the ESR through field visits, which will serve as a basis for IOE to pilot the
assessment of a cluster of projects and their utility (thus addressing external peer
9 As of 31 December 2018. 10 IFAD Annual Report 2018.

GC 43/L.6/Rev.1
33
review findings and recommendations). The number of PPEs undertaken in a given
year is dictated by the need for evidence for higher plane evaluations.
149. Following current practice, IOE will validate all project completion reports (PCRs). A
100 per cent coverage of PCRs allows the IOE ratings database to be fully
maintained. This database is publicly available and is used on a regular basis in
preparing the ARRI as well as in evaluations such as CSPEs, CLEs and ESRs.
However, IOE will revise its approach to PCR validation to reduce the time required
for preparation, as recommended by the external peer review.
150. The proposed PPEs and the tentative full coverage of PCRs for validations affords
IOE wide coverage of IFAD operations in all regions, helping to strengthen IFAD’s
broader accountability framework. This is fundamental since most of IFAD’s
development resources are channeled to developing Member States through
investment projects and programmes.
151. IOE will prepare the 2020 ARRI, the Fund’s flagship evaluation report. The ARRI
represents consolidated, institution-level results emanating from independent
evaluations. It is in line with best practices from the independent evaluation offices
of other international financial institutions such as the World Bank and Asian
Development Bank, which present their organizations’ performance through similar
products. In addition, given the harmonization between self-evaluation and
independent evaluation systems within IFAD, the ARRI provides a complementary
overview of IFAD’s institutional performance. In considering the recommendations
of the external peer review IOE will review the contents of ARRI.
152. Given the recommendations of the external peer review, IOE will lead the drafting
of a new evaluation policy, which will encompass IFAD’s entire evaluation function.
In drafting the policy, IOE will engage stakeholders including the Programme
Management Department, senior Management, representatives of the Executive
Board and Evaluation Committee, IOE staff and the broader evaluation community.
The new policy will be presented to the Executive Board for approval in December
2020.
153. IOE will also support selected countries in evaluation capacity development (ECD)
activities. It will continue to engage in the Centers for Learning on Evaluation and
Results (CLEAR) initiative on IE as the programme enters its next phase in order to
build capacity among project staff and other in-country personnel.
154. IOE will continue seeking opportunities for partnerships. The RBAs’ evaluation
offices will continue to collaborate in the EvalForward Evaluation for Food Security,
Agriculture and Rural Development community of practice, which includes
international organizations, academia, the private sector, governments and NGOs.
The aim of this community of practice is to exchange knowledge and experience
that enhance the evaluations of projects and programmes focused on agriculture,
food security and rural development. In 2019, IOE partnered with the Independent
Evaluation Group of the World Bank and the International Development Evaluation
Association (IDEAS) to institute an award at the IDEAS Global Assembly. This
biennial award will highlight evaluations promoting transformational change
towards the Sustainable Development Goals. To this end, IOE will engage with
IDEAS and the Independent Evaluation Group on a continuing basis.
155. IOE will ensure timely, customized dissemination and outreach of results and
lessons to key audiences. It will present all CLEs, the ARRI, selected CSPEs and
other documents to the Evaluation Committee and the Executive Board. It will also
present impact assessments and ESRs to the Evaluation Committee and, if
requested, to the Board. IOE will continue with its established practice of creating
podcasts, evaluation profiles, insights, videos and infographics to expand outreach
and dissemination of evaluation results.

GC 43/L.6/Rev.1
34
156. As per established practice, IOE will prepare written comments on new COSOPs
that have been preceded by CSPEs and are presented for consideration by the
Executive Board. In line with the Evaluation Policy, IOE will provide written
comments on new corporate policies and strategies that have been informed by
major CLEs. Finally, in 2020 IOE plans to review its product and process matrix
based on the recommendations of the external peer review. IOE plans on piloting
new products in 2020, as already discussed.
157. The proposed list of IOE evaluation activities for 2020 is shown in annex XII,
table 1 and the indicative plan for 2021-2022 is presented in table 2 of that annex.
V. 2020 resource envelope
A. Staff resources
158. IOE’s staff requirements are based on a comprehensive annual strategic workforce
planning exercise, which confirmed that the office should be in a position to deliver
all planned activities in a timely manner with its current staffing level
(see annex XII).
B. Budget requirements
159. The peer review’s conclusions have implications for the product and process
matrix. Therefore, this budget is transitional in nature. Any changes in products
and processes, and their implications for the budget, will be fully reflected in 2021.
160. This section outlines IOE’s budget requirements. The proposed budget is presented
by type of activity, strategic objective and category of expenditure. Each table
includes both the 2019 approved budget and the proposed budget for 2020,
facilitating a comparison between the two years. Table 5 also contains the IOE
gender-sensitive budget, which identifies the budget distribution for gender-related
activities.
161. Assumptions. The parameters used to develop the proposed 2020 budget are the
same as those used in 2019. They are as follows: (i) no increase in the salaries of
Professional and General Service staff is anticipated for 2020, so the same 2019
standard costs were used, adjusted for the euro/United States dollar exchange
rate; (ii) inflation will be absorbed to the greatest extent possible; and (iii) an
exchange rate of US$1= EUR 0.885 will be used.
162. Budget by type of activity. Table 2 displays the proposed IOE 2020 budget by
type of activity. IOE will apply the same methodological rigour and internal
preparation of its evaluation products without increasing the cost of the individual
evaluations compared to 2019. IOE proposes to decrease the total number of PPEs
to six and maintain the number of ESRs at one. In line with the recommendations
of the external peer review of the evaluation function of IFAD, IOE intends to
maintain some flexibility in its budgeting so that it can respond better to
organizational needs. To this end, IOE proposes to start with a buffer of US$80,000
for unforeseen evaluation work as reflected in table 2 below. In 2020, it is
expected that this buffer may be used to implement some of the recommendations
of the external peer review such as piloting sector- and cluster-specific evaluations.

GC 43/L.6/Rev.1
35
Table 2 Proposed budget for 2020 by type of activity
Type of activity
Approved
2019 budget
(US$)
Absolute number
2019
Level of effort 2019
Proposed
2020 budget
(US$)
Absolute number
2020
Level of effort 2020
Non-staff costs
ARRI 80 000 1 1 80 000 1 1
CLEs 430 000 2 1 100 000 2 0.5
TE - - - 300 000 1 0.8
CSPEs 1 000 000 7 5.2 1 000 000 7 5.2
ESRs 55 000 1 1 55 000 1 1
PPEs 320 000 8 8 240 000 6 6
PCRVs (project completion
report validation) 30 000 30 30 45 000 30 30
IEs 200 000 2 1 200 000 2 1
Knowledge sharing, communication, evaluation outreach and partnership activities 260 000 - - 260 000 - -
ECD, training and other costs 135 390 - - 120 390 - -
Buffer for unforeseen evaluation work - - - 80 000 - -
Total non-staff costs 2 510 390 - - 2 480 390 - -
Staff costs 3 473 221 - - 3 388 338 - -
Total 5 983 611 - - 5 868 728 - -
External peer review 200 000 - - - - -
Recruitment of IOE Director - - - 137 000* - -
New Evaluation Policy - - - 50 000 - -
Total 2019 budget 6 183 611 - - 6 055 728 - -
*Estimate based on discussions with IFAD’s Human Resources Division, assuming that a head-hunting agency will be engaged
163. The proposed 2020 budget includes the request for approval of a below-the-line
cost allocation of US$187,000. Of this amount, US$137,000 is allocated for the
recruitment of new IOE Director of IOE in 2020. A similar request for US$189,000
was made in 2013 for the recruitment process. An additional US$50,000 is
requested for the preparation of a new evaluation policy as recommended by the
external peer review of IFAD’s evaluation function.
164. Cost drivers. IOE’s costs are significantly determined by the number and kind of
evaluations it undertakes in a given year, with the standard costs of most products
well defined. Hence, IOE’s main cost drivers are the number and the types of
products it undertakes. In 2020, additional cost drivers will include product and
process realignment in line with the recommendations of the external peer review
and the impending recruitment of the IOE Director.
165. Budget by category of expenditure. Table 3 shows the proposed budget for
2020 by expenditure category. Consultants are important to evaluations, providing
technical expertise at different stages of the evaluation process. In 2018, IOE hired
freelance consultants11 on retainer contracts for an average of 44 working days.
IOE is continuing its efforts to ensure adequate gender and regional diversity of
consultants across all evaluation types. It has prioritized recruitment of consultants
from the country or region in which an evaluation is planned, especially for PPEs,
11 This excludes interns, translators and editors.

GC 43/L.6/Rev.1
36
CSPEs and country visits undertaken in the context of CLEs and the preparation of
ESRs.
Table 3 Proposed budget for 2020 by category of expenditure
Category of expenditure
Approved
2019 budget
Proposed 2020
budget
Non-staff costs
Staff travel 460 000 450 000
Consultant fees 1 400 000 1 390 000
Consultant travel and allowances 380 000 370 000
Evaluation outreach, staff training and other costs 270 390 270 390
Total non-staff costs 2 510 390 2 480 390
Staff costs 3 473 221 3 388 338
Total 5 983 611 5 868 728
External peer review 200 000 -
Recruitment of IOE Director - 137 000
New Evaluation Policy - 50 000
Total 2019 budget 6 183 611 6 055 728
166. Staff travel, consultants’ fees, allowances and travel expenses are expected to be
reduced slightly as non-staff costs are projected to decrease.
167. Budget by strategic objective. Table 4 shows the allocation of the total IOE
proposed budget for 2020, including both staff and non-staff costs, against IOE’s
strategic objectives. IOE has further divided its objectives into outcomes, as shown
in table 4 below. This is a change from the previous years, in which budgeting was
only undertaken on the basis of objectives. The largest amount is allocated to SO1
since a large part of IOE’s consultancy resources are allocated to activities
contributing to the achievement of this objective (including CLEs, CSPEs and PPEs).
Many of the activities undertaken towards this objective also contribute to SO2, by
promoting evaluation-based learning and an institutional-results culture. For
example, in-country workshops at the end of CSPEs – which are included in the
SO1 budget – provide a unique opportunity to exchange lessons learned and good
practices with policy and decision makers, IFAD operations staff and other
stakeholders.

GC 43/L.6/Rev.1
37
Table 4 Proposed 2020 budget allocation by strategic objective and outcome
Strategic objective
Approved 2019 budget Proposed 2020 budget
Amount (US$) % Amount (US$) %
SO1: Generate evidence through independent evaluations of IFAD’s performance and results to promote accountability 3 957 180 66 3 826 126 65
Contribute to generating evidence on performance and results of IFAD operations - 1 223 997
Provide actionable technical knowledge through evaluations to improve design and implementation of policies, strategies and programmes - 2 602 129
SO2: Promote evaluation-based learning and an enhanced results culture for better development effectiveness 1 624 969 27 1 783 961 30
Contribute to learning within IFAD - 1 331 941
Contribute to learning in IFAD’s Member States and to international debates on evaluation methodology 452 019
Joint SO1 and SO2 401 461 7 258 641 5
Total 5 983 611 100 5 868 728 100
IOE peer review 200 000 -
Recruitment of IOE Director - 137,000
New Evaluation Policy - 50,000
Total budget 6 183 611 6 055 728
Note: percentages are rounded up.
168. Gender-sensitive budget. IOE’s methodology for constructing a gender-sensitive
budget entails determining the proportion of staff and non-staff costs devoted to
analysing and reporting on gender issues in its evaluations. It is important to note
that IOE has a dedicated criterion on gender equality and women’s empowerment
that is applied in all ARRIs, CSPEs, PPEs, PCRVs and IEs. Attention is also paid to
gender issues in other evaluations such as CLEs and ESRs. Finally, extensive
primary data on women-headed households and women beneficiaries is collected in
the context of IEs. Table 5 shows that 7.2 per cent of the total proposed IOE
budget for 2020 is directly allocated to the examination of gender issues.

GC 43/L.6/Rev.1
38
Table 5 IOE 2020 gender-sensitive budget
Type of activity Proposed 2020
budget
Gender component
(percentage) US$
Non-staff costs
ARRI 80 000 10 8 000
CLEs 100 000 10 10 000
TE 300 000 10 30 000
CSPEs 1 000 000 10 100 000
ESRs 55 000 5 2 750
PPEs 240 000 7 16 800
PCRVs 45 000 5 2 250
IEs 200 000 15 30 000
Knowledge sharing, communication, evaluation outreach and partnership activities 260 000 4 10 400
ECD, training and other costs 120 390 5 6 019
Buffer for unforeseen evaluation work 80 000 5 4 000
Total non-staff costs 2 480 390 8.9 220 119
Staff costs
Gender focal point 161 400 20 32 280
Alternate gender focal point 105 700 10 10 570
All evaluation officers 3 247 400 5 162 370
Total staff costs 3 388 338 6 205 220
Total 5 868 728 7.2 425 339
VI. IOE budget proposal and considerations for the future
169. Current proposal. The proposed 2020 budget totals US$6.05 million, which
includes US$187,000 as below-the-line items to cover the cost of recruiting a new
IOE Director and preparation of new Evaluation Policy. Excluding this below-the-
line cost allocation, the total proposed budget for 2020 is US$114,883 lower than
the proposed budget for 2019, at US$5.86 million. This represents a 1.92 per cent
nominal decrease over the approved budget for 2019.
170. The proposed 2020 IOE budget represents 0.55 per cent of IFAD’s expected
programme of loans and grants (PoLG) for 2020,12 which is below the IOE budget
cap of 0.9 per cent adopted by the Executive Board.13 In addition, IOE’s budget
represents 3.7 per cent of IFAD’s proposed administrative budget for 2020. Figure
1 presents the trend in the share of IOE’s budget vis-à-vis IFAD’s administrative
budget since 2010. The share of IOE’s budget has witnessed a decline over the last
decade. An overview of IOE’s proposed budget, including previous budgets since
2014, is shown in annex XIV, table 1.
12 It is anticipated that IFAD will commit approximately US$1.062 billion in new loans and grants in 2020. This is a downward revision from the US$1.356 billion included in the version presented in to governing bodies in September and October 2019. 13 This decision was made by the Executive Board in December 2008.
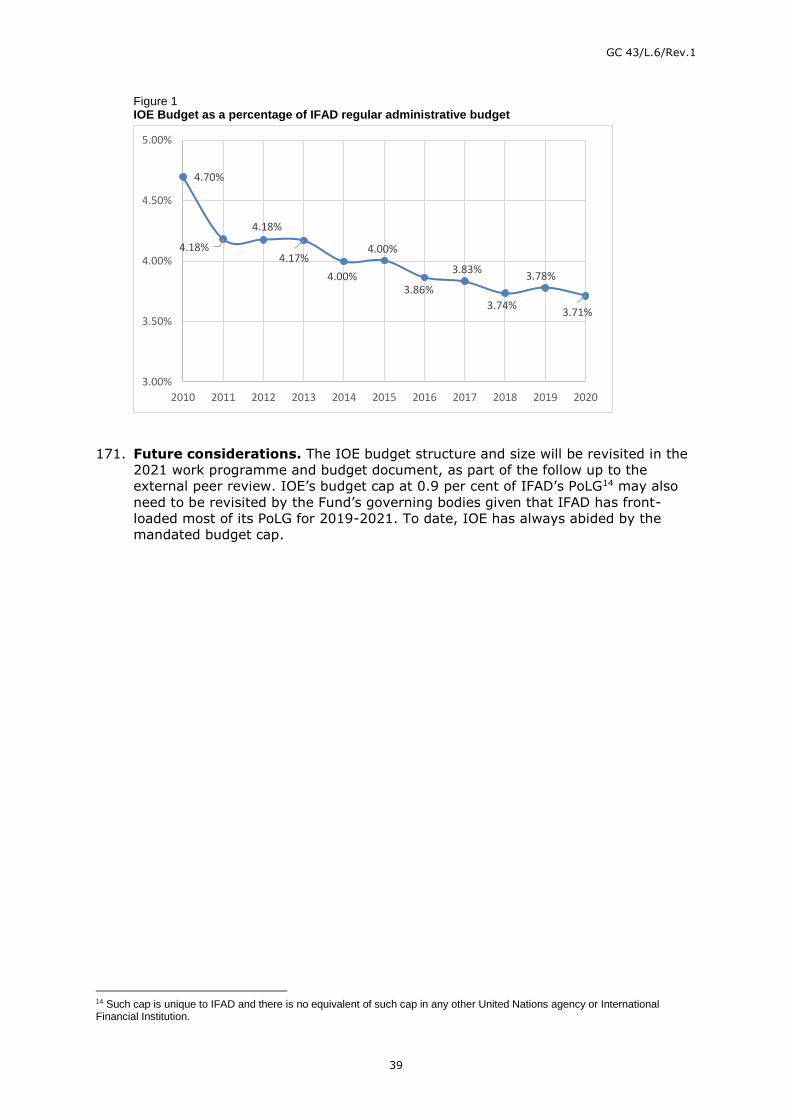
GC 43/L.6/Rev.1
39
Figure 1 IOE Budget as a percentage of IFAD regular administrative budget
171. Future considerations. The IOE budget structure and size will be revisited in the
2021 work programme and budget document, as part of the follow up to the
external peer review. IOE’s budget cap at 0.9 per cent of IFAD’s PoLG14 may also
need to be revisited by the Fund’s governing bodies given that IFAD has front-
loaded most of its PoLG for 2019-2021. To date, IOE has always abided by the
mandated budget cap.
14 Such cap is unique to IFAD and there is no equivalent of such cap in any other United Nations agency or International Financial Institution.
4.70%
4.18%
4.18%
4.17%
4.00%
4.00%
3.86%
3.83%
3.74%
3.78%
3.71%
3.00%
3.50%
4.00%
4.50%
5.00%
2010 2011 2012 2013 2014 2015 2016 2017 2018 2019 2020

GC 43/L.6/Rev.1
40
Part three – Heavily Indebted Poor Countries Initiative
progress report for 2019
I. Introduction 172. The objective of this progress report for 2019 is to:
Inform the Executive Board of the status of implementation of the Heavily
Indebted Poor Countries (HIPC) Initiative and of IFAD’s participation in the
Initiative; and
Seek Executive Board approval for submitting the substance of this progress
report to the forthcoming session of the Governing Council for information.
II. Progress in HIPC Initiative implementation 173. Substantial progress has been made in the implementation of HIPC since the
Initiative’s inception. Among the eligible countries, 92 per cent (35 of 38) have
reached the decision point as well as completion point and qualified for HIPC
assistance. Three countries – Eritrea, Somalia and Sudan – are still at the pre-
decision point stage and have yet to start the process of qualifying for debt relief
under the Initiative.
IFAD Member States participating in the HIPC Initiative, by stage
Completion point countries (35) Decision point countries Pre-decision point countries (3)
Benin - Eritrea
Bolivia (Plurinational State of) - Somalia
Burkina Faso - Sudan
Burundi -
Cameroon -
Central African Republic -
Chad -
Comoros -
Congo -
Côte d’Ivoire -
Democratic Republic of the Congo -
Ethiopia -
Gambia (The) -
Ghana -
Guinea -
Guinea-Bissau -
Guyana -
Haiti -
Honduras -
Liberia -
Madagascar -
Malawi -
Mali -
Mauritania -
Mozambique -
Nicaragua -
Niger -
Rwanda -
Sao Tome and Principe -
Senegal -
Sierra Leone -
Togo -
Uganda -
United Republic of Tanzania -
Zambia -

GC 43/L.6/Rev.1
41
III. Total commitment to the HIPC Initiative
174. The Fund’s commitment to the overall HIPC Initiative corresponds to
US$667.6 million, as indicated in table 1 below. The current estimates may vary
depending on changes in economic conditions, HIPC discount rates and potential
delays in the remaining countries reaching decision and completion points. Table 1 HIPC commitments (amounts expressed in SDR/US$ million)
# NPV Nominal
Countries SDR USDa SDR USDa
Completion point 35 247.15 336.76 375.99 512.33
Pre-decision point 3 94.20 128.36 113.89 155.18
341.35 465.12 489.88 667.51
a Exchange rate prevailing on 30 September 2019 of 1.36258.
175. As at 30 September 2019, the Fund had provided debt relief amounting to
US$480.0 million to eligible countries at completion point, while future debt relief is
equivalent to US$32.1 million, as shown in table 2 below.
Table 2 HIPC debt relief for completion point countries (amounts expressed in SDR/US$ million)
#
Nominal
Countries SDR USDa
Completion point 35 Debt relief provided 352.42 480.20
Future debt relief 23.57 32.13
375.99 512.33
a Exchange rate prevailing on 30 September 2019 of 1.36258.
176. Total debt relief payments are estimated at US$11.0 million for the year 2019.
IV. Financing debt relief 177. IFAD funds its participation in the HIPC Initiative with external contributions (either
paid directly to IFAD or transferred through the HIPC Trust Fund administered by
the World Bank) and its own resources. External contributions15 paid amount to
about US$287.1 million (53.8 per cent), and contributions from IFAD’s own
resources amount to about US$238.2 million (44.6 per cent) for transfers made
from 1998 to 2019. The remainder is covered by investment income from the IFAD
HIPC Trust Fund balance of approximately US$8.3 million (as at end-
September 2019).
178. To mitigate the impact of debt relief on resources available for commitment to new
loans and grants, Member States have supported IFAD’s formal access to the HIPC
Trust Fund administered by the World Bank. This was agreed in 2006, recognizing
that it would add to the overall financing requirements of the HIPC Trust Fund.
Since 2006 IFAD has signed several grant agreements, bringing the total received
to date to US$215.6 million.
179. While giving priority to ensuring that the HIPC Trust Fund is adequately financed,
Management will also continue to encourage Member States to provide the Fund
with additional resources directly to help finance its participation in the HIPC
Initiative.
15 External contributions include contributions from Member States in the amount of US$71.5 million and contributions from the World Bank HIPC Trust Fund in the amount of US$215.6 million.

GC 43/L.6/Rev.1
42
Part four – Progress report on implementation of the
performance-based allocation system
I. Application of the performance-based allocation
system in 2019
180. In December 2018 Management presented to the Executive Board the
performance-based allocation system (PBAS) allocations for the IFAD11 period
(2019-2021). In line with IFAD11 commitments (GC 41/L.3/Rev.1), 80 countries
were included in the allocations calculation following the application of country
selectivity.16 With regard to financing for country groupings, 90 per cent of IFAD’s
core resources were allocated to low-income countries and lower-middle income
countries. The remaining 10 per cent of IFAD’s core resources were allocated to
upper-middle-income countries. Management also ensured that between 25 per
cent and 30 per cent of core resources were allocated to countries with the most
fragile situations, 50 per cent to Africa and 45 per cent to sub-Saharan Africa. In
addition, IFAD allocated approximately two thirds of its core resources on highly
concessional terms. In accordance with the PBAS methodology, the 2019
allocations were fixed, while the allocations for 2020 and 2021 were tentative.
181. In making these allocations, consideration was given to the IFAD11 financial
framework to ensure the Fund’s long-term financial sustainability, including the
proportion of grants to be allocated in line with the Debt Sustainability Framework
(DSF) mechanism to countries eligible for highly concessional terms.
182. During the fourth quarter of 2019, the data for the variables in the formula that are
updated on a yearly basis (rural population, GNI per capita, and performance and
disbursement measure) were updated in order to produce the 2020 country scores
and allocations. The updated data will be reflected in the final 2020 country scores
and allocations reported in annex I of the addendum to this progress report. In line
with the PBAS methodology, the scores and allocations for 2019 and 2020 are final,
and the scores and allocations for 2021 are provisional.
II. Country lending terms for 2019
183. Uptake of the Debt Sustainability Framework offer. In May 2019,
Management presented to the Executive Board the percentage of DSF grant
resources offered to the 32 eligible countries for the IFAD11 period:
Countries at moderate risk of debt distress were offered 80 per cent of their
allocation on DSF grant terms and the remaining 20 per cent, on an optional
basis, on highly concessional terms (concessionality level of 91 per cent).
Countries at high risk or in debt distress were offered 27 per cent of their
allocation on DSF grant terms and the remaining 73 per cent on highly
concessional terms, with 46 per cent of the allocation offered on highly
concessional terms on an optional basis (concessionality level of 69 per cent).
184. Compared to the IFAD10 period, the resources allocated for the 16 countries in or
at high risk of debt distress increased 61 per cent and all such borrowers were
offered higher grant allocations; resources allocated for the 16 countries at
16 In order to determine the countries that would access new resources in IFAD11, Management and members agreed on three actionable criteria: (i) strategic focus: existence of a valid country strategic opportunities programme or country strategy note early in the PBAS cycle. This would ensure that qualifying countries have a strategic vision of how to use IFAD resources and are therefore ready to engage in concrete operational discussions; (ii) absorptive capacity: all operations in a country that have been effective for more than one year must have disbursed funds at least once in the previous 18 months. This would provide a practical measure of resource absorption capacity and allow the Fund to sequence new designs more closely with implementation support and non-lending activities; and (iii) ownership: no approved loans are pending signature for more than 12 months. This proxy would ensure the adequate ownership and commitment to facilitate the use of IFAD’s resources.

GC 43/L.6/Rev.1
43
moderate risk of debt distress increased 43 per cent and six borrowers were
offered higher grant allocations.
185. To date, changes to the grant proportion of the IFAD11 allocation have been
accepted by 25 out of 32 DSF-eligible countries. The total allocation accepted by
concerned countries amounts to US$1.1 billion out of a total US$1.2 billion. Twelve
countries in debt or at high risk of debt distress, representing 86 per cent of the
volume for this category, accepted the new terms for their allocations.
186. Thirteen countries at moderate risk of debt distress, representing 91 per cent of
the volume for this category, accepted the new terms for their respective
allocations.
187. To date, only Afghanistan, Kiribati and Samoa (with a total allocation of
US$59 million) have declined the optional highly concessional portion of lending,
accounting for US$11.8 million in the aggregate.
GC 43/L.6/Rev.1
44
Part five – Recommendations
188. In accordance with article 7, section 2(b), of the Agreement Establishing IFAD, the
Executive Board has approved and is transmitting to the Governing Council:
The programme of work for 2020 at a level of SDR 760 million
(US$1 062 million), which comprises a lending programme of SDR 718 million
(US$1 004 million) and a gross grant programme of US$58 million. It is noted
that the programme of work has been approved at this level for planning
purposes and will be adjusted as needed during 2020 in accordance with
available resources.
189. In accordance with the Governing Council resolution 181/XXXVII, it is
recommended that the Executive Board:
Approve the appropriation for the replenishment special expenditure budget
for the IFAD12 replenishment exercise in the amount of US$1.1 million.
190. In accordance with article 6, section 10, of the Agreement Establishing IFAD and
regulation VI of the Financial Regulations of IFAD, it is recommended that the
Governing Council approve:
The administrative budget comprised of, first, the regular budget of IFAD for
2020 in the amount of US$157.9 million; second, the capital budget of IFAD
for 2020 in the amount of US$4.445 million; third, the budget of the
Independent Office of Evaluation of IFAD for 2020 in the amount of
US$6.055 million; and a set-aside reserve budget of up to US$12 million for
the targeted capacity investment and reform;
That access to the set-aside reserve budget will be subject to the Executive
Board’s approval in April 2020 of a detailed two-year implementation plan for
the targeted capacity investment, indicating specific actions expected to take
place in 2020 and 2021 or crossing both years. The Executive Board will then
decide the exact amount that can be drawn down from the set-aside reserve
funds for 2020. At its 131st session in December 2020, the Board will review
the progress of the implementation plan, decide on possible revisions, and
reassess funding needs for 2021 within the set-aside reserve budget. Staff
posts and any other recurrent costs will not be funded by the targeted
capacity investment. Carry-forward funding sources will be used to the extent
possible. The targeted capacity investment will be re-examined by the Board
in 2021;
That unobligated appropriations at the close of the financial year 2019 may
be carried forward into the 2020 financial year up to an amount not
exceeding 5 per cent of the corresponding appropriations.
191. It is recommended that the Executive Board submit the substance of the progress
report on IFAD's participation in the Heavily Indebted Poor Countries Initiative to
the forty-third session of the Governing Council for information.
192. It is recommended that the Executive Board submit a progress report on
implementation of the performance-based allocation system to the forty-third
session of the Governing Council, based on the report provided in part four of the
present document and its addendum containing the 2019 country scores and 2019-
2021 allocations.

GC 43/L.6/Rev.1
45
Draft resolution .../XLIII
Administrative budget comprising the regular budget, capital budget and an
Independent Office of Evaluation of IFAD budget for 2020, and a targeted
capacity investment of IFAD for 2020
The Governing Council of IFAD,
Bearing in mind article 6.10 of the Agreement Establishing IFAD and regulation VI of
the Financial Regulations of IFAD;
Noting that, at its 128th session, the Executive Board reviewed and agreed upon a
programme of work of IFAD for 2020 at a level of SDR 760 million (US$1,062 million),
which comprises a lending programme of SDR 719 million (US$1,004 million) and a
gross grant programme of US$58 million;
Further noting that, at its 128th session, the Executive Board reviewed and approved
the appropriation for the replenishment special expenditure budget for the IFAD12
replenishment exercise in the amount of US$1.1 million;
Having considered the review of the 128th session of the Executive Board concerning
the proposed regular budget, capital budget and the Independent Office of Evaluation of
IFAD budget for 2020, and a targeted capacity investment of IFAD for 2020;
Aware that, in 2004, Governing Council resolution 133/XXVII authorized the
amendment of regulation VI, paragraph 2 of the Financial Regulations of IFAD, to allow
unobligated appropriations at the close of the financial year to be carried forward into
the following financial year up to an amount not exceeding 3 per cent of the said
financial year;
Conscious that the aforementioned 3 per cent carry-forward currently applies to the
administrative budget, and noting the need for a 5 per cent cap for carrying forward
unspent balances arising from savings achieved in 2019 into the 2020 financial year to
support delivery of certain corporate priorities;
Approves the administrative budget, comprising: first, the regular budget of IFAD for
2020 in the amount of US$157.9 million; second, the capital budget of IFAD for 2020 in
the amount of US$4.445 million; third, the budget of the Independent Office of
Evaluation of IFAD for 2020 in the amount of US$6.055 million. In addition, the Board
agrees to a set-aside reserve budget of up to US$12 million for the targeted capacity
investment and reform as set forth in document GC 43/L.6, determined on the basis of a
rate of exchange of EUR 0.885:US$1. Access to the set-aside reserve budget will be
subject to the Executive Board’s approval in April 2020 of a detailed two-year
implementation plan for the targeted capacity investment, indicating specific actions
expected to take place in 2020 and 2021 or crossing both years. The Executive Board
will then decide the exact amount that can be drawn down from the set-aside reserve
funds for 2020. At the 131st session of the Executive Board in December 2020, the Board
will review the progress of the implementation plan, decide on possible revisions, and
reassess funding needs for 2021 within the set-aside reserve budget. Staff posts and any
other recurrent costs will not be funded by the targeted capacity investment. Carry-
forward funding sources will be used to the extent possible. The targeted capacity
investment will be re-examined by the Board in 2021;
Determines that, in the event the average value of the United States dollar in 2020
should change against the euro rate of exchange used to calculate the budget, the total
United States dollar equivalent of the euro expenditures in the budget shall be adjusted
in the proportion that the actual exchange rate in 2020 bears to the budget exchange
rate; and
Further approves that unobligated appropriations at the close of the financial year 2019
may be carried forward into the 2020 financial year up to an amount not exceeding
5 per cent of the corresponding appropriations.
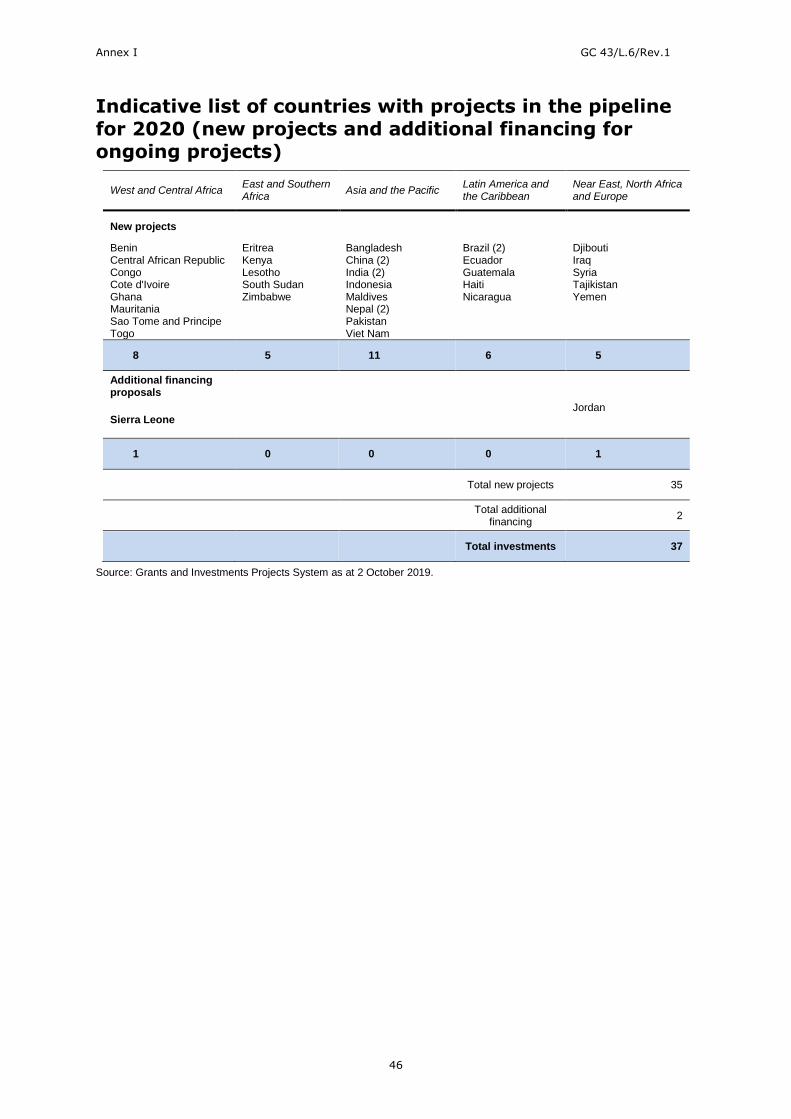
Annex I GC 43/L.6/Rev.1
46
Indicative list of countries with projects in the pipeline
for 2020 (new projects and additional financing for ongoing projects)
Source: Grants and Investments Projects System as at 2 October 2019.
West and Central Africa East and Southern Africa
Asia and the Pacific Latin America and the Caribbean
Near East, North Africa and Europe
New projects
Benin Central African Republic Congo Cote d'Ivoire Ghana Mauritania Sao Tome and Principe Togo
Eritrea Kenya Lesotho South Sudan Zimbabwe
Bangladesh China (2) India (2) Indonesia Maldives Nepal (2) Pakistan Viet Nam
Brazil (2) Ecuador Guatemala Haiti Nicaragua
Djibouti Iraq Syria Tajikistan Yemen
8 5 11 6 5
Additional financing proposals
Sierra Leone
Jordan
1 0 0 0 1
Total new projects 35
Total additional
financing 2
Total investments 37

Annex II
G
C 4
3/L
.6/R
ev.1
47
Regular budget by cost category and department, 2019 approved and realigned* budget versus 2020 proposal
Table 1A Regular budget by cost category and department, 2019 approved and realigned budget versus 2020 proposal (Millions of United States dollars)
Department
Staff Consultants Duty travel ICT non-staff costs Other costs
2019 2019
(realigned) 2020 2019
2019 (realigned)
2020 2019 2019
(realigned) 2020 2019
2019 (realigned)
2020 2019 2019
(realigned) 2020
Office of the President and Vice-President
2.30 2.47 2.75 - - 0.03 0.20 0.20 0.22 - - - 0.10 0.11 0.18
Corporate Services Support Group
7.79 7.49 7.31 0.83 0.83 0.91 0.14 0.14 0.17 0.02 0.02 0.04 0.44 0.44 0.34
External Relations and Governance Group
13.62 12.66 11.87 1.43 1.43 1.76 0.87 0.87 0.96 0.10 0.10 0.11 2.31 2.30 1.90
Strategy and Knowledge Department
13.08 13.00 13.26 1.43 1.43 0.99 0.70 0.70 0.60 - - - 0.71 0.71 0.97
Programme Management Department
34.35 32.35 32.57 15.19 15.19 15.44 6.55 6.55 6.81 - - 0.11 9.14 9.14 7.98
Financial Operations Department
10.71 10.71 11.04 2.06 2.06 1.87 0.64 0.64 0.56 - - 0.00 0.22 0.22 0.36
Corporate Services Department
13.90 13.64 14.52 2.01 2.01 1.53 0.28 0.28 0.27 5.03 5.03 4.90 5.44 5.44 5.56
Corporate cost centre 1.00 1.00 1.00 - - - - - - 0.30 0.30 0.30 3.93 3.93 3.79
(allocable)
Corporate cost centre - - - - - - - - 4.84 4.84 4.95
(not allocable)
Planned Reductions (3.43)
Total 93.31 93.31 94.32 22.94 22.95 22.51 9.38 9.38 9.60 5.45 5.45 5.45 27.12 27.12 26.02
*Realigned budget reflects the new organizational structure implemented on 30 April 2019.

Annex II
G
C 4
3/L
.6/R
ev.1
48
Table 1B Regular budget by cost category and department, 2019 approved and realigned budget versus 2020 proposal
Department
Total
2019 2019
(realigned) 2020
Change (2020 vs realigned
2019)
Office of the President and Vice-President
2.60 2.78 3.18 0.40
Corporate Services Support Group
9.21 8.92 8.77 (0.15)
External Relations and Governance Group
18.33 17.36 16.59 (0.77)
Strategy and Knowledge Department
15.92 15.84 15.81 (0.03)
Programme Management Department
65.23 63.23 62.91 (0.32)
Financial Operations Department
13.63 13.63 13.83 0.20
Corporate Services Department 26.66 26.40 26.77 0.37
Corporate cost centre 5.23
5.23
5.09 -
(0.14) (allocable)
Corporate cost centre 4.84
4.84
4.95 -
0.11 (not allocable)
Planned reductions (3.43) -
Total 158.21 158.21 157.91 (0.3)
*Realigned budget reflects the new organizational structure implemented on 30 April 2019.

Annex III GC 43/L.6/Rev.1
49
Indicative breakdown of 2020 regular budget by results
pillar and institutional output group (In millions of United States dollars)
Pillar 2018 2019 2020
US$ % of total US$ % of total US$ % of total
Pillar 1 – Country programme delivery
Country strategies and programmes 9.58 6 7.82 5 6.57 4
Country-level policy engagement (new) NA NA 1.7 1 2.13 1
Design of new loan and grant financed projects 19.1 12 19.92 12 14.85 9
Supervision and implementation support 31.16 20 26.41 16 27.71 18
Enable and support 15.2 10 20.74 13 22.43 14
Enabling management functions 3.5 2 3.76 2 3.00 2
Allocable corporate costs 2.59 2 3.24 2 3.49 2
Subtotal pillar 1 81.13 52 83.6 52 80.17 51
Pillar 2 – Knowledge building, dissemination and policy engagement Corporate knowledge and research 2.35 2 3.76 2 3.06 2
Communication and outreach (updated) 1.96 1 4.83 3 5.78 4
Knowledge promotion (not used in 2019) 3.03 2 NA NA NA
South-South and Triangular Cooperation 0.63 - 0.86 1 1.02 1
Impact assessments 1.59 1 1.3 1 1.86 1
Global policy engagement and global partnerships 2.71 2 3.32 2 3.76 2
Enable and support 2.3 1 2.9 2 2.83 2
Enabling management functions 2.6 2 1.43 1 1.09 1
Allocable corporate costs 0.57 - 0 0 0.00 0
Subtotal pillar 2 17.74 11 18.39 11 19.41 12
Pillar 3 – Financial capacity and instruments Replenishment 1.11 1 0.73 0 1.16 1
Resource mobilization and management of additional resources
2.79 2 3.8 2 3.29 2
Corporate financial management and reporting 0.94 1 0.91 1 0.90 1
Corporate fiduciary and financial risk management (updated)
1.96 1 2.53 2 2.55 2
Corporate controllership 0.26 - 0.28 0 0.66 0
Financial projections, products, strategic and operational liquidity planning/management
0.21 - 0.46 0 0.89 1
Investment portfolio management 0.49 - 0.5 0 0.53 0
Enable and support 2.59 2 3.52 2 3.95 3
Enabling management functions 1.12 1 1.5 1 1.42 1
Allocable corporate costs 0.38 - 0.2 0 0.20 0
Subtotal pillar 3 11.85 8 14.43 9 15.54 10
Pillar 4 – Institutional functions, services and governance Enabling information technology environment 6.51 5 5.38 3 5.27 3
Client-oriented transaction services 1.25 1 0.85 1 0.81 1
Administrative services 2.05 1 2.44 2 1.97 1
Headquarters security services 1.38 1 1.39 1 1.30 1
Facilities management 2.83 2 2.7 2 2.57 2
Human resource management 4.99 3 4.08 3 4.64 3
Corporate planning, budgeting and reporting 2 1 3.98 2 3.63 2
Budget planning, monitoring and organizational development (combined with above IOG in 2019)
2.5 2 NA NA NA NA
Internal oversight and risk management 2.98 2 3.15 2 3.40 2
Corporate legal services 0.59 - 0.55 0 0.57 0
IFAD management functions 1.26 1 1.79 1 1.55 1
In-house communications 0.4 - 0.38 0 0.32 0
Ethics Office 0.48 - 0.68 0 0.69 0
Governing Bodies 5.04 3 4.97 3 5.24 3

Annex III GC 43/L.6/Rev.1
50
Membership and protocol 1.03 1 1.01 1 0.47 0
Enable and support 1.61 1 2.87 2 1.55 1
Enabling management functions 1.83 1 2.37 1 2.43 2
Allocable corporate costs 1.28 1 1.8 1 1.40 1
Unallocable corporate costs 4.81 3 4.84 3 4.95 3
Subtotal pillar 4 44.82 29 45.22 28 42.78 27
Subtotal 155.5 100 161.6 100 157.90 100
Planned reductions -3.43
Total 155.5 100 158.2 100 157.90 100

Annex IV GC 43/L.6/Rev.1
51
Indicative 2020 staff levels, regular budget only (Full-time equivalents)a
Continuing and fixed-term staff
Department Professional
and higher General Service
Total continuing and fixed-term staff
Locally recruited field staff
Total 2020
Office of the President and Vice-President (OPV) 9 6.5 15.5 0 15.5 Corporate Services Support Group (CSSG)
Office of the General Counsel 13 4.5 17.5 0 17.5 Office of Budget and Organizational Development 4 1 5 0 5 Office of Audit and Oversight 9 2.5 11.5 0 11.5 Ethics Office 2 1 3 0 3 Quality Assurance Group 4 2 6 0 6 Change, Delivery and Innovation Unit 2 2 0 2 Subtotal CSSG 34 11 45 0 45
External Relations and Governance
ERG front office 2 1 3 0 3 Partnership and Resource Mobilization Office & Global Engagement and Multilateral Relations Divisionb
18 5 23 3 26
Office of the Secretary 11 16 27 0 27 Communications Division 18 4 22 5 27 Subtotal ERG 49 26 75 8 83
Strategy and Knowledge Department (SKD)
SKD front office 5 2 7 0 7 Environment, Climate, Gender and Social Inclusion Division
16 5 21 5 26
Sustainable Production, Markets and Institutions Division
28 8 36 5 41
Research and Impact Assessment Division 6 2 8 0 8 Subtotal SKD 55 17 72 10 82
Programme Management Department (PMD) 0 PMD front office 3 3 6 0 6 Operational Policy and Results Division 14 4 18 0 18 West and Central Africa Division 25 7 32 23 55 East and Southern Africa Division 21 6 27 20 47 Asia and the Pacific Division 22 7 29 23 52 Latin America and the Caribbean Division 18 5 23 8 31 Near East, North Africa and Europe Division 22 7 29 11 40 Subtotal PMD 125 39 164 85 249
Financial Operations Department (FOD)
FOD front office (incl. Risk Unit) 7 1 8 0 8 Financial Management Services Division 19 4 23 6 29 Accounting and Controller’s Division 11 12 23 0 23 Treasury Services Division 13 4 17 0 17 Subtotal FOD 50 21 71 6 77
Corporate Services Department (CSD) 0 CSD front office (incl. Medical Service Unit) 3 2 5 0 5 Human Resources Division 14 9 23 0 23 Administrative Services Division 12 26.5 38.5 0 38.5 Field Support Unit 4 2 6 0 6 Information and Communications Technology
Division 19 15 34 0 34
Subtotal CSD 52 54.5 106.5 0 106.5
Grand total 2020 374 175 549 109 658
Grand total 2019 362 198.5 560.5 112 632.5
a 1 FTE = 12 months. Includes part-time staff corresponding to less than one FTE. b As a result of the Operational Excellence for Results review the Partnership and Resource Mobilization Office and Global Engagement and Multilateral Relations Division were merged in 2019.

Annex V GC 43/L.6/Rev.1
52
Indicative 2020 staffing by department and grade (Full-time equivalents)
Category Grade OPV CSSG ERG SKD PMD FOD CSD 2020 total
2019 total
Professional and higher *
Department head and above
2
1 1 1 1 1 7
7
D-2 1 1
1 3 4
D-1
3 4 3 6 3 2 21 21
P-5 2 5 6 23 36 5 8 85 88
P-4 3 10 15 18 43 14 16 119 110
P-3
12 18 8 31 19 13 101 93
P-2 1 3 5 1 8 4 11 33 34
P-1
1
4
5 3
Subtotal – Prof. and higher 9 34 49 55 125 50 52 374 362
National Officer
NOD 0 1
NOC 2 37 39 41
NOB 7 8 0 4 19 18
NOA 15 15 22
Subtotal – National officer 0 0 7 10 52 4 0 73 82
Subtotal – Professional
9 34 56 65 177 54 52 447 444
HQ General service*
G-7 0 1
G-6 2 2 6 4 23 5 17 59 57
G-5 2 5 12 7 8 13 18 65 74
G-4 1.5 3 5 1 7 1 13.5 32 44.5
G-3 1 1 3 5 1 2 5 18 17
G-2 1 1 5
Subtotal – HQ General Service
6.5 11 26 17 39 21 54.5 175 198.5
National General Service
G-6 1 1 3
G-5 1 22 1 26
G-4 10 1
G-3 0
Subtotal – National General Service
0 0 1 0 33 2 0 36 30
Subtotal – General Service
6.5 11 27 17 72 23 54.5 211 228.5
Total 15.5 45 83 82 249 77 106.5 658 672.5
Planned reductions -40
Total after reductions 15.5 45 83 82 249 77 106.5 658 632.5
Percentage Professional category
58% 76% 67% 79% 71% 70% 49% 68% 66%
Percentage General Service category
42% 24% 33% 21% 29% 30% 51% 32% 34%
Ratio Professional to General Service
1.4 3.1 2.1 3.8 2.5 2.3 1.0 2.1 1.9

Annex VI GC 43/L.6/Rev.1
53
Staff costs
1. The budget for staff costs is generally prepared in accordance with the rules
and regulations applied to salaries, allowances and benefits of staff members of
the United Nations, who are largely governed by the recommendations of the
International Civil Service Commission of the United Nations Common System.
2. Standard rates are developed for each grade level, based on an analysis of
statistical data for the IFAD population and actual expenditures relating to IFAD
staff. The various components of standard costs represent the best estimate at
the time of preparation of the budget document.
3. The change in standard costs from 2019 to 2020 primarily reflects the impact
of the change in the exchange rate, within-grade-step increment (WIGSI)
adjustment, and changes to salary scales and in some benefits, as reflected in
the table below.
Composition of standard staff costs (Millions of United States dollars)
Category description
2020 FTEs at
2019 rates
2020 FTEs at
2020 rates
(Decrease)
Increase
Professional staff
Salaries
29.15 30.79
1.64
Post adjustment
12.52 11.70
(0.83)
Pension and medical
13.46 13.58
0.12
Education grants
5.13 4.59
(0.54)
Repatriation, separation and annual leave
2.48 2.89
0.40
Home leave
1.50 1.32
(0.18)
Dependency allowances
1.26 1.20
(0.06)
United States tax reimbursement
1.29 1.13
(0.16)
Other allowances
3.38 4.02
0.64
Centralized recruitment costs
1 1
-
Subtotal 71.17 72.20 1.04
General Service staff
Salaries 10.98 11.02 0.04
Pension and medical 4.05 3.29 (0.76)
Language allowance 0.53 0.46 (0.06)
Repatriation and separation 1.05 0.99 (0.06)
Other allowances 0.44 0.39 (0.05)
Subtotal 17.04 16.15 (0.90)
Locally recruited country presence staff 7.16 5.98 (1.18)
Total regular staff costs 95.37 94.33 (1.04)

Annex IV
Annex V
II
GC 4
3/L
.6/R
ev.1
54
Capital budget (excluding CLEE), 2008-2019 (Thousands of United States dollars)
2008 2009 2010 2011 2012 2013 2014 2015 2016 2017 2018 2019 Total
ICT initiatives
Loans and grants 710 1 050 2 000 12
000 - - - - - - - -
15 760
(IFAD Client Portal/Loans and Grants System replacement) - - - - - - - - - - - - -
Human resources reform
134 541 400 500 - 575 400 480 286 - - 3 316
IFAD Country Office infrastructure enhancement – IT and communications
- - - - - 1 170 - - - -
-
- 1 170
Institutional efficiency (Automated
voting system) 556 300 470 1 423 - 780 787 600 975 775
-
210 6 876
Delivering as One - 440 300 - - - - - - -
- - 740
Knowledge management - - - - - - 613 - - -
- - 613
IT infrastructure 600 1 200 360 375 3 215 775 497 1 200 470 890 900 640 11
122
Budget and planning systems - - - - - - - - 375 - - 150 525
Transparency/accountability - - - - - - - - - - 500 - 500
Borrowing and financial systems - - - - - - - - - - 300 1 250 1 550
Corporate analytics - - - - - - - - - - 150 195 345
Subtotal ICT initiatives 2 000 3 531 3 530 14
298 3 215 3 300 2 297 1 800 2 300 1 951 1 850 2 445
42 517
Non-IT headquarters projects - 550 - 889 - - - 890 - - - 100 2 429
ICO security and vehicles/MOSS compliance* - - - - 281 400 - - 100 454 100 100 1 435
Total 2 000 4 081 3 530 15
187 3 496 3 700 2 297 2 690 2 400 2 405 1 950 2 645
46 381
* MOSS = United Nations Minimum Operating Security Standards.

Annex VIII GC 43/L.6/Rev.1
55
Carry-forward funds allocation (Thousands of United States dollars)
Department Description of use of carry-forward funds 2018
3 per cent carry-forward
OPV Production of the IFAD 2.0 paper and strengthening of the enterprise risk management function and related activities. 80
CSSG Innovation challenge (710), confidential communication to Sexual Exploitation and Abuse focal points, external review of IFAD investigation and sanction process. 880
ERG Support to partnerships and private sector engagement, in particular through the Food System Action Platform and Smallholder Agriculture Finance and Investment Network; support to communication and IFAD's increased visibility activities; increased global engagement through active participation in the International Conference on Social Protection for Inclusive Rural Transformation, the International Launch of the United Nations Decade of Family Farming 2019-2028 and the IFAD High-level Side Event during the 74th Session of the General Assembly of the United Nations.
Support IFAD Replenishment and IFAD 2.0 through the 2nd session of Eminent Group of Independent Advisors to IFAD and preparatory activities for IFAD12. 1 200
SKD Support to mainstreaming thematic areas (youth, gender, nutrition, mainstreaming/transformational approaches), partnerships and private sector engagement operations (Agribusiness Capital Fund) and private sector strategy formulation, Impact assessments and preparation of the 2019 Rural Development Report and IFAD's Information and Communication Technology for Development (ICT4D) Strategy. 2 100
PMD Support to PoLG delivery and disbursement, especially in fragile contexts; implementation of RBA Joint Country Strategies, support for decentralization process and ICO administrative and operational activities, i.e. Operations Academy; operational risk management enhancement through roll-out of the new risk-based approach to project procurement; support for special project and partnership initiatives. 1 870
FOD IFAD financial model enhancement and credit rating and preferred creditor status assessment preparatory work, implementation of the recommendations on financial architecture made in the Alvarez & Marsal and corporate-level evaluation reports; and specialized training sessions in finance, treasury and risk management for the Executive Board and senior Management. 1 030
CSD Recalibrating business processes activities, including HRD development, IT/Facilities infrastructure and Global Staff Survey action plan*. In particular, 360 feedback pilot process, staff exchange programme, training courses for staff career development and for managing stress relating to air travel, support to administrative processes and procedures for the smooth completion of the fit-for-purpose exercise and support to roll out talent management framework components and the e-performance evaluation system (ePES); incremental funds for training and coaching to address specific needs of underperformers and support for the finalization of the promotion policy. 660
Corporate and unplanned/unanticipated expenditure requirements
Uninterrupted power supply batteries replacement and provision for cases under the mandatory age of separation (MAS) 65 rule.
330
Total 8 140
* The total amount of carry-forward resources allocated towards the 2019 Global Staff Survey action plan, including the Innovation Challenge and other activities, is US$1.48 million.

Annex IX GC 43/L.6/Rev.1
56
Estimate of direct charges on investment income (Thousands of United States dollars)
2018 2019 2020
Management fees
Global government bonds 243 0 0
Global diversified fixed income bonds 270 270 0
Global inflation-indexed bonds 220 0 0
Emerging market debt bonds 315 0 0
Global diversified short term bonds - 180 180
Contingent management fees - - -
Subtotal management fees 1 048 450 180
Custodian fees 425 360 325
Subtotal custodian fees 425 360 325
Advice, information and trade support
Financial information providers 407 520 560
Consultants and financial advisers 325 550 800
IT systems - 710 710
Due diligence travel 65 65 65
Subtotal advice, information and trade support 797 1 845 2 135
Overall total 2 270 2 655 2 640

Annex X
GC 4
3/L
.6/R
ev.1
57
IOE Results Measurement Framework for 2016–2018 (extended to 2020)17
Strategic objectives Divisional management results (DMRs) Key performance indicators
Baseline
2011
Target
(per year) Means of verification
Strategic objective 1: Generate evidence through independent evaluations of IFAD’s performance and results to promote accountability
DMR 1: Corporate policies and processes are improved through independent evaluations
1. Adoption rate of recommendations from CLEs, CSPEs, ESRs and PPEs
n/a 90%
President’s Report on the Implementation Status of Evaluation Recommendations and Management Actions (PRISMA) and IOE work programme and budget document
DMR 2: Country strategies/COSOPs are enhanced through country-level evaluations
DMR 3: Systemic issues and knowledge gaps in IFAD are addressed
DMR 4: IFAD-supported operations are improved through independent project evaluations
Strategic objective 2: Promote evaluation-based learning and an enhanced results culture for better development effectiveness
DMR 5: The evaluation manual is implemented and new evaluation methods and products are piloted
2. Range of new methods and designs applied n/a. 2 IOE evaluations
3. Evaluations with quantitative analysis n/a 3
(in the entire period) IEs
DMR 6: Awareness and knowledge of evaluation-based lessons and quality of products are enhanced and increased
4. Number of outreach products for all evaluations disseminated through social tools and the internet
n/a 70
5. Number of in-country learning events co-organized by IOE with governments
4 5
6. Number of in-house and external knowledge events organized by IOE
5 5
7. Number of page views for IOE reports n/a 55 000
8. Number of people receiving IOE newsletters n/a 2 500
DMR 7: ECD in partner countries
9. Number of ECD seminars/workshops organized in partner countries
1 1
IOE records 10. Number of events attended by IOE staff related to self-evaluation and ECD
n/a 3
Strategic objectives
1 and 2
DMR 8: Efficiency of the independent evaluation function and liaison with governing bodies are ensured
11. Budget cap <0.9% of IFAD PoLG < 0.9% of IFAD PoLG
12. Ratio of professional to general service staff n/a 1:0.46
13. Budget execution rate at year-end n/a 97%
14. Execution rate of key evaluation activities n/a 95%
17 This framework may be revised for 2021 to include the recommendations from the external peer review.
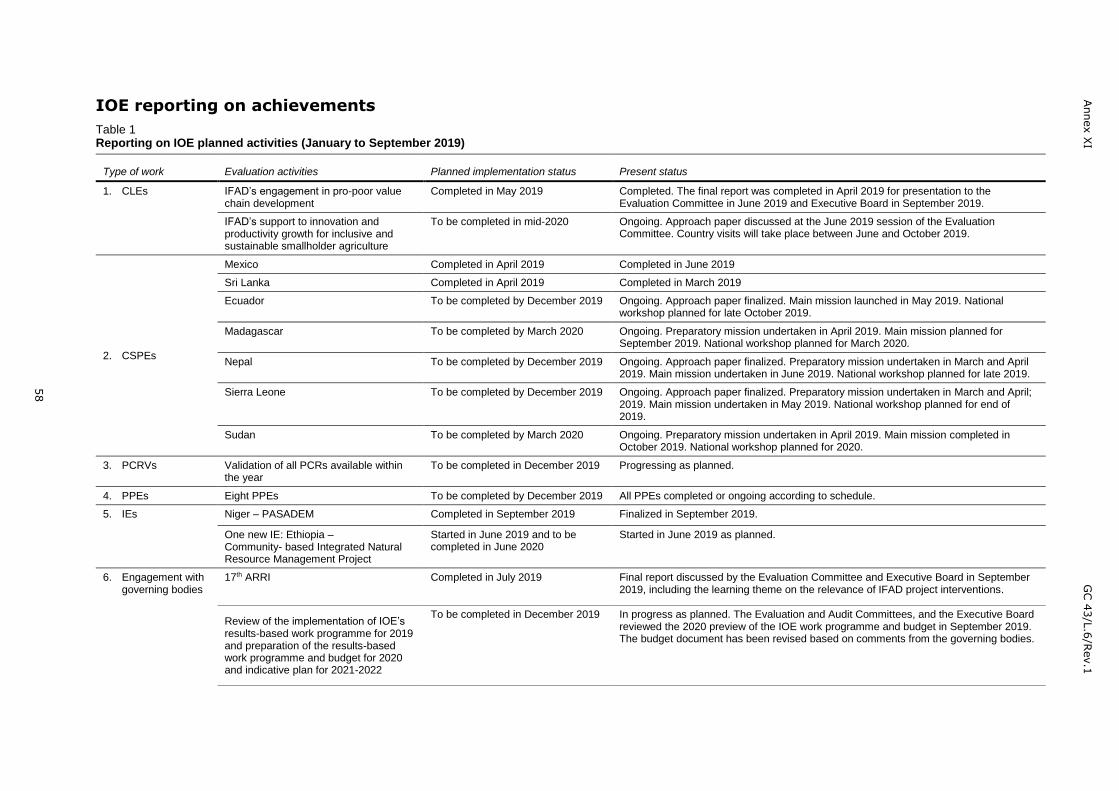
Annex X
I
GC 4
3/L
.6/R
ev.1
58
IOE reporting on achievements
Table 1 Reporting on IOE planned activities (January to September 2019)
Type of work Evaluation activities Planned implementation status Present status
1. CLEs IFAD’s engagement in pro-poor value chain development
Completed in May 2019 Completed. The final report was completed in April 2019 for presentation to the Evaluation Committee in June 2019 and Executive Board in September 2019.
IFAD’s support to innovation and productivity growth for inclusive and sustainable smallholder agriculture
To be completed in mid-2020 Ongoing. Approach paper discussed at the June 2019 session of the Evaluation Committee. Country visits will take place between June and October 2019.
2. CSPEs
Mexico Completed in April 2019 Completed in June 2019
Sri Lanka Completed in April 2019 Completed in March 2019
Ecuador To be completed by December 2019 Ongoing. Approach paper finalized. Main mission launched in May 2019. National workshop planned for late October 2019.
Madagascar To be completed by March 2020 Ongoing. Preparatory mission undertaken in April 2019. Main mission planned for September 2019. National workshop planned for March 2020.
Nepal To be completed by December 2019 Ongoing. Approach paper finalized. Preparatory mission undertaken in March and April 2019. Main mission undertaken in June 2019. National workshop planned for late 2019.
Sierra Leone To be completed by December 2019 Ongoing. Approach paper finalized. Preparatory mission undertaken in March and April; 2019. Main mission undertaken in May 2019. National workshop planned for end of 2019.
Sudan To be completed by March 2020 Ongoing. Preparatory mission undertaken in April 2019. Main mission completed in October 2019. National workshop planned for 2020.
3. PCRVs Validation of all PCRs available within the year
To be completed in December 2019 Progressing as planned.
4. PPEs Eight PPEs To be completed by December 2019 All PPEs completed or ongoing according to schedule.
5. IEs Niger – PASADEM Completed in September 2019 Finalized in September 2019.
One new IE: Ethiopia – Community- based Integrated Natural Resource Management Project
Started in June 2019 and to be completed in June 2020
Started in June 2019 as planned.
6. Engagement with governing bodies
17th ARRI Completed in July 2019 Final report discussed by the Evaluation Committee and Executive Board in September 2019, including the learning theme on the relevance of IFAD project interventions.
Review of the implementation of IOE’s results-based work programme for 2019 and preparation of the results-based work programme and budget for 2020 and indicative plan for 2021-2022
To be completed in December 2019 In progress as planned. The Evaluation and Audit Committees, and the Executive Board reviewed the 2020 preview of the IOE work programme and budget in September 2019. The budget document has been revised based on comments from the governing bodies.
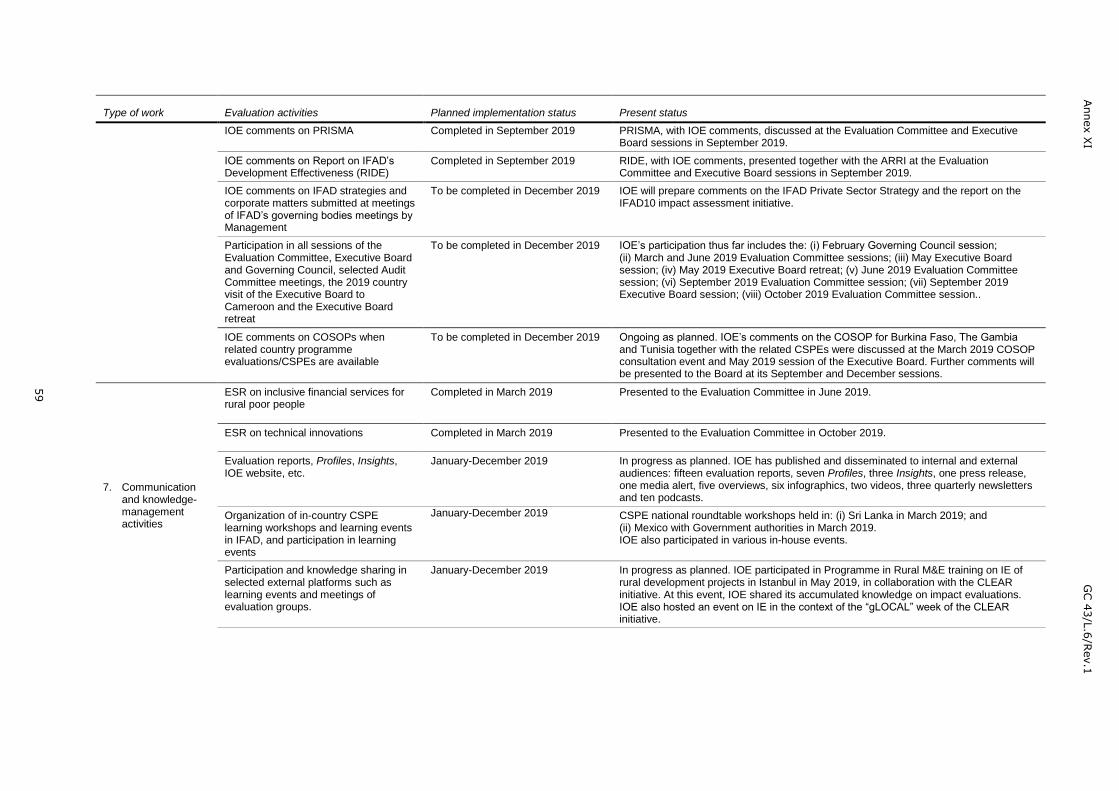
Annex X
I
GC 4
3/L
.6/R
ev.1
59
Type of work Evaluation activities Planned implementation status Present status
IOE comments on PRISMA Completed in September 2019 PRISMA, with IOE comments, discussed at the Evaluation Committee and Executive Board sessions in September 2019.
IOE comments on Report on IFAD’s Development Effectiveness (RIDE)
Completed in September 2019 RIDE, with IOE comments, presented together with the ARRI at the Evaluation Committee and Executive Board sessions in September 2019.
IOE comments on IFAD strategies and corporate matters submitted at meetings of IFAD’s governing bodies meetings by Management
To be completed in December 2019 IOE will prepare comments on the IFAD Private Sector Strategy and the report on the IFAD10 impact assessment initiative.
Participation in all sessions of the Evaluation Committee, Executive Board and Governing Council, selected Audit Committee meetings, the 2019 country visit of the Executive Board to Cameroon and the Executive Board retreat
To be completed in December 2019 IOE’s participation thus far includes the: (i) February Governing Council session; (ii) March and June 2019 Evaluation Committee sessions; (iii) May Executive Board session; (iv) May 2019 Executive Board retreat; (v) June 2019 Evaluation Committee session; (vi) September 2019 Evaluation Committee session; (vii) September 2019 Executive Board session; (viii) October 2019 Evaluation Committee session..
IOE comments on COSOPs when related country programme evaluations/CSPEs are available
To be completed in December 2019 Ongoing as planned. IOE’s comments on the COSOP for Burkina Faso, The Gambia and Tunisia together with the related CSPEs were discussed at the March 2019 COSOP consultation event and May 2019 session of the Executive Board. Further comments will be presented to the Board at its September and December sessions.
7. Communication and knowledge- management activities
ESR on inclusive financial services for rural poor people
Completed in March 2019 Presented to the Evaluation Committee in June 2019.
ESR on technical innovations Completed in March 2019 Presented to the Evaluation Committee in October 2019.
Evaluation reports, Profiles, Insights, IOE website, etc.
January-December 2019 In progress as planned. IOE has published and disseminated to internal and external audiences: fifteen evaluation reports, seven Profiles, three Insights, one press release, one media alert, five overviews, six infographics, two videos, three quarterly newsletters and ten podcasts.
Organization of in-country CSPE learning workshops and learning events in IFAD, and participation in learning events
January-December 2019 CSPE national roundtable workshops held in: (i) Sri Lanka in March 2019; and (ii) Mexico with Government authorities in March 2019. IOE also participated in various in-house events.
Participation and knowledge sharing in selected external platforms such as learning events and meetings of evaluation groups.
January-December 2019 In progress as planned. IOE participated in Programme in Rural M&E training on IE of rural development projects in Istanbul in May 2019, in collaboration with the CLEAR initiative. At this event, IOE shared its accumulated knowledge on impact evaluations. IOE also hosted an event on IE in the context of the “gLOCAL” week of the CLEAR initiative.

Annex X
I
GC 4
3/L
.6/R
ev.1
60
Type of work Evaluation activities Planned implementation status Present status
Attendance at all Operational Strategy and Policy Guidance Committee (OSC) meetings to discuss corporate policies and strategies, COSOPs and selected projects evaluated by IOE;
Attendance as observer at Operations Management Committee (OMC) meetings, quality assurance learning sessions, IFAD Management Team meetings and selected country programme management team meetings
January-December 2019 In progress as planned. These forums provide IOE with opportunities to share evaluation lessons with IFAD Management and staff in order to strengthen the design of new policies, strategies and operations. IOE staff have participated in several OSC meetings relevant to monitoring and evaluation. On 1 June 2017, IOE began providing a one-page document containing IOE’s comments in advance of OSC meetings. IOE has also participated in portfolio stocktaking meetings held by IFAD’s regional divisions. Finally, IOE’s Director and Deputy Director have participated in IFAD Management Team meetings.
8. Partnerships
Evaluation Cooperation Group and United Nations Evaluation Group (UNEG)
January-December 2019 In progress as planned.
IOE will participate in the spring meeting of the multilateral development banks’ Evaluation Cooperation Group in June 2019, hosted by the Black Sea Trade and Development Bank in Thessaloniki, Greece. IOE also participated in the 2019 UNEG Evaluation Week in Nairobi, in May 2019. IOE will also be participating in the IDEAS conference in Prague in October 2019. IOE will participate in the December 2019 meeting of the Evaluation Cooperation Group.
Contributions as external peer reviewer to evaluations by other international organizations as requested
January-December 2019 In progress. Completed three peer reviews of Global Environment Facility projects. Peer reviewed the draft Annual Evaluation Review of the Independent Evaluation Department of the Asian Development Bank.
Implementation of joint statement by FAO, IFAD and WFP to strengthen collaboration on evaluation
January-December 2019 The RBAs are continuing collaboration through a community of practice to exchange knowledge and experience for enhancing the evaluations of projects and programmes focused on agriculture, food security and rural development.
The RBAs’ heads of evaluation are interacting regularly along with informal interactions among staff of the RBAs’ evaluation offices to exchange views, experiences and knowledge on evaluation matters, and identify opportunities for joint collaboration.
9. Methodology
Trainings January-December 2019 In progress as planned.
Contribution to in-house and external debates on IEs and ESRs, including the Sustainable Development Goals
January-December 2019 Participated in the training programme in Istanbul in May 2019.
10. ECD
One-time activity
Engagement in ECD in the context of regular evaluation processes
January-December 2019 Ongoing. Engagement in Programme in Rural M&E training on IE of rural development projects in Istanbul.
Organization of workshops in partner countries on evaluation methodologies and processes (upon request)
January-December 2019 Ongoing. Engagement in the CLEAR gLOCAL initiative.
IOE external peer review Completed in September 2019 Presented to the Evaluation Committee and Executive Board in September 2019.

Annex X
I
GC 4
3/L
.6/R
ev.1
61
Table 2 Reporting on IOE key performance indicators (January to June 2019)
Strategic objectives Divisional management results (DMRs) Key performance indicators
Achievements as of October 2019
Target
(2019) Means of
verification
SO1: Generate evidence through independent evaluations of IFAD’s performance and results to promote accountability
DMR 1: Corporate policies and processes are improved through independent evaluations
1. Adoption rate of recommendations from CLEs, CSPEs, ESRs and PPEs
n/a 90%
PRISMA and IOE work programme, and budget document
DMR 2: Country strategies/COSOPs are enhanced through country-level evaluations
DMR 3: Systemic issues and knowledge gaps in IFAD are addressed
DMR 4: IFAD-supported operations are improved through independent project evaluations
SO2: Promote evaluation-based learning and an enhanced results culture for better development effectiveness
DMR 5: The evaluation manual is implemented and new evaluation methods and products are piloted
2. Range of new methods and designs applied 2 2 IOE evaluations
3. Evaluations with quantitative analysis 4 4 IEs and CSPEs
DMR 6: Awareness and knowledge of evaluation-based lessons and quality of products are enhanced and increased
4. Number of outreach products for all evaluations disseminated through social tools and the Internet
72 70
IOE records
5. Number of in-country learning events co-organized by IOE with governments
2 5
6. Number of in-house and external knowledge events organized by IOE
9 3
7. Number of page views for IOE reports 28 93718 55 000
8. Number of people receiving IOE newsletters 2 459 2 500
DMR 7: ECD in partner countries
9. Number of ECD seminars/workshops organized in partner countries
1 1 IOE records
10. Number of events attended by IOE staff related to self-evaluation and ECD
1 3
SO1 and SO2 DMR 8: Efficiency of the independent evaluation function and liaison with governing bodies are ensured
11. Budget cap 0.3% of IFAD PoLG < 0.9% of IFAD PoLG
IOE records 12. Ratio of professional to general service staff 1:0.46 1:0.46
13. Budget execution rate at year-end 98%
14. Execution rate of key evaluation activities 90% 98%
Note: Based on IOE’s 2016-2018 Results Measurement Framework, the following reporting matrix provides an overview of IOE achievements as of June 2019 against key performance indicators as agreed upon with the Executive Board.
18 As of mid September.

Annex X
II
GC 4
3/L
.6/R
ev.1
62
IOE proposed evaluation activities for 2020 and indicative plan for 2021-2022 Table 1 Proposed IOE work programme for 2020 by type of activity
Type of work Proposed activities for 2020 Start date Expected finish date
1. CLEs
IFAD’s support to innovations for inclusive and sustainable smallholder agriculture
Apr-19 June-20
Joint CLE with the evaluation offices of WFP and FAO on collaboration among RBAs
Sept-20 Dec-21
2. TE IFAD’s contribution to smallholder adaptation to climate change Jan-20 March-21
3.CSPEs
Burundi Apr-20 Apr-21
Pakistan Jan20 Dec 20
Morocco Jan-20 Dec-20
Niger Apr-20 Apr-21
Uganda Jan-20 Dec-20
4. PCRVs Validation of all PCRs available in the year Jan-20 Dec-20
5. ESRs Rural infrastructure Jan-20 Dec-20
6. PPEs Six PPEs Jan-20 Dec-20
7. IEs IE in Ethiopia Jul-19 Jun-20
New Impact evaluation July-20 June-21
8. Engagement with governing bodies
Review of implementation of IOE’s results-based work programme and budget for 2019, and indicative plan for 2020-2021, and preparation of results-based work programme and budget for 2020 and indicative plan for 2021-2022
Jan-20 Dec-20
18th ARRI Jan-20 Sept-20
IOE comments on the PRISMA Jan-20 Sept-20
IOE comments on the RIDE Jan-20 Sept-20
IOE comments on policies and strategies by IFAD Management Jan-20 Dec-20
Participation in Evaluation Committee, Executive Board and Governing Council sessions, selected Audit Committee meetings and the 2020 Board country visit
Jan-20 Dec-20
IOE comments on COSOPs when related CSPEs are available Jan-20 Dec-20

Annex X
II
GC 4
3/L
.6/R
ev.1
63
Type of work Proposed activities for 2020 Start date Expected finish date
9. Communication and knowledge-management activities
Evaluation reports, Profiles, Insights, website, etc. Jan-20 Dec-20
Organization of in-country CSPE learning workshops and learning events in IFAD
Jan-20 Dec-20
Participation and knowledge sharing through selected external platforms such as learning events and meetings of evaluation groups
Jan-20 Dec-20
Attendance at all OSC meetings that discuss corporate policies, strategies, COSOPs and selected projects recently evaluated by IOE. Attendance at meetings of OMC and IFAD Management Team
Jan-20 Dec-20
10. Partnerships ECG, UNEG Jan-20 Dec-20
Contribution as external peer reviewer to evaluations by other multilateral and bilateral organizations as requested
Jan-20 Dec-20
Implementation of joint statement by CGIAR, FAO, IFAD and WFP to strengthen collaboration in evaluation
Jan-20 Dec-20
11. Methodology Contribution to in-house and external debate on impact evaluation Jan-20 Dec-20
Drafting of new Evaluation Policy Jan-20 Dec-20
12. ECD Engagement in ECD in the context of regular evaluation processes Jan-20 Dec-20
Organization of workshops in partner countries (as per request) on evaluation methodologies and processes
Jan-20 Dec-20

Annex X
II
GC 4
3/L
.6/R
ev.1
64
Table 2 IOE indicative plan for 2021-2022 by type of activity*
Type of work Indicative plan for 2021-2022 Year
1. CLEs Joint CLE with the evaluation offices of WFP and FAO on country-level collaboration among RBAs
2021 (completion)
Progress on IFAD’s decentralization reform 2022
2. TE Inclusion of youth in rural development 2021-2022
3. CSPEs
Colombia 2021
Indonesia 2021
Sao Tome and Principe 2021
Uzbekistan 2021
Benin 2022
China 2022
Kyrgyzstan 2022
Malawi 2022
Paraguay 2022
4. ESRs Rural enterprise development 2021
5. PCRVs Validate all PCRs available in the year 2021-2022
6. PPE 12 to 16 PPEs 2021-2022
7. Engagement with governing bodies
19th and 20th ARRIs 2021-2022
Review of implementation of results-based work programme and budget for 2020 and indicative plan for 2021-2022, and preparation of results-based work programme and budget for 2021, and indicative plan for 2022-2023
2021-2022
IOE comments on the PRISMA 2021-2022
IOE comments on the RIDE 2021-2022
IOE comments on selected IFAD operational policies, strategies and processes prepared by IFAD Management for consideration by the Evaluation Committee
2021-2022
Participation in all sessions of Evaluation Committee, Executive Board and Governing Council, and the annual country visit of the Board
2021-2022
IOE comments on COSOPs when related country programme evaluations/CSPEs are available 2021-2022
8. Communication and knowledge-management activities
Evaluation reports, Profiles, Insights, website, etc. 2021-2022
Evaluation synthesis on rural enterprise development approaches 2021

Annex X
II
GC 4
3/L
.6/R
ev.1
65
Type of work Indicative plan for 2021-2022 Year
Evaluation synthesis on contributing to improved households income and assets; or food security 2021
Attend all OSC meetings that discuss corporate policies and strategies, COSOPs and selected projects evaluated by IOE; attend meetings of OMC, IFAD Management Team and selected country programme management teams
2021-2022
9. Partnership
ECG, UNEG 2021-2022
Implement joint statement by FAO, IFAD and WFP to strengthen collaboration in evaluation 2021-2022
Contribute as external peer reviewer to key evaluations by other multilateral and bilateral organizations as requested
2021-2022
10. Methodology Drafting of new evaluation manual 2021-2022
11. ECD Implement activities in partner countries related to ECD 2021-2022
* The topics and number of TEs, CLEs, CSPEs and ESRs are tentative; actual priorities and numbers of activities to be undertaken in 2021 and 2022 will be confirmed or determined in 2020.

Annex X
III
GC 4
3/L
.6/R
ev.1
66
IOE staffing for 2020
Table 1 Total IOE staff levels for 2020
2013 level 2014 level 2015 level 2016 level 2017 level
2020 (proposed)
2018 Level 2019 Professional staff General service staff Total
18.5 18.5 19 19 20 20 20 14 6 20
Table 2 Human resource category
Category 2017 2018 2019 2020 (proposed)
Professional staff
Director 1 1 1 1
Deputy Director 1 1 1 1
Lead evaluation officers 3 3 3 3
Evaluation officers 7 7 7 6
Evaluation research analyst 1 2 2 2
Evaluation knowledge and communication officer 1 - - 1
Subtotal professional staff 14 14 14 14
General service staff
Administrative assistant 1 1 1 1
Assistant to Director 1 1 1 1
Assistant to Deputy Director 1 1 1 1
Evaluation assistants 3 3 3 3
Subtotal general service staff 6 6 6 6
Grand total 20 20 20 20
Table 3 IOE general service staff levels
2010 2011 2012 2013 2014 2015 2016 2017 2018 2019
2020
(proposed)
8 8 8 6 6 6 6 6 6 6 6
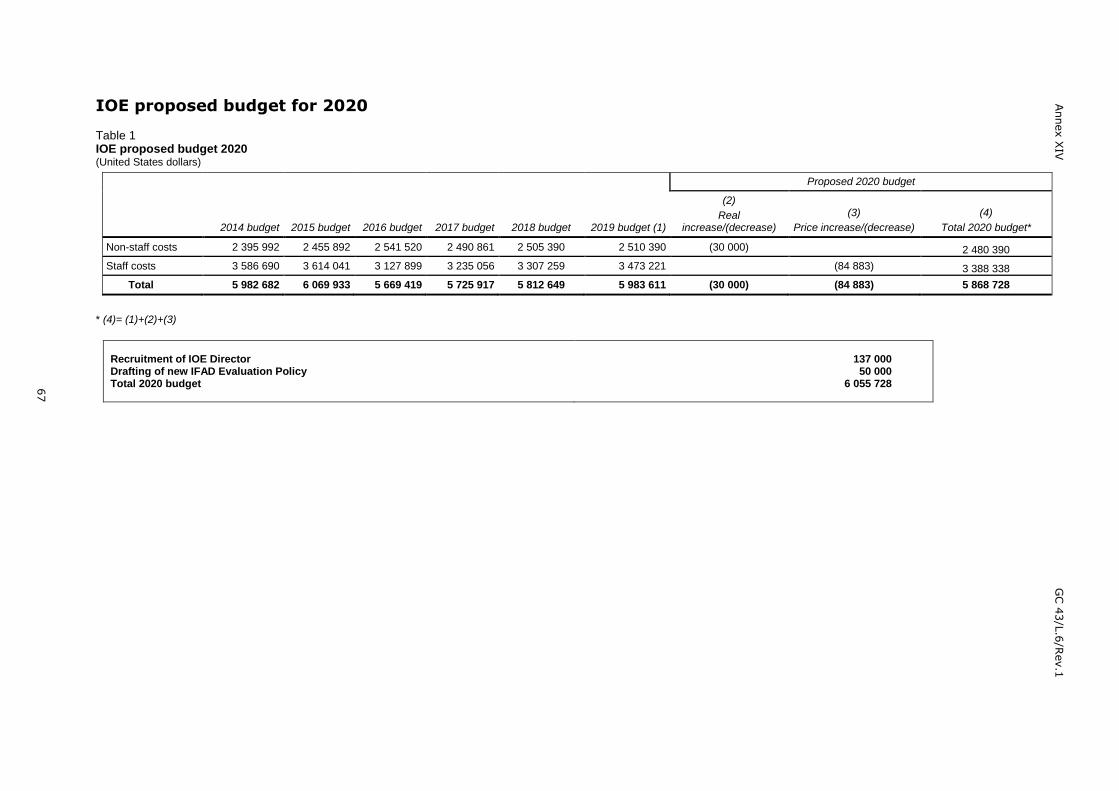
Annex X
IV
G
C 4
3/L
.6/R
ev.1
67
IOE proposed budget for 2020
Table 1 IOE proposed budget 2020 (United States dollars)
2014 budget 2015 budget 2016 budget 2017 budget 2018 budget 2019 budget (1)
Proposed 2020 budget
(2)
Real increase/(decrease)
(3)
Price increase/(decrease)
(4)
Total 2020 budget*
Non-staff costs 2 395 992 2 455 892 2 541 520 2 490 861 2 505 390 2 510 390 (30 000) 2 480 390
Staff costs 3 586 690 3 614 041 3 127 899 3 235 056 3 307 259 3 473 221 (84 883) 3 388 338
Total 5 982 682 6 069 933 5 669 419 5 725 917 5 812 649 5 983 611 (30 000) (84 883) 5 868 728
* (4)= (1)+(2)+(3)
Recruitment of IOE Director Drafting of new IFAD Evaluation Policy Total 2020 budget
137 000 50 000
6 055 728