ifad’s 2015 results-based programme of work and … 38/l.6 i ifad’s 2015 results-based programme...
TRANSCRIPT

Note to Governors
Focal points:
Technical questions: Dispatch of documentation:
Saheed AdegbiteDirectorBudget and Organizational Development UnitTel.: +39 06 5459 2957e-mail: [email protected]
Deirdre McGrenraHead, Governing Bodies OfficeTel.: +39 06 5459 2374e-mail: [email protected]
Tilak SenBudget AdviserTel.: +39 06 5459 2229e-mail: [email protected]
Edward GallagherSenior Budget SpecialistTel.: +39 06 5459 2484e-mail: [email protected]
Oscar A. GarciaDirectorIndependent Office of Evaluation of IFADTel.: +39 06 5459 2274e-mail: [email protected]
Ashwani MuthooDeputy DirectorTel.: +39 06 5459 2053e-mail: [email protected]
Governing Council — Thirty-eighth SessionRome, 16-17 February 2015
For: Approval
Document: GC 38/L.6
EAgenda: 9Date: 15 January 2015Distribution: PublicOriginal: English
IFAD’s 2015 results-based programme ofwork and regular and capital budgets, the IOEresults-based work programme and budgetfor 2015 and indicative plan for 2016-2017,and the HIPC and PBAS progress reports
GC 38/L.6
i
IFAD’s 2015 results-based programme of work andregular and capital budgets, the IOE results-basedwork programme and budget for 2015 and indicativeplan for 2016-2017, and the HIPC and PBAS progressreports
1. The attached document sets forth IFAD’s 2015 results-based programme ofwork and regular and capital budgets, the budget of the Independent Office ofEvaluation of IFAD (IOE) for 2015 and indicative plan for 2016-2017, and theprogress reports on IFAD’s participation in the Heavily Indebted PoorCountries (HIPC) Debt Initiative and implementation of the performance-based allocation system (PBAS).
2. In accordance with article 6, section 10 of the Agreement Establishing IFADand regulation VI of the Financial Regulations of IFAD, and on therecommendation of the Executive Board, IFAD’s 2015 results-basedprogramme of work and regular and capital budgets, and the budget of IOEfor 2015 and indicative plan for 2016-2017 are transmitted to the GoverningCouncil for approval.
3. The programme of work for 2015 was approved by the Executive Board at its113th session in December 2014. A level of SDR 793 million(US$1,210 million) in nominal terms was approved for planning purposes,subject to a review of the resources available for commitment during thecourse of 2015.
4. Accordingly, it is recommended that the Governing Council adopt the attacheddraft resolution, approving IFAD’s 2015 results-based programme of work andregular and capital budgets, and the budget of IOE for 2015 and indicativeplan for 2016-2017 in the amounts indicated.
5. The Executive Board reviewed the progress reports on IFAD’s participation inthe HIPC Debt Initiative and on the implementation of the PBAS and itsaddendum, containing the 2014 country scores and 2013-2015 allocations,and recommended that both progress reports be transmitted to the GoverningCouncil for information.
GC 38/L.6
ii
Contents
Abbreviations and acronyms ivExecutive summary vRecommendation for approval 1Part one – IFAD’s 2015 results-based programme of work and regular
and capital budgets 1I. Context 1II. Gender sensitivity of IFAD’s loans and budget 3III. Current perspective 4
A. Update on 2014 programme of loans and grants 4B. 2013 and 2014 net regular budget usage 4C. 2013 carry-forward allocation 6D. 2014 strategic workforce planning exercise 6
IV. 2015 programme of work 6V. 2015 net regular budget 8
A. Introduction 8B. Budget process 9C. Assumptions 9D. Proposed SWP staffing level for 2015 10E. 2015 cost drivers 11F. 2015 net regular budget proposal 13G. 2015 gross budget proposal 16H. Capital budget for 2015 18
Part two – Results-based work programme and budget for 2015 andindicative plan for 2016-2017 of the Independent Office ofEvaluation of IFAD 20
I. Introduction 20II. Key insights from implementation of the 2014 work programme 21III. Current perspective 21
A. Highlights of 2014 21B. 2014 Budget utilization 23C. Utilization of the 2013 carry-forward 24
IV. IOE strategic objectives 24V. 2015 work programme 24VI. 2015 Resource envelope 28
A. Staff resources 28B. Budget proposal 29
Part three – Heavily Indebted Poor Countries Debt Initiative progressreport for 2014 33
I. Introduction 33II. Progress in HIPC Debt Initiative implementation 33III. Total cost of the HIPC Debt Initiative to IFAD 33IV. IFAD commitments to date 33V. Debt relief provided 34VI. Financing debt relief 34

GC 38/L.6
iii
Part four – Progress report on implementation of theperformance-based allocation system 36
I. Application of the PBAS in 2014 36II. Updating of 2014 country scores and 2013-2015
country allocations 36Part five – Recommendations 37
Annexes
I. CLEE actions and proposals 39II. 2015 Indicative number of projects by country 42III. Regular budget by cluster and department – 2013 actual versus budget 43IV. Regular budget by cluster and department – 2014 budget versus forecast 44V. Regular budget by cluster and department – 2014 budget versus
2015 proposal 45VI. Regular budget by cost category and department – 2014 budget versus
2015 proposal 46VII. Indicative 2015 staff levels – regular budget only 47VIII. Indicative 2015 staffing by department and grade 48IX. Staff costs 49X. Capital budget (excluding CLEE), 2008-2014 50XI. Carry-forward funds allocation 51XII. Country presence budget information 52XIII. Estimate of direct charges on investment income 53XIV. IOE strategic objectives, divisional management results
and outputs for 2015 54XV. IOE results measurement framework for 2014 55XVI. IOE reporting on achievements as at mid-October 2014 56XVII. IOE proposed evaluation activities for 2015 and indicative plan
for 2016-2017 64XVIII. IOE staff levels for 2015 67XIX. IOE proposed budget for 2015 68XX. IOE results measurement framework for 2015 71XXI. IOE selectivity framework 73XXII. Application of the selectivity framework 82XXIII. PBAS 2014 country scores and annual allocations 83XXIV. 2014 rural sector performance assessments 88XXV. 2015 Debt Sustainability Framework traffic lights 97

GC 38/L.6
iv
Abbreviations and acronyms
ARRI Annual Report on Results and Impact of IFAD OperationsASAP Adaptation for Smallholder Agriculture ProgrammeCGIAR Consultative Group on International Agricultural ResearchCLE corporate-level evaluationCMR corporate management resultCOSOP country strategic opportunities programmeCPE country programme evaluationDMR divisional management resultECG Evaluation Cooperation GroupFAO Food and Agriculture Organization of the United NationsFTE full-time equivalentHIPC Heavily Indebted Poor CountriesICT information and communications technologyIFAD8 Consultation on the Eighth Replenishment of IFAD’s ResourcesIOE Independent Office of Evaluation of IFADLGS Loans and Grants SystemMTP Medium-term PlanNONIE Network of Networks on Impact EvaluationOMC Operations Management CommitteeOSC Operational Strategy and Policy Guidance CommitteePBAS performance-based allocation systemPCR project completion reportPCRV project completion report validationPPA project performance assessmentPRISMA President’s Report on the Implementation Status of Evaluation
Recommendations and Management ActionsRIDE Report on IFAD’s Development EffectivenessSDC Swiss Agency for Development and CooperationSWP strategic workforce planningUNEG United Nations Evaluation Group

GC 38/L.6
v
Executive summary
1. In 2015, Management proposes to complete the planned programme of loans andgrants of US$3 billion for the three-year period (2013-2015) of the NinthReplenishment of IFAD’s Resources (IFAD9), with a lending level of approximatelyUS$1.210 billion for 2015, inclusive of funding under the Adaptation for SmallholderAgriculture Programme (ASAP). This programme of loans and grants includes thesuccessful outcome of negotiations to make use of borrowing from KfWDevelopment Bank. In addition to this core programme, the Fund will aim toleverage an additional US$217 million in 2015 in IFAD-managed resources fromother sources.
2. Some 47 projects and programmes – including additional financing for 10 ongoingloans and grants – are currently planned for approval in 2015. Six of these benefitfrom financing under the ASAP. Management expects to meet its IFAD9commitment to provide between 40 and 50 per cent of financing to sub-SaharanAfrica. The estimated number of global/regional and country grants in 2015 is 50,for a total of US$50 million.
3. Through its efforts to mobilize additional resources (US$1.452 billion) in the form ofcofinancing, Management expects to support an overall programme of work (POW)in 2015 of approximately US$2.662 billion in new commitments to ruraltransformation through smallholder development. The POW will include the coreprogramme of loans and grants of US$1.210 billion, US$217 million in cofinancingdirectly managed by IFAD, and the balance from international, domestic andprivate-sector cofinancing.
4. In response to commitments made in the IFAD Policy on Gender Equality andWomen’s Empowerment and requirements pursuant to the UN SWAP1 on gender,IFAD has developed a methodology to take gender considerations into account inIFAD’s loan portfolio and the regular budget. The methodology was refined in thecourse of 2014 to better reflect the distribution of gender-related activities in theregular budget. As a result of a more rigorous validation process, some of thepercentage allocations were adjusted to achieve a more realistic budget distributionof gender-related activities. Details of the gender-sensitivity value of the IFAD loanportfolio and regular budget distribution for gender-related activities are provided inthis document.
5. Management has reaffirmed its commitment to incorporate the recommendations ofthe Corporate-level evaluation of IFAD’s institutional efficiency and the efficiency ofIFAD-funded operations (CLEE) as part of the proposed action plan2 to make IFAD amore effective, efficient and agile institution. An update on progress made underthe action plan has been provided separately as part of the President’s Report onthe Implementation Status of Evaluation Recommendations and ManagementActions (PRISMA).3 Some of the actions had substantial capital and recurrentbudgetary implications and were included as annex I (Table of proposed actions andcost implications in response to CLEE recommendations) of the final 2014 budgetdocument.4 The recurrent costs of implementing the action plan in 2014 and 2015were also indicated in annex I of the 2014 budget document. The costs for 2015have now been revised based on progress to date and updated implementationtimelines. Accordingly, the costs for 2015 are different and some of the increases in
1 United Nations System-wide action plan for implementing the United Nations policy on gender equality and theempowerment of women.2 IFAD Consolidated Action Plan to Enhance Operational and Institutional Efficiency (EB 2013/109/R.12).3 EB 2014/112/R.5.4 IFAD's 2014 results-based programme of work and regular and capital budgets, the IOE results-based workprogramme and budget for 2014 and indicative plan for 2015-2016, and the HIPC and PBAS progress reports(EB 2013/110/R.2).

GC 38/L.6
vi
recurrent costs will have to be deferred to 2016. Expenses related to 2015 and2016 are included as annex I of this document.
6. Hence, in the short term there will be an increase in budgetary requirements whilethe efficiency gains arising from streamlined business processes, automation andincreased selectivity are expected over the medium term. While some of the actionsmay lead to efficiency gains, many are effectiveness-related operational actionsthat will lead to improved quality of programme delivery and knowledge retentionwithin the organization, but will add to recurrent costs in 2015. The real increaseshave been factored into the 2015 budget proposal and offset by cost reductionsachieved within the organization in order to limit real increases to an absoluteminimum in the overall budget.
7. Consequently, in preparing the 2015 budget proposal, difficult trade-offs had to bemade to accommodate the 2015 portion of the CLEE-driven recurrent costs and toaddress remaining structural budgetary issues, as well as to absorb a substantialpart of normal price-related cost increases in order to keep the nominal budgetincrease to a minimum. The main cost drivers determining final budgetaryallocations in 2015 will be recurrent costs related to: (i) the Loans and GrantsSystem (LGS) replacement project; (ii) CLEE actions; (iii) the strategic workforceplanning (SWP) and organizational development exercise; and (iv) other costdrivers, which are explained in more detail in the document.
8. Since presenting the preview document in September 2014, Management hasreviewed each component of its costs and underlying assumptions as a standardrequirement in the preparation of the final budget proposal. Detailed budgetsubmissions from departments and offices have been scrutinized. The status of theLGS replacement project and the CLEE action plan and their implications have beenreassessed, and the assumptions related to exchange rate and inflation have beenrealistically adjusted to reflect year-to-date information.
9. Management now proposes a lower net regular budget for 2015 ofUS$151.59 million, representing a 1.3 per cent nominal increase over 2014, ofwhich 1 per cent represents a real/volume increase and 0.3 per cent a net priceincrease arising from inflation, adjusted for the change in exchange rateassumptions. The 1 per cent real increase covers the following: (i) impact of theannual SWP exercise; (ii) increased recurrent costs of the LGS replacement projectand CLEE action plan; and (iii) cost of additional staff positions previously fundedby supplementary fund fees. These have been partially offset by a real reduction inthe use of consultants.
10. The 0.3 per cent price increase reflects the portion of the impact of the assumedaverage inflation rate of 1.9 per cent that could not be absorbed, adjusted for thechange in exchange rate assumptions. Several cost categories, such as consultancycosts and travel, have demonstrated price increases considerably above theassumed consumer price index. However, Management was able to maintain asignificantly lower overall price increase due to negotiated price reductions, changesin duty travel entitlements, changes in procurement arrangements – includinginsurance, and other cost-cutting measures.
11. The cumulative amount of the cost increases associated with the above-mentionedcorporate decisions and the assumed inflation rate exceeds the overall proposedbudget increase of 1.3 per cent. Therefore, cost cuts in real terms have been madein other areas to contain the budget at the proposed level. The cost estimates havebeen revised as part of the detailed budget preparation and the final budgetproposal takes into account the feedback received from the Audit Committee andExecutive Board in September 2014.
12. In considering the overall budget it may be noted that annual inflationary increasesof approximately 2 per cent have been absorbed within the budget in 2013 and
GC 38/L.6
vii
2014 (since the increase in 2014 was entirely real due to additional activities arisingfrom the CLEE action plan and LGS replacement project). As a significant part ofthe 2015 general inflation as well as specific price escalations have also beenabsorbed in the proposed 2015 budget, the total aggregate amount of inflationabsorbed over the three-year period 2013-2015 comes to over 5 per cent; this wasmade possible by real decreases and efficiency gains during the period.
13. The gross budget for 2015 amounts to US$156.72 million, including resources tomanage supplementary-funded operations, which amount to US$5.13 million (overand above the US$151.59 million). The slightly lower than prior year’s estimatereflects the requirements of the third year of ASAP implementation. The amountcan be fully recovered from the annual allocable portion of the fee incomegenerated from the management of supplementary funds. Endorsement is beingsought only for the proposed net regular budget of US$151.59 million.
14. The proposed 2015 capital budget amounts to US$2.69 million. It is proposed thatthe capital budget be split into two categories, namely: (i) a capital budget to fundmajor IT and other investments in facilities amounting to US$1.49 million; and(ii) an annual capital budget to cover capital expenditures that are cyclical orregular in nature and have an economic life of more than one year (e.g. normalreplacement of desktop and laptop computers and hardware necessary every year)amounting to US$1.2 million.
15. The results-based work programme and budget for 2015 and indicative plan for2016-2017 of the Independent Office of Evaluation of IFAD are set out in part twoof this document; the Heavily Indebted Poor Countries Debt Initiative and theperformance-based allocation system progress reports are contained in parts threeand four respectively; and recommendations are contained in part five.
GC 38/L.6
viii
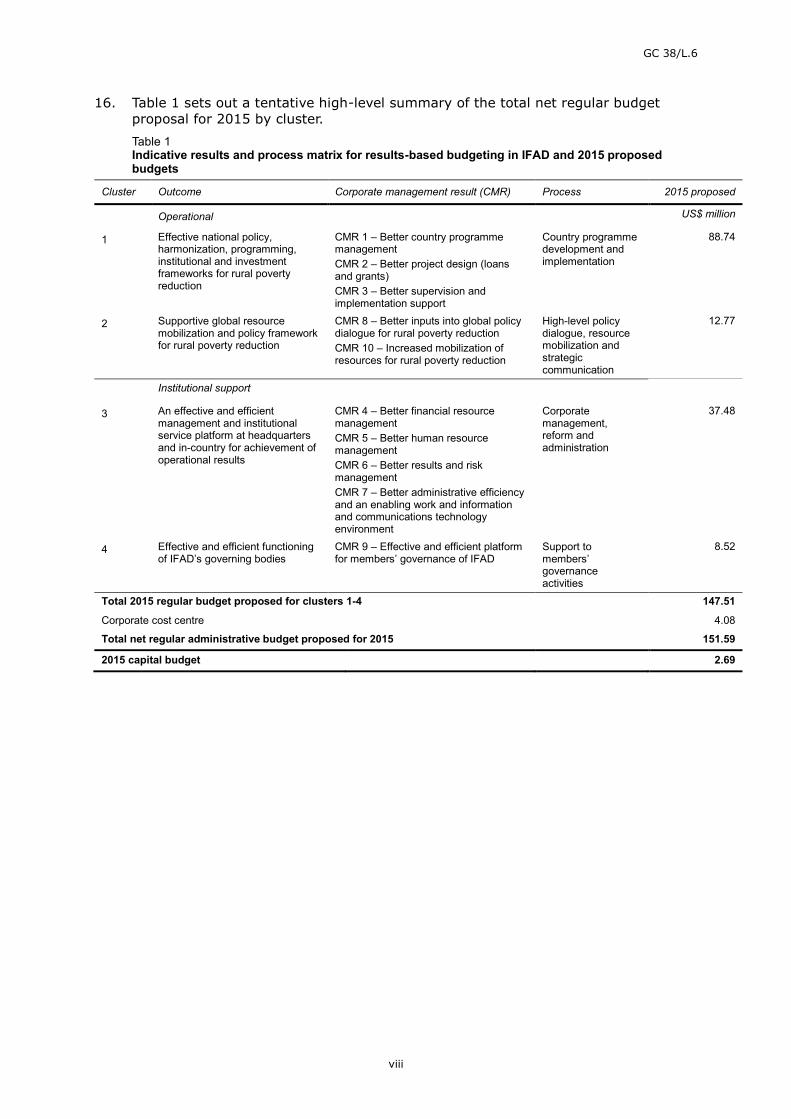
16. Table 1 sets out a tentative high-level summary of the total net regular budgetproposal for 2015 by cluster.Table 1Indicative results and process matrix for results-based budgeting in IFAD and 2015 proposedbudgets
Cluster Outcome Corporate management result (CMR) Process 2015 proposed
Operational US$ million
1 Effective national policy,harmonization, programming,institutional and investmentframeworks for rural povertyreduction
CMR 1 – Better country programmemanagementCMR 2 – Better project design (loansand grants)CMR 3 – Better supervision andimplementation support
Country programmedevelopment andimplementation
88.74
2 Supportive global resourcemobilization and policy frameworkfor rural poverty reduction
CMR 8 – Better inputs into global policydialogue for rural poverty reductionCMR 10 – Increased mobilization ofresources for rural poverty reduction
High-level policydialogue, resourcemobilization andstrategiccommunication
12.77
Institutional support
3 An effective and efficientmanagement and institutionalservice platform at headquartersand in-country for achievement ofoperational results
CMR 4 – Better financial resourcemanagementCMR 5 – Better human resourcemanagementCMR 6 – Better results and riskmanagementCMR 7 – Better administrative efficiencyand an enabling work and informationand communications technologyenvironment
Corporatemanagement,reform andadministration
37.48
4 Effective and efficient functioningof IFAD’s governing bodies
CMR 9 – Effective and efficient platformfor members’ governance of IFAD
Support tomembers’governanceactivities
8.52
Total 2015 regular budget proposed for clusters 1-4 147.51
Corporate cost centre 4.08
Total net regular administrative budget proposed for 2015 151.59
2015 capital budget 2.69

GC 38/L.6
ix
17. In accordance with regulation VII of the Financial Regulations of IFAD, medium-term budgetary projections on the basis of projected income flows to the Fund fromall sources, and projected disbursements based on operational plans covering thesame period are shown in table 2. It should be noted that table 2 is indicative andis provided for information purposes only.Table 2Medium-term budgetary projections on the basis of projected inflows and outflows (all sources)(Millions of United States dollars)
Actual2013
Projected2014
Projected2015
Projected2016
Resource balance carried forward at start of year 2 287 2 362 2 296 2 265Inflows to IFAD
Loan reflows 263 311 324 342
Investment income * (24) (19) 10 18
Loan to IFAD 0 155 307 0
Supplementary fund fees 24 6 6 6
Subtotal 263 453 647 366
Outflows from IFADAdministrative and IOE budget (145) (150) (156) (159)
Other administrative expenses** (5) (4) (3) (2)
Capital budget (7) (5) (5) (5)
Debt service on loan to IFAD 0 (2) (5) (4)
Costs funded by supplementary fund fees (5) (5) (6) (6)
Foreign Exchange (FX) and intra-fund adjustments (26) - - -
Subtotal (188) (166) (177) (176)
Net inflows/outflows to IFAD 75 287 472 190Programme of work-related activities
Contributions 346 391 299 425
Contributions (ASAP) 346 7 0 0
Disbursements (672) (737) (773) (819)
Heavily Indebted Poor Countries impact (20) (14) (29) (27)
Subtotal 0 (353) (503) (421)
Net inflows/(outflows) on all activities 75 (66) (31) (231)
Resource balance brought forward at end of year 2 362 2 296 2 265 2 034
* Investment income is shown net of direct charges on investment income (See annex XIII).** Other administrative expenses include one-time budgets and carry-forward resources.
GC 38/L.6
1
Recommendation for approval
The Executive Board is invited to approve:
The recommendation on IFAD’s 2015 results-based programme of work, regularand capital budgets, and the budget of the Independent Office of Evaluation ofIFAD for 2015, as contained in paragraphs 150 and 151;
The submission of the substance of the progress report on IFAD’s participationin the Heavily Indebted Poor Countries Debt Initiative to the thirty-eighthsession of the Governing Council for information, in accordance with therecommendation contained in paragraph 152; and
The submission of a progress report on implementation of the performance-based allocation system to the thirty-eighth session of the Governing Council in2015, based on the report provided in part four of the present document and itsaddendum containing the 2014 country scores and 2013-2015 allocations, inaccordance with the recommendation contained in paragraph 153.
Furthermore, the Executive Board is invited to consider the draft resolution containedon page 38 and to submit it, together with its recommendations, to the thirty-eighthsession of the Governing Council in February 2015 for consideration and adoption.
IFAD's 2015 results-based programme of work andregular and capital budgets, the IOE results-based workprogramme and budget for 2015 and indicative plan for2016-2017, and the HIPC and PBAS progress reports
Part one – IFAD’s 2015 results-based programme ofwork and regular and capital budgets
I. ContextMedium-term plan and corporate objectives
1. The rolling medium-term plan in 2015 will essentially follow the same corporatedevelopment and operational objectives that were originally set out for the 2013-2015 period, as follows:
(i) Achieve a programme of loans and grants of US$3 billion and mobilizeadditional cofinancing of US$1.6 for every US$1 of IFAD loans/grants. WhileManagement expects to achieve the original objective of an IFAD programmeof loans and grants of US$3 billion, current developments in the officialdevelopment assistance (ODA) environment have necessitated a lowering ofthe cofinancing target to a more realistic level of US$1.2 for every US$1 ofIFAD loans/grants;
(ii) Improve the quality of new and ongoing projects to the level of 2015 resultsmeasurement framework (RMF) targets through better project design andsupervision;
(iii) Improve monitoring and evaluation (M&E) systems and undertake impactassessments; and
(iv) Become more efficient (less IFAD cost per United States dollar lent orgranted).

GC 38/L.6
2
2. IFAD will continue with its scaling-up effort to ensure that the innovations itintroduces have a significant impact on reducing rural poverty, while maintaining itsfocus on the environment and climate change. At the same time, more effort will beexerted to enhance cofinancing with the private sector.
3. IFAD’s corporate internal management objectives remain fundamentally the same,namely: (i) successful resource mobilization; (ii) improved human resourcesmanagement; (iii) continuation of annual SWP exercises; and (iv) an enhancedinformation and communications technology (ICT) platform for disbursements andimproved communications.
4. While IFAD’s updated operational plan for 2014-2015 continues to be guided by thepriorities and targets that shaped the medium-term plan 2013-2015, it will bemodified to respond to internal and external trends that unfolded in 2013 and 2014.The main developments motivating revision of IFAD’s operational plan for 2014-2015 plan are summarized below.
5. The IFAD Consolidated Action Plan to Enhance Operational and InstitutionalEfficiency,1 which addresses the agreed recommendations of the CLEE, is one of theprincipal change drivers of the 2014-2015 operational plan. Several of the actions itrecommends have substantial budgetary implications in the short term, but areexpected to lead to enhanced operational results and impacts and efficiency gainsin the medium term. Annex I of this document provides an update on the status ofthe actions that have one-time adjustment or capital costs in order to achieve theCLEE recommendations. As explained below, most of the CLEE-related actions willbe completed primarily in 2015 and consequently the impact of such initiativescannot be realized until subsequent years. It should also be noted that most of theefficiency measures undertaken to date result in the improvement of the quality ofthe portfolio, borrower satisfaction and target key performance indicators (KPIs) ofindividual departments rather than in reduced costs. Hence, several items withassociated capital expenditures may not result in financial and quantifiablepaybacks. A separate paper on efficiency is under preparation.
6. Other changes have been driven by corporate performance and institutional riskassessments. While results reported in the 2013 Report on IFAD’s DevelopmentEffectiveness2 (RIDE) show that IFAD is making good progress towards fulfillingIFAD9 commitments and most performance targets,3 some areas – such as projectefficiency and projects reported at risk – need to be addressed. The action plan willconstitute an important part of IFAD’s remedial response to these issues, inparticular with respect to project efficiency. Also in this connection, efforts tostrengthen IFAD’s business model in fragile states will be stepped up, and prioritywill be given to these countries in opening country offices.
7. Declines in ODA, and important shifts in development finance flows and modalitieswill result in financial resource constraints, with implications for the fulfillment ofscaling-up objectives and cofinancing targets. While IFAD will continue to intensifyits resource mobilization efforts through new partnerships and instruments, a morerealistic projection for 2015 has been considered.
8. As noted last year, there will be no expansion in the total IFAD programme of loansand grants during the IFAD9 three-year period. Instead, the emphasis will be onachieving greater efficiencies in the medium term, making IFAD’s delivery modelsignificantly more effective, and further enhancing the quality of IFAD’s project
1 Document EB 2013/109/R.12.2 Document EB 2013/110/R.12.3 For example, in increasing the number of beneficiaries receiving services from IFAD-funded projects; improving projectoutcomes as measured at project completion (for replication and scaling up; rural poverty impact; environment andnatural resource management; gender equality; market development; and human empowerment and social capital); andspeeding up disbursement processing and the time from project approval to first disbursement.
GC 38/L.6
3
design and portfolio. As a result, an increase in costs may be anticipated in theshort run.
II. Gender sensitivity of IFAD’s loans and budget9. In response to commitments made in the IFAD Policy on Gender Equality and
Women’s Empowerment and requirements pursuant to the UN-SWAP on gender,4
IFAD has developed a methodology to take gender considerations into account inIFAD’s loan portfolio and regular budget.
10. Two separate methodologies were developed in 2013 for: (a) conducting an ex anteanalysis of gender sensitivity in IFAD loans; and (b) identifying the distribution ofthe regular budget for gender-related activities. The outcome of the 2014 exerciseis reported below.
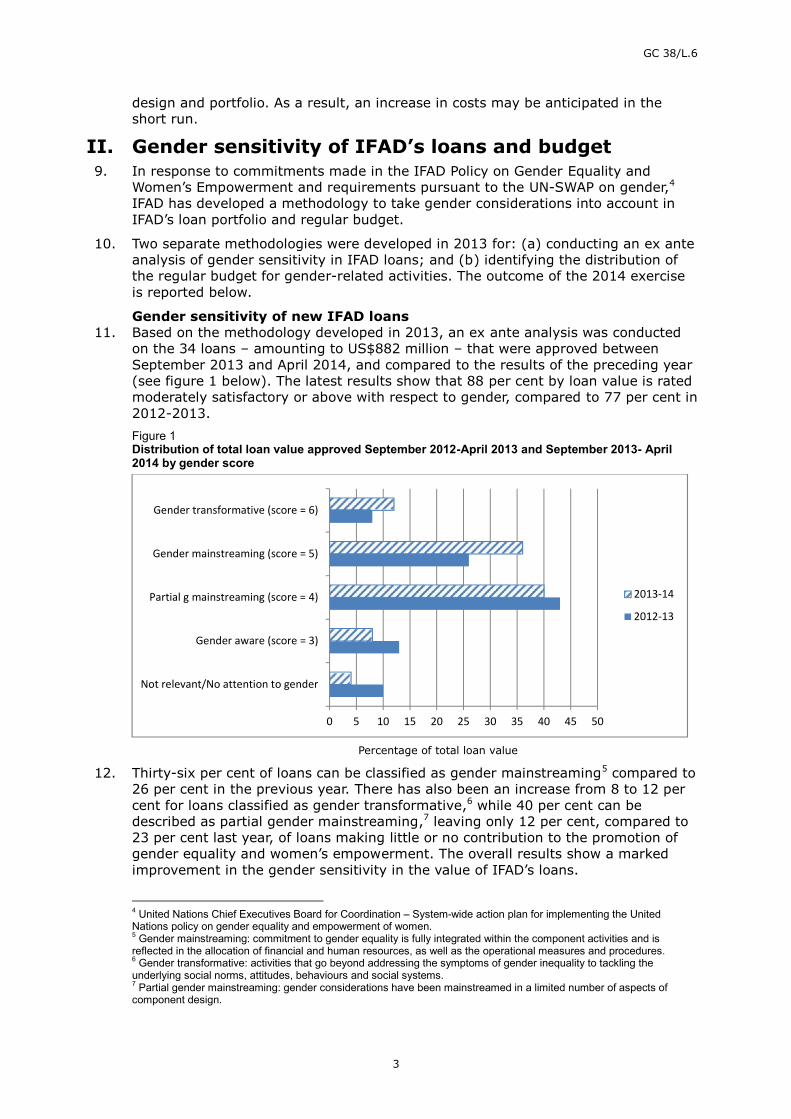
Gender sensitivity of new IFAD loans11. Based on the methodology developed in 2013, an ex ante analysis was conducted
on the 34 loans – amounting to US$882 million – that were approved betweenSeptember 2013 and April 2014, and compared to the results of the preceding year(see figure 1 below). The latest results show that 88 per cent by loan value is ratedmoderately satisfactory or above with respect to gender, compared to 77 per cent in2012-2013.Figure 1Distribution of total loan value approved September 2012-April 2013 and September 2013- April2014 by gender score
Percentage of total loan value
12. Thirty-six per cent of loans can be classified as gender mainstreaming5 compared to26 per cent in the previous year. There has also been an increase from 8 to 12 percent for loans classified as gender transformative,6 while 40 per cent can bedescribed as partial gender mainstreaming,7 leaving only 12 per cent, compared to23 per cent last year, of loans making little or no contribution to the promotion ofgender equality and women’s empowerment. The overall results show a markedimprovement in the gender sensitivity in the value of IFAD’s loans.
4 United Nations Chief Executives Board for Coordination – System-wide action plan for implementing the UnitedNations policy on gender equality and empowerment of women.5 Gender mainstreaming: commitment to gender equality is fully integrated within the component activities and isreflected in the allocation of financial and human resources, as well as the operational measures and procedures.6 Gender transformative: activities that go beyond addressing the symptoms of gender inequality to tackling theunderlying social norms, attitudes, behaviours and social systems.7 Partial gender mainstreaming: gender considerations have been mainstreamed in a limited number of aspects ofcomponent design.
0 5 10 15 20 25 30 35 40 45 50
Not relevant/No attention to gender
Gender aware (score = 3)
Partial g mainstreaming (score = 4)
Gender mainstreaming (score = 5)
Gender transformative (score = 6)
2013-14
2012-13

GC 38/L.6
4
Capturing gender-related and supporting activities in the regular budget13. The first attempt to quantify the gender sensitivity of IFAD’s regular budget was
presented in the 2014 budget document. A more accurate method of capturinggender-related data with better attribution has been integrated into the 2015budget preparation process. This has captured gender sensitivity morecomprehensively in IFAD’s regular budget, within the constraints of the currentlyavailable systems.
14. The overall results from this year’s exercise indicate that around 10 per cent of totalstaff costs are spent on gender-related activities, which is significantly higher thanthe 6 per cent estimated for 2014. On a departmental basis, the highest gendermainstreaming is in the Programme Management Department (PMD) (15 per cent)with the Corporate Services Support Group (CSSG) ranking second withapproximately 8 per cent. Notable among divisions are the CommunicationsDivision (19 per cent), Policy and Technical Advisory Division (PTA) (13 per cent),Human Resources Division (HRD) (10 per cent) and the Ethics Office (10 per cent).
15. The percentages for 2015 indicate better attribution by both operational and non-operational divisions to capture gender-related data. IFAD will continue to improveboth its approach and data collection to further enhance reporting on gendersensitivity and will seek inputs from other organizations undertaking similar work,as and when available.
III. Current perspectiveA. Update on 2014 programme of loans and grants16. As at 15 September 2014, IFAD plans to deliver a programme of loans and grants
(PoLG) for 2014 projected at a total amount of US$902 million, comprising aninvestment programme amounting to approximately US$852 million in support of atotal of 31 new projects and additional financing for four ongoing projects. By theend of September 2014, it is estimated that financing will have been approved for18 new projects and additional financing for three ongoing. Of the remaining 13new projects and one additional financing proposal, six are at an advanced stage inthe design process.
17. For IFAD’s global, regional and country grant programme, it is expected that some60 grants will be approved by the end of 2014 for a value of US$50 million.
Portfolio18. As at 15 September 2014, there are 253 projects in the current portfolio for a value
of US$6.0 billion and an active grant portfolio comprising 229 grants valued atUS$198.7 million. Projected disbursements for the year are estimated atUS$737 million.
B. 2013 and 2014 net regular budget usage19. Actual expenditure against the 2013 regular budget amounted to US$139.09 million
or 96.5 per cent of the approved budget of US$144.14 million. Most of the savingswere generated from staff costs due to vacant positions and lower actual costscompared to standard staff costs used for budgeting purposes. There were alsosavings in the travel and consultancy budgets due to prudent cost management.The underspend also includes the non-utilization of the salary increase provision forProfessional staff (US$679,000) as agreed with the Executive Board.

GC 38/L.6
5
Table 1Regular budget utilization – actual 2013 and forecast 2014(Millions of United States dollars)
2013 full year 2014 forecast
Budget Actual Budget Forecast
Regular budget 144.14 139.09 149.64 145.75
Percentage utilization 96.5 97.4
20. Based on current projections, utilization of the 2014 budget is expected to reach97.4 per cent. The less-than-full utilization of the budget can be attributed toseveral high-level vacancies, across-the-board vacant positions, and an over-estimation of the overall CLEE incremental recurrent costs. As in previous years,some savings are anticipated from lower actual staff costs as compared to standardcosts used for budgeting purposes. The 2014 fourth quarter expenditures arenormally substantially higher than other quarters of the year due to the level ofactivity in meeting the annual approval targets for the year. However, based on thecurrent trend and the expected favourable exchange rate movements in the lastquarter, the overall utilization for the year is expected to be lower than projected inthe high-level budget preview document.
21. Table 2 shows the 2013 actual expenses and 2014 forecast broken down bydepartment. Some of the more significant variances are explained below:
The decrease in projected utilization by CSSG in 2014 compared to theapproved budget is due to savings in the Office of the Secretary and staffvacancies.
The expected lower utilization in the Strategy and Knowledge Department(SKD) is due to senior-level staff vacancies during 2014.
PMD and the Corporate Services Department 2014 forecast utilization reflectsa number of positions partly vacant during the year and better overall budgetmanagement.
The lower 2014 forecast for the Financial Operations Department is primarilydue to several vacancies across divisions.
Table 2Regular budget usage by department: 2013 actual, 2014 budget and 2014 forecast(Millions of United States dollars)
Department Actual 2013 Budget 2014 Forecast 2014
Office of the President and Vice-President (OPV) 2.47 2.77 2.58
Corporate Services Support Group (CSSG) 15.09 18.18 17.63
Partnership and Resource Mobilization Office (PRM) 3.15 4.14 3.91
Strategy and Knowledge Department (SKD) 4.97 6.60 6.11
Programme Management Department (PMD) 68.19 73.57 72.23
Financial Operations Department (FOD) 9.36 10.18 9.67
Corporate Services Department (CSD) 27.66 28.34 27.98
Corporate cost centre 8.20 5.86 5.64
Total 139.09 149.64 145.75
22. A more detailed breakdown of actual budget usage in 2013, disaggregated bycluster, is provided in annex III. A similar table, based on forecasted utilization of97.4 per cent for 2014, is provided in annex IV.
GC 38/L.6
6
C. 2013 carry-forward allocation23. The 3 per cent carry-forward rule, in place since 2004, states that unobligated
appropriations at the close of the financial year may be carried forward into thefollowing financial year up to an amount not exceeding 3 per cent of the approvedannual budget of the previous year.
24. The 3 per cent carry-forward for 2013 of US$4.324 million was allocated inaccordance with the eligibility criteria and implementing guidelines contained in thePresident’s bulletin entitled “Guidelines for use of 3% carry-forward funds”(PB/2012/06). The allocation was performed in two tranches. The call for the firsttranche was made in March, much earlier than last year. The allocation against thefirst tranche, amounting to US$3.589 million, was approved and made available inApril 2014. In accordance with the President’s bulletin, a second call for requestswas issued in September 2014 and, as of writing this document, the submissionshave been received. These will be reviewed and the second tranche allocation willbe made in October 2014. The utilization of the first tranche will continue to bereviewed and any amounts not expected to be utilized will be included forreallocation against the second tranche requests. Based on current utilization andthe second tranche submissions received, it is unlikely that the 3 per cent carry-forward of 2013 will be fully allocated as strict adherence to the eligibility criteriahas been maintained. Details of the first tranche allocation are set out in annex XI.
D. 2014 strategic workforce planning exercise25. This year’s SWP exercise began in early May, much earlier than last year, to allow
the initial outcomes of the required staffing level for 2015 to be used as a guide inestimating staff costs for the 2015 high-level preview document prepared forsubmission in July 2014 to the Audit Committee.
26. The fundamental objective of the exercise remained the same: to ensure that IFADhas the requisite workforce in terms of numbers, competencies and skills to enableit to deliver on the key strategic objectives for the IFAD9 period. The specificpriorities for the 2015 SWP exercise were identified as: (i) programme delivery;(ii) administration and governance of additional resource mobilization; and(iii) support to country offices.
27. Management remains committed to absorbing into the regular budget, staffperforming core functions currently funded from other ad hoc funding sources. Inaddition, Management plans to continue to regularize short-term staff andconsultants performing core and continuous functions. A significant number ofshort-term staff were regularized and the incremental cost due to the differencebetween fixed-term and short-term staff/consultants was absorbed in the 2014budget. The full-year effect of these is included in the 2015 budget proposal. Due tobudgetary constraints, it will not be possible to absorb all staff positions performingcore functions but funded from other ad hoc resources into the 2015 regularbudget. However, following a careful review of all other cost drivers and expenseestimates, it will be possible to absorb some positions funded by supplementaryfunds into the 2015 regular budget.
28. As part of the overall organizational development and human resources strategy tomatch grade levels to the appropriate terms of reference of positions, a review wasalso undertaken as part of the annual SWP exercise, which has resulted in thereclassification of several positions. The cost implications of all the factors abovewill have an impact on the 2015 final budget proposal.
IV. 2015 programme of work29. As indicated in the 2014 budget document approved by the Governing Council in
February 2014 and considering the progress to date, Management plans to maintainthe projected IFAD PoLG of US$3 billion for the period 2013-2015. Within this
GC 38/L.6
7
programme, IFAD expects to meet its IFAD9 commitment to provide between 40and 50 per cent of financing to sub-Saharan Africa.
30. For 2015, the PoLG is planned at US$1.21 billion. Other funds under IFADmanagement are estimated at US$217 million for 2015, bringing the total PoLG toUS$1.427 billion.
31. In addition to this core programme, efforts to mobilize additional resources andcofinancing from other sources will continue, despite the increasing challenges as aresult of cutbacks in ODA budgets. Based on more realistic cofinancing projectionsand on the historical trend, cofinancing is expected to amount to US$1.235 billion,bringing the total programme of work for 2015 to US$2.662 billion.Table 3Actual and projected programme of loans and grants and total programme of work(Millions of United States dollars)
2010 2011 2012 2013 2014 2015
Actual Forecast PlannedIFAD loans and Debt Sustainability Framework(DSF) grants
783 952 983 838 852 1 160
IFAD grants 47 47 54 50 50 50
Total IFAD programme of loans and grants a 830 999 1 037 888 902 1 210
Other funds under IFAD management(estimated) b
161 240 176 173 180 217
Total programme of loans and grants 991 1 239 1 213 1 061 1 082 1 427
Cofinancing (international net of thatmanaged by IFAD and domestic)
1 540 1 072 864 933 902 1 235
Total programme of work 2 531 2 310 2 077 1 994 1 984 2 662
Source: GRIPS as at 30 September 2014.a Includes financing from ASAP (as of 2012) and KfW (as at 2014).b Other funds managed by IFAD include the Spanish Food Security Cofinancing Facility Trust Fund, Global EnvironmentFacility/ Least Developed Countries Fund, Global Agriculture and Food Security Program (GAFSP), European Commission andEuropean Union, in addition to bilateral supplementary/complementary grants.
32. Some 49 projects and programmes, including additional financing for eight ongoingloans and grants, are currently being prepared for approval during 2015. Some nineprojects and programmes are planned to benefit from financing from the Adaptationfor Smallholder Agriculture Programme (ASAP).
33. The estimated value distribution of the programme of loans and DSF grants amongthe eight areas of thematic engagement established in the IFAD StrategicFramework 2011-2015 is shown in the following chart.

GC 38/L.6
8
Indicative distribution of 2015 lending and DSF grants by area of thematic engagement
34. The estimated number of global/regional and country grants in 2015 is 50, for atotal of US$50 million. Principal objectives of the regular grant programme willcontinue to be:
(a) Promotion of innovative activities and development of innovative technologiesand approaches to support IFAD’s target group;
(b) Further awareness, advocacy and policy dialogue on issues of importance topoor rural people promoted by this target group;
(c) Strengthening of the capacity of partner institutions to deliver a range ofservices to support poor rural people; and
(d) Increased lesson learning, knowledge management and dissemination ofinformation on issues related to rural poverty reduction among stakeholderswithin and across regions.
V. 2015 net regular budgetA. Introduction35. There has been no or minimal increase in IFAD’s regular budget over the three
years preceding 2014. The increase in 2014 was primarily related to the CLEE andLGS. The budget proposal for 2015 plans to cover as much of the cost drivers notedbelow without affecting the overall quality and effectiveness of programme delivery,while at the same time maintaining the current drive to address structuralbudgetary issues and implement process changes and automation leading to morecost-efficient delivery.

GC 38/L.6
9
B. Budget process36. As in 2014, the 2015 staffing levels were based on the outcome of the 2014 SWP
exercise and departments were required to adhere to the SWP authorized staffinglevel. Staff costs were predetermined in accordance with agreed SWP staffingnumbers and complement. Departments were requested not to change the staffcost portion of their budget envelope unless agreed in advance with Management.Where additional staff positions had been agreed to as part of the SWP, these wereappropriately reflected in the prepopulated staff costs.
37. As part of the budget planning exercise, departments were advised that their non-staff requests must not exceed 2014 appropriations. Any additional CLEE- or LGS-driven costs or other corporate priorities were centrally managed. A separatesubmission was required for incremental activities to be charged to complementaryand supplementary management fees which would form the gross budget for 2015.
38. The Budget and Organizational Development Unit (BOD) reviewed all thesubmissions in the context of corporate priorities and directions set byManagement. A systematic approach was followed in reviewing the budgetsubmissions. A careful review of the timeline of the capital projects related to CLEEand LGS was undertaken and the recurrent costs and depreciation for 2015 wereadjusted accordingly. The standard staff costs were revised to reflect the newassumed exchange rate. In addition, the euro component of each non-staffexpenditure item was identified and the new exchange rate assumption was used toestimate the United States dollar equivalent for incorporation of non-staff costs intothe overall budget proposal. The impact of general inflation (1.9 per cent) as well asprice escalations on specific cost items (e.g. travel, consultancy, etc.) was carriedout on each major non-staff expenditure item and has been reflected in the finalbudget proposal.
39. At the same time, efforts were made to match expenses to proper funding sourcesto the extent possible as part of IFAD’s drive to mainstream recurrent costspreviously funded by ad hoc sources.
C. Assumptions2015 staff salary cost assumptions
40. Staff costs for the 2015 budget proposal are based on the following keyassumptions:
(i) There will be no increase in salaries in 2015 for either General Service orProfessional staffing grades.
(ii) For all staff, the normal step increase, which constitutes a price increase, willbe absorbed within the regular budget. The annual step increase for bothcategories of staff has been absorbed since 2012 and it is unlikely that thiscan be achieved in the coming years. Future budgets will have to makeprovision for this price-related increase.
(iii) The cost of new General Service recruits is based on the new lower salaryscale approved by Management. The impact of this lower salary scale is stillminimal as the number of staff appointed and remunerated under thesecondary salary scale is relatively small.
(iv) It is anticipated that any incremental increase by the International CivilService Commission (ICSC) in the Professional staff salary structure will beoffset by a concomitant decrease in post adjustment, resulting in no increasein the staff budget or take-home pay. The provision of US$679,000 made forProfessional staff salaries in 2012 will continue to be set aside in the corporatecost centre and will not be spent without the endorsement of the ExecutiveBoard.

GC 38/L.6
10
(v) The full-year effect of the positions partially funded in 2014 has been factoredinto the budget proposal;
(vi) While there will be no changes in staff salary scales for 2015, the standardstaff costs used in 2014 have been adjusted in 2015 to reflect the change inthe assumed exchange rate (see annex IX).
Inflation and exchange rate assumptions41. Compared to the 2015 high-level preview document, the overall inflation increase
assumption has been reduced to 1.9 per cent based on current data for the worldand anticipated local consumer price indices. While this is an across-the-boardassumption, it should be noted that several cost components of the budget havesignificant price increases over and above the 1.9 per cent assumption (e.g.average air ticket prices have increased between 4 and 6 per cent, utilities haveincreased by over 2 cents per unit or over 10 per cent, consultant contract costshave increased by 3-5 per cent, and several IT contracts with critical providers havea 4 per cent built-in escalation clause). In the final budget proposal, all priceincreases have been factored in for each cost component and considerable savingsand cost cuts had to be realized to restrict the overall price increase to well belowthe average inflation rate.
42. The euro/United States dollar exchange rate used in preparing the 2015 budget hasbeen adjusted to EUR 0.735:US$1. This rate was based on the average year-to-date exchange rate information and is considered a reasonable and prudentestimate. The revised exchange rate with respect to the prior year has also helpedin containing the overall price increase in the 2015 proposed budget. Standard staffcosts have accordingly been lowered (see annex IX).
D. Proposed SWP staffing level for 201543. The 585.55 full-time equivalent (FTE) level approved for 2014 was used as the
baseline for this year’s SWP exercise. It included: 569.08 FTEs funded from theregular budget; 10.47 FTEs performing core functions funded from other sources;and six positions with coterminous contracts funded from supplementary funds.Based on the annual SWP exercise carried out in the first half of 2014, the proposedSWP staffing level for 2015 is 594.50 FTEs.
44. The net increase under the regular budget is 12.42 FTEs. This includes theabsorption of 4.47 FTEs performing core functions for IFAD that were previouslyfunded from supplementary fund fees. Efforts will be made to absorb the remainingsix FTEs of staff performing core functions funded from other sources into theregular budget in the coming years.
45. The proposed staffing requirement to carry out the core functions of theorganization for 2015 is 587.50 FTEs, compared to 579.55 FTEs in 2014, or a netincrease of 7.95 FTEs. In addition, seven coterminous positions are chargeable tomanagement fees (four in relation to ASAP and three in relation to other grants),bringing the total number of staff FTEs to 594.50.

GC 38/L.6
11
Table 4Indicative staffing requirements, 2012-2015FTEs
DepartmentApproved
2012Approved
2013Approved
2014Proposed
2015
Totalchange2014 vs
2015
Office of the President and Vice-President 12.00 11.00 11.00 11.00 0.00
Corporate Services Support Group 99.92 94.68 87.50 87.00 (0.50)
Partnership and Resource Mobilization Office 11.00 18.00 19.00 19.00 0.00
Strategy and Knowledge Management Department 13.00 25.00 27.66 28.00 0.34
Programme Management Department 294.55 254.56 265.00 272.00 7.00
Financial Operations Department 46.34 63.84 59.75 63.00 3.25
Corporate Services Department 94.30 96.66 99.17 101.50 2.33
Total staff funded by regular budget 571.11 563.74 569.08 581.50 12.42
Staff FTEs funded by other funding sources 28.97 13.47 10.47 6.00 (4.47)
Total staff funded by regular and other sources 600.08 577.21 579.55 587.50 7.95
Staff FTEs chargeable to management fees* - 4.00 6.00 7.00 1.00
Total IFAD Staff FTEs 600.08 581.21 585.55 594.50 8.95
* Staff with coterminous contracts chargeable to management fees.
46. The net increase of 12.42 FTEs of staff funded by the regular budget is the netresult of: (i) five new IFAD country office (ICO) staff positions; (ii) two newpositions to support operational activities; (iii) three new positions to support thefinance area; (iv) the full-year effect of positions that were partially funded in 2014(3.17 FTEs); (v) SWP-initiated staff reductions of 3.75 FTEs; and (vi) theconversion of three staff positions previously funded by supplementary fund fees.
47. Some of the significant departmental staffing changes are highlighted below:
(i) PMD has increased by seven positions as a direct result of additional supportto ICOs and regional divisions.
(ii) The 3.25 FTE increase in FOD is due to the three new positions provided tosupport financial management and borrowing activities associated withresource mobilization. It also includes the conversion of one staff positionpreviously funded by supplementary fund fees, net of the elimination of aposition partially funded in 2014.
(iii) The CSD increases primarily relate to the conversion of two staff positionspreviously funded by supplementary fund fees.
48. Indicative staffing levels by department and grade and funded by regular budgetonly are set out in annexes VIII and VII. The cost implications of the SWP exerciseincluding reclassification are set out in the cost drivers section below.
E. 2015 cost drivers49. In preparing the 2015 budget proposal, difficult trade-offs had to be made to
accommodate the 2015 cost drivers, address remaining structural budgetary issues,and absorb a substantial part of price-related cost increases in order to furthercontain the final budgetary increase to a minimum level. There are severalcompeting priorities requiring substantial budgetary and human resources, andstringent prioritization had to be exercised in order to achieve minimal budgetgrowth. Going forward, it may be necessary to revisit some of the corporate
GC 38/L.6
12
decisions taken in prior years and test them for affordability in the currentconstrained budget scenario.
50. The main cost drivers that determined final budgetary allocations in 2015 wererecurrent costs related to (i) the LGS replacement project; (ii) the CLEE; (iii) theSWP and organizational development exercise; and (iv) other cost drivers.
Costs associated with the Loans and Grants System replacement project51. The first phase of the LGS replacement project went live at the end of 2013.
Recurrent costs of US$2.28 million – comprising additional staff costs, licensing andmaintenance fees and depreciation (US$750,000) – were included in the 2014budget. Based on the schedule of completion for the next phase of the LGSreplacement project in 2014, an additional US$1 million was originally estimated asdepreciation for 2015. This estimate was revised based on the schedule of thesecond phase of the project (completion is planned for mid-2016 to ensuresufficient time for consolidation of expected benefits from the first phase). Thecurrent estimate for incremental recurrent costs (inclusive of depreciation) in 2015is US$275,000 based on the additional capital outlay of US$1 million expected in2014.
CLEE-related cost drivers52. The 2014 budget document indicated that the CLEE recommendations would give
rise to significant budgetary needs in 2014 and 2015. Aside from capital and one-time costs, several recurrent costs were anticipated associated with implementingthe CLEE action plan, directly related to increased country presence, improvedportfolio quality, enhanced delivery on the ground and increased overall IFADeffectiveness.
53. Recurrent costs of US$2 million were included in the 2014 budget based on theoriginal implementation schedule of the CLEE action plan, including both IT andnon-IT related actions. The definition and scoping of the specific IT capital projectsto meet the CLEE action plan requirements only started after the approval of thebudget by the Governing Council in February 2014. A number of projects requiredcoordination and prioritization by the ICT Division and end-users in definingrequirements and optimum utilization of available resources. As a result, most ofthe capital expenditures will actually be made in 2015 and 2016 with staggeredcompletion dates. Consequently, about US$600,000 of incremental recurrent costsincluded in the 2014 budget will not be utilized. Based on the revised schedule andrespective completion dates of the capital expenditure budgets, the recurrent costshave been re-estimated for 2015 and 2016 with a corresponding depreciationschedule.
54. The revised estimate for the cost of the CLEE action plan in 2015 (excludingrecurrent costs associated with ICOs) is US$903,000 inclusive of both IT and non-ITrelated actions. Since US$600,000 was already included in the 2014 budgetbaseline, the incremental cost of the action plan for 2015 is US$303,000. It may benoted that based on the currently planned implementation schedule, there will bean incremental recurrent cost for the CLEE action plan in 2016.
CLEE one-time adjustment cost55. A part of the one-time adjustment cost of US$2.1 million was requested for the set
up and establishment of ICOs (US$1.5 million). It is now proposed to use the fundsto establish new offices and upgrade existing ICOs where CPMs are to be outposted.Based on the current costs of administering ICOs, US$300,000 has been estimatedin 2015 as the incremental administrative cost of six upgrades (at US$50,000 each)while US$410,000 is estimated for 2016 reflecting the administrative cost of threenew ICOs (at US$120,000 each) and one upgrade. These estimates exclude staffcosts associated with new ICOs. For 2015, there will be additional staff costs andthese are included as part of the SWP cost drivers. While there is an immediate

GC 38/L.6
13
increase in staff costs for new and upgraded ICOs, such costs will eventually beoffset by corresponding reductions at headquarters.
Strategic workforce planning and organizational development exercise56. The initial assessment of staffing requirements arising from this year’s annual SWP
exercise estimates a slight increase in staff numbers, the majority of which relatesto country offices and operational requirements. The cost of the staff increase in2015 and the full-year effect of CLEE-driven new technical positions in 2014 willhave an incremental cost of US$1.1 million for a net increase of 9.42 FTEs, afteradjusting for SWP-proposed reductions in staff positions. The proposed absorptionof staff positions previously funded by supplementary fund management fees hasresulted in a net increase of 3 FTEs with an equivalent cost of US$430,000. Inaddition, there will be a price increase associated with the full-year effect ofpositions reclassified in 2014 as well as anticipated reclassifications in 2015.
Other cost drivers57. The other increases in costs include: (i) price increases related to maintenance,
support and licensing fees; (ii) real increases in depreciation for prior years’ capitalexpenditure projects coming on stream; (iii) price increase related to recruitmentand relocation costs associated with outposting and increased ICO presence; and(iv) higher provision for maternity costs. These costs have been included in the2015 final budget proposal.
F. 2015 net regular budget proposal58. Based on Audit Committee and Executive Board feedback on the high-level preview,
the current estimates have been refined and adjusted downwards in the 2015budget proposal. The net regular budget for 2015 is proposed at US$151.59 million,representing a 1.3 per cent nominal increase over 2014 (compared to 1.7 per centin the high-level preview), of which 1 per cent represents a real/volume increaseand a net price increase of 0.3 per cent arising from inflation, adjusted for thechange in the exchange rate assumption.
59. The 1 per cent real increase is the net effect of the real increases and decreasesenumerated below: (i) impact of the annual SWP exercise detailed above(US$1.1 million); (ii) increased depreciation of LGS replacement project(US$140,000), CLEE-related (US$253,000) and other capital expendituresapproved in the past (US$100,000); (iii) net incremental recurrent support costs ofthe LGS replacement project (US$135,000) and CLEE-related projects(US$50,000); and (iv) cost of additional staff positions previously funded bysupplementary funds fees (US$432,000). This is offset by a real reduction in theuse of consultants equivalent to four FTEs (US$720,000).
60. The 0.3 per cent price increase is the net effect of the assumed general inflationrate (1.9 per cent) as well as price escalations on specific cost items that could notbe absorbed, adjusted for the change in the assumed exchange rate. Significantcost-cutting measures have been – and continue to be – put in place in order tominimize the overall price increase stemming from the rising costs of severalexpenditure items and to accommodate the incremental cost of the annual within-grade-step increase for all staff. This year has also benefited from the effect of thestronger United States dollar. It may not be possible to contain price increases tothis level in future years.
2015 budget proposal by department61. The current year’s budget proposal by department is set out in table 5.

GC 38/L.6
14
Table 5Regular budget by department, 2014 and 2015(Millions of United States dollars)
DepartmentApproved
2014Proposed
2015Total
changeChange
(percentage)
Office of the President and Vice-President 2.77 2.73 (0.04) (1.4)
Corporate Services Support Group 18.18 17.99 (0.19) (1.0)
Partnership and Resource Mobilization Office 4.14 4.16 0.02 0.5
Strategy and Knowledge Management Department 6.60 6.80 0.20 3.0
Programme Management Department 73.57 74.11 0.54 0.7
Financial Operations Department 10.18 10.69 0.51 5.0
Corporate Services Department 28.34 28.36 0.02 0.1
Corporate cost centre costs (allocated across clusters) 2.38 2.67 0.29 12.2
Corporate cost centre (portion not allocated across clusters):
- 2012 Professional salary increases withheld 0.68 0.68 0 0
- Other corporate costs 2.80 3.40 0.6 21.4
Total 149.64 151.59 1.95 1.3
62. The reason for the changes in 2015 departmental allocations compared to 2014 areexplained below:
(a) OPV: The minimal reduction in the OPV budget is due to a lower staff costbased on revised standard staff costs and slight trimming of non-staff costs.
(b) CSSG: The decrease in the CSSG budget is primarily due to savings identifiedby SEC.
(c) PRM: The slight increase in PRM’s budget reflects the additional allocationprovided for resource mobilization and replenishment-related activities.
(d) SKD: The increase in SKD’s budget is attributable to the anticipated fullcomplement of staff in 2015 and associated costs. Additional provision hasbeen made to promote knowledge management initiatives.
(e) PMD: The increase in PMD’s budget is primarily due to the seven new staffpositions, increases in costs associated with upgraded ICOs, and otherinstitutional contracts, significantly offset by a reduction in consultancy costsand partly offset by savings in travel costs and lower standard staff costs.
(f) FOD: The increase in FOD’s budget is mainly due to the additional staffpositions provided through the SWP to support financial management andresource mobilization efforts and slightly higher travel costs to support loanadministration and fiduciary requirements.
(g) CSD: There is minimal increase in CSD’s overall budget. Increases in staffpositions and higher incremental recurrent costs related to the LGSreplacement project and the CLEE have been offset by lower standard staffcosts and by the effect of the exchange rate.
(h) Corporate cost centre: The costs under this heading are split between thoseallocable across clusters (i.e. recruitment and assignment costs, LGSdepreciation, and costs associated with the rewards and recognitionframework) and those that are centrally managed institutional costs(i.e. other depreciation, maternity, after-service medical costs, external auditfees, etc.). The increase in corporate costs allocable across clusters is
GC 38/L.6
15
primarily the result of additional allocations for recruitment and relocationcosts. The increase in centrally managed corporate costs is primarily due tohigher CLEE-related costs, regular depreciation and a higher provision formaternity-associated costs.
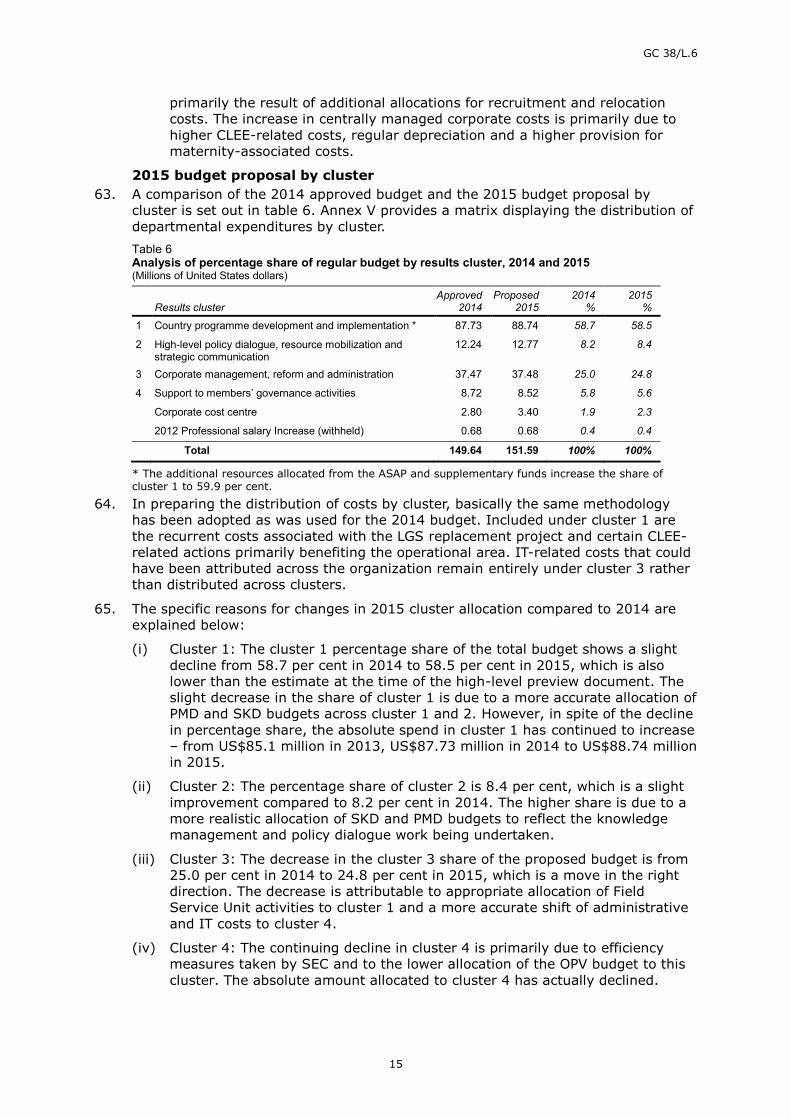
2015 budget proposal by cluster63. A comparison of the 2014 approved budget and the 2015 budget proposal by
cluster is set out in table 6. Annex V provides a matrix displaying the distribution ofdepartmental expenditures by cluster.Table 6Analysis of percentage share of regular budget by results cluster, 2014 and 2015(Millions of United States dollars)
Results clusterApproved
2014Proposed
20152014
%2015
%
1 Country programme development and implementation * 87.73 88.74 58.7 58.5
2 High-level policy dialogue, resource mobilization andstrategic communication
12.24 12.77 8.2 8.4
3 Corporate management, reform and administration 37.47 37.48 25.0 24.8
4 Support to members’ governance activities 8.72 8.52 5.8 5.6
Corporate cost centre 2.80 3.40 1.9 2.3
2012 Professional salary Increase (withheld) 0.68 0.68 0.4 0.4
Total 149.64 151.59 100% 100%
* The additional resources allocated from the ASAP and supplementary funds increase the share ofcluster 1 to 59.9 per cent.
64. In preparing the distribution of costs by cluster, basically the same methodologyhas been adopted as was used for the 2014 budget. Included under cluster 1 arethe recurrent costs associated with the LGS replacement project and certain CLEE-related actions primarily benefiting the operational area. IT-related costs that couldhave been attributed across the organization remain entirely under cluster 3 ratherthan distributed across clusters.
65. The specific reasons for changes in 2015 cluster allocation compared to 2014 areexplained below:
(i) Cluster 1: The cluster 1 percentage share of the total budget shows a slightdecline from 58.7 per cent in 2014 to 58.5 per cent in 2015, which is alsolower than the estimate at the time of the high-level preview document. Theslight decrease in the share of cluster 1 is due to a more accurate allocation ofPMD and SKD budgets across cluster 1 and 2. However, in spite of the declinein percentage share, the absolute spend in cluster 1 has continued to increase– from US$85.1 million in 2013, US$87.73 million in 2014 to US$88.74 millionin 2015.
(ii) Cluster 2: The percentage share of cluster 2 is 8.4 per cent, which is a slightimprovement compared to 8.2 per cent in 2014. The higher share is due to amore realistic allocation of SKD and PMD budgets to reflect the knowledgemanagement and policy dialogue work being undertaken.
(iii) Cluster 3: The decrease in the cluster 3 share of the proposed budget is from25.0 per cent in 2014 to 24.8 per cent in 2015, which is a move in the rightdirection. The decrease is attributable to appropriate allocation of FieldService Unit activities to cluster 1 and a more accurate shift of administrativeand IT costs to cluster 4.
(iv) Cluster 4: The continuing decline in cluster 4 is primarily due to efficiencymeasures taken by SEC and to the lower allocation of the OPV budget to thiscluster. The absolute amount allocated to cluster 4 has actually declined.

GC 38/L.6
16
66. Although the share of cluster 1 shows a slight decrease in 2015 for the reasonsexplained above, it should be noted that, as shown in table 1, the total cluster 1share of the gross budget rises to 59.9 per cent.
2015 budget proposal by summary cost category67. The breakdown of the current year’s budget proposal across major cost categories
is set out in table 7. Annex VI provides an analysis of the 2015 budget proposal bydetailed cost category and by department.Table 7Analysis of budget by summary cost category, 2014 and 2015(Millions of United States dollars)
Cost categoryApproved
2014Proposed
2015Total
changeChange
(percentage)
Staff 93.20 94.19 0.99 1.1
Consultants 22.43 21.95 (0.48) (2.1)
Duty travel 9.23 8.96 (0.27) (2.9)
ICT non-staff costs 5.54 5.55 0.01 0.2
Other costs 19.24 20.94 1.70 8.8
Total 149.64 151.59 1.95 1.3%
68. The increase in staff costs in 2015 compared to 2014 is due to the provision ofadditional staff positions as recommended by the SWP exercise plus the absorptionof three core staff positions previously funded by supplementary fund managementfees, the cost of reclassifications and the additional allocation for recruitment andrelocation costs. The increase is offset by the lower standard staff costs arisingfrom the effect of the lower exchange rate assumption compared to 2014.
69. Consultancy costs in 2015 have decreased compared to 2014 due to lower use ofconsultants primarily by PMD, partly offset by price increases. The exchange ratehas minimal effect on this expense category.
70. Duty travel has also decreased in 2015. This is a result of several initiativesundertaken to contain/reduce travel costs (such as the preferred hotel programme,the revision of DSA rates, and better travel cost management) in spite of increasedaverage ticket prices in most sectors.
71. There is almost no change in the ICT non-staff costs as the increases in LGS andother regular support and maintenance costs arising from contractual obligations,and the recurrent costs of additional systems coming on stream have beensubstantially offset by the impact of the exchange rate assumption.
72. The substantial increase in other costs is mainly due to higher costs associated withthe establishment of ICOs and increases in the corporate cost centre, as explainedabove.
G. 2015 gross budget proposal73. IFAD implements and manages a number of operations for third parties that are
external but complementary to IFAD’s programme of loans and grants. Theseoperations are financed from supplementary funds. Engaging in these partnershipactivities involves additional incremental costs to IFAD in design, implementation,supervision and administration. These costs are usually funded from managementfee income under the supplementary fund agreement.
74. The gross budget proposed for 2015 amounts to US$156.72 million and includesUS$5.13 million in costs to support supplementary-fund-related work over andabove the US$151.59 million regular budget. The slightly lower estimate withrespect to the prior year reflects the requirements for the third year of ASAP

GC 38/L.6
17
implementation. The amount can be fully recovered from the annual allocableportion of the fee income generated from the management of supplementary funds.Approval is only being sought for the proposed net regular budget ofUS$151.59 million. Table 8 provides a summary of the gross and net regularbudget.Table 8Indicative gross and net budget for 2015(Millions of United States dollars)
Cost category 2014 2015
Gross budget 155.0 156.72
Costs to support supplementary fundwork
(5.36) (5.13)
Net budget 149.64 151.59
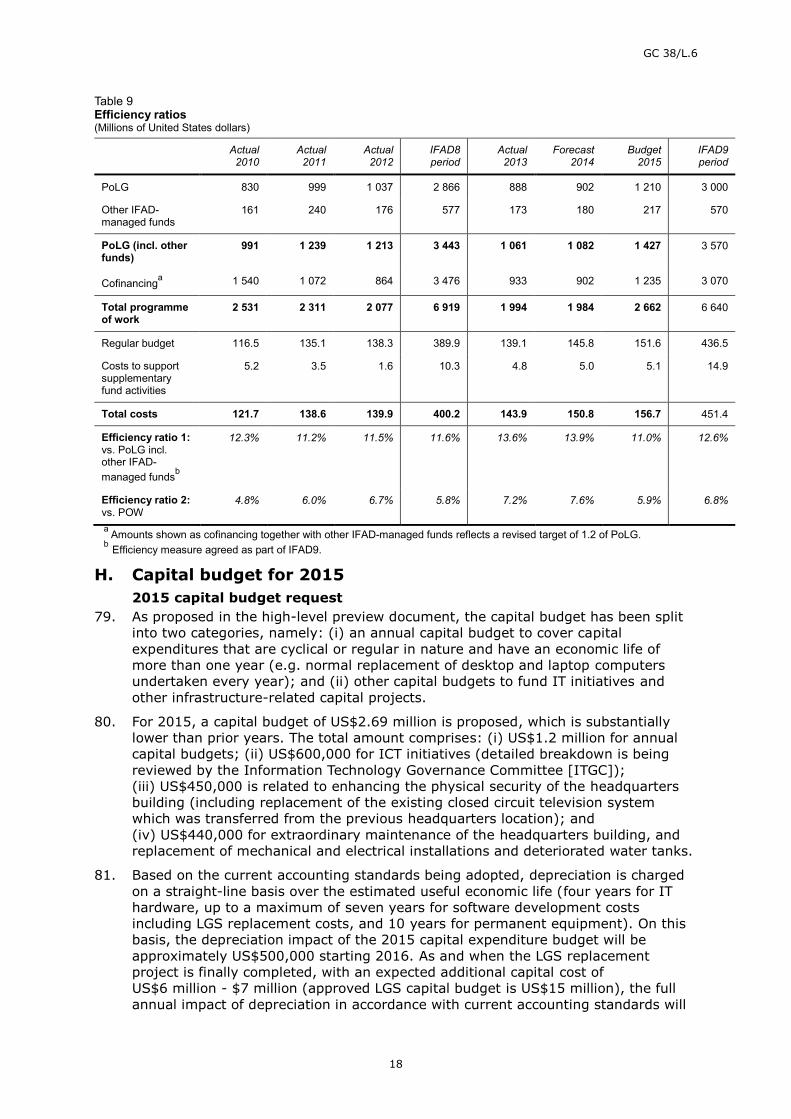
Efficiency ratio
75. While IFAD’s efficiency ratio – measured by dividing actual administrativeexpenditures by the annual PoLG (excluding other IFAD-managed funds) –continues to be tracked, the new efficiency measure now includes other IFAD-managed funds.
76. Based on the proposed gross budget (which includes annual management feeallocation) of US$156.7 million and an augmented PoLG of US$1.427 billion, thenew administrative efficiency ratio for 2015 is 11.0 per cent, compared to a forecast13.9 per cent in 2014 based on estimated budget utilization and projected PoLG –and is therefore an improvement.
77. IFAD expects the shortfall in the 2013 and 2014 programme of work, comparedwith the original projection, to be made up within 2015, with the total PoLGelement of the programme (excluding managed funds) expected to reach theUS$3 billion level. As shown in table 9, the average efficiency ratio for the three-year 2013-2015 period is expected to be 12.4 per cent, which is within the targetset under IFAD9.
78. Efficiency ratio 1, as defined above, fails to capture the extent and impact of thecofinancing element of the total POW. Starting in 2014, a second efficiency ratiowas introduced – defined as actual administrative expenditures (includingexpenditures financed by management fees) divided by POW (i.e. PoLG plus otherIFAD-managed funds plus cofinancing) – in order to capture the full extent of whatIFAD delivers with the proposed budget. Efficiency ratio 2 results in an average of6.8 per cent over the IFAD9 period which is lower than the average during theIFAD8 period of 5.8 per cent, reflecting the current difficult ODA and cofinancingenvironment.
GC 38/L.6
18
Table 9Efficiency ratios(Millions of United States dollars)
Actual2010
Actual2011
Actual2012
IFAD8period
Actual2013
Forecast2014
Budget2015
IFAD9period
PoLG 830 999 1 037 2 866 888 902 1 210 3 000
Other IFAD-managed funds
161 240 176 577 173 180 217 570
PoLG (incl. otherfunds)
991 1 239 1 213 3 443 1 061 1 082 1 427 3 570
Cofinancinga 1 540 1 072 864 3 476 933 902 1 235 3 070
Total programmeof work
2 531 2 311 2 077 6 919 1 994 1 984 2 662 6 640
Regular budget 116.5 135.1 138.3 389.9 139.1 145.8 151.6 436.5
Costs to supportsupplementaryfund activities
5.2 3.5 1.6 10.3 4.8 5.0 5.1 14.9
Total costs 121.7 138.6 139.9 400.2 143.9 150.8 156.7 451.4
Efficiency ratio 1:vs. PoLG incl.other IFAD-managed fundsb
12.3% 11.2% 11.5% 11.6% 13.6% 13.9% 11.0% 12.6%
Efficiency ratio 2:vs. POW
4.8% 6.0% 6.7% 5.8% 7.2% 7.6% 5.9% 6.8%
a Amounts shown as cofinancing together with other IFAD-managed funds reflects a revised target of 1.2 of PoLG.b Efficiency measure agreed as part of IFAD9.
H. Capital budget for 20152015 capital budget request
79. As proposed in the high-level preview document, the capital budget has been splitinto two categories, namely: (i) an annual capital budget to cover capitalexpenditures that are cyclical or regular in nature and have an economic life ofmore than one year (e.g. normal replacement of desktop and laptop computersundertaken every year); and (ii) other capital budgets to fund IT initiatives andother infrastructure-related capital projects.
80. For 2015, a capital budget of US$2.69 million is proposed, which is substantiallylower than prior years. The total amount comprises: (i) US$1.2 million for annualcapital budgets; (ii) US$600,000 for ICT initiatives (detailed breakdown is beingreviewed by the Information Technology Governance Committee [ITGC]);(iii) US$450,000 is related to enhancing the physical security of the headquartersbuilding (including replacement of the existing closed circuit television systemwhich was transferred from the previous headquarters location); and(iv) US$440,000 for extraordinary maintenance of the headquarters building, andreplacement of mechanical and electrical installations and deteriorated water tanks.
81. Based on the current accounting standards being adopted, depreciation is chargedon a straight-line basis over the estimated useful economic life (four years for IThardware, up to a maximum of seven years for software development costsincluding LGS replacement costs, and 10 years for permanent equipment). On thisbasis, the depreciation impact of the 2015 capital expenditure budget will beapproximately US$500,000 starting 2016. As and when the LGS replacementproject is finally completed, with an expected additional capital cost ofUS$6 million - $7 million (approved LGS capital budget is US$15 million), the fullannual impact of depreciation in accordance with current accounting standards will

GC 38/L.6
19
be approximately an additional US$0.9 million in line with International FinancialReporting Standards (IFRS).Table 10Capital budget request for 2015(Thousands of United States dollars)
2015 proposed
(a) Annual recurring capital expenditureIT infrastructure/regular hardware replacement 1 200
Annual recurring capital subtotal 1 200
(b) Capital projectsICT initiatives 600
Security 450
Facilities/infrastructure 440
Capital projects subtotal 1 490
Total 2 690
82. The spend for new IT initiatives has been limited to only US$600,000 in 2015 inorder to prioritize CLEE-related IT capital projects. Once the IT projects have beendefined and scoped by the end of 2014, significant work will have to be done tosubstantially complete these projects by 2015. Taking into account the ongoing ITinitiatives started in previous years, the LGS replacement project and the numerousCLEE-related IT projects, it is prudent not to embark on several other new ITinitiatives at this time.
83. The following benefits are expected from the above capital projects: (i) apart frommaintaining current hardware up-to-date and trouble-free, the annual capitalexpenditure is not expected to provide any monetary benefits; (ii) benefits from theICT initiatives will be known once the specific projects are approved by the ITGC;(iii) in the current context of the security situation and based on therecommendations of the United Nations Department of Safety and Security(UNDSS), this initiative is considered a mandatory requirement; and (iv) thereplacement of older equipment and achieving a higher Leadership in Energy &Environmental Design (LEED) certification will lead to improved efficiencies,reduced maintenance costs and lower consumption of utilities.
Initiatives approved (2008-2014)84. The cumulative capital budget (excluding CLEE) approved for the period 2008 to
2014 amounts to some US$34 million. Of this, US$15.76 million relates to the LGSreplacement project. Excluding this amount, the regular annual capital budgetexpenditures have ranged between US$3 million and US$5 million in the past,primarily representing IT costs. A table summarizing capital expenditure approvalsto date is provided in annex X.

GC 38/L.6
20
Part two – Results-based work programme and budgetfor 2015 and indicative plan for 2016-2017 of theIndependent Office of Evaluation of IFAD
I. Introduction85. This document contains the proposed work programme and budget for 2015 and
indicative plan for 2016-2017 of the Independent Office of Evaluation of IFAD(IOE). In line with the IFAD Evaluation Policy (2011), the IOE budget and IFAD’sadministrative budget are developed independently of each other.8 As in the past,the proposed IOE work programme document for 2015 has been developed on thebasis of consultations with IFAD Management, taking into account IFAD’s prioritiesfor the Ninth Replenishment of IFAD’s Resources (IFAD9) period (2013-2015) andthe ongoing discussions in the context of IFAD10.
86. Building on the new format and structure developed in 2013, this documentpresents the proposed IOE work programme and budget “based on a criticalassessment of needs, rather than simply using the current budget as a baseline.”9
It also aims to strengthen the linkage between the work programme andexpenditures and provide greater detail in the breakdown of budgeted costs,particularly non-staff costs, including those related to consultants. The documentprovides details of actual expenditures for 2013; 2014 budget utilization at the timethis document was prepared; and the expected 2014 year-end utilization.
87. This year IOE introduced two new features into its work programme and budgetdocument: (i) reported progress against the key performance indicators (KPIs)contained in IOE’s results measurement framework (RMF), as adopted by the Boardin December 2013; and (ii) a selectivity framework to guide the choice of IFAD-funded projects to undergo impact evaluations by IOE. These new features areexplained in section III(A).
88. The proposed work programme and budget have been developed followingcomments made during the eighty-fourth session of the Evaluation Committee on2 July, as well as by the Audit Committee and the Executive Board during theirSeptember 2014 sessions. This final version of the document also reflects theoutcome of discussions with the Evaluation Committee on 10 October 2014, and willbe considered by the Executive Board in December 2014. Prior to this, as per pastpractice, the budget proposal will be considered again by the Audit Committee inNovember 2014, together with IFAD's 2015 administrative budget. Finally, thebudget will be submitted, upon the recommendation of the Board in December2014, to the Governing Council in 2015 for approval. On a process-related issue, itis important to highlight that IOE has strengthened its dialogue with IFAD's Budgetand Organizational Development Unit (BOD)10 to ensure that the proposal builds onkey budgeting principles and parameters used by IFAD Management in preparing itsadministrative budget.
89. The document has been organized into six sections. Section II briefly describes themain insights emerging thus far from the implementation of the 2014 workprogramme; section III highlights the achievements of the 2014 evaluation workprogramme, overall 2013 budget utilization, 2014 budget utilization as of mid-September 2014 and projected utilization for end 2014, and use of the 3 per centcarry-forward from the 2013 IOE budget; section IV provides a brief description of
8 “The levels of the IOE component and … IFAD’s administrative budget will be determined independently of eachother.” IFAD Evaluation Policy, p.11.9 See Minutes of the 107th session of the Executive Board, p.29.10 Among other tasks, BOD is responsible for preparing IFAD's annual administrative budget and coordinating theorganization's annual Strategy Workforce Planning exercise.

GC 38/L.6
21
IOE’s strategic objectives; and section V focuses on the proposed evaluationactivities for 2015. Lastly, section VI outlines the final proposal for the 2015 budgetand human resources required by IOE to implement its work programme andachieve its main objectives in an effective and timely manner.
II. Key insights from the implementation of the 2014work programme
90. In preparing this document, IOE undertook an internal assessment of theimplementation of its 2014 work programme and budget. Some of the key insightsare that:
Ways and means need to be found to streamline evaluation processes, inparticular to shorten the duration of major evaluations, especially countryprogramme and corporate-level evaluations (CLEs), without compromisingtheir analytical depth and quality. The streamlining of IOE evaluationprocesses is being carried out in the context of the development of the secondedition of the Evaluation Manual, which will be issued in 2015;
Evaluation recommendations must be useful, prioritized and strategic. Thiswould facilitate discussions on evaluation recommendations by IFAD’sgoverning bodies and enable Management to easily internalize andincorporate them into new policies, strategies and processes and IFAD-supported operations;
Further opportunities for partnership in evaluation – for example jointevaluations with the Rome-based United Nations agencies, internationalfinancial institutions and recipient countries – are needed to foster learning,knowledge-sharing and evaluation capacity development;
IOE should engage in a dialogue with and support IFAD Management in theirefforts to conduct and mainstream (project) impact evaluations;
IOE should further develop the selectivity framework that it introduced lastyear to ensure greater transparency in selecting projects eligible for impactevaluation by IOE.11 The IOE selectivity framework has since been furtherdeveloped and has been used in identifying which project will undergo animpact evaluation in 2014 (see paragraph 91 below, last bullet); and
In addition to the above, more thorough advance planning is needed withinIOE and in dialogue with the Office of the Secretary to ensure that documentsfor IFAD governing bodies, especially the Evaluation Committee and ExecutiveBoard, are produced and dispatched in a timely manner.
III. Current perspectiveA. Highlights of 201491. By the end of the year, IOE expects to have implemented all the activities planned
in the 2014 work programme. Moreover, it will have conducted several additionalactivities, such as country visits to collect evidence from the field in the context ofthe evaluation synthesis report on IFAD’s engagement in middle-income countriesthat was finalized in early 2014. Selected key achievements to date include:
The completion of the corporate-level evaluation on IFAD’s replenishments.This evaluation raised crucial corporate issues that were discussed by theEvaluation Committee and Executive Board, and also by the IFAD10Consultation at its second session in June 2014;
11 In this regard, IOE first introduced a selectivity framework in 2013 to guide the selection and prioritize evaluations tobe conducted in 2014.

GC 38/L.6
22
The corporate-level evaluation on the IFAD Policy for Grant Financing hasbeen finalized and will be discussed by the Board in December 2014. Themain recommendation emerging from this evaluation is for IFAD to develop anew grants policy and to further leverage this important instrument to achieveIFAD’s mandate;
The corporate-level evaluation on IFAD’s work in fragile and conflict-affectedstates and situations is in full swing. A progress report on this evaluation waspresented during the third session of the IFAD10 Consultation in October2014;
The completion of the evaluation synthesis report on IFAD’s engagement inmiddle-income countries. In this regard, in April, IOE organized an in-houselearning workshop with IFAD Management and staff to exchange views on thetopic. The workshop included the participation of the former Director Generalof the Independent Office of Evaluation of the Government of India andcolleagues from the Food and Agriculture Organization of the United Nations(FAO) and World Food Programme (WFP);
The launching of the first joint evaluation synthesis report on pastoraldevelopment prepared and cofinanced by IOE and FAO’s Office of Evaluation.As this is a collaborative endeavour, opportunities for discussing the finalreport in a joint session of the IFAD Evaluation Committee and FAOProgramme Committee will be explored early next year;
The 2014 Annual Report on Results and Impact of IFAD Operations (ARRI)has been prepared. This year’s ARRI includes a dedicated section on theopportunities and challenges faced by project management. An in-houselearning workshop was held on 19 September 2014 to discuss the ARRI’smain findings and recommendations. The workshop was attended by IFADManagement, staff and consultants, as well as representatives from the SwissAgency for Development Cooperation and United Nations DevelopmentProgramme; and
The second IOE impact evaluation was launched in June and is now in fullswing. The operation selected, using the newly introduced selectivityframework, is the Jharkhand-Chhattisgarh Tribal Development Programme(JCTDP) in India.
92. Progress in implementing planned evaluation activities for 2014 is summarized inannex XVI, table 1; information is also provided (in annex XVI, table 2) on progressmade against the targets for each KPI included in the IOE results measurementframework for 2014.12 The data reveal that activities have been undertaken withinplanned timelines and that agreed targets have been achieved. In some cases,targets have been surpassed.
93. As requested by the Evaluation Committee in July and the Board in September, IOEhas further developed its RMF for 2015 to include sharper KPIs, including on IOE’sefficiency. The enhanced RMF for 2015 is presented in annex XX.
94. As mentioned above (paras. 87 and 90), this year IOE has further developed itsselectivity framework (see annex XXI), which was first introduced in the 2014 workprogramme and budget document. The selectivity framework now includes criteriaand guiding questions that allow for a more transparent process in selectingprojects for impact evaluations by IOE (see annex XXI, table 5). For example, IOEwill select projects for impact evaluation if, among other criteria: (i) the operationclosed between 1-3 years ago; (ii) they are located in a country where IOE plans acountry programme evaluation (CPE) in the near future; (iii) their design includes
12 The IOE results measurement framework for 2014 agreed by the Board is contained in annex XV.

GC 38/L.6
23
innovative characteristics that merit further and more detailed study anddocumentation through independent evaluation; and (iv) the project is not coveredby the impact evaluations undertaken by IFAD Management - to avoid duplicationof effort and ensure usefulness for the organization as a whole.
95. In addition, IOE has introduced a more systematic approach to continuousmonitoring and quarterly performance reviews of the implementation of its workprogramme and budget in order to take stock of progress and flag issues that meritcloser attention.
B. 2014 Budget utilization96. Table 1 below provides information on budget utilization by IOE in 2013; budget
utilization as of mid-September 2014; and expected utilization by year-end (2014).Table 1IOE budget utilization in 2013 and projected utilization in 2014
Evaluation workApproved
budget 2013
Budgetutilization 2013
(US$)Approved
budget 2014
2014 Commitmentas of mid-Sept.
(US$)*
Expectedutilization as ofyear-end 2014
Staff travel 330 000 332 492 345 000 245 237 345 000Consultant fees 1 525 362 1 685 763 1 465 000 1 523 228 1 465 000Consultant travel andallowances
352 007 428 719 395 000 356 521 395 000
In-country CPE learningevents
30 000 35 690 35 000 45 569 35 000
Evaluation outreach,staff training and othercosts
109 342 192 560 155 992 95 380 155 992
Non-staff costs 2 346 711 2 675 224 2 395 992 2 265 935 2 395 992Staff costs 3 667 268 3 098 962 3 586 690 3 142 589 3 437 123
Total 6 013 979 5 774 186 5 982 682 5 408 524 5 833 115
Utilization 96.0% 90.4% 97.5%
* Based on staff costs committed until year-end.
97. Actual total expenses against IOE’s 2013 budget amounted to US$5.774 million, or96 per cent of budget utilization. The lower utilization relates primarily to staff costsavings (vacant positions), offset partly by an increase in consultancyrequirements. Some of the staff costs savings were also used to undertakeadditional outreach work to ensure wider dissemination of evaluation lessons andtraining programmes during the year.
98. In 2014, against an approved budget of US$5.983 million, the utilization (in termsof commitments) as of mid-September 2014 was US$5.409 million, or 90.4 percent. The high utilization at that time of the year was due primarily to the full-yearcommitment of staff costs, which is in line with IFAD-wide established practice, andto higher commitments for hiring consultants and for staff/consultants’ travel costsas part of the normal business cycle, as funds for most evaluations are committedby that time of the year.
99. The expected overall utilization of the IOE budget in 2014 as of year-end iscurrently projected at US$5.833 million, corresponding to about 97.5 per cent ofthe approved budget. The anticipated lower utilization relates to staff costs as aresult of vacant positions that are currently being filled, and some savings from theIOE Director’s position. A small part of the savings has been utilized for recruitmentcosts in line with IFAD’s Human Resources rules and also to fund additionalactivities, in particular a further evaluation synthesis report on IFAD's work withindigenous peoples.

GC 38/L.6
24
C. Utilization of the 2013 carry-forward100. The 3 per cent carry-forward rule, in place since 2004, states that unobligated
appropriations at the close of the financial year may be carried forward into thefollowing financial year up to an amount not exceeding 3 per cent of the approvedannual budget of the previous year.
101. The 3 per cent carry-forward from IOE’s 2013 budget amounted to US$180,419;this was by and large used to undertake the CLE on IFAD's engagement in fragileand conflict-affected states and situations. This evaluation was not adequatelybudgeted in 2014 as the requirements for this important exercise could only be fullyestimated when the evaluation design was finalized in early 2014. In particular, the3 per cent carry-forward was being used to enhance the evidence base and qualityof the evaluation by conducting country visits to capture the views of beneficiariesand other in-country partners and to observe project activities on the ground infragile states.
IV. IOE strategic objectives102. As agreed with the Board in December 2013 and in line with the IFAD Evaluation
Policy (2011), IOE’s strategic objectives for 2014 and 2015 – the remaining twoyears of the IFAD9 period13 – are as follows:
(i) Strategic objective 1 (SO1): Contribute, through independent evaluationwork, to enhancing accountability for results; and
(ii) Strategic objective 2 (SO2): Promote effective learning and knowledgemanagement to further strengthen the performance of IFAD operations.
103. These two strategic objectives allow IOE to achieve the overarching goal set forindependent evaluation, namely to promote accountability and foster learning toimprove the performance of corporate policies, strategies, processes and IFAD-supported operations.
104. Annex XIV summarizes IOE’s strategic objectives, divisional management results(DMRs) and the outputs that the division proposes to deliver in 2015.
105. As mentioned in paragraph 93, the RMF for 2015 includes sharper KPIs that willallow for better performance measurement, including on IOE’s efficiency, andreporting against the DMRs. Details on the efficiency indicators can be found inparagraph 133 and in annex XX, which contains the RMF for 2015.
V. 2015 work programme106. The following paragraphs provide an overview of the main evaluation activities
foreseen for 2015. The full list of proposed evaluation activities for IOE in 2015 ispresented in annex XVII, table 1 and the indicative plan for 2016-2017, inannex XVII, table 2. It is worth recalling that IOE applied the selectivity frameworkin annex XXI to prioritize and select the specific evaluations to be undertaken nextyear. The major outputs planned for 2015 are summarized in table 2 below.
13 It was also agreed with the Board that in 2015, while preparing the 2016 work programme and budget, IOE wouldreassess the relevance of its strategic objectives for the IFAD10 period (2016-2018).
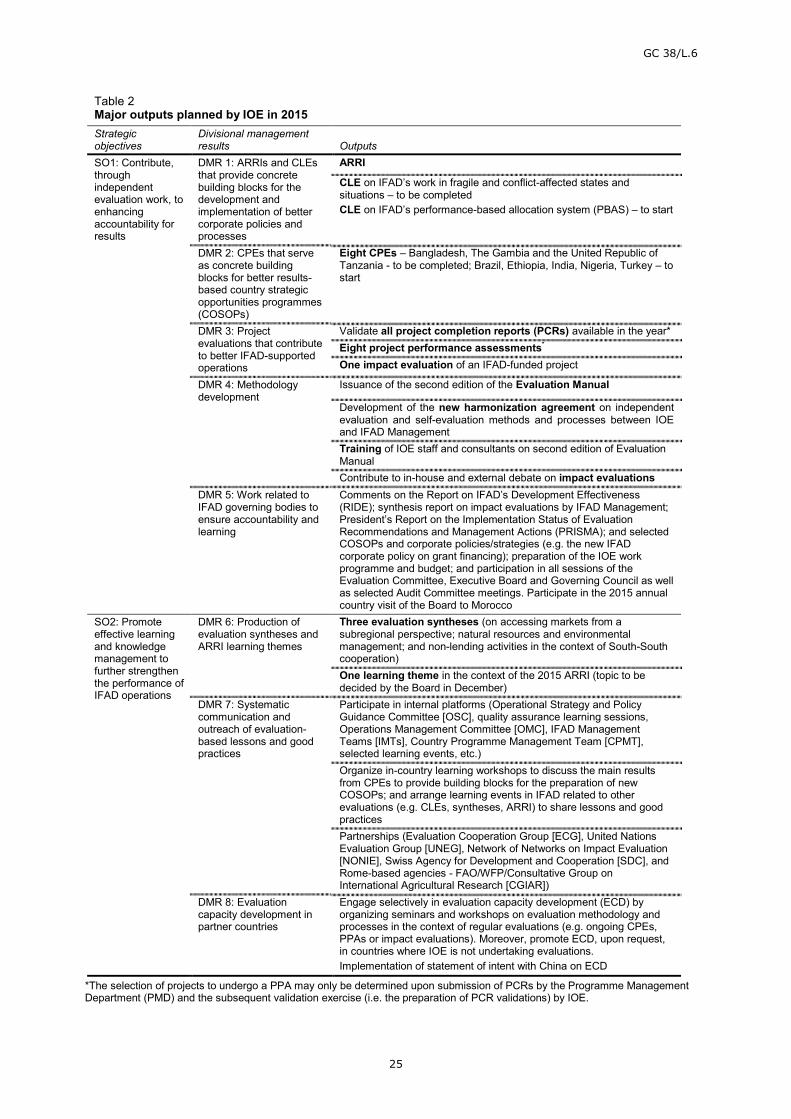
GC 38/L.6
25
Table 2Major outputs planned by IOE in 2015Strategicobjectives
Divisional managementresults Outputs
SO1: Contribute,throughindependentevaluation work, toenhancingaccountability forresults
DMR 1: ARRIs and CLEsthat provide concretebuilding blocks for thedevelopment andimplementation of bettercorporate policies andprocesses
ARRI
CLE on IFAD’s work in fragile and conflict-affected states andsituations – to be completedCLE on IFAD’s performance-based allocation system (PBAS) – to start
DMR 2: CPEs that serveas concrete buildingblocks for better results-based country strategicopportunities programmes(COSOPs)
Eight CPEs – Bangladesh, The Gambia and the United Republic ofTanzania - to be completed; Brazil, Ethiopia, India, Nigeria, Turkey – tostart
DMR 3: Projectevaluations that contributeto better IFAD-supportedoperations
Validate all project completion reports (PCRs) available in the year*Eight project performance assessments*
One impact evaluation of an IFAD-funded project
DMR 4: Methodologydevelopment
Issuance of the second edition of the Evaluation Manual
Development of the new harmonization agreement on independentevaluation and self-evaluation methods and processes between IOEand IFAD ManagementTraining of IOE staff and consultants on second edition of EvaluationManualContribute to in-house and external debate on impact evaluations
DMR 5: Work related toIFAD governing bodies toensure accountability andlearning
Comments on the Report on IFAD’s Development Effectiveness(RIDE); synthesis report on impact evaluations by IFAD Management;President’s Report on the Implementation Status of EvaluationRecommendations and Management Actions (PRISMA); and selectedCOSOPs and corporate policies/strategies (e.g. the new IFADcorporate policy on grant financing); preparation of the IOE workprogramme and budget; and participation in all sessions of theEvaluation Committee, Executive Board and Governing Council as wellas selected Audit Committee meetings. Participate in the 2015 annualcountry visit of the Board to Morocco
SO2: Promoteeffective learningand knowledgemanagement tofurther strengthenthe performance ofIFAD operations
DMR 6: Production ofevaluation syntheses andARRI learning themes
Three evaluation syntheses (on accessing markets from asubregional perspective; natural resources and environmentalmanagement; and non-lending activities in the context of South-Southcooperation)One learning theme in the context of the 2015 ARRI (topic to bedecided by the Board in December)
DMR 7: Systematiccommunication andoutreach of evaluation-based lessons and goodpractices
Participate in internal platforms (Operational Strategy and PolicyGuidance Committee [OSC], quality assurance learning sessions,Operations Management Committee [OMC], IFAD ManagementTeams [IMTs], Country Programme Management Team [CPMT],selected learning events, etc.)Organize in-country learning workshops to discuss the main resultsfrom CPEs to provide building blocks for the preparation of newCOSOPs; and arrange learning events in IFAD related to otherevaluations (e.g. CLEs, syntheses, ARRI) to share lessons and goodpracticesPartnerships (Evaluation Cooperation Group [ECG], United NationsEvaluation Group [UNEG], Network of Networks on Impact Evaluation[NONIE], Swiss Agency for Development and Cooperation [SDC], andRome-based agencies - FAO/WFP/Consultative Group onInternational Agricultural Research [CGIAR])
DMR 8: Evaluationcapacity development inpartner countries
Engage selectively in evaluation capacity development (ECD) byorganizing seminars and workshops on evaluation methodology andprocesses in the context of regular evaluations (e.g. ongoing CPEs,PPAs or impact evaluations). Moreover, promote ECD, upon request,in countries where IOE is not undertaking evaluations.Implementation of statement of intent with China on ECD
*The selection of projects to undergo a PPA may only be determined upon submission of PCRs by the Programme ManagementDepartment (PMD) and the subsequent validation exercise (i.e. the preparation of PCR validations) by IOE.

GC 38/L.6
26
107. As mentioned earlier, IOE developed a selectivity framework in 2013 to promotetransparency and prioritize evaluations for inclusion in its annual evaluation workprogramme. The expanded selectivity framework (annex XXI) has therefore beenused as a basis for constructing the 2015 work programme. It is worth noting thatthe proposed evaluation activities are timely, as their results are expected to informfuture policy and strategy development as well as project design andimplementation.
108. In 2015, IOE will complete the CLE on IFAD’s engagement in fragile and conflict-affected states and situations, to be presented to the Evaluation Committee andthereafter to the Executive Board in April 2015. As requested by several MemberStates during the IFAD10 session in June and the Evaluation Committee sessions inJuly and October, and endorsed by the Board in September, IOE plans to start anew corporate-level evaluation in 2015 on IFAD’s performance-based allocationsystem (PBAS), which was introduced based on a decision taken during the IFAD6Consultation in 2002. The CLE on the PBAS will be completed in early 2016. OtherCLEs provisionally planned beyond 2015 are shown in the indicative plan for 2016-2017.
109. IOE plans to start five new CPEs. The main aim of CPEs is to assess the results andimpact of the partnership between IFAD and the Government in promotingsmallholder agriculture development and to provide building blocks for preparingnew or revising existing results-based COSOPs.14 The new CPEs will be conducted inBrazil, Ethiopia, India, Nigeria and Turkey. IOE will also complete the evaluationsstarted in 2014 in Bangladesh, the United Republic of Tanzania and The Gambia.The latter replaces the Sierra Leone CPE. After thorough consultation with IFADManagement, IOE decided to postpone the Sierra Leone CPE due to compellingcircumstances in the country, and instead conduct a new CPE in The Gambia.Though preparatory work will start in 2014 (e.g. preparation of approach paper,and desk reviews), the main mission for the CPE in The Gambia will be undertakenearly next year and the evaluation process will be completed by end-2015. In orderto accomplish this within the available resources, two of the CPEs planned in 2015will start later (in March rather than in January 2015) and the total resourceallocation for CPE work has been slightly increased.
110. In line with the IFAD Evaluation Policy and the role of independent evaluationoffices in other multilateral development organizations and as agreed with theBoard, IOE introduced impact evaluations in its 2013 work programme as a newproduct. Hence, one impact evaluation will be conducted in 2015 (project to bedetermined based on the selectivity framework). The planned impact evaluation willbuild on IOE’s experience in 2013 and 2014 with impact evaluations. It is importantto underline that impact evaluations by IOE are not part of the impact evaluationsbeing undertaken by Management during the IFAD9 period (2013-2015), and thatprojects selected by IOE for impact evaluations do not overlap with those selectedby Management.
111. The main aim of IOE’s involvement in impact evaluations is to assess impact in amore quantitative manner while also paying attention to qualitative aspects of IFADoperations, and generate the required evidence for CPEs and other higher-planeevaluations to be carried out by IOE in the near future. Moreover, these evaluationswill ensure that IOE is better placed to support IFAD Management in its own effortsto conduct impact evaluations. It will also allow for the preparation, in 2016 or soonthereafter, of a possible CLE on IFAD Management's overall approach to impactevaluations.
14 The selection of countries for CPEs is also driven by the timing of COSOPs – i.e. when a new COSOP is planned byManagement. Another determinant is the size of IFAD operations, which in turn also reflects the number of rural poorpeople in the selected country.

GC 38/L.6
27
112. In 2015, IOE will prepare three evaluation synthesis reports, which focus primarilyon generating lessons learned and good practices. The proposed topics for the threeevaluation synthesis are: (i) accessing markets: a subregional perspective;15
(ii) natural resources and environmental management; and (iii) non-lendingactivities in the context of South-South cooperation. Other synthesis reportstentatively planned for 2016-2017 are shown in annex XVII, table 2. On this topic,in order to allow evaluation lessons to feed into the decision-making process in amore effective way, IFAD Management has been requested henceforth to prepare awritten response to all synthesis reports prepared by IOE.
113. IOE will undertake project evaluations in the form of project completion reportvalidations (PCRVs)16 and project performance assessments of selectedoperations.17 Plans are being made to undertake one joint PPA with theIndependent Evaluation Department of the Asian Development Bank (ADB) of acofinanced project in Lao People’s Democratic Republic, which will be the first jointevaluation between IOE and the Independent Evaluation Department. With regardto synthesis reports, all future PPAs will also henceforth include a written responseby IFAD Management to the recommendations addressed to them. Therecommendations agreed by Management will be acted upon and theirimplementation status reported in the PRISMA, similar to the current practice forCLEs and CPEs.
114. IOE will complete and issue the second edition of the Evaluation Manual, which is amajor undertaking. The manual is fundamental to ensuring quality and consistencyacross all evaluations conducted by IOE. Moreover, the manual will contribute togenerating “value for money” for IOE, as it will lead to strengthened methodologiesfor better evaluations and will help streamline evaluation and internaladministrative processes.
115. In line with the IFAD Evaluation Policy and the practice of other internationalfinancial institutions, IOE will develop a new harmonization agreement18 with IFADManagement to ensure the full alignment of the IFAD’s independent and self-evaluation systems. In particular, special attention will be devoted to ensuring thatthe main elements of the second edition of the Evaluation Manual will beadequately reflected in the revised harmonization agreement.
116. IOE will prepare the 2015 edition of the ARRI, IOE’s flagship annual report.Moreover, IOE will: support recipient countries (selectively) in evaluation capacity-building activities; strengthen partnerships with Rome-based United Nationsagencies in evaluation; ensure outreach and timely dissemination of results andlessons to key audiences,19 and organize a series of activities to celebrate theInternational Year of Evaluation.20 The aim of the International Year of Evaluation isto, inter alia, draw the attention of the global development community to thecentral role of evaluation in development cooperation, and advocate and promote
15 IOE will closely engage with IFAD Management to determine which region or subregion will be covered by theproposed evaluation synthesis.16 In line with the provisions of the IFAD Evaluation Policy, IOE will continue to validate all PCRs, and conduct PPAs on25 to 30 per cent of closed projects in a given year.17 Projects for PPAs are selected by IOE, taking account of: (i) information gaps in PCRs; (ii) innovative approaches inprojects; (iii) information requirements for forthcoming CPEs or CLEs; (iv) geographical balance; and (v) opportunitiesfor scaling-up.18 The first such agreement was signed in 2006, and was updated in 2011.19 IOE uses a wide range of instruments and activities to ensure wider outreach at country level, including: (i) selectivelytranslating evaluation summaries into local languages; (ii) use of the local media and press briefings; and(iii) organization of national roundtable workshops and technical seminars, etc.20 At the Third International Conference on National Evaluation Capacities held in São Paulo, Brazil from 29 Septemberto 2 October 2013, EvalPartners – the global movement to strengthen national evaluation capacity – announced that2015 would be declared the International Year of Evaluation. The United Nations Evaluation Group, of which IOE is amember, and other international and regional evaluation networks and associations have joined EvalPartners and havealso adopted 2015 as the International Year of Evaluation.

GC 38/L.6
28
evaluation for evidence-based policy and strategy formulation and for programmedevelopment at international, regional, national and local levels.
117. Among the documents for presentation by IOE to the Evaluation Committee andExecutive Board are corporate-level evaluations, the ARRI, selected CPEs andcomments on the PRISMA and RIDE. In addition, it will also present the impactevaluation and the second edition of the Evaluation Manual to the EvaluationCommittee and write comments on new COSOPs that have been preceded by CPEsfor the consideration of the Executive Board. And, in line with the Evaluation Policy,IOE will review new corporate policies and strategies that are informed by majorCLEs and present written comments to the Evaluation Committee and ExecutiveBoard.
118. With regard to the latter, IOE will prepare written comments on the new IFADcorporate policy on grant financing, which is expected to be submitted to the Boardin 2015. These comments will be provided for review alongside the proposed newpolicy for consideration by the Committee and the Board.
119. In line with established practice,21 IOE will prepare written comments forconsideration by the Evaluation Committee and the Executive Board on thesynthesis report by IFAD Management on the impact evaluations to be deliveredduring the IFAD9 period. IOE comments will focus on the methodology and overallapproach taken and the robustness of the results reported. The comments will bediscussed by the Committee and the Board along with the final synthesis report.
120. IOE will support the Office of the Secretary in organizing all Evaluation Committeesessions during the year. In addition, as in 2014, IOE will participate in the annualcountry visit of the Executive Board in 2015 to Morocco. During the visit, IOE willmake a presentation to Board members on lessons learned from past independentevaluations undertaken in the country.
VI. 2015 Resource envelopeA. Staff resources121. IOE’s staff requirements are based on a comprehensive strategic workforce
planning exercise, which is undertaken on an annual basis. Building on the dialogueestablished last year, IOE has consulted with BOD to ensure that the methodologyused by IOE is the same as that used for the IFAD strategic workforce planningexercise. The assessment of the 2015 work programme indicates that IOE shouldbe in a position to deliver all planned activities in a timely manner with its currentnumber of staff. Therefore, IOE will maintain the same number of staff in 2015 asin 2014 (see annex XVIII). It is worth underlining that the ratio of Professional toGeneral Service staff in IOE is around 1:0.46, which is among the best for anydivision in IFAD.
122. An increase of a 0.5 staff year is being considered for 2015. That is, the EvaluationKnowledge and Communication Officer (P-2) will be converted from a part-time to afull-time position,22 starting 1 January 2015. This will result in a slight increase inIOE staff costs. The conversion of the position to a full-time equivalent is consistentwith IOE’s second strategic objective,23 agreed with the Board, to devote greaterattention and resources to strengthening dissemination of evaluation-basedknowledge and enhancing the internal evaluation learning and feedback loop forbetter institutional and operational performance.
21 For example, in line with the IFAD Evaluation Policy and the Terms of Reference of the Evaluation Committee, IOEprepares written comments annually on the RIDE.22 It is to be noted that this position used to be a full-time equivalent until 2005, but was converted into part-time toaccommodate a request by the staff member due to compelling personal reasons.23 Promote effective learning and knowledge management to further strengthen the performance of IFAD operations.

GC 38/L.6
29
B. Budget proposal123. This section outlines IOE budget requirements. The proposed budget is presented
by type of activity, category of expenditure and strategic objective (see tables 3-5).Each table includes both the 2014 approved budget and the proposed budget for2015, facilitating comparison between the two years.
124. Cost drivers. The primary cost drivers for the 2015 budget are: (i) the effect ofinflation on non-staff costs; and (ii) increased travel costs due to price increasebeyond average inflation assumptions.
125. Assumptions. As in the past, the parameters used in developing the proposed2015 budget are the same as those used by Management for developing the IFADadministrative budget for 2015. These include: (i) an average inflation rate of 1.9per cent for non-staff costs; (ii) no increase in salaries of Professional and GeneralService staff anticipated for 2015 and therefore the same 2014 standard costsadjusted for euro/dollar exchange rate has been used; and (iii) the exchange ratefor 2015 is US$1 = EUR 0.735 – based on the average exchange rate since January2014.
126. Budget by type of activity. As per table 3, US$1.40 million of total non-staffcosts of US$2.46 million, or more than 50 per cent of non-staff costs, are allocatedto higher-plane evaluations (CLEs and CPEs). These evaluations have the potentialto induce far-reaching and systemic changes at the institutional level as well as inIFAD-supported country programmes. In particular, in order to inform thedevelopment of new COSOPs and feed into COSOP midterm reviews, IOE will carryout one new CPE in each of the five geographic regions covered by IFAD operations.This will require a higher allocation for CPEs in 2015 as compared to 2014, whichincluded some CPE completions (started in 2013) requiring fewer resources thannew CPEs. To clarify further, each CPE normally takes from 12 to 16 months tocomplete from start to end, and in 2014, IOE focused on completing a number ofCPEs initiated in 2013. As such, and given the time needed to complete a CPE,similar fluctuations in the CPE budget line are likely to occur from time to time.
127. A small allocation has been made in 2015 for the Evaluation Manual. This isnecessary because IOE has deferred the finalization of the manual to next year toallow the new IOE Director to provide his input to this fundamental cross-divisionalproduct. The amount allocated will cover the cost of completing the document, itsediting and translation, as well as outreach and dissemination. Any savings fromthe original 2014 allocation for the Evaluation Manual have been used to undertakeadditional unforeseen activities during 2014 (e.g. evaluation synthesis report onindigenous peoples). The reduction in the ARRI budget allocation for 2015, ascompared to 2014, is due to IOE’s efforts to cut costs by insourcing part of theARRI work.
128. The net effect is a slight increase in non-staff costs for 2015 compared to 2014. Theincrease in staff costs is due to the conversion of the P-2 position from part-time tofull-time, as mentioned in paragraph 122 above.

GC 38/L.6
30
Table 3Proposed budget for 2015 (by type of activity)(See annex XIX, table 2 for more detail)
Type of activities
Approved2014
budget
Absolutenumber
2014
Level ofeffort 2014
Proposed2015
budget
Absolutenumber
2015
Level ofeffort 2015
ARRI 150 000 1 1 100 000 1 1
CLEs 410 000 2 1 370 000 2 1
CPEs 760 000 7 3.3 1 035 000 8 4.5
PCRVs 50 000 30 30 50 000 30 30
PPAs 230 000 8 8 230 000 8 8
Impact evaluation 210 000 1 1 200 000 2 1
Evaluationsyntheses
120 000 2 2 120 000 3 3
Second edition ofEvaluation Manual
150 000 1 1 40 000 1 0.3
Communication,outreach,knowledge-sharing,partnership activities
198 000 - - 188 000 - -
Evaluation capacitydevelopment,training and relatedadministrative costs
117 992 - - 122 892 - -
Total non-staffcosts 2 395 992 2 455 892
Total staff costs 3 586 690 3 614 041
Total 5 982 682 6 069 933
Notes: The level of effort represents the time that will be allocated – as a proportion of total time taken -to the respective evaluations in any given year.The level of effort columns for 2014/2015 include estimated figures at the time of approval of theIOE work programme.The absolute numbers of CLEs, CPEs and impact evaluations do not correspond to the same levelof effort every year. This is because these evaluations may be started at different times of theyear (and not on 1 January) and completed in the subsequent year.
129. Budget by category of expenditure. Table 4 shows how the proposed non-staffbudget is allocated by category of expenditure. On the whole, there are minordifferences in budget allocation in 2015 compared to 2014, with over 60 per cent ofnon-staff budget allocated to consultancy fees to support evaluation work. Withregard to consultants, IOE is continuing its efforts to ensure adequate gender andregional diversity across all evaluation types. Moreover, preference is given tohiring consultants from the same country or region where an evaluation is planned,especially for PPAs and CPEs, or when country visits might be undertaken in thecontext of CLEs and the preparation of evaluation synthesis reports.24 The increasesin staff and consultant travel reflect the net effect of increases in travel costs, partlyoffset by savings generated by more stringent monitoring of travel expenses. Inthis regard, it is worth noting that IOE staff and consultants follow the same travelrules and procedures as applicable to all IFAD staff and consultants. As in 2014, asmall increase in allocation is proposed for staff training, which is essential forcontinuous professional development to ensure IOE has the required expertise toundertake, inter alia, impact evaluations and to support ECD in partner countries.The slight increase in the staff cost category is explained in paragraph 128.
24 IOE has a coherent conflict of interest policy for consultants. National consultants are required to adhere to the sameprovisions and standards as international and regional consultants.
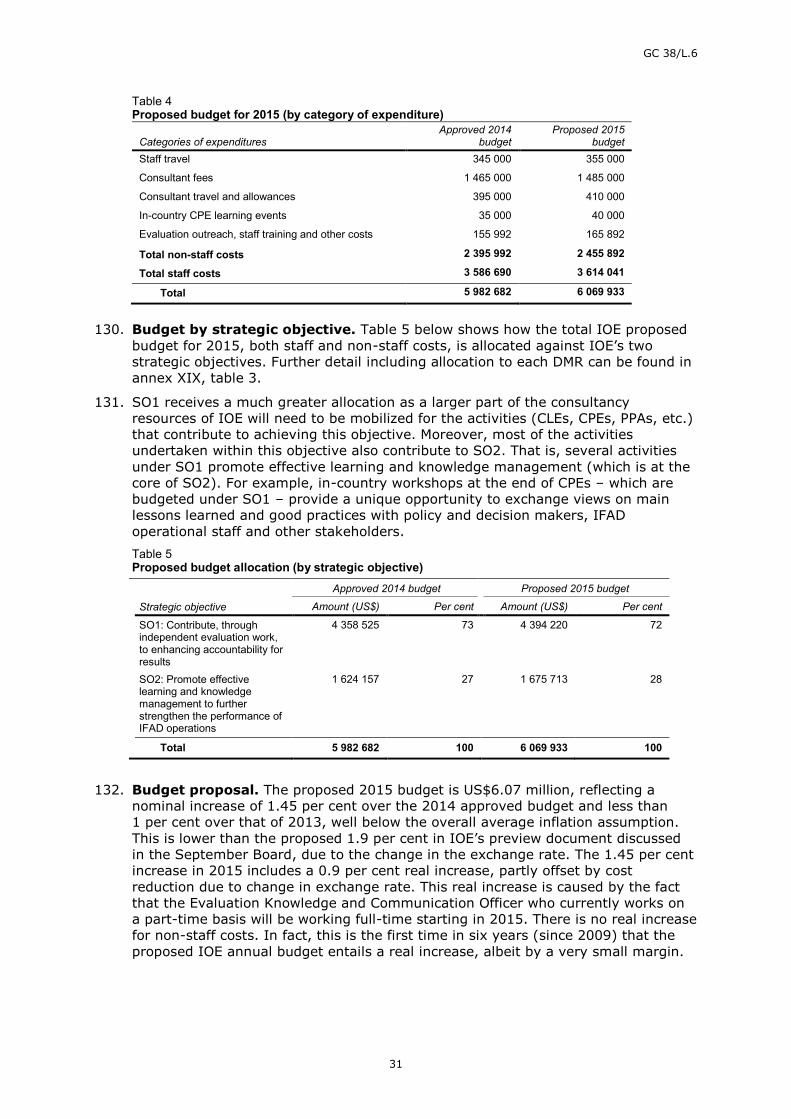
GC 38/L.6
31
Table 4Proposed budget for 2015 (by category of expenditure)
Categories of expendituresApproved 2014
budgetProposed 2015
budgetStaff travel 345 000 355 000
Consultant fees 1 465 000 1 485 000
Consultant travel and allowances 395 000 410 000
In-country CPE learning events 35 000 40 000
Evaluation outreach, staff training and other costs 155 992 165 892
Total non-staff costs 2 395 992 2 455 892
Total staff costs 3 586 690 3 614 041
Total 5 982 682 6 069 933
130. Budget by strategic objective. Table 5 below shows how the total IOE proposedbudget for 2015, both staff and non-staff costs, is allocated against IOE’s twostrategic objectives. Further detail including allocation to each DMR can be found inannex XIX, table 3.
131. SO1 receives a much greater allocation as a larger part of the consultancyresources of IOE will need to be mobilized for the activities (CLEs, CPEs, PPAs, etc.)that contribute to achieving this objective. Moreover, most of the activitiesundertaken within this objective also contribute to SO2. That is, several activitiesunder SO1 promote effective learning and knowledge management (which is at thecore of SO2). For example, in-country workshops at the end of CPEs – which arebudgeted under SO1 – provide a unique opportunity to exchange views on mainlessons learned and good practices with policy and decision makers, IFADoperational staff and other stakeholders.Table 5Proposed budget allocation (by strategic objective)
Strategic objective
Approved 2014 budget Proposed 2015 budget
Amount (US$) Per cent Amount (US$) Per cent
SO1: Contribute, throughindependent evaluation work,to enhancing accountability forresults
4 358 525 73 4 394 220 72
SO2: Promote effectivelearning and knowledgemanagement to furtherstrengthen the performance ofIFAD operations
1 624 157 27 1 675 713 28
Total 5 982 682 100 6 069 933 100
132. Budget proposal. The proposed 2015 budget is US$6.07 million, reflecting anominal increase of 1.45 per cent over the 2014 approved budget and less than1 per cent over that of 2013, well below the overall average inflation assumption.This is lower than the proposed 1.9 per cent in IOE’s preview document discussedin the September Board, due to the change in the exchange rate. The 1.45 per centincrease in 2015 includes a 0.9 per cent real increase, partly offset by costreduction due to change in exchange rate. This real increase is caused by the factthat the Evaluation Knowledge and Communication Officer who currently works ona part-time basis will be working full-time starting in 2015. There is no real increasefor non-staff costs. In fact, this is the first time in six years (since 2009) that theproposed IOE annual budget entails a real increase, albeit by a very small margin.
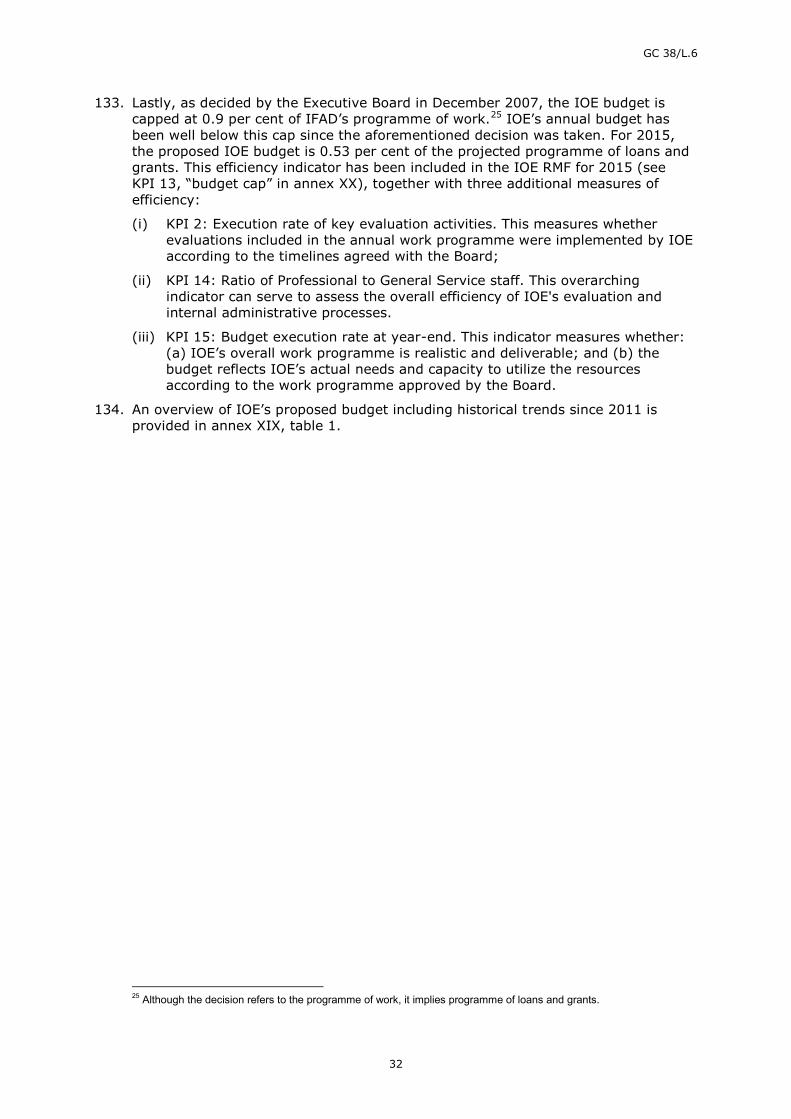
GC 38/L.6
32
133. Lastly, as decided by the Executive Board in December 2007, the IOE budget iscapped at 0.9 per cent of IFAD’s programme of work.25 IOE’s annual budget hasbeen well below this cap since the aforementioned decision was taken. For 2015,the proposed IOE budget is 0.53 per cent of the projected programme of loans andgrants. This efficiency indicator has been included in the IOE RMF for 2015 (seeKPI 13, “budget cap” in annex XX), together with three additional measures ofefficiency:
(i) KPI 2: Execution rate of key evaluation activities. This measures whetherevaluations included in the annual work programme were implemented by IOEaccording to the timelines agreed with the Board;
(ii) KPI 14: Ratio of Professional to General Service staff. This overarchingindicator can serve to assess the overall efficiency of IOE's evaluation andinternal administrative processes.
(iii) KPI 15: Budget execution rate at year-end. This indicator measures whether:(a) IOE’s overall work programme is realistic and deliverable; and (b) thebudget reflects IOE’s actual needs and capacity to utilize the resourcesaccording to the work programme approved by the Board.
134. An overview of IOE’s proposed budget including historical trends since 2011 isprovided in annex XIX, table 1.
25 Although the decision refers to the programme of work, it implies programme of loans and grants.

GC 38/L.6
33
Part three – Heavily Indebted Poor Countries DebtInitiative progress report for 2014
I. Introduction135. The objective of this progress report for 2014 is to:
Inform the Executive Board of the status of implementation of the HeavilyIndebted Poor Countries (HIPC) Debt Initiative and of IFAD’s participation inthe Initiative; and
Seek Executive Board approval for submitting the substance of this progressreport to the forthcoming session of the Governing Council for information.
II. Progress in HIPC Debt Initiative implementation136. Substantial progress has been made in the implementation of HIPC debt relief since
the Initiative’s inception. Nearly 93 per cent of eligible countries (35 out of 39) havereached the decision point and qualified for HIPC assistance. Thirty-four countrieshave now reached the completion point and one is in the interim period betweenthe decision and completion points (see table below). The pace at which countriesin the interim period reach their completion points has accelerated over the pastfour years as countries have made progress in implementing their macroeconomicprogrammes and poverty reduction strategies.
137. Maintaining debt sustainability beyond completion point remains a concern,particularly during the current financial crisis. Debt sustainability analyses confirmthat post-completion point countries are in a better debt situation than other HIPCsand non-HIPCs. But their debt sustainability outlook remains vulnerable to shocksand is highly sensitive to the terms of new financing. Only about 40 per cent ofpost-completion point HIPCs currently have a low risk of debt distress according tothe most recent debt sustainability analyses; and the number with a high risk ratingis increasing. This highlights the need for post-completion point HIPCs to implementsound borrowing policies and strengthen their public debt management capacity.Efforts continue to monitor debt relief provided by all multilateral creditors thathave committed to participating in the HIPC Initiative. According to the latestannual survey carried out by the World Bank, IFAD continues to support suchefforts through its participation in the Debt Sustainability Framework, reporting ofall debt information, and liaison with the World Bank and regional developmentbanks.
III. Total cost of the HIPC Debt Initiative to IFAD138. The total NPV cost of the Fund’s participation in the overall HIPC Debt Initiative26 is
currently estimated at SDR 310.4 million (equivalent to approximatelyUS$460.8 million), which corresponds to an approximate nominal cost ofSDR 475.3 million (about US$705.7 million).27 The current cost estimates mayincrease if there are any further delays in the remaining countries reaching decisionand completion points, changes in economic conditions or continuing low discountrates. Total debt relief payments are estimated at US$28.7 million for 2014.
IV. IFAD commitments to date139. To date, IFAD has committed the required debt relief to all 35 HIPCs having reached
the decision point. IFAD’s total commitments so far amount to SDR 247.15 million(approximately US$366.90 million) in NPV terms, which amounts to
26 IFAD participation comprises all eligible HIPC Debt Initiative countries, including pre-decision point countries thathave confirmed their participation in the Initiative.27 Base estimates at exchange rates prevailing on 30 September 2014.

GC 38/L.6
34
SDR 375.90 million (approximately US$558.10 million) of debt service relief innominal terms.
V. Debt relief provided140. As at 30 September 2014, IFAD has provided US$437.1 million in debt relief to the
34 completion point countries.IFAD Member States participating in the HIPC Debt Initiative, by stage
Completion point countries (34) Decision point countries (1) Pre-decision point countries (3)
Benin Chad EritreaBolivia (Plurinational State of) SomaliaBurkina Faso SudanBurundiCameroonCentral African RepublicComorosCongoCôte d’IvoireDemocratic Republic of the CongoEthiopiaGambia (The)GhanaGuineaGuinea-BissauGuyanaHaitiHondurasLiberiaMadagascarMalawiMaliMauritaniaMozambiqueNicaraguaNigerRwandaSao Tome and PrincipeSenegalSierra LeoneTogoUgandaUnited Republic of TanzaniaZambia
VI. Financing debt relief141. IFAD funds its participation in the HIPC Debt Initiative with external contributions
(either paid directly to IFAD or transferred through the HIPC Trust Fundadministered by the World Bank) and its own resources. External contributions(paid or pledged) amount to about US$282.4 million (61.1 per cent), andcontributions from IFAD’s own resources amount to about US$171.7 million(37.2 per cent) for transfers in 1998, 1999 and 2002 approved by the ExecutiveBoard and further transfers in 2007, 2010, 2012, 2013 and 2014. The remainderhas been covered by investment income from the IFAD HIPC Trust Fund balance; asat end-September 2014, the interest balance in IFAD’s HIPC Trust Fund stood atUS$8.0 million.
142. To mitigate the impact of debt relief on resources available for commitment to newloans and grants, Member States have supported IFAD’s formal access to the HIPCTrust Fund administered by the World Bank. This was agreed at the HIPCinformation and funding meeting held on 19 November 2006 in Washington, D.C.,recognizing that it would add to the overall financing requirements of the HIPCTrust Fund. The first transfer from the HIPC Trust Fund (US$104.1 million),following signature of the grant agreement, was received by IFAD in October 2007.

GC 38/L.6
35
Further grant agreements followed in May 2009, January and December 2011, andin September 2013 bringing the total received to date to US$210.9 million.
143. While giving priority to ensuring that the HIPC Trust Fund is adequately financed,Management will also continue to encourage IFAD’s Member States to provide theFund with additional resources directly to help finance its participation in the HIPCInitiative.
GC 38/L.6
36
Part four – Progress report on implementation of theperformance-based allocation system
I. Application of the PBAS in 2014144. In 2014, the second year of the 2013-2015 allocation period, which is aligned with
the Ninth Replenishment period, PBAS allocations have been made to 98 MemberStates based on project activities planned by regional divisions under COSOPs. Tobetter manage allocations over the three-year period, countries that are expectedto use only part of their potential allocation have been capped at the projectedfinancing level. This should reduce the need for reallocations in 2015 and hasprovided better planning parameters for other countries.
145. On this basis, following the PBAS methodology, final scores – based on the 2013country scores – were provided for 2014 together with an overall country allocationfor the three-year allocation period. With the move to uniform allocations, the datahave been subject to interregional review and benchmarking to ensure consistencyin assessments and, as a result, improvements have been made in the scoringapproach for rural sector performance assessment indicators.
146. In May 2014, IFAD attended the multilateral development bank working group onperformance-based allocation hosted by the Caribbean Development Bank.
II. Updating of 2014 country scores and 2013-2015country allocations
147. During the fourth quarter of 2014, updated data on portfolio and rural sectorperformance became available and the process of updating country scores for 2014began. The updated data are reflected in the final 2014 country scores and 2013-2015 country allocations, tabled at the December session of the Executive Boardincluded herein as annex XXIII and disclosed on the IFAD website(www.ifad.org/operations/pbas) in accordance with the procedures agreed fordisclosure of PBAS information. As in the previous allocation period, the allocationsprovided for 2013, 2014 and 2015 are now the final allocations.
148. Annex XXIV presents details of the rural development sector performanceassessments for 2014, in line with the criteria for such assessments set out indocument EB 2003/80/R.3. These assessments form the basis for the rural sectorperformance score in the total performance rating used for the country score andcountry allocation.
149. Annex XXV contains the Debt Sustainability Framework classification for 2015.
GC 38/L.6
37
Part five – Recommendations150. In accordance with article 7, section 2(b) of the Agreement Establishing IFAD, it is
recommended that the Executive Board:
Approve the programme of work for 2015 at a level of SDR 793 million(US$1,210 million), which comprises a lending programme of SDR 760 million(US$1,160 million) and a gross grant programme of US$50 million. It isproposed that the programme of work be approved at this level for planningpurposes and adjusted as needed during 2015 in accordance with availableresources.
151. In accordance with article 6, section 10 of the Agreement Establishing IFAD andregulation VI of the Financial Regulations of IFAD, it is recommended that theExecutive Board:
Transmit to the thirty-eighth session of the Governing Council theadministrative budget comprising of, first, the regular budget of IFAD for 2015in the amount of US$151.59 million; second, the capital budget of IFAD for2015 in the amount of US$2.69 million; and third, the budget of theIndependent Office of Evaluation of IFAD for 2015 in the amount ofUS$6.07 million.
152. It is recommended that the Executive Board submit the substance of the progressreport on IFAD’s participation in the Heavily Indebted Poor Countries Debt Initiativeto the thirty-eighth session of the Governing Council for information.
153. It is recommended that the Executive Board submit a progress report onimplementation of the performance-based allocation system to the thirty-eighthsession of the Governing Council in 2015, based on the report provided in part fourof the present document and its addendum containing the 2014 country scores and2013-2015 allocations.
GC 38/L.6
38
Draft resolution .../XXXVIII
Administrative budget comprising the regular, capital and one-time budgets ofIFAD for 2015 and the budget of the Independent Office of Evaluation of IFADfor 2015
The Governing Council of IFAD,
Bearing in mind article 6.10 of the Agreement Establishing IFAD and regulation VI ofthe Financial Regulations of IFAD;
Noting that, at its 113th session, the Executive Board reviewed and agreed upon aprogramme of work of IFAD for 2015 at a level of SDR 793 million (US$1,210 million),which comprises a lending programme of SDR 760 million (US$1,160 million) and a grossgrant programme of US$50 million;
Having considered the review of the 113th session of the Executive Board concerningthe proposed regular and capital budgets of IFAD for 2015 and the budget of theIndependent Office of Evaluation of IFAD for 2015;
Approves the administrative budget, comprising: firstly, the regular budget of IFAD for2015 in the amount of US$151.59 million; secondly, the capital budget of IFAD for 2015in the amount of US$2.69 million; and thirdly, the budget of the Independent Office ofEvaluation of IFAD for 2015 in the amount of US$6.07 million, as set forth in documentGC 38/XX, determined on the basis of a rate of exchange of EUR 0.735:US$1.00; and
Determines that in the event the average value of the United States dollar in 2015should change against the euro rate of exchange used to calculate the budget, the totalUnited States dollar equivalent of the euro expenditures in the budget shall be adjustedin the proportion that the actual exchange rate in 2015 bears to the budget exchangerate.
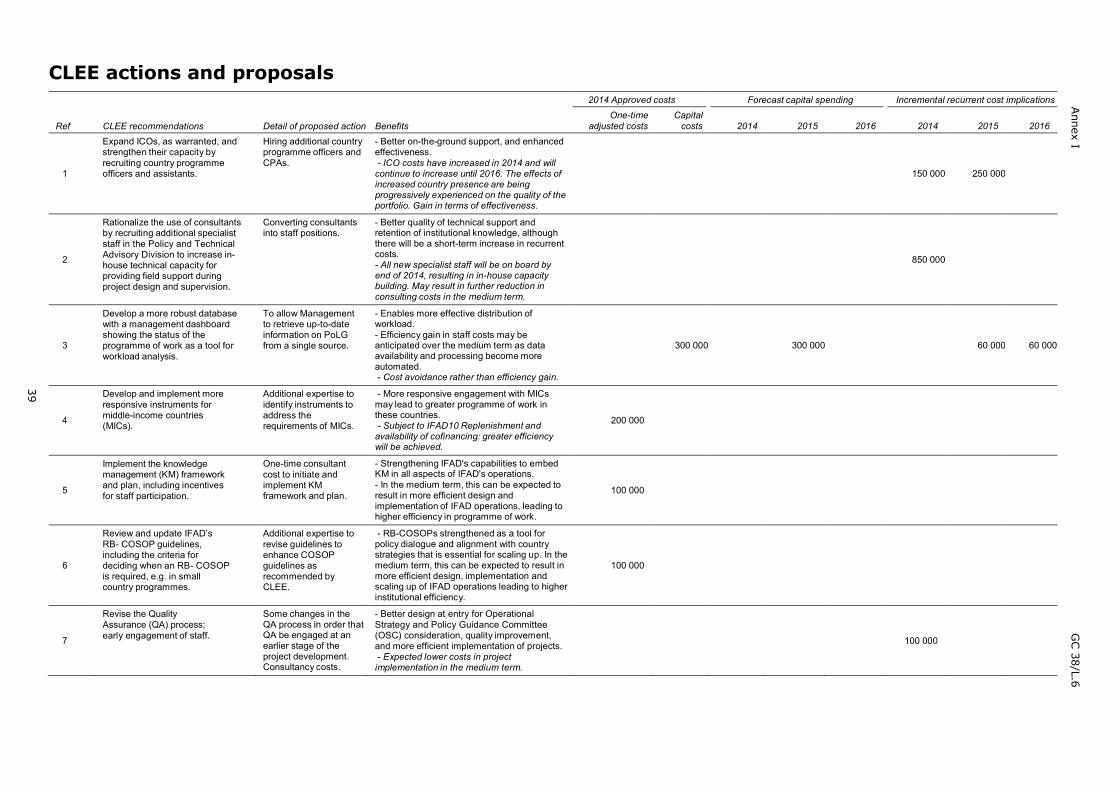
39
Annex I
GC 38/L.6
CLEE actions and proposals
Ref CLEE recommendations Detail of proposed action Benefits
2014 Approved costs Forecast capital spending Incremental recurrent cost implications
One-timeadjusted costs
Capitalcosts 2014 2015 2016 2014 2015 2016
1
Expand ICOs, as warranted, andstrengthen their capacity byrecruiting country programmeofficers and assistants.
Hiring additional countryprogramme officers andCPAs.
- Better on-the-ground support, and enhancedeffectiveness.- ICO costs have increased in 2014 and willcontinue to increase until 2016. The effects ofincreased country presence are beingprogressively experienced on the quality of theportfolio. Gain in terms of effectiveness.
150 000 250 000
2
Rationalize the use of consultantsby recruiting additional specialiststaff in the Policy and TechnicalAdvisory Division to increase in-house technical capacity forproviding field support duringproject design and supervision.
Converting consultantsinto staff positions.
- Better quality of technical support andretention of institutional knowledge, althoughthere will be a short-term increase in recurrentcosts.- All new specialist staff will be on board byend of 2014, resulting in in-house capacitybuilding. May result in further reduction inconsulting costs in the medium term.
850 000
3
Develop a more robust databasewith a management dashboardshowing the status of theprogramme of work as a tool forworkload analysis.
To allow Managementto retrieve up-to-dateinformation on PoLGfrom a single source.
- Enables more effective distribution ofworkload.- Efficiency gain in staff costs may beanticipated over the medium term as dataavailability and processing become moreautomated.- Cost avoidance rather than efficiency gain.
300 000 300 000 60 000 60 000
4
Develop and implement moreresponsive instruments formiddle-income countries(MICs).
Additional expertise toidentify instruments toaddress therequirements of MICs.
- More responsive engagement with MICsmay lead to greater programme of work inthese countries.- Subject to IFAD10 Replenishment andavailability of cofinancing: greater efficiencywill be achieved.
200 000
5
Implement the knowledgemanagement (KM) frameworkand plan, including incentivesfor staff participation.
One-time consultantcost to initiate andimplement KMframework and plan.
- Strengthening IFAD's capabilities to embedKM in all aspects of IFAD's operations.- In the medium term, this can be expected toresult in more efficient design andimplementation of IFAD operations, leading tohigher efficiency in programme of work.
100 000
6
Review and update IFAD’sRB- COSOP guidelines,including the criteria fordeciding when an RB- COSOPis required, e.g. in smallcountry programmes.
Additional expertise torevise guidelines toenhance COSOPguidelines asrecommended byCLEE.
- RB-COSOPs strengthened as a tool forpolicy dialogue and alignment with countrystrategies that is essential for scaling up. In themedium term, this can be expected to result inmore efficient design, implementation andscaling up of IFAD operations leading to higherinstitutional efficiency.
100 000
7
Revise the QualityAssurance (QA) process;early engagement of staff.
Some changes in theQA process in order thatQA be engaged at anearlier stage of theproject development.Consultancy costs.
- Better design at entry for OperationalStrategy and Policy Guidance Committee(OSC) consideration, quality improvement,and more efficient implementation of projects.- Expected lower costs in projectimplementation in the medium term.
100 000

Annex I
GC 38/L.6
40
Ref CLEE recommendations Detail of proposed action Benefits
2014 Approved costs Forecast capital spending Incremental recurrent cost implications
One-timeadjusted costs Capital costs 2014 2015 2016 2014 2015 2016
8
Intensify staff training programmes inproject supervision, financialmanagement, etc.
CPM, ICO and FM stafftraining.
- Better skilled workforce and improvedprogramme delivery.- Additional training programmes have beenput in place and improvement in effectivenessis anticipated.
300 000
9
Prepare and submit for Boardapproval a review of IFAD’s countrypresence policy and strategy.
- Initial cost ofdecentralizing ICOadministrative supportservices for existing andfuture ICO sites.- Upgrading andestablishing new officesbased on countrypresence policy andstrategy.
- Support in the field strengthened and workongoing to upgrade 7 existing offices in 2014and 2015, and 3 new offices in 2015.- Improvement in IFAD’s operationaleffectiveness is expected owing to increasedcountry presence, but additional costs will beincurred.
1 500 000
10
Review and change key businessprocesses to enhance efficiency.
Consultant to reviewIFAD's businessprocesses to identifyefficiencies.
- Streamlined process will result in efficiencygains in the medium term as processes that arestaff-time intensive become more automatedand less costly.
200 000
11
Integrate the core IT platforms(Oracle-PeopleSoft ERP, Agile OpenSource and Microsoft).
System integration –consultancy support forIT development.
- Improved access to information to strengthenthe management decision-making process.- Project in process.- More efficient use of staff resourcesanticipated, resulting in cost avoidance.
200 000 130 000 70 000 20 000 15 000
12
Upgrade IFAD’s software systems toenable more effective and efficientadministrative support of ICOs.
Implement ITenvironment to allow forfull integration of ICOswithin PeopleSoft.
- Support to ICOs enabling more efficient andeffective delivery of IFAD programmes as partof decentralization.- Cost savings are anticipated as staffing atheadquarters is reduced in the medium term.
760 000 380 000 380 000 138 000 138 000
13
Implement ICT systems to supportIFAD’s operational monitoring andevaluation processes.
Monitoring and evaluationsystems implemented.
- Better IT support for operational area andimproved delivery enabling a more efficient andeffective delivery of IFAD programmes.- Qualitative improvements with no monetarybenefits anticipated.
700 000 320 000 380 000 82 000 120 000
14
Implement mobile technologies toallow access to IFAD systems on themove via a range of devices includingsmartphones and tablets.
Mobile technologiesimplemented.
- Enables staff to access informationirrespective of location and regardless of ITplatform, thus reducing the cost of access andimproving their own effectiveness.- Reduction in access and bandwidth costsrealized as well as cost avoidance in priceincreases.
100 000 100 000 40 000
15
Develop business intelligencesolutions to provide relevantmanagement information to supportbusiness decisions.
Business Intelligencesolutions implemented.
- More efficient use of staff time enabling itsallocation to programme delivery.- Faster and more efficient decision-making,with possible efficiency gains in the mediumterm.
375 000 125 000 250 000 250 000 50 000
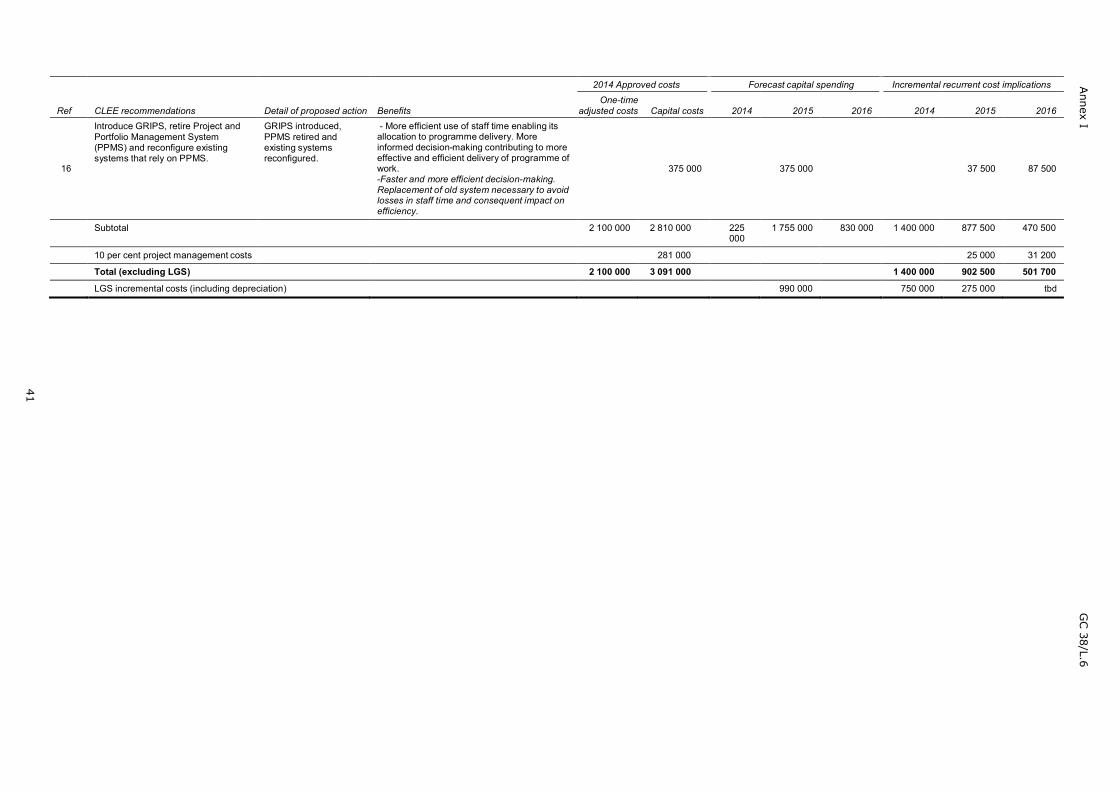
Annex I
GC 38/L.6
41
Ref CLEE recommendations Detail of proposed action Benefits
2014 Approved costs Forecast capital spending Incremental recurrent cost implications
One-timeadjusted costs Capital costs 2014 2015 2016 2014 2015 2016
16
Introduce GRIPS, retire Project andPortfolio Management System(PPMS) and reconfigure existingsystems that rely on PPMS.
GRIPS introduced,PPMS retired andexisting systemsreconfigured.
- More efficient use of staff time enabling itsallocation to programme delivery. Moreinformed decision-making contributing to moreeffective and efficient delivery of programme ofwork.-Faster and more efficient decision-making.Replacement of old system necessary to avoidlosses in staff time and consequent impact onefficiency.
375 000 375 000 37 500 87 500
Subtotal 2 100 000 2 810 000 225000
1 755 000 830 000 1 400 000 877 500 470 500
10 per cent project management costs 281 000 25 000 31 200
Total (excluding LGS) 2 100 000 3 091 000 1 400 000 902 500 501 700
LGS incremental costs (including depreciation) 990 000 750 000 275 000 tbd
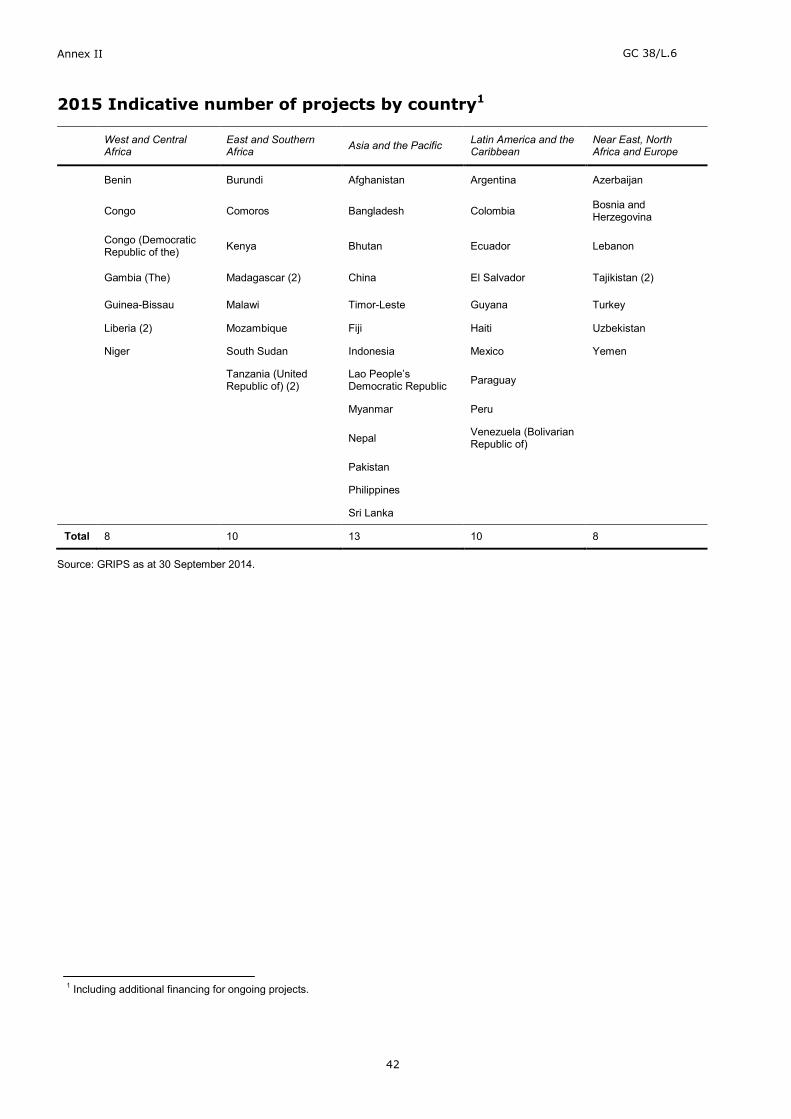
Annex II GC 38/L.6
42
2015 Indicative number of projects by country1
West and CentralAfrica
East and SouthernAfrica Asia and the Pacific Latin America and the
CaribbeanNear East, NorthAfrica and Europe
Benin Burundi Afghanistan Argentina Azerbaijan
Congo Comoros Bangladesh Colombia Bosnia andHerzegovina
Congo (DemocraticRepublic of the) Kenya Bhutan Ecuador Lebanon
Gambia (The) Madagascar (2) China El Salvador Tajikistan (2)
Guinea-Bissau Malawi Timor-Leste Guyana Turkey
Liberia (2) Mozambique Fiji Haiti Uzbekistan
Niger South Sudan Indonesia Mexico Yemen
Tanzania (UnitedRepublic of) (2)
Lao People’sDemocratic Republic Paraguay
Myanmar Peru
Nepal Venezuela (BolivarianRepublic of)
Pakistan
Philippines
Sri Lanka
Total 8 10 13 10 8
Source: GRIPS as at 30 September 2014.
1 Including additional financing for ongoing projects.

Annex III
GC 38/L.6
43
2013 2013Budget Actual Change
2013 2013Budget Actual Change
2013 2013Budget Actual Change
2013 2013Budget Actual Change
2013 2013Budget Actual Change
Office of the President and the Vice-President 0 0.21
Corporate Services Support Group 3.91 3.34
Partnership and Resource MobilizationOffice 0.17 0.13
Strategy and KnowledgeDepartment 2.92 2.26
Programme Management Department 70.32 65.80
Financial Operations Department 5.42 4.87
Corporate Services Department 1.18 1.71
Corporate costs (allocated to clusters) 1.18 1.15
Corporate costs (not allocated to clusters)
0.21
(0.57)
(0.04)
(0.66)
(4.52)
(0.55)
0.53
(0.03)
1.37 1.13
3.23 2.98
3.35 2.65
1.86 1.56
2.25 2.12
0.06 0.04
0.12 0.16
0.32 0.16
(0.24)
(0.25)
(0.70)
(0.30)
(0.13)
(0.02)
0.04
(0.16)
1.10 0.93
2.99 2.69
0.34 0.20
1.49 1.09
0 0.22
5.08 4.36
23.30 25.50
0.60 0.51
(0.17)
(0.30)
(0.14)
(0.40)
0.22
(0.72)
2.20
(0.09)
0.27 0.21
7.34 6.07
0.22 0.17
0.05 0.06
0 0.05
0.11 0.09
0.43 0.29
0.20 0.10
(0.06)
(1.27)
(0.05)
0.01
0.05
(0.02)
(0.14)
(0.10)
2.74 2.48
17.47 15.08
4.08 3.15
6.32 4.97
72.57 68.19
10.67 9.36
25.03 27.66
2.30 1.92
2.96 6.28
(0.26)
(2.39)
(0.93)
(1.35)
(4.38)
(1.31)
2.63
(0.38)
3.32
Total 85.10 79.47 (5.63) 12.56 10.80 (1.76) 34.90 35.50 0.60 8.62 7.04 (1.58) 144.14 139.09 (5.05)
Regular budget by cluster and department – 2013 actual versus budget(Millions of United States dollars)
Cluster 1 Cluster 2 Cluster 3 Cluster 4 Total
Department
Cluster per cent (budget vs actual) 59.0 57.1 8.7 7.8 24.2 25.5 6.0 5.1

Annex IV
GC 38/L.6
44
2014 2014Budget Forecast Change
2014 2014Budget Forecast Change
2014 2014Budget Forecast Change
2014 2014Budget Forecast Change
2014 2014Budget Forecast Change
Office of the President and the Vice-President 0.08 0.22
Corporate Services Support Group 3.41 3.63
Partnership and Resource Mobilization Office 0.01 0.01
Strategy and Knowledge Department 3.54 3.28
Programme Management Department 71.52 69.89
Financial Operations Department 5.43 4.83
Corporate Services Department 2.01 1.59
Corporate costs (allocated to clusters) 1.73 1.60
Corporate cost centre (not allocated to clusters) 0 0
0.14
0.22
-
(0.26)
(1.63)
(0.60)
(0.42)
(0.13)
0
1.22 1.04
2.93 2.94
3.91 3.48
1.71 1.66
2.03 2.01
0.17 0.14
0.11 0.12
0.16 0.12
0 0
(0.18)
0.01
(0.43)
(0.05)
(0.02)
(0.03)
0.01
(0.04)
0
1.00 0.90
4.25 4.24
0.22 0.24
1.26 1.06
0 0.31
4.52 4.64
25.81 25.93
0.41 0.35
0 0
(0.10)
(0.01)
0.02
(0.20)
0.31
0.12
0.12
(0.06)
0
0.47 0.42
7.59 6.82
0 0.18
0.09 0.11
0.02 0.02
0.06 0.06
0.41 0.34
0.08 0.07
0 0
(0.05)
(0.77)
0.18
0.02
0
0
(0.07)
(0.01)
0
2.77 2.58
18.18 17.63
4.14 3.91
6.60 6.11
73.57 72.23
10.18 9.67
28.34 27.98
2.38 2.14
3.48 3.50
(0.19)
(0.55)
(0.23)
(0.49)
(1.34)
(0.51)
(0.36)
(0.24)
0.02
Total 87.73 85.05 (2.68) 12.24 11.51 (0.73) 37.47 37.67 0.20 8.72 8.02 (0.70) 149.64 145.75 (3.89)
Regular budget by cluster and department – 2014 budget versus forecast(Millions of United States dollars)
Cluster 1 Cluster 2 Cluster 3 Cluster 4 Total
Department
Cluster per cent (budget vs. forecast) 58.6 58.4 8.2 7.9 25.0 25.8 5.8 5.5
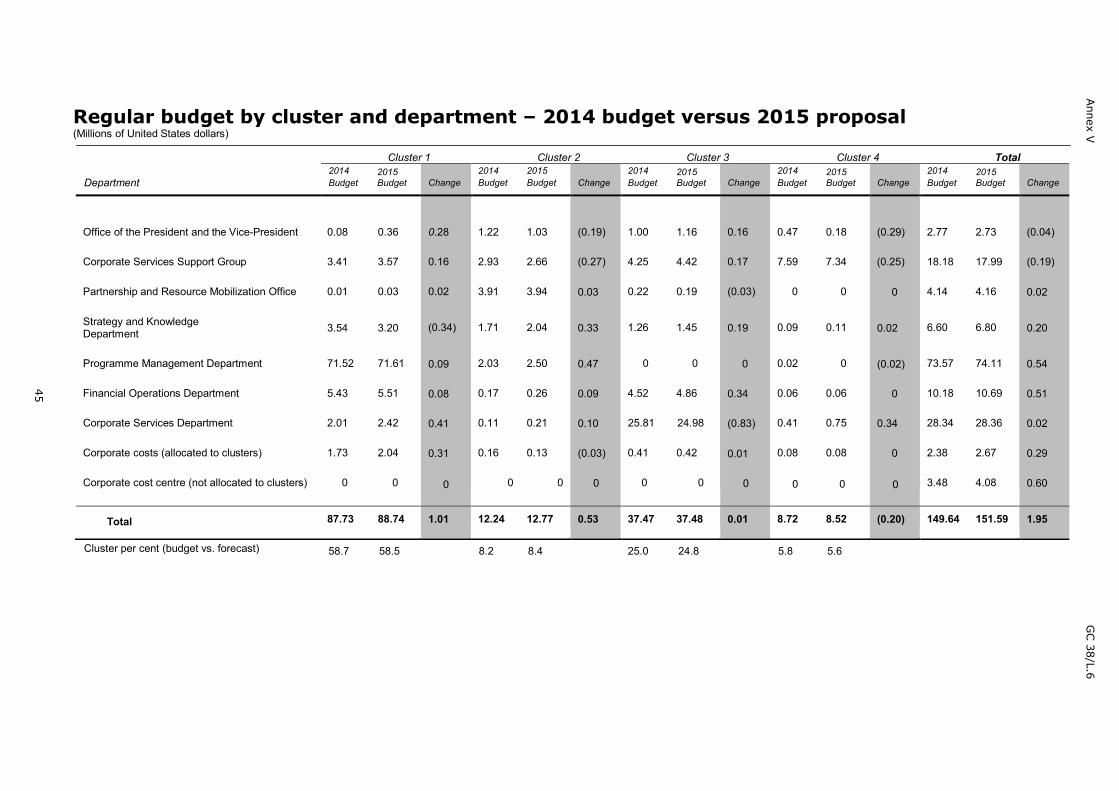
Annex V
GC 38/L.6
45
2014 2015Budget Budget Change
2014 2015Budget Budget Change
2014 2015Budget Budget Change
2014 2015Budget Budget Change
2014 2015Budget Budget Change
Office of the President and the Vice-President 0.08 0.36
Corporate Services Support Group 3.41 3.57
Partnership and Resource Mobilization Office 0.01 0.03
Strategy and KnowledgeDepartment 3.54 3.20
Programme Management Department 71.52 71.61
Financial Operations Department 5.43 5.51
Corporate Services Department 2.01 2.42
Corporate costs (allocated to clusters) 1.73 2.04
Corporate cost centre (not allocated to clusters) 0 0
0.28
0.16
0.02
(0.34)
0.09
0.08
0.41
0.31
0
1.22 1.03
2.93 2.66
3.91 3.94
1.71 2.04
2.03 2.50
0.17 0.26
0.11 0.21
0.16 0.13
0 0
(0.19)
(0.27)
0.03
0.33
0.47
0.09
0.10
(0.03)
0
1.00 1.16
4.25 4.42
0.22 0.19
1.26 1.45
0 0
4.52 4.86
25.81 24.98
0.41 0.42
0 0
0.16
0.17
(0.03)
0.19
0
0.34
(0.83)
0.01
0
0.47 0.18
7.59 7.34
0 0
0.09 0.11
0.02 0
0.06 0.06
0.41 0.75
0.08 0.08
0 0
(0.29)
(0.25)
0
0.02
(0.02)
0
0.34
0
0
2.77 2.73
18.18 17.99
4.14 4.16
6.60 6.80
73.57 74.11
10.18 10.69
28.34 28.36
2.38 2.67
3.48 4.08
(0.04)
(0.19)
0.02
0.20
0.54
0.51
0.02
0.29
0.60
Total 87.73 88.74 1.01 12.24 12.77 0.53 37.47 37.48 0.01 8.72 8.52 (0.20) 149.64 151.59 1.95
Regular budget by cluster and department – 2014 budget versus 2015 proposal(Millions of United States dollars)
Cluster 1 Cluster 2 Cluster 3 Cluster 4 Total
Department
Cluster per cent (budget vs. forecast) 58.7 58.5 8.2 8.4 25.0 24.8 5.8 5.6

Annex V
IG
C 38/L.6
46
Staff Consultants Duty travel ICT Other Total
2014 2015 2014 2015 2014 2015 2014 2015 2014 2015 2014 2015 Change
Office of the President and the Vice-President 2.41 2.39 0.01 0.01 0.23 0.20 - - 0.12 0.13 2.77 2.73
Corporate Services Support Group 14.54 14.28 1.39 1.61 0.55 0.53 - - 1.70 1.57 18.18 17.99- -
Partnership and Resource Mobilization Office 3.43 3.40 0.12 0.24 0.32 0.24 0.27 0.28 4.14 4.16
Strategy and Knowledge Department 5.02 5.01 1.04 1.31 0.39 0.34 - - 0.15 0.14 6.60 6.80
Programme Management Department 42.52 43.01 18.91 17.77 7.22 7.02 0.01 - 4.91 6.31 73.57 74.11
Financial Operations Department 9.51 9.96 0.10 0.13 0.27 0.42 - - 0.30 0.18 10.18 10.69
Corporate Services Department 14.57 14.74 0.86 0.88 0.25 0.21 5.53 5.55 7.13 6.98 28.34 28.36
Corporate costs (allocated to clusters) 1.20 1.40 - - - - - - 1.18 1.27 2.38 2.67
Corporate cost centre (not allocated to clusters) - - - - - - - - 3.48 4.08 3.48 4.08
(0.04)
(0.19)
0.02
0.20
0.54
0.51
0.02
0.29
0.60
Total 93.20 94.19 22.43 21.95 9.23 8.96 5.54 5.55 19.24 20.94 149.64 151.59 1.95
Regular budget by cost category and department – 2014 budget versus 2015 proposal(Millions of United States dollars)
Department

Annex VII GC 38/L.6
47
Indicative 2015 staff levels – regular budget only(Full-time equivalents [FTEs])a
Continuing and fixed-term staff
Departmentb
Professionaland
higherGeneralService
Totalcontinuingand fixed-term staff
Locallyrecruited
fieldstaff Total 2015
Office of the President and the Vice-President (OPV)
Corporate Services Support Group (CSSG)
6.0 5.0 11.0 - 11.0
Office of the General Counsel 12.0 6.5 18.5 - 18.5Office of the Secretary 13.0 20.0 33.0 - 33.0Budget and Organizational Development Unit 4.0 1.0 5.0 5.0Office of Audit and Oversight 6.0 2.5 8.5 - 8.5Communications Division 16.0 4.0 20.0 - 20.0Ethics Office 1.0 1.0 2.0 - 2.0Total CSSG 52.0 35.0 87.0 - 87.0
Partnership and Resource Mobilization Office (PRM)PRM front office 6.0 3.0 9.0 - 9.0North America Liaison Office 3.0 1.0 4.0 - 4.0Arab and Gulf States Liaison Office 2.0 1.0 3.0 - 3.0Asia and Pacific Liaison Office 2.0 1.0 3.0 - 3.0Total PRM 13.00 6.00 19.00 - 19.00
Strategy and Knowledge Department (SKD) 18.0 10.0 28.0 - 28.0
Programme Management Department (PMD)PMD front office 8.0 4.0 12.0 - 12.0Policy and Technical Advisory Division 29.0 10.0 39.0 - 39.0West and Central Africa Division 21.0 12.0 33.0 18.0 51.0East and Southern Africa Division 19.0 12.0 31.0 16.0 47.0Asia and the Pacific Division 19.0 11.0 30.0 20.0 50.0Latin America and the Caribbean Division 17.0 7.0 24.0 1.0 25.0Near East, North Africa and Europe Division 17.0 10.0 27.0 6.0 33.0Environment and Climate Division 11.0 4.0 15.0 - 15.0Total PMD 141.0 70.0 211.00 61.00 272.0
Financial Operations Department (FOD)FOD front office 2.0 1.0 3.0 - 3.0Controller’s and Financial Services Division 25.0 16.0 41.0 3.0 44.0Treasury Services Division 9.0 4.0 13.0 - 13.0Financial Planning and Analysis Unit 3.0 0.0 3.0 - 3.0Total FOD 39.0 21.0 60.0 3.0 63.0
Corporate Services Department (CSD)CSD front office 2.0 2.0 4.0 - 4.0Human Resources Division 14.0 10.0 24.0 - 24.0Administrative Services Division 10.0 27.5 37.5 - 37.5Field Support Unit 2.0 4.0 6.0 - 6.0Information and Communications Technology 15.0 15.0 30.0 - 30.0Total CSD 43.0 58.5 101.5 - 101.5
Grand total – 2015 312.00 205.50 517.50 64.00 581.50
Grand total – 2014 303.41 204.67 508.08 61.00 569.08
a 1 FTE = 12 months. Includes part-time staff corresponding to less than one FTE.b Distribution of staff by department is indicative and subject to change during 2015.

Annex VIII GC 38/L.6
48
Indicative 2015 staffing by department and grade(FTEs)
2015Category Grade OPV CSSG PRM SKD PMD FOD CSD Total
2014Total
Professional Departmentand highera head and 2.0 - - 1.0 1.0 1.0 1.0 6.0
above
D-2 1.0 1.0 1.0 1.0 1.0 - 1.0 6.0
D-1 - 5.0 2.0 1.0 6.0 2.0 2.0 18.0
P-5 1.0 4.0 1.0 4.0 64.0 4.1 7.0 85.1
P-4 1.0 17.0 3.0 6.0 32.0 12.9 12.0 83.9
P-3 - 16.0 6.0 2.0 27.0 13.0 15.0 79.0
P-2 1.0 9.0 0.0 3.0 9.0 5.0 5.0 32.0
P-1 - - - - 1.0 1.0 - 2.0
5.66
6.00
17.00
82.25
86.50
70.00
34.00
2.00
Subtotal 6.0 52.0 13.0 18.0 141.0 39.0 43.0 312.0
GeneralServicea G-7 - - - - - 1.0 1.0
G-6 2.0 11.0 1.0 2.0 21.0 7.0 16.0 60.0
G-5 2.0 12.0 1.0 2.0 30.0 11.0 20.0 78.0
G-4 1.0 10.0 4.0 4.0 16.0 1.0 12.50 48.50
G-3 - 2.0 - 2.0 3.0 2.0 4.0 13.0
G-2 - - - - - - 5.0 5.0
303.41
2.00
66.00
72.17
44.50
15.00
5.00
Subtotal 5.0 35.0 6.0 10.0 70.0 21.0 58.50 205.5 204.67
Total 11.0 87.0 19.0 28.0 211.0 60.0 101.5 517.5 508.08
Percentage Professionalcategory 55 60 68 64 67 65 42 60
Percentage General Servicecategory 45 40 32 36 33 35 58 40
Ratio Professional to GeneralService 1.20 1.49 2.17 1.80 2.01 1.86 0.74 1.52
60
40
1.48
a Excluding locally recruited field staff.
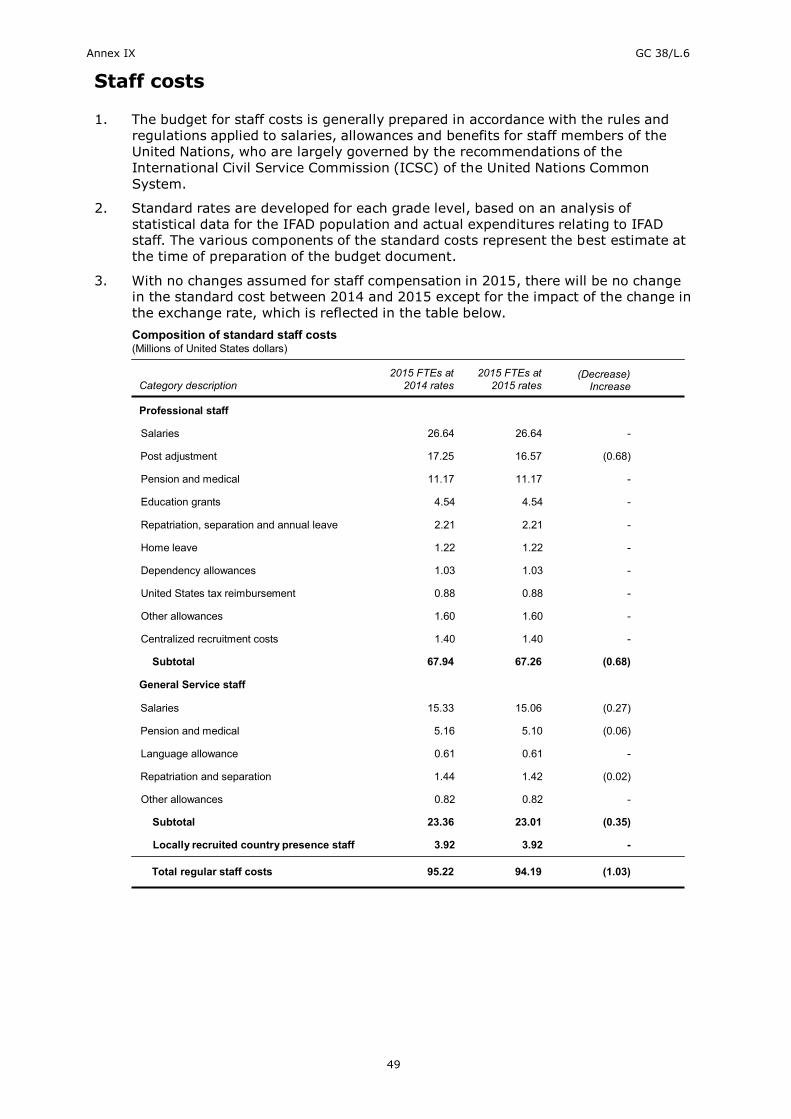
Annex IX GC 38/L.6
49
Staff costs
1. The budget for staff costs is generally prepared in accordance with the rules andregulations applied to salaries, allowances and benefits for staff members of theUnited Nations, who are largely governed by the recommendations of theInternational Civil Service Commission (ICSC) of the United Nations CommonSystem.
2. Standard rates are developed for each grade level, based on an analysis ofstatistical data for the IFAD population and actual expenditures relating to IFADstaff. The various components of the standard costs represent the best estimate atthe time of preparation of the budget document.
3. With no changes assumed for staff compensation in 2015, there will be no changein the standard cost between 2014 and 2015 except for the impact of the change inthe exchange rate, which is reflected in the table below.Composition of standard staff costs(Millions of United States dollars)
Category description2015 FTEs at
2014 rates2015 FTEs at
2015 rates(Decrease)
Increase
Professional staff
Salaries 26.64 26.64 -
Post adjustment 17.25 16.57 (0.68)
Pension and medical 11.17 11.17 -
Education grants 4.54 4.54 -
Repatriation, separation and annual leave 2.21 2.21 -
Home leave 1.22 1.22 -
Dependency allowances 1.03 1.03 -
United States tax reimbursement 0.88 0.88 -
Other allowances 1.60 1.60 -
Centralized recruitment costs 1.40 1.40 -
Subtotal 67.94 67.26 (0.68)
General Service staff
Salaries 15.33 15.06 (0.27)
Pension and medical 5.16 5.10 (0.06)
Language allowance 0.61 0.61 -
Repatriation and separation 1.44 1.42 (0.02)
Other allowances 0.82 0.82 -
Subtotal 23.36 23.01 (0.35)
Locally recruited country presence staff 3.92 3.92 -
Total regular staff costs 95.22 94.19 (1.03)
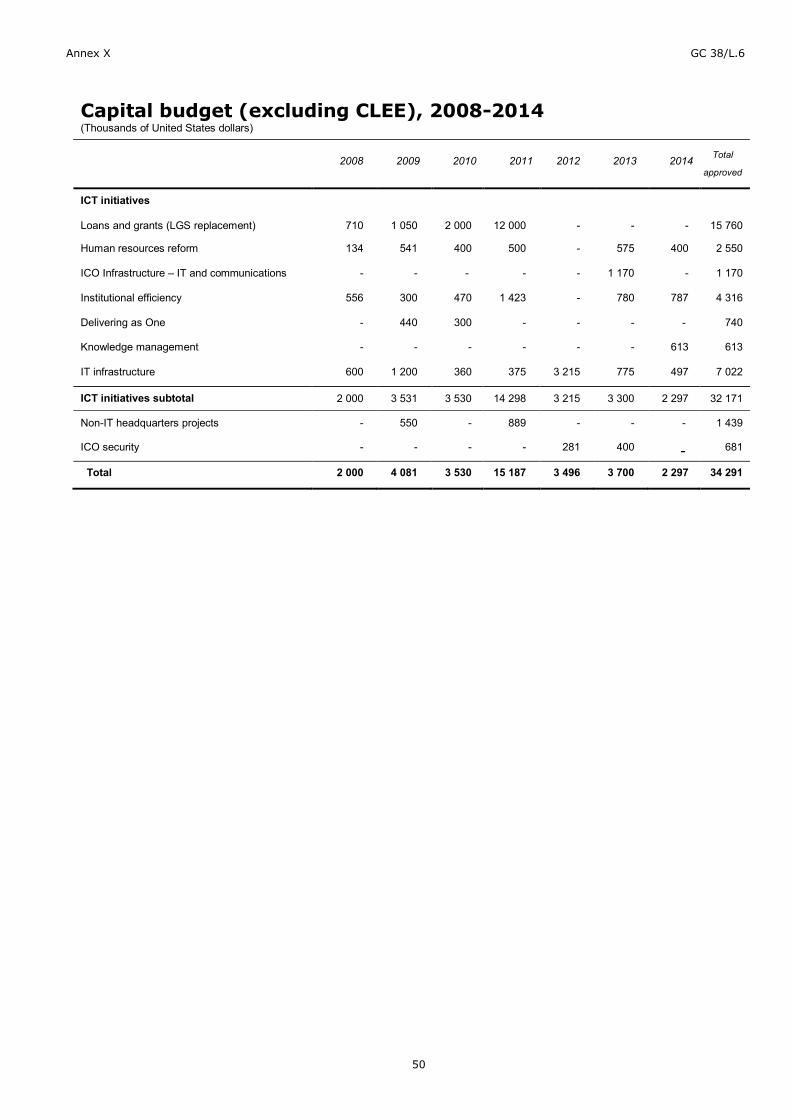
Annex X GC 38/L.6
50
Capital budget (excluding CLEE), 2008-2014(Thousands of United States dollars)
2008 2009 2010 2011 2012 2013 2014 Total
approved
ICT initiatives
Loans and grants (LGS replacement) 710 1 050 2 000 12 000 - - - 15 760
Human resources reform 134 541 400 500 - 575 400 2 550
ICO Infrastructure – IT and communications - - - - - 1 170 - 1 170
Institutional efficiency 556 300 470 1 423 - 780 787 4 316
Delivering as One - 440 300 - - - - 740
Knowledge management - - - - - - 613 613
IT infrastructure 600 1 200 360 375 3 215 775 497 7 022
ICT initiatives subtotal 2 000 3 531 3 530 14 298 3 215 3 300 2 297 32 171
Non-IT headquarters projects - 550 - 889 - - - 1 439
ICO security - - - - 281 400 - 681
Total 2 000 4 081 3 530 15 187 3 496 3 700 2 297 34 291
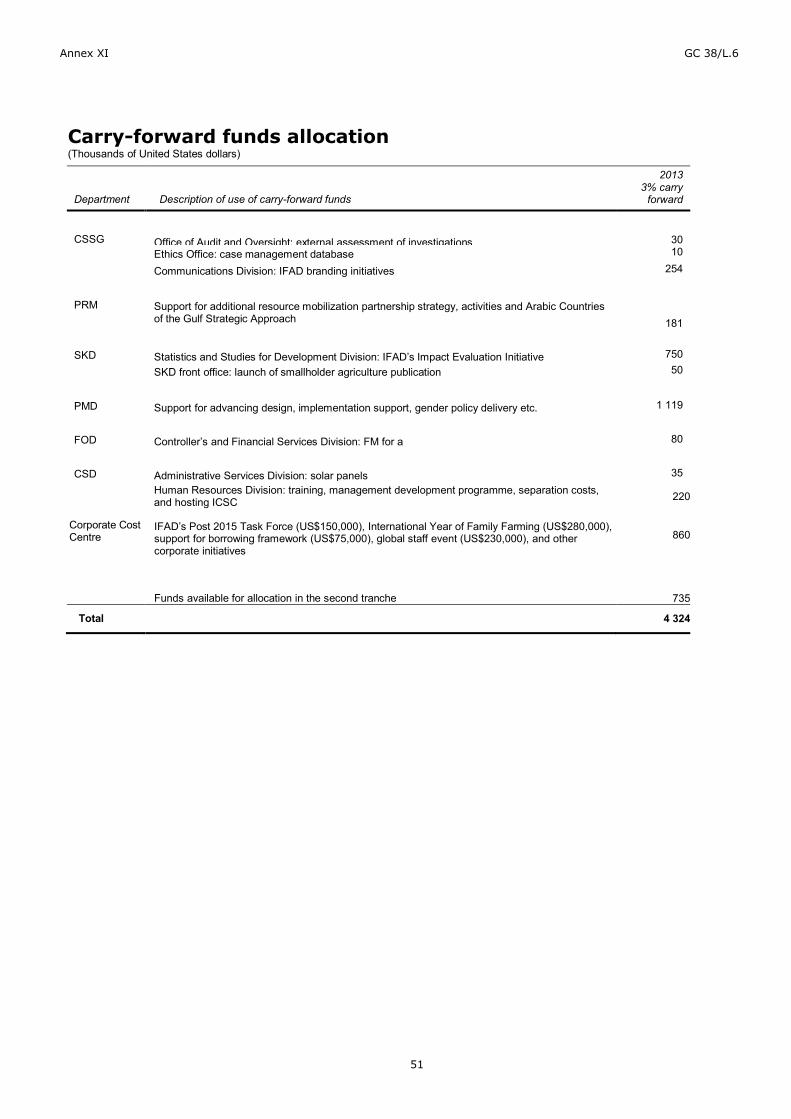
Annex XI GC 38/L.6
51
Carry-forward funds allocation(Thousands of United States dollars)
Department Description of use of carry-forward funds
20133% carry
forward
CSSG Office of Audit and Oversight: external assessment of investigations 30Ethics Office: case management database 10
Communications Division: IFAD branding initiatives 254
PRM Support for additional resource mobilization partnership strategy, activities and Arabic Countriesof the Gulf Strategic Approach 181
SKD Statistics and Studies for Development Division: IFAD’s Impact Evaluation Initiative 750
SKD front office: launch of smallholder agriculture publication 50
PMD Support for advancing design, implementation support, gender policy delivery etc. 1 119
FOD Controller’s and Financial Services Division: FM for a 80
CSD Administrative Services Division: solar panels 35Human Resources Division: training, management development programme, separation costs,and hosting ICSC 220
Corporate CostCentre
IFAD’s Post 2015 Task Force (US$150,000), International Year of Family Farming (US$280,000),support for borrowing framework (US$75,000), global staff event (US$230,000), and othercorporate initiatives
860
Funds available for allocation in the second tranche 735
Total 4 324
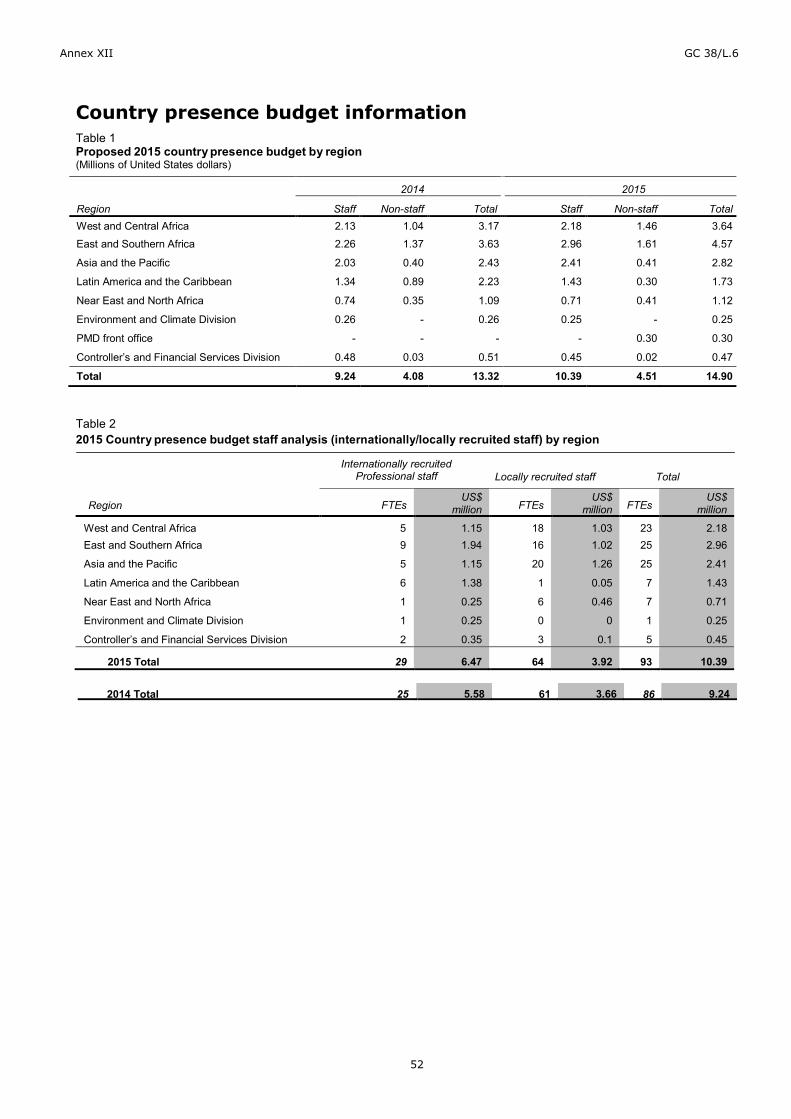
Annex XII GC 38/L.6
52
FTEsUS$
million FTEsUS$
million FTEsUS$
million
West and Central Africa 5East and Southern Africa 9
Asia and the Pacific 5
Latin America and the Caribbean 6
Near East and North Africa 1
Environment and Climate Division 1
Controller’s and Financial Services Division 2
1.151.94
1.15
1.38
0.25
0.25
0.35
1816
20
1
6
0
3
1.031.02
1.26
0.05
0.46
0
0.1
2325
25
7
7
1
5
2.182.96
2.41
1.43
0.71
0.25
0.45
2015 Total 29 6.47 64 3.92 93 10.39
Country presence budget informationTable 1Proposed 2015 country presence budget by region(Millions of United States dollars)
2014 2015
Region Staff Non-staff Total Staff Non-staff TotalWest and Central Africa 2.13 1.04 3.17 2.18 1.46 3.64
East and Southern Africa 2.26 1.37 3.63 2.96 1.61 4.57
Asia and the Pacific 2.03 0.40 2.43 2.41 0.41 2.82
Latin America and the Caribbean 1.34 0.89 2.23 1.43 0.30 1.73
Near East and North Africa 0.74 0.35 1.09 0.71 0.41 1.12
Environment and Climate Division 0.26 - 0.26 0.25 - 0.25
PMD front office - - - - 0.30 0.30
Controller’s and Financial Services Division 0.48 0.03 0.51 0.45 0.02 0.47
Total 9.24 4.08 13.32 10.39 4.51 14.90
Table 22015 Country presence budget staff analysis (internationally/locally recruited staff) by region
Internationally recruitedProfessional staff Locally recruited staff Total
Region
2014 Total 25 5.58 61 3.66 86 9.24
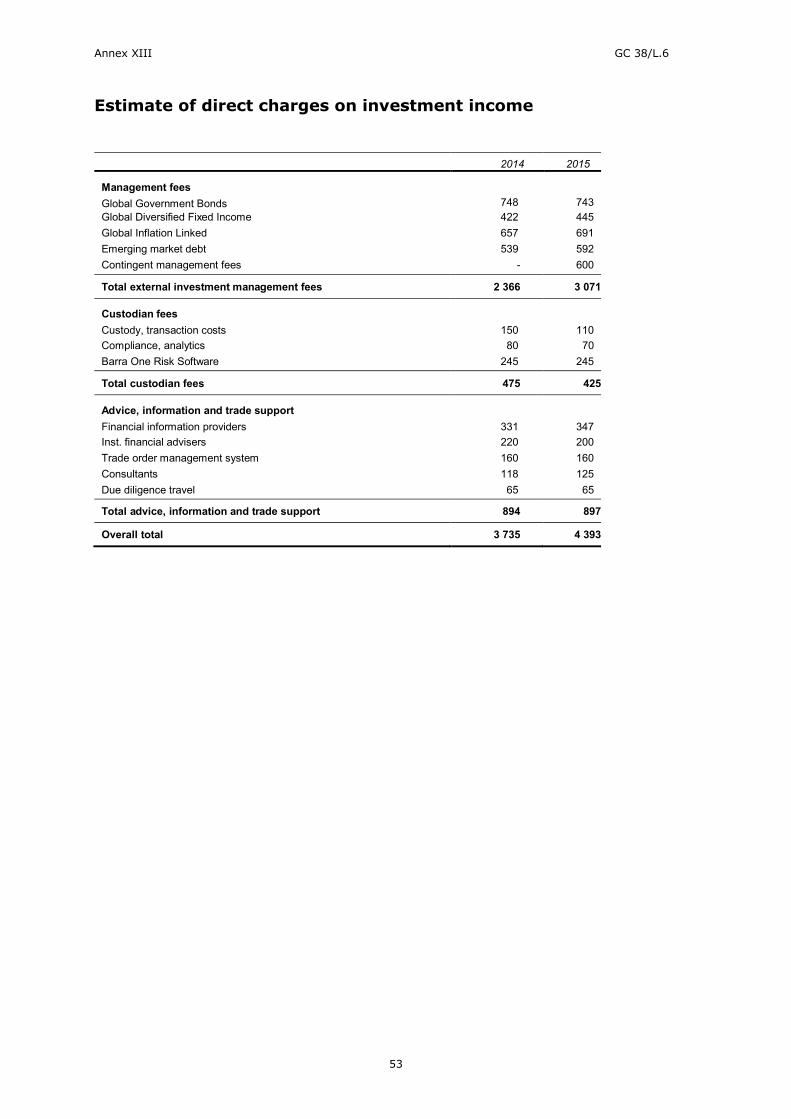
Annex XIII GC 38/L.6
53
Estimate of direct charges on investment income
2014 2015
Management feesGlobal Government Bonds 748 743Global Diversified Fixed Income 422 445Global Inflation Linked 657 691Emerging market debt 539 592Contingent management fees - 600
Total external investment management fees 2 366 3 071
Custodian feesCustody, transaction costs 150 110Compliance, analytics 80 70Barra One Risk Software 245 245
Total custodian fees 475 425
Advice, information and trade supportFinancial information providers 331 347Inst. financial advisers 220 200Trade order management system 160 160Consultants 118 125Due diligence travel 65 65
Total advice, information and trade support 894 897
Overall total 3 735 4 393
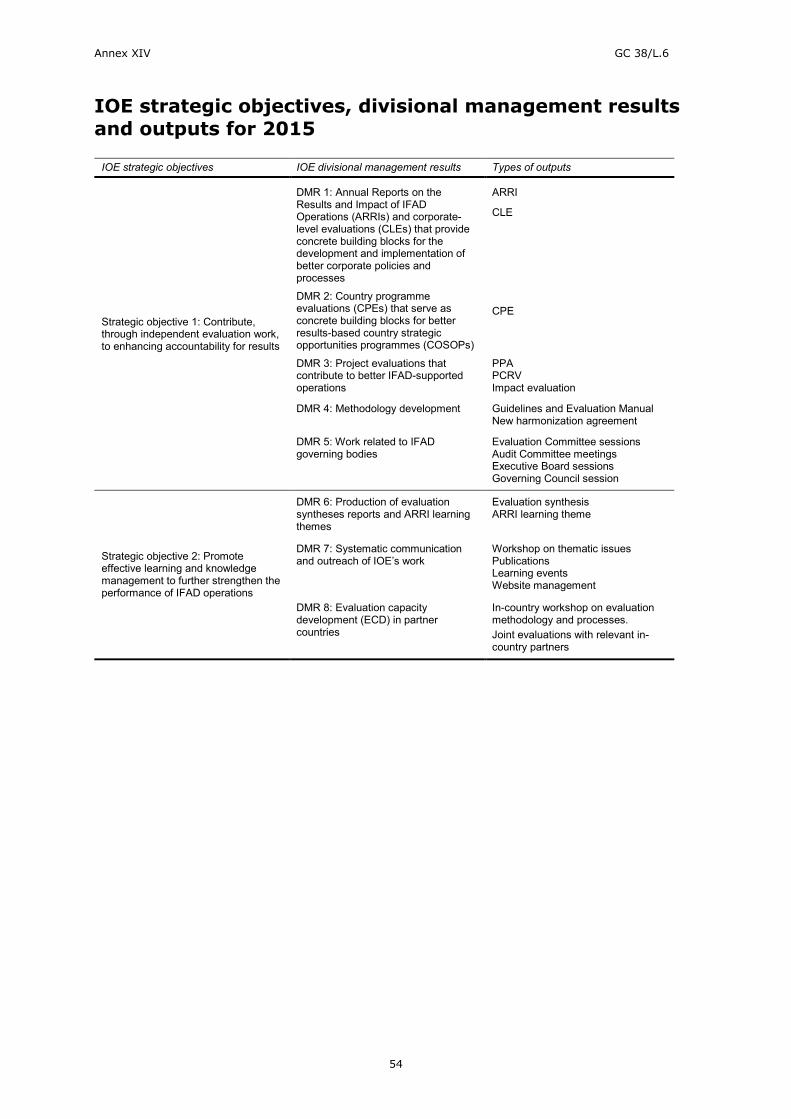
Annex XIV GC 38/L.6
54
IOE strategic objectives, divisional management resultsand outputs for 2015
IOE strategic objectives IOE divisional management results Types of outputs
Strategic objective 1: Contribute,through independent evaluation work,to enhancing accountability for results
DMR 1: Annual Reports on theResults and Impact of IFADOperations (ARRIs) and corporate-level evaluations (CLEs) that provideconcrete building blocks for thedevelopment and implementation ofbetter corporate policies andprocesses
ARRI
CLE
DMR 2: Country programmeevaluations (CPEs) that serve asconcrete building blocks for betterresults-based country strategicopportunities programmes (COSOPs)
CPE
DMR 3: Project evaluations thatcontribute to better IFAD-supportedoperations
PPAPCRVImpact evaluation
DMR 4: Methodology development Guidelines and Evaluation ManualNew harmonization agreement
DMR 5: Work related to IFADgoverning bodies
Evaluation Committee sessionsAudit Committee meetingsExecutive Board sessionsGoverning Council session
Strategic objective 2: Promoteeffective learning and knowledgemanagement to further strengthen theperformance of IFAD operations
DMR 6: Production of evaluationsyntheses reports and ARRI learningthemes
Evaluation synthesisARRI learning theme
DMR 7: Systematic communicationand outreach of IOE’s work
Workshop on thematic issuesPublicationsLearning eventsWebsite management
DMR 8: Evaluation capacitydevelopment (ECD) in partnercountries
In-country workshop on evaluationmethodology and processes.Joint evaluations with relevant in-country partners

55
Annex X
VG
C 38/L.6
55
IOE results measurement framework for 2014Key performance indicators
IOE objectives Key performance indicatorsIOE divisionalmanagement resultsa
Means ofverification 2011 baseline 2014 target
Strategic objective 1: Contribute, throughindependent evaluation work, to enhancingaccountability for results
1. Number of notes with comments on COSOPs andpolicy documents
DMRs 1, 2 and 5 IOE recordsb
2. Number of IOE staff members sent on evaluationtraining each year, on a rotational basis
DMR 4 IOE records 3 staff 3 staff
3. Number of planned Evaluation Committee sessionsheld in accordance with the Evaluation Committee’sterms of reference
DMR 5 IOE records 4 regularsessions
According to2014 workprogramme(WP)
4. IOE participation as required in sessions of AuditCommittee, Executive Board, Governing Council andExecutive Board annual country visit
DMR 5 IOE records 100% 100%
Strategic objective 2: Promote effectivelearning and knowledge management tofurther strengthen the performance ofIFAD operations
5. Number of key learning events organized by IOEwithin IFAD
DMRs 6 and 7 IOE records 2 events 4 events
6. Number of in-country learning events co-organizedby IOE with governments
DMR 7 IOE records 4 events 5 events
7. Number of in-house learning events attended byIOE staff for knowledge-sharing
DMR 7 IOE records 2 events 4 events
8. Number of external knowledge events with IOE staffparticipation to share lessons from evaluation
DMR 7 IOE records 3 events 5 events
9. Number of knowledge management products (i.e.Profiles and Insights) of CLEs and CPEs publishedwithin three months of established completion dateand disseminated to internal and external audiences(once agreement at completion point is signed)
DMRs 6 and 7 IOE records 80% 100%
10. Number of evaluation syntheses and ARRIlearning themes
DMR 6 IOE records According to2014 WP
11. Number of evaluation capacity development (ECD)workshops organized in partner countries to shareknowledge on IOE evaluation methodology andprocesses c
DMR 8 IOE records NA
12. Number of events attended by IOE staff, related toself-evaluation and ECD
DMR 8 IOE records 1 event 3 events
Joint SO1 and SO2(combining the learning and accountabilityfunctions of independent evaluation)
13. ARRI, and number of CLEs, CPEs, PPAs andPCRVs and impact evaluations
DMR 1, 2 and 3 IOE records According to2014 WP
a DMR 1: ARRIs and CLEs that provide concrete building blocks for the development and implementation of better corporate policies and processes; DMR 2: CPEs that serve as concrete buildingblocks for better results-based COSOPs; DMR 3: Project evaluations that contribute to better IFAD-supported operations; DMR 4: Methodology development; DMR 5: Work related to IFADgoverning bodies; DMR 6: Production of evaluation syntheses and ARRI learning themes; DMR 7: Systematic communication and outreach of IOE’s work; DMR 8: ECD in partner countries.b Depending on the number of COSOPs following CPEs or the number of policy documents following evaluations on the same topics.c Depending on requests by Member States.

56
Annex X
VI
GC 38/L.6
56
IOE reporting on achievements as at mid-October 2014In 2014, IOE is reporting for the first time on: (i) planned activities (table 1 below); and (ii) key performance indicators (table 2). Thematrix below will continue to be updated until the final submission of the work programme and budget document to the Executive Boardin December 2014.Table 1Reporting on IOE planned activities (January – mid-October 2014)
Type of work Evaluation activities Planned implementation status Present status
1. Corporate-levelevaluations
IFAD replenishments To be completed in December2013
Completed in February 2014. The evaluation report was submitted for review tothe Evaluation Committee in March 2014 and then to the Executive Board in April2014. It was also discussed at the second session of IFAD10 (June 2014).
IFAD Policy for Grant Financing To be completed in June 2014 Completed. The evaluation report was presented to the Evaluation Committee inOctober 2014 and will be presented to the Executive Board in December 2014.
IFAD’s work in fragile and conflict-affected statesand situations
To be completed in mid- 2015 Started as planned. The approach paper was discussed at the eighty-secondsession of the Evaluation Committee in March 2014. A progress report onimplementation was presented to the third session of IFAD10 in October.
2. Countryprogrammeevaluations
Bangladesh To start in April 2014 Progressing as planned. Main mission in October 2014.
Plurinational State of Bolivia To be completed in March 2014 Completed. Planned discussion in the Evaluation Committee in October 2014deferred to November, due to reduction (to a half day) of the duration of the eighty-fifth Committee session.
China To be completed in March 2014 Completed. Will be discussed in the Evaluation Committee in November 2014.
Senegal To be completed in March 2014 Completed ahead of schedule in January 2014.
Sierra Leone To start in April 2014 The Sierra Leone CPE was started as planned. In September, due to compellingreasons in the country, IOE, in consultation with the West and Central AfricaDivision, decided to replace it with a CPE for The Gambia.
United Republic of Tanzania To start in January 2014 Started as planned. Main mission completed.
Zambia To be completed in March 2014 Completed.
3. Project completionreport validation
Validate all PCRs available in the year To be completed in December2014
Progressing as planned.
4. Projectperformanceassessment
Around eight PPAs To be completed in December2014
Progressing as planned.
5. Impact evaluation Project to be covered by the impact evaluation To start in April 2014 Project selected (JCTDP, India) using the new selectivity framework. Preparatorymission in June, approach paper prepared and evaluation launched. Evaluation tobe completed in April/May 2015.
Annex
[Click here and insert num
ber][C
lick here and insert EB ../../..]

57
Annex X
VI
GC 38/L.6
57
Type of work Evaluation activities Planned implementation status Present status
6. Engagement withgoverning bodies
Twelfth ARRI To be completed in December2014
Completed. Final report to be presented to the Evaluation Committee andExecutive Board at end-2014.
Review of the implementation of the results-basedwork programme for 2014 and indicative plan for2015-2016, and preparation of the results-basedwork programme and budget for 2015 andindicative plan for 2016-2017
To be completed in December2014
In progress as planned.
IOE comments on the President’s Report on theImplementation Status of EvaluationRecommendations and Management Actions(PRISMA)
To be completed in September2014
Completed. PRISMA with IOE comments discussed with the EvaluationCommittee in July 2014 and thereafter by the Board in September 2014.
IOE comments on the Report on IFAD’sDevelopment Effectiveness (RIDE)
To be completed in December2014
Undertaken as planned. RIDE with IOE comments will be discussed with theEvaluation Committee end-November and thereafter by the Board in December2014.
IOE comments on selected IFAD operationalpolicies prepared by IFAD Management forconsideration by the Evaluation Committee
To be completed in December2014
N/A to date.
IOE written comments on IFAD’s country andthematic selectivity paper
Unforeseen additional activityundertaken at the request of theEvaluation Committee at itseighty-fourth session in July2014
Completed. IOE comments presented to the September Board.
Participation in all sessions of the EvaluationCommittee, according to the Terms of Referenceand Rules of Procedure of the EvaluationCommittee
To be completed in December2014
Four formal Committee sessions (March, June, July and October 2014) and twoinformal session (January and June 2014) have been held. One more sessionplanned for November.
2014 Executive Board field visit IOE Officer-in-Charge and a Senior Evaluation Officer took part in the 2014Executive Board visit to the United Republic of Tanzania in May.
IOE comments on COSOPs when related CPEsare available
January-December 2014 Ecuador and Madagascar CPEs will be presented to the Board in December,together with IOE comments on the new COSOPs in the respective countries.
IOE engagement in IFAD10 January-December 2014 In progress: IOE delivered a presentation on the eleventh ARRI at the first sessionof the IFAD10 Consultation in February, and the CLE on IFAD replenishments andevaluation synthesis on middle-income countries were discussed at the secondsession in June 2014. IOE has carried out another unforeseen activity – reviewingand preparing comments on IFAD’s new RMF for the third session of IFAD10 inOctober. At the third session, IOE also presented a progress report on the CLE onfragile states.
7. Communicationand knowledgemanagement activities
Evaluation synthesis on IFAD’s engagement inmiddle-income countries
To be completed in June 2014 Completed ahead of schedule in April 2014, including the holding of an in-houselearning workshop. Presented to the Evaluation Committee and IFAD10Consultation in June.

58
Annex X
VI
GC 38/L.6
58
Type of work Evaluation activities Planned implementation status Present status
Evaluation synthesis on pastoral development To be completed in December2014
In progress as planned, undertaken jointly with the FAO Office of Evaluation.
Evaluation synthesis on indigenous peoples To be completed in December2014
Unforeseen additional activity, included in IOE’s 2014 work programme, started inMarch 2014. Findings will be presented also at the Indigenous Peoples’ Forum, tobe held just before the Governing Council session in February 2015.
Evaluation Reports, Profiles, Insights, IOE website,etc.
January-December 2014 In progress as planned
Organization of in-country CPE learningworkshops, as well as learning events in IFAD
January-December 2014 Organized CPE learning workshops in the Plurinational State of Bolivia, China,Senegal and Zambia.
Participate and share knowledge in selectedexternal platforms such as learning events ormeetings of evaluation groups
January-December 2014 In progress as planned
IOE-OPV quarterly meetings January-December 2014 In progress as planned. First meeting held in May 2014. Several ad hoc meetingsheld with the Office of the President and Vice-President on specific evaluations.
Attend IFAD Management Team meetings; OSCsthat discuss corporate policies and strategies,COSOPs and selected projects evaluated by IOE;selectively CPMTs; and (as observer) theOperational Management Committee; and thequality assurance learning sessions
January-December 2014 In progress as planned
8. Partnerships ECG, NONIE, UNEG and SDC partnership January-December 2014 In progress as planned. Participated in the UNEG Annual General Meeting inMarch, and the ECG meeting in April. IOE will participate in the ECG meeting inDecember, and the annual SDC-IOE partnership meeting on 30 October. IOE staffattended the African Evaluation Association (AfrEA), the European EvaluationSociety and United Kingdom Evaluation Society (UKES) annual conferences. IOEalso participated in a conference to celebrate 10 years of independent evaluationat ADB on innovation and learning in a changing Asia. SDC seconded one seniorevaluation officer to IOE starting in May 2014.
Contribute as internal and external peer reviewerto key evaluations as requested by IFAD and othermultilateral/bilateral organizations
January-December 2014 IOE undertook a peer review of the external midterm review of the InternationalLand Coalition, the Participatory Impact Assessment and Learning Approach byIFAD’s Policy and Technical Advisory Division and two evaluation approach papersby the independent evaluation department of the African Development Bank(AfDB) on the: (i) general capital increase and African Development Fund (AfDF)replenishments; and (ii) results (outcomes and impact of AfDB support) in clientcountries. IOE reviewed and provided comments on the draft impact evaluationsourcebook prepared by IFAD Management as well as on the midterm review of aGlobal Environment Fund-supported operation in Eritrea, requested by the Eastand Southern Africa Division and the Environment and Climate Division.
Implement Joint Statement by CGIAR, FAO, IFADand WFP to strengthen collaboration in evaluation
January-December 2014 In progress as planned. Examples of joint activities to date include: (i) synthesis onpastoral development undertaken with FAO; and (ii) training on how to addressgender issues in evaluations for CGIAR, FAO, IFAD and WFP staff. Moreover, IOE
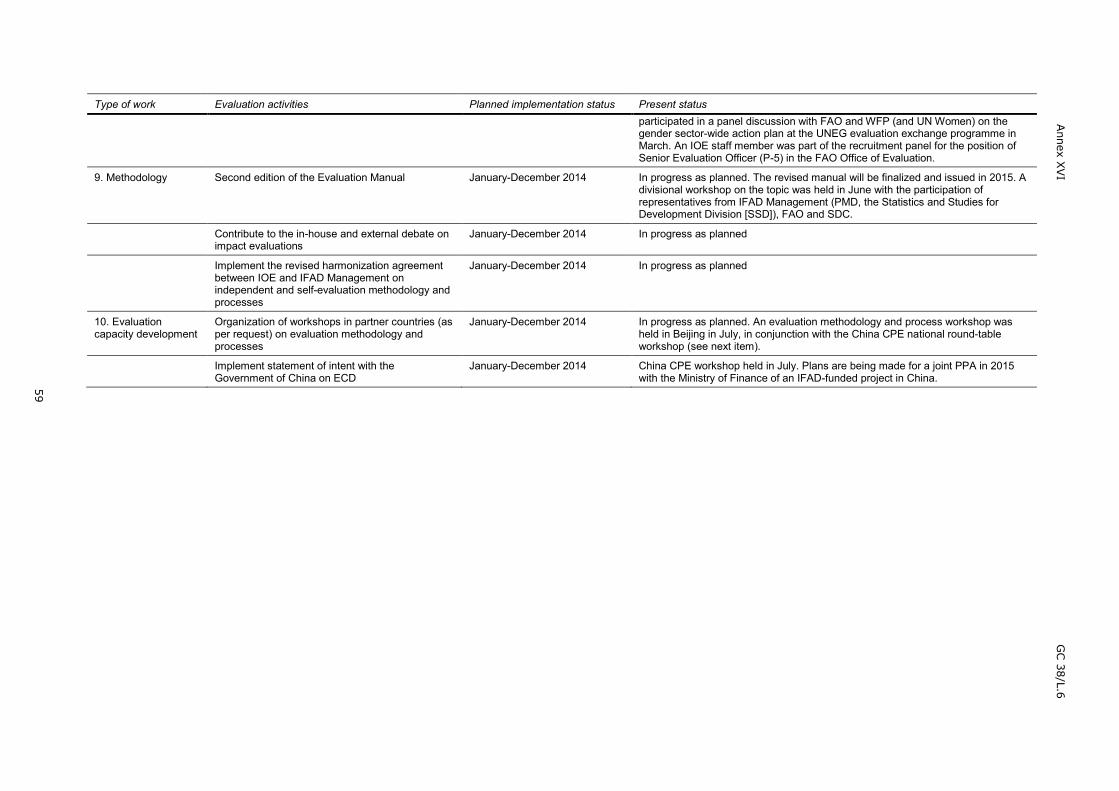
59
Annex X
VI
GC 38/L.6
59
Type of work Evaluation activities Planned implementation status Present statusparticipated in a panel discussion with FAO and WFP (and UN Women) on thegender sector-wide action plan at the UNEG evaluation exchange programme inMarch. An IOE staff member was part of the recruitment panel for the position ofSenior Evaluation Officer (P-5) in the FAO Office of Evaluation.
9. Methodology Second edition of the Evaluation Manual January-December 2014 In progress as planned. The revised manual will be finalized and issued in 2015. Adivisional workshop on the topic was held in June with the participation ofrepresentatives from IFAD Management (PMD, the Statistics and Studies forDevelopment Division [SSD]), FAO and SDC.
Contribute to the in-house and external debate onimpact evaluations
January-December 2014 In progress as planned
Implement the revised harmonization agreementbetween IOE and IFAD Management onindependent and self-evaluation methodology andprocesses
January-December 2014 In progress as planned
10. Evaluationcapacity development
Organization of workshops in partner countries (asper request) on evaluation methodology andprocesses
January-December 2014 In progress as planned. An evaluation methodology and process workshop washeld in Beijing in July, in conjunction with the China CPE national round-tableworkshop (see next item).
Implement statement of intent with theGovernment of China on ECD
January-December 2014 China CPE workshop held in July. Plans are being made for a joint PPA in 2015with the Ministry of Finance of an IFAD-funded project in China.

60
Annex X
VI
GC 38/L.6
60
Reporting on IOE key performance indicators (January to mid-October 2014)Based on IOE’s RMF for 2014, the reporting matrix below provides an overview of IOE achievements against the KPIs agreed with theExecutive Board. The structure of the matrix is different from the approved 2014 RMF (see annex II); however, the strategic objectives,DMRs and KPIs are unchanged. The matrix has been restructured to better illustrate IOE’s results chain: strategic objectives and DMRs(first two columns on the left-hand side) are now linked with the KPIs. Given that a KPI can contribute to more than one DMR, arrows areused to highlight how achievements against the KPI are linked with each DMR.Table 2Reporting on IOE set key performance indicators (January to mid-October 2014)
Strategicobjectives
Divisional managementresults Key performance indicators Achievements Description Targets
SO1: Contribute,throughindependentevaluation work,to enhancingaccountability forresults
DMR 1: ARRIs and CLEsthat provide concretebuilding blocks for thedevelopment andimplementation of bettercorporate policies andprocesses
1. Number of notes with commentson COSOPs and policy documents 0
None until September 2014 because no new corporatepolicies/strategies or COSOPs were presented to theBoard as follow-up to IOE evaluations. However, twosuch notes on new COSOPs will be presented to theBoard in December 2014.
13. ARRI, and number of CLEs,CPEs, PPAs, PCRVs and impactevaluations
On track
ARRI drafted and shared with Management inSeptember 2014. Two CLEs have been completed(replenishment and grants); and a third is under way(fragile states). As planned, of the seven CPEs, fourhave been completed and 3 have been started. The2014 impact evaluation has been launched, and PPAsand PCRVs are on track.
According to2014 WP
DMR 2: CPEs that serveas concrete building blocksfor better results-basedCOSOPs
1. Number of notes with commentson COSOPs and policy documents 0 See remark in this column against KPI 1 above.
13. ARRI, and number of CLEs,CPEs, PPAs, PCRVs and IEs On track See remark in this column against KPI 13 above. According to
2014 WP
DMR 3: Project evaluationsthat contribute to betterIFAD-supported operations
13. ARRI, and number of CLEs,CPEs, PPAs, PCRVs and ES On track See remark in this column against KPI 13 above. According to
2014 WP
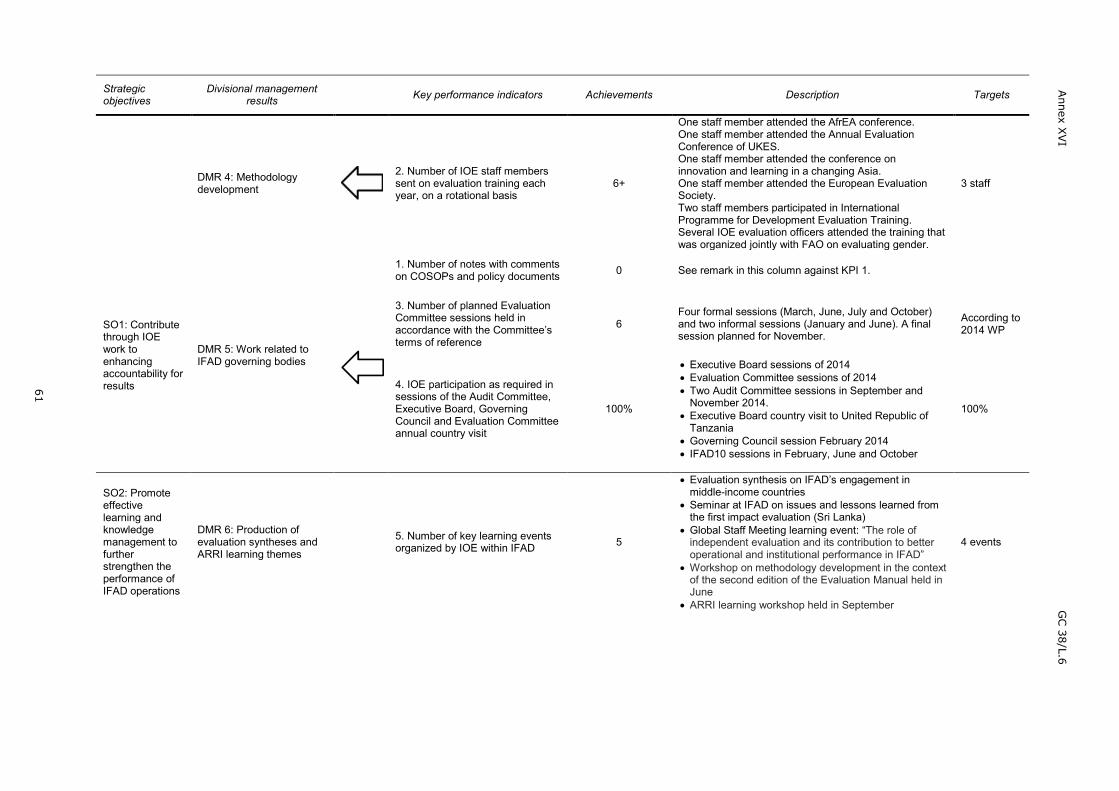
61
Annex X
VI
GC 38/L.6
61
Strategicobjectives
Divisional managementresults Key performance indicators Achievements Description Targets
DMR 4: Methodologydevelopment
2. Number of IOE staff memberssent on evaluation training eachyear, on a rotational basis
6+
One staff member attended the AfrEA conference.One staff member attended the Annual EvaluationConference of UKES.One staff member attended the conference oninnovation and learning in a changing Asia.One staff member attended the European EvaluationSociety.Two staff members participated in InternationalProgramme for Development Evaluation Training.Several IOE evaluation officers attended the training thatwas organized jointly with FAO on evaluating gender.
3 staff
SO1: Contributethrough IOEwork toenhancingaccountability forresults
DMR 5: Work related toIFAD governing bodies
1. Number of notes with commentson COSOPs and policy documents 0 See remark in this column against KPI 1.
3. Number of planned EvaluationCommittee sessions held inaccordance with the Committee’sterms of reference
6Four formal sessions (March, June, July and October)and two informal sessions (January and June). A finalsession planned for November.
According to2014 WP
4. IOE participation as required insessions of the Audit Committee,Executive Board, GoverningCouncil and Evaluation Committeeannual country visit
100%
Executive Board sessions of 2014 Evaluation Committee sessions of 2014 Two Audit Committee sessions in September and
November 2014. Executive Board country visit to United Republic of
Tanzania Governing Council session February 2014 IFAD10 sessions in February, June and October
100%
SO2: Promoteeffectivelearning andknowledgemanagement tofurtherstrengthen theperformance ofIFAD operations
DMR 6: Production ofevaluation syntheses andARRI learning themes
5. Number of key learning eventsorganized by IOE within IFAD 5
Evaluation synthesis on IFAD’s engagement inmiddle-income countries Seminar at IFAD on issues and lessons learned from
the first impact evaluation (Sri Lanka) Global Staff Meeting learning event: “The role of
independent evaluation and its contribution to betteroperational and institutional performance in IFAD” Workshop on methodology development in the context
of the second edition of the Evaluation Manual held inJune ARRI learning workshop held in September
4 events
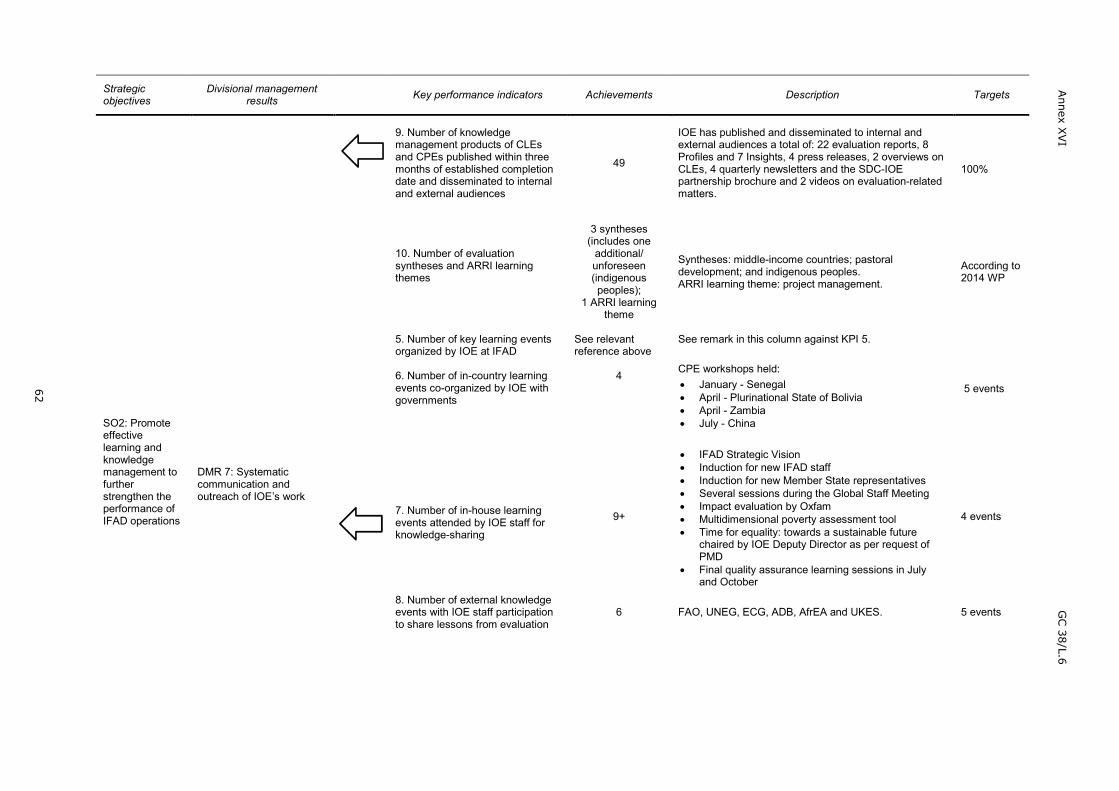
62
Annex X
VI
GC 38/L.6
62
Strategicobjectives
Divisional managementresults Key performance indicators Achievements Description Targets
9. Number of knowledgemanagement products of CLEsand CPEs published within threemonths of established completiondate and disseminated to internaland external audiences
49
IOE has published and disseminated to internal andexternal audiences a total of: 22 evaluation reports, 8Profiles and 7 Insights, 4 press releases, 2 overviews onCLEs, 4 quarterly newsletters and the SDC-IOEpartnership brochure and 2 videos on evaluation-relatedmatters.
100%
10. Number of evaluationsyntheses and ARRI learningthemes
3 syntheses(includes one
additional/unforeseen(indigenouspeoples);
1 ARRI learningtheme
Syntheses: middle-income countries; pastoraldevelopment; and indigenous peoples.ARRI learning theme: project management.
According to2014 WP
SO2: Promoteeffectivelearning andknowledgemanagement tofurtherstrengthen theperformance ofIFAD operations
DMR 7: Systematiccommunication andoutreach of IOE’s work
5. Number of key learning eventsorganized by IOE at IFAD
6. Number of in-country learningevents co-organized by IOE withgovernments
See relevantreference above
4
See remark in this column against KPI 5.
CPE workshops held: January - Senegal April - Plurinational State of Bolivia April - Zambia July - China
5 events
7. Number of in-house learningevents attended by IOE staff forknowledge-sharing
9+
IFAD Strategic Vision Induction for new IFAD staff Induction for new Member State representatives Several sessions during the Global Staff Meeting Impact evaluation by Oxfam Multidimensional poverty assessment tool Time for equality: towards a sustainable future
chaired by IOE Deputy Director as per request ofPMD
Final quality assurance learning sessions in Julyand October
4 events
8. Number of external knowledgeevents with IOE staff participationto share lessons from evaluation
6 FAO, UNEG, ECG, ADB, AfrEA and UKES. 5 events

63
Annex X
VI
GC 38/L.6
63
Strategicobjectives
Divisional managementresults Key performance indicators Achievements Description Targets
9. Number of knowledgemanagement products of CLEsand CPEs published within threemonths of established completiondate and disseminated to internaland external audiences
See above See remark in this column against KPI 9 above. 100%
DMR 8: ECD in partnercountries
11. Number of ECD workshopsorganized in partner countries toshare knowledge on IOEevaluation methodology andprocesses
1 Organized a training workshop on evaluationmethodology and processes in Beijing in July.
12. Number of events attended byIOE staff related to self-evaluationand ECD
4
Board discussion on private-sector grant proposal insupport of impact evaluation Operational Management Committee discussion on
IFAD’s quarterly performance report Dedicated session on ex ante quality assurance of
new project proposals Final quality assurance learning session in July
3 events
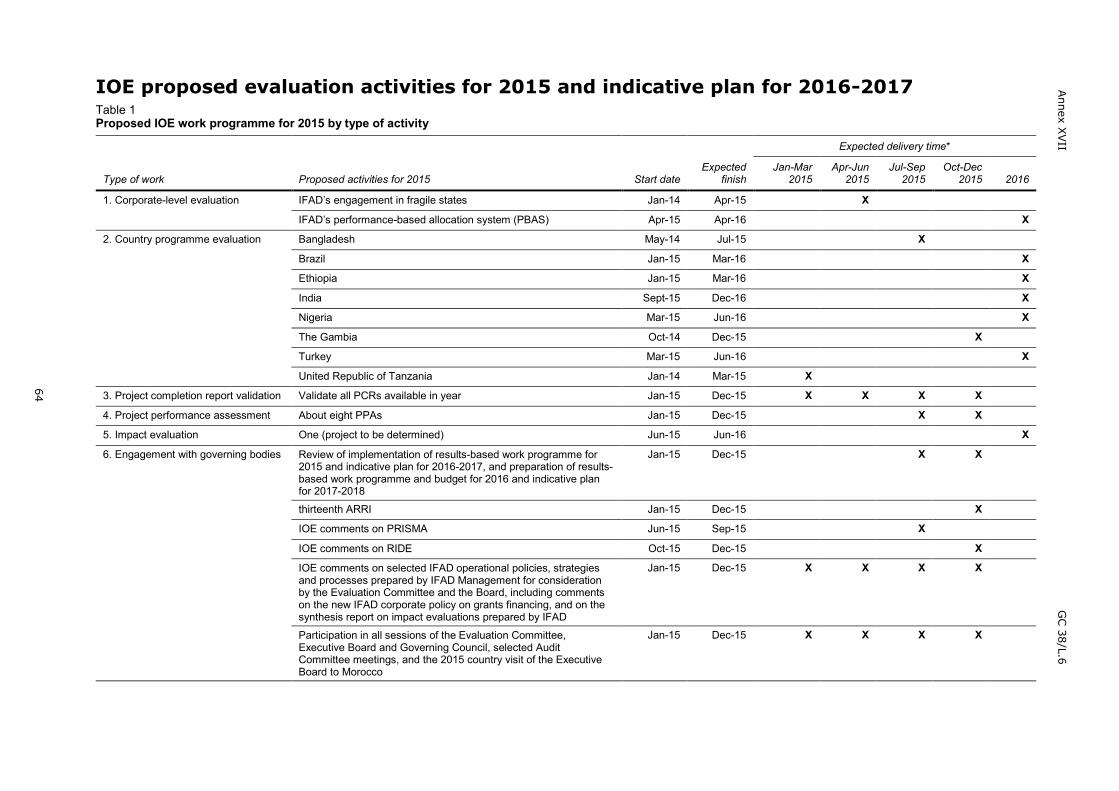
64
Annex X
VII
GC 38/L.6
64
IOE proposed evaluation activities for 2015 and indicative plan for 2016-2017Table 1Proposed IOE work programme for 2015 by type of activity
Type of work Proposed activities for 2015 Start dateExpected
finish
Expected delivery time*
Jan-Mar2015
Apr-Jun2015
Jul-Sep2015
Oct-Dec2015 2016
1. Corporate-level evaluation IFAD’s engagement in fragile states Jan-14 Apr-15 X
IFAD’s performance-based allocation system (PBAS) Apr-15 Apr-16 X
2. Country programme evaluation Bangladesh May-14 Jul-15 X
Brazil Jan-15 Mar-16 X
Ethiopia Jan-15 Mar-16 X
India Sept-15 Dec-16 X
Nigeria Mar-15 Jun-16 X
The Gambia Oct-14 Dec-15 X
Turkey Mar-15 Jun-16 X
United Republic of Tanzania Jan-14 Mar-15 X
3. Project completion report validation Validate all PCRs available in year Jan-15 Dec-15 X X X X
4. Project performance assessment About eight PPAs Jan-15 Dec-15 X X
5. Impact evaluation One (project to be determined) Jun-15 Jun-16 X
6. Engagement with governing bodies Review of implementation of results-based work programme for2015 and indicative plan for 2016-2017, and preparation of results-based work programme and budget for 2016 and indicative planfor 2017-2018
Jan-15 Dec-15 X X
thirteenth ARRI Jan-15 Dec-15 X
IOE comments on PRISMA Jun-15 Sep-15 X
IOE comments on RIDE Oct-15 Dec-15 X
IOE comments on selected IFAD operational policies, strategiesand processes prepared by IFAD Management for considerationby the Evaluation Committee and the Board, including commentson the new IFAD corporate policy on grants financing, and on thesynthesis report on impact evaluations prepared by IFAD
Jan-15 Dec-15 X X X X
Participation in all sessions of the Evaluation Committee,Executive Board and Governing Council, selected AuditCommittee meetings, and the 2015 country visit of the ExecutiveBoard to Morocco
Jan-15 Dec-15 X X X X
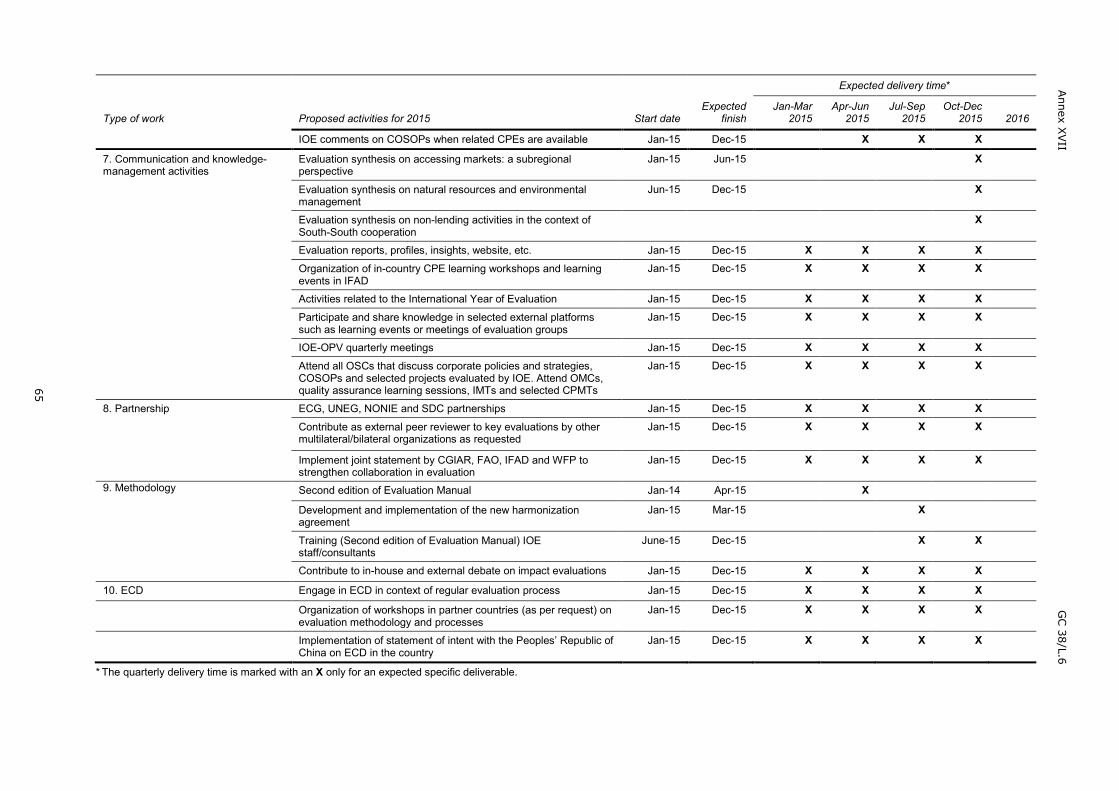
65
Annex X
VII
GC 38/L.6
65
Type of work Proposed activities for 2015 Start dateExpected
finish
Expected delivery time*
Jan-Mar2015
Apr-Jun2015
Jul-Sep2015
Oct-Dec2015 2016
IOE comments on COSOPs when related CPEs are available Jan-15 Dec-15 X X X
7. Communication and knowledge-management activities
Evaluation synthesis on accessing markets: a subregionalperspective
Jan-15 Jun-15 X
Evaluation synthesis on natural resources and environmentalmanagement
Jun-15 Dec-15 X
Evaluation synthesis on non-lending activities in the context ofSouth-South cooperation
X
Evaluation reports, profiles, insights, website, etc. Jan-15 Dec-15 X X X XOrganization of in-country CPE learning workshops and learningevents in IFAD
Jan-15 Dec-15 X X X X
Activities related to the International Year of Evaluation Jan-15 Dec-15 X X X XParticipate and share knowledge in selected external platformssuch as learning events or meetings of evaluation groups
Jan-15 Dec-15 X X X X
IOE-OPV quarterly meetings Jan-15 Dec-15 X X X XAttend all OSCs that discuss corporate policies and strategies,COSOPs and selected projects evaluated by IOE. Attend OMCs,quality assurance learning sessions, IMTs and selected CPMTs
Jan-15 Dec-15 X X X X
8. Partnership ECG, UNEG, NONIE and SDC partnerships Jan-15 Dec-15 X X X XContribute as external peer reviewer to key evaluations by othermultilateral/bilateral organizations as requested
Jan-15 Dec-15 X X X X
Implement joint statement by CGIAR, FAO, IFAD and WFP tostrengthen collaboration in evaluation
Jan-15 Dec-15 X X X X
9. Methodology Second edition of Evaluation Manual Jan-14 Apr-15 X
Development and implementation of the new harmonizationagreement
Jan-15 Mar-15 X
Training (Second edition of Evaluation Manual) IOEstaff/consultants
June-15 Dec-15 X X
Contribute to in-house and external debate on impact evaluations Jan-15 Dec-15 X X X X
10. ECD Engage in ECD in context of regular evaluation process Jan-15 Dec-15 X X X X
Organization of workshops in partner countries (as per request) onevaluation methodology and processes
Jan-15 Dec-15 X X X X
Implementation of statement of intent with the Peoples’ Republic ofChina on ECD in the country
Jan-15 Dec-15 X X X X
* The quarterly delivery time is marked with an X only for an expected specific deliverable.
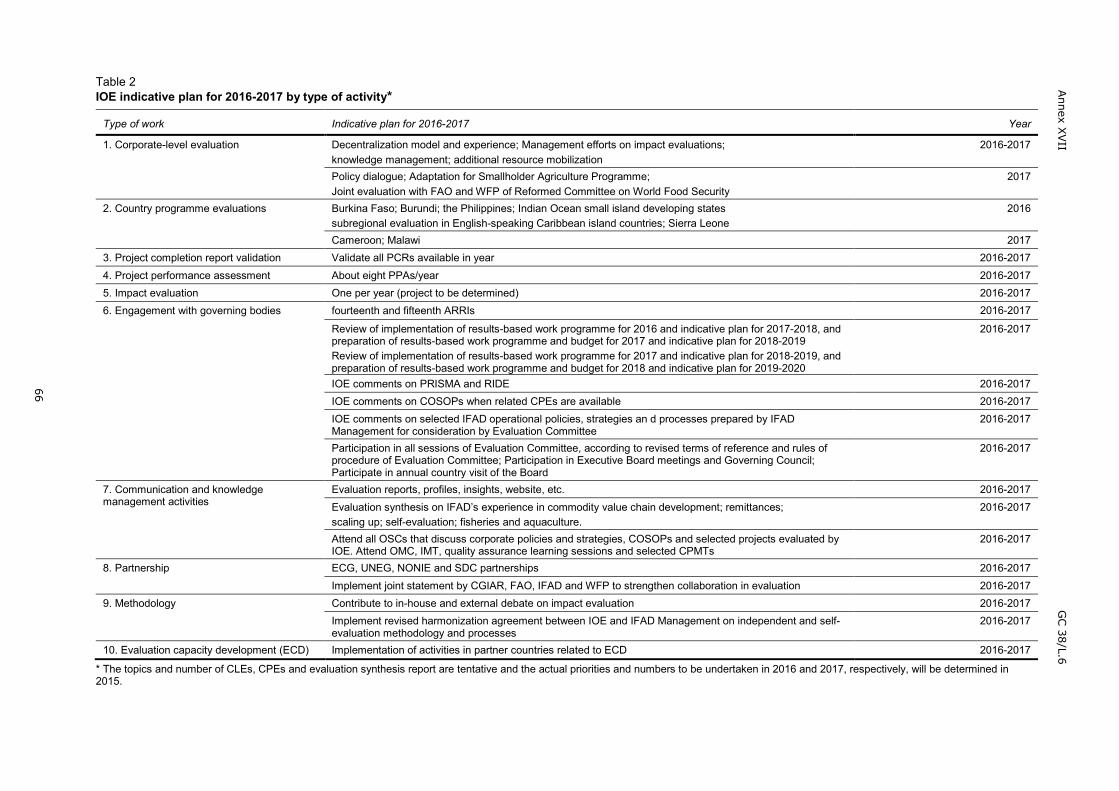
66
Annex X
VII
GC 38/L.6
66
Table 2IOE indicative plan for 2016-2017 by type of activity*
Type of work Indicative plan for 2016-2017 Year
1. Corporate-level evaluation Decentralization model and experience; Management efforts on impact evaluations;knowledge management; additional resource mobilization
2016-2017
Policy dialogue; Adaptation for Smallholder Agriculture Programme;Joint evaluation with FAO and WFP of Reformed Committee on World Food Security
2017
2. Country programme evaluations Burkina Faso; Burundi; the Philippines; Indian Ocean small island developing statessubregional evaluation in English-speaking Caribbean island countries; Sierra Leone
2016
Cameroon; Malawi 20173. Project completion report validation Validate all PCRs available in year 2016-20174. Project performance assessment About eight PPAs/year 2016-20175. Impact evaluation One per year (project to be determined) 2016-20176. Engagement with governing bodies fourteenth and fifteenth ARRIs 2016-2017
Review of implementation of results-based work programme for 2016 and indicative plan for 2017-2018, andpreparation of results-based work programme and budget for 2017 and indicative plan for 2018-2019Review of implementation of results-based work programme for 2017 and indicative plan for 2018-2019, andpreparation of results-based work programme and budget for 2018 and indicative plan for 2019-2020
2016-2017
IOE comments on PRISMA and RIDE 2016-2017IOE comments on COSOPs when related CPEs are available 2016-2017IOE comments on selected IFAD operational policies, strategies an d processes prepared by IFADManagement for consideration by Evaluation Committee
2016-2017
Participation in all sessions of Evaluation Committee, according to revised terms of reference and rules ofprocedure of Evaluation Committee; Participation in Executive Board meetings and Governing Council;Participate in annual country visit of the Board
2016-2017
7. Communication and knowledgemanagement activities
Evaluation reports, profiles, insights, website, etc. 2016-2017Evaluation synthesis on IFAD’s experience in commodity value chain development; remittances;scaling up; self-evaluation; fisheries and aquaculture.
2016-2017
Attend all OSCs that discuss corporate policies and strategies, COSOPs and selected projects evaluated byIOE. Attend OMC, IMT, quality assurance learning sessions and selected CPMTs
2016-2017
8. Partnership ECG, UNEG, NONIE and SDC partnerships 2016-2017Implement joint statement by CGIAR, FAO, IFAD and WFP to strengthen collaboration in evaluation 2016-2017
9. Methodology Contribute to in-house and external debate on impact evaluation 2016-2017Implement revised harmonization agreement between IOE and IFAD Management on independent and self-evaluation methodology and processes
2016-2017
10. Evaluation capacity development (ECD) Implementation of activities in partner countries related to ECD 2016-2017
* The topics and number of CLEs, CPEs and evaluation synthesis report are tentative and the actual priorities and numbers to be undertaken in 2016 and 2017, respectively, will be determined in2015.

67
Annex X
VIII
GC 38/L.6
67
IOE staff levels for 2015
Total human resources
* An additional senior evaluation officer has been seconded from SDC to IOE since May 2014, with no impact on IOE staff costs.
IOE General Service staff levels
2011 level 2012 level 2013 level 2014 level2015
Professional staff General Service staff Total
19.5 19.5 18.5 18.5 13 6 19
Category 2014 2015
Director 1 1
Deputy Director 1 1
Senior evaluation officers 3* 3*
Evaluation officers 6 6
Evaluation Research Analyst 1 1
Evaluation Knowledge and Communication Officer 0.5 1
Total Professional staff 12.5 13
Administrative Assistant 1 1
Assistant to Director 1 1
Assistant to Deputy Director 1 1
Evaluation assistants 3 3
Total General Service staff 6 6
Grand total 18.5 19
2007 2008 2009 2010 2011 2012 2013 2014 2015 (proposed)
9.5 8.5 8.5 8 8 8 6 6 6

68
Annex X
IXG
C 38/L.6
IOE proposed budget for 2015
Table 1IOE proposed budget for 2015(United States dollars)
a As for the rest of IFAD and conveyed by BOD, average inflation assumption is 1.9 per cent and there is no price increase for staff costs.b The exchange rate applied at this stage is US$1 = EUR 0.735.
Evaluation work 2011 2012 20132014(1)
2015 (proposed)Real
increase/decrease(2)
Priceincrease/(decrease)a
(3)Total 2015 budget at b
(4)=(1)+(2)+(3)
Non-staff costs 2 238 000 2 289 474 2 346 711 2 395 992 0 59 900 2 455 892
Staff costs 3 645 576 3 734 530 3 667 268 3 586 690 54 385 (27 034) 3 614 041
Total 5 883 576 6 024 004 6 013 979 5 982 682 54 385 32 866 6 069 933

69
Annex X
IXG
C 38/L.6
Table 22015 IOE budget proposal breakdown for non-staff costs
Type of activityAbsolutenumber
Relative number in terms ofpercentage of work donea Standard unit costsb (US$)
Proposed non-staff costsin 2015 (US$)
ARRI 1 1 150 000 100 000
Corporate-level evaluations IFAD’s engagement in fragile states IFAD’s performance-based allocation
system
211
10.250.75
Differentiated cost based on scope andnature of issues to be assessed:
200 000-450 000
370 000
Country programme evaluations 8 4.5 Differentiated cost based on size ofportfolio, size of country, travel costs and
availability of evaluative evidence:225 000-305 000
1 035 000
PCR validation About 30 About 30 - 50 000
Project performance assessment About 8 About 8 25 000-30 000 230 000
Impact evaluation 2014 carry-over (JCTDP) 2015 impact evaluation (project tbd)
211
10.30.7
200 000-300 000 200 000
Evaluation synthesis 3 3 40 000-65 000 120 000
Revision of IOE Evaluation Manual (finalization) 1 0.3 - 40 000
Communication, evaluation outreach,knowledge-sharing and partnership activities
- - 188 000
ECD, training (including training on the revisedEvaluation Manual) and related administrativecosts
- - 122 892
Total 2 455 892a Evaluations often straddle two years. This figure represents percentage of work done for type of evaluation activity in 2015.b Standard unit costs also include staff travel when necessary.
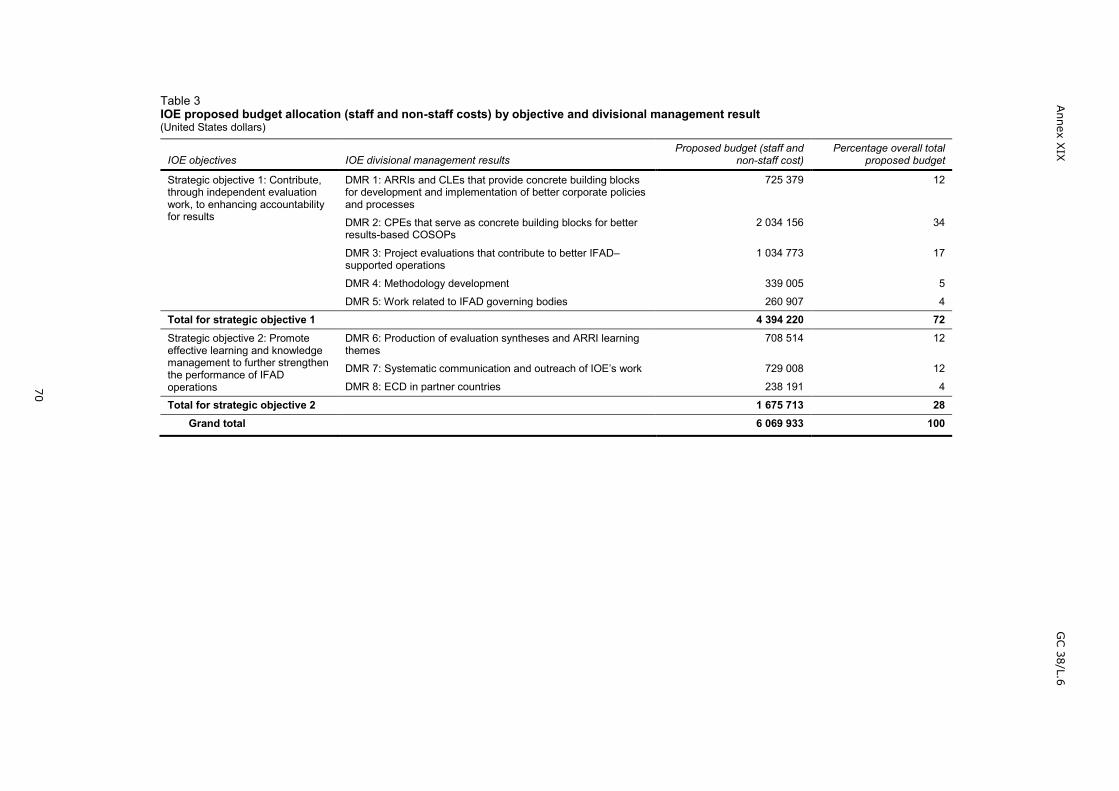
70
Annex X
IXG
C 38/L.6
Table 3IOE proposed budget allocation (staff and non-staff costs) by objective and divisional management result(United States dollars)
IOE objectives IOE divisional management resultsProposed budget (staff and
non-staff cost)Percentage overall total
proposed budget
Strategic objective 1: Contribute,through independent evaluationwork, to enhancing accountabilityfor results
DMR 1: ARRIs and CLEs that provide concrete building blocksfor development and implementation of better corporate policiesand processes
725 379 12
DMR 2: CPEs that serve as concrete building blocks for betterresults-based COSOPs
2 034 156 34
DMR 3: Project evaluations that contribute to better IFAD–supported operations
1 034 773 17
DMR 4: Methodology development 339 005 5
DMR 5: Work related to IFAD governing bodies 260 907 4
Total for strategic objective 1 4 394 220 72Strategic objective 2: Promoteeffective learning and knowledgemanagement to further strengthenthe performance of IFADoperations
DMR 6: Production of evaluation syntheses and ARRI learningthemes
708 514 12
DMR 7: Systematic communication and outreach of IOE’s work 729 008 12
DMR 8: ECD in partner countries 238 191 4
Total for strategic objective 2 1 675 713 28Grand total 6 069 933 100
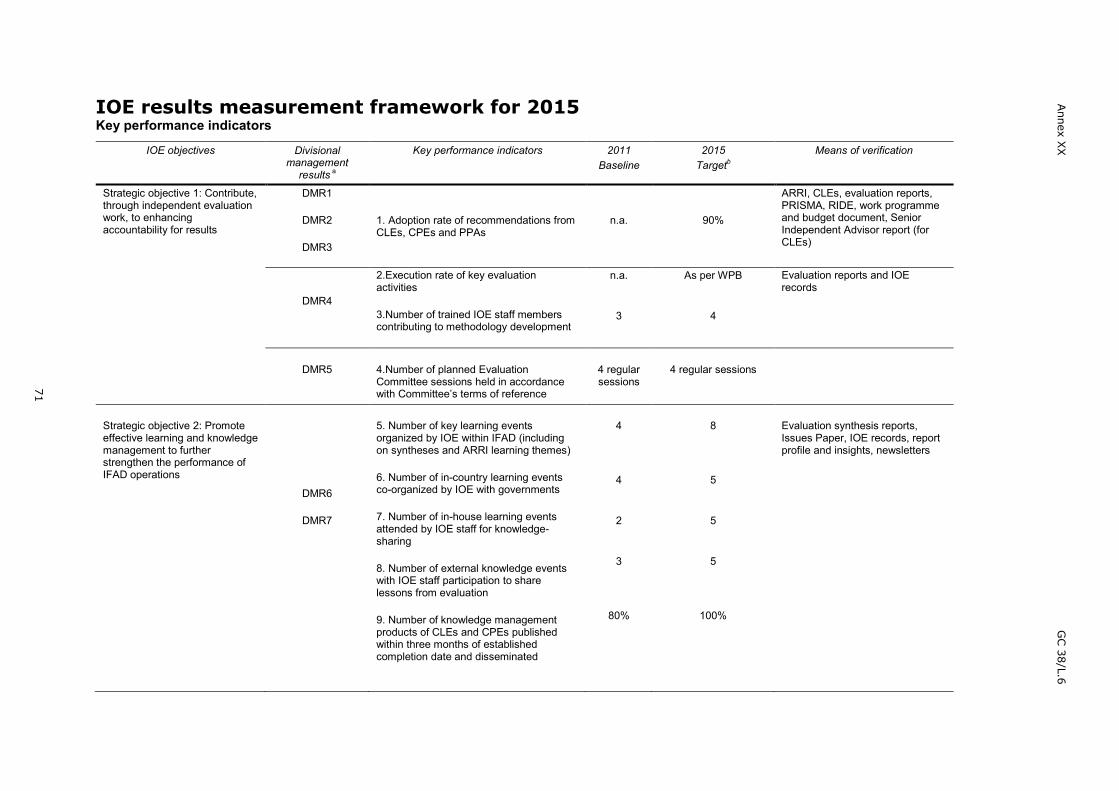
71
Annex X
XG
C 38/L.6
IOE results measurement framework for 2015Key performance indicators
IOE objectives Divisionalmanagement
results a
Key performance indicators 2011Baseline
2015Targetb
Means of verification
Strategic objective 1: Contribute,through independent evaluationwork, to enhancingaccountability for results
DMR1
DMR2
DMR3
1. Adoption rate of recommendations fromCLEs, CPEs and PPAs
n.a. 90%
ARRI, CLEs, evaluation reports,PRISMA, RIDE, work programmeand budget document, SeniorIndependent Advisor report (forCLEs)
DMR4
2.Execution rate of key evaluationactivities
3.Number of trained IOE staff memberscontributing to methodology development
n.a.
3
As per WPB
4
Evaluation reports and IOErecords
DMR5 4.Number of planned EvaluationCommittee sessions held in accordancewith Committee’s terms of reference
4 regularsessions
4 regular sessions
Strategic objective 2: Promoteeffective learning and knowledgemanagement to furtherstrengthen the performance ofIFAD operations
DMR6
DMR7
5. Number of key learning eventsorganized by IOE within IFAD (includingon syntheses and ARRI learning themes)
6. Number of in-country learning eventsco-organized by IOE with governments
7. Number of in-house learning eventsattended by IOE staff for knowledge-sharing
8. Number of external knowledge eventswith IOE staff participation to sharelessons from evaluation
9. Number of knowledge managementproducts of CLEs and CPEs publishedwithin three months of establishedcompletion date and disseminated
4
4
2
3
80%
8
5
5
5
100%
Evaluation synthesis reports,Issues Paper, IOE records, reportprofile and insights, newsletters

72
Annex X
XG
C 38/L.6
IOE objectives Divisionalmanagement
results a
Key performance indicators 2011Baseline
2015Targetb
Means of verification
DMR8
10.Number of ECD workshops organizedin partner countries to share knowledge onIOE evaluation methodology andprocesses
11.Number of events attended by IOE staffrelated to self-evaluation and ECD
n.a.
1
1
3
IOE records
Joint SO1 and SO2(combining the learning andaccountability functions ofindependent evaluation)
12.ARRI and Learning Themes, andnumber of CLEs, CPEs, PPAs andPCRVs, evaluation syntheses and impactevaluations
13.Budget cap
14.Ratio of Professional to GeneralService staff
15.Budget execution rate at year-end
Accordingto 2011
WP
< 0.9% ofIFAD PLG
n.a.
n.a.
1 ARRI, 2 CLEs, 5CPEs, 8 PPAs, 25/30
PCRVs, 3 ESs1 IE
< 0.9% ofIFAD PLG
1/0.46
95%
IOE records
a DMR 1: ARRIs and CLEs that provide concrete building blocks for the development and implementation of better corporate policies and processes; DMR 2: CPEs that serve as concrete buildingblocks for better results-based COSOPs; DMR 3: Project evaluations that contribute to better IFAD-supported operations; DMR 4: Methodology development; DMR 5: Work related to IFADgoverning bodies; DMR 6: Production of evaluation syntheses and ARRI learning themes; DMR 7: Systematic communication and outreach of IOE’s work; DMR 8: ECD in partner countries.b Targets are set taking into account the 2011 baseline values (where available), the resources IOE has and the efficiency gains that are likely to be generated through the development andimplementation of the second edition of the Evaluation Manual.

73
Annex X
XI
GC 38/L.6
IOE selectivity framework
Table 1Guiding questions for the selection and prioritization of evaluations for inclusion in IOE’s work programme
Corporate-level evaluations/Evaluation syntheses Country programme evaluations Project performance assessments*
1. Is this an area of interest/priority for IFADstakeholders?
2. Is this in line with IFAD’s strategic priorities andreplenishment commitments?
3. Will this address a knowledge gap in IFAD?4. What is the evaluation expected to impact?5. Is there a critical decision point in IFAD that would
drive the timing of this evaluation?6. How would this evaluation contribute to IOE’s strategic
objectives?7. What other IOE deliverables would this evaluation
draw on and/or contribute to?8. Does IOE have the resources (financial and human) to
conduct this evaluation?
1. Is there a critical decision point in IFAD that woulddrive the timing of this evaluation?
2. Is this a country of interest/priority for the regionaldivision?
3. How would this evaluation affect the geographicalbalance of the IOE evaluation portfolio?
4. How would this evaluation contribute to IOE’sstrategic objectives?
5. What other IOE deliverables would this evaluationdraw on and/or contribute to?
6. Does IOE have the resources (financial and human)to conduct this evaluation?
1. Did IOE identify any major information gaps,inconsistencies or analytical weaknesses in the PCRduring the validation process?
2. Does the project use successful innovative approachesthat could be scaled up elsewhere?
3. Is there a major disconnect between the ratingscontained in the PCR and those generated by IOEduring the validation process?
4. How does this evaluation affect the geographicalbalance of the IOE evaluation portfolio?
5. What other IOE deliverables would this evaluation drawon and/or contribute to (e.g. CPE)?
6. Does IOE have the resources (financial and human) toconduct this evaluation?
*The selectivity framework cannot be applied for PPAs at this stage, as IOE has not yet been provided with the list of PCRs that will need to be validated in 2015.
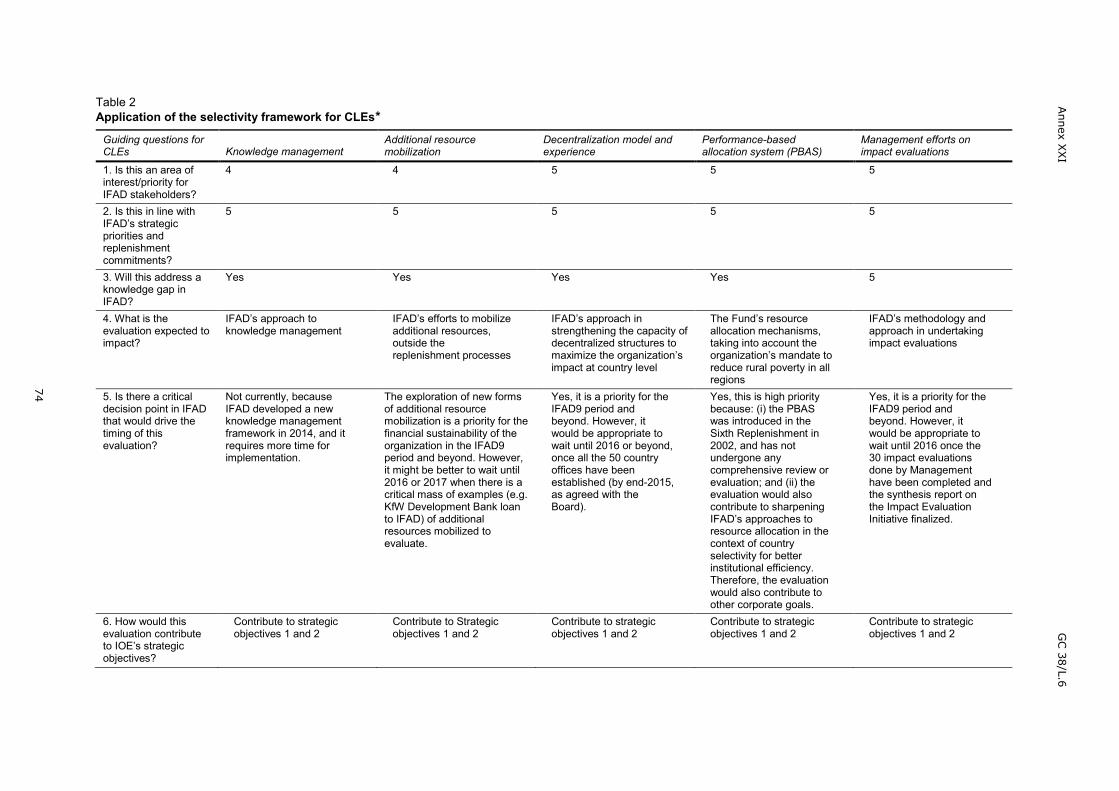
74
Annex X
XI
GC 38/L.6
Table 2Application of the selectivity framework for CLEs*
Guiding questions forCLEs Knowledge management
Additional resourcemobilization
Decentralization model andexperience
Performance-basedallocation system (PBAS)
Management efforts onimpact evaluations
1. Is this an area ofinterest/priority forIFAD stakeholders?
4 4 5 5 5
2. Is this in line withIFAD’s strategicpriorities andreplenishmentcommitments?
5 5 5 5 5
3. Will this address aknowledge gap inIFAD?
Yes Yes Yes Yes 5
4. What is theevaluation expected toimpact?
IFAD’s approach toknowledge management
IFAD’s efforts to mobilizeadditional resources,outside thereplenishment processes
IFAD’s approach instrengthening the capacity ofdecentralized structures tomaximize the organization’simpact at country level
The Fund’s resourceallocation mechanisms,taking into account theorganization’s mandate toreduce rural poverty in allregions
IFAD’s methodology andapproach in undertakingimpact evaluations
5. Is there a criticaldecision point in IFADthat would drive thetiming of thisevaluation?
Not currently, becauseIFAD developed a newknowledge managementframework in 2014, and itrequires more time forimplementation.
The exploration of new formsof additional resourcemobilization is a priority for thefinancial sustainability of theorganization in the IFAD9period and beyond. However,it might be better to wait until2016 or 2017 when there is acritical mass of examples (e.g.KfW Development Bank loanto IFAD) of additionalresources mobilized toevaluate.
Yes, it is a priority for theIFAD9 period andbeyond. However, itwould be appropriate towait until 2016 or beyond,once all the 50 countryoffices have beenestablished (by end-2015,as agreed with theBoard).
Yes, this is high prioritybecause: (i) the PBASwas introduced in theSixth Replenishment in2002, and has notundergone anycomprehensive review orevaluation; and (ii) theevaluation would alsocontribute to sharpeningIFAD’s approaches toresource allocation in thecontext of countryselectivity for betterinstitutional efficiency.Therefore, the evaluationwould also contribute toother corporate goals.
Yes, it is a priority for theIFAD9 period andbeyond. However, itwould be appropriate towait until 2016 once the30 impact evaluationsdone by Managementhave been completed andthe synthesis report onthe Impact EvaluationInitiative finalized.
6. How would thisevaluation contributeto IOE’s strategicobjectives?
Contribute to strategicobjectives 1 and 2
Contribute to Strategicobjectives 1 and 2
Contribute to strategicobjectives 1 and 2
Contribute to strategicobjectives 1 and 2
Contribute to strategicobjectives 1 and 2

75
Annex X
XI
GC 38/L.6
Guiding questions forCLEs
Knowledge management Additional resourcemobilization
Decentralization model andexperience
Performance-basedallocation system (PBAS)
Management efforts onimpact evaluations
7. What other IOEdeliverables would thisevaluation draw onand/or contribute to?
Draw on CPEs andproject-level evaluations.Contribute to other CLEs,CPEs and project-levelevaluations, as well asevaluation synthesisreports
Not directly Draw on other CLEs,CPEs and project-levelevaluations
Contribute to other CLEs,CPEs and project-levelevaluations
Draw on and contribute toproject-level impactevaluations
8. Does IOE have thefinancial and humanresources to conductthis evaluation?
Only one new CLE canbe carried out per yeardue to IOE resourceconstraints and theabsorption capacity ofIFAD Management andGoverning Bodies
Only one new CLE canbe carried out per yeardue to IOE resourceconstraints and theabsorption capacity ofIFAD Management andGoverning Bodies
Only one new CLE can becarried out per year dueto IOE resourceconstraints and theabsorption capacity ofIFAD Management andGoverning Bodies
Yes Only one new CLE can becarried out per year dueto IOE resourceconstraints and theabsorption capacity ofIFAD Management andGoverning Bodies
*In constructing the work programme, each proposed evaluation was validated against the guiding questions, using, where possible, a 5-point score, where 5 representsthe highest score and 1 the lowest.
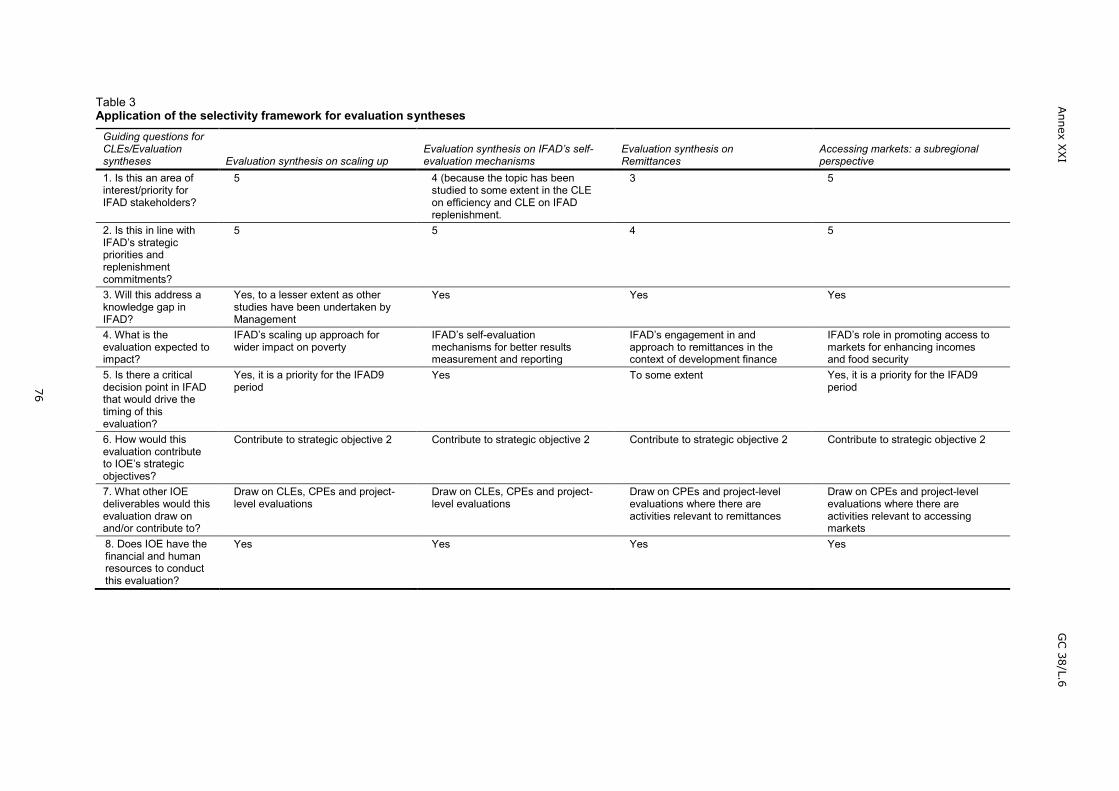
76
Annex X
XI
GC 38/L.6
Table 3Application of the selectivity framework for evaluation syntheses
Guiding questions forCLEs/Evaluationsyntheses Evaluation synthesis on scaling up
Evaluation synthesis on IFAD’s self-evaluation mechanisms
Evaluation synthesis onRemittances
Accessing markets: a subregionalperspective
1. Is this an area ofinterest/priority forIFAD stakeholders?
5 4 (because the topic has beenstudied to some extent in the CLEon efficiency and CLE on IFADreplenishment.
3 5
2. Is this in line withIFAD’s strategicpriorities andreplenishmentcommitments?
5 5 4 5
3. Will this address aknowledge gap inIFAD?
Yes, to a lesser extent as otherstudies have been undertaken byManagement
Yes Yes Yes
4. What is theevaluation expected toimpact?
IFAD’s scaling up approach forwider impact on poverty
IFAD’s self-evaluationmechanisms for better resultsmeasurement and reporting
IFAD’s engagement in andapproach to remittances in thecontext of development finance
IFAD’s role in promoting access tomarkets for enhancing incomesand food security
5. Is there a criticaldecision point in IFADthat would drive thetiming of thisevaluation?
Yes, it is a priority for the IFAD9period
Yes To some extent Yes, it is a priority for the IFAD9period
6. How would thisevaluation contributeto IOE’s strategicobjectives?
Contribute to strategic objective 2 Contribute to strategic objective 2 Contribute to strategic objective 2 Contribute to strategic objective 2
7. What other IOEdeliverables would thisevaluation draw onand/or contribute to?
Draw on CLEs, CPEs and project-level evaluations
Draw on CLEs, CPEs and project-level evaluations
Draw on CPEs and project-levelevaluations where there areactivities relevant to remittances
Draw on CPEs and project-levelevaluations where there areactivities relevant to accessingmarkets
8. Does IOE have thefinancial and humanresources to conductthis evaluation?
Yes Yes Yes Yes
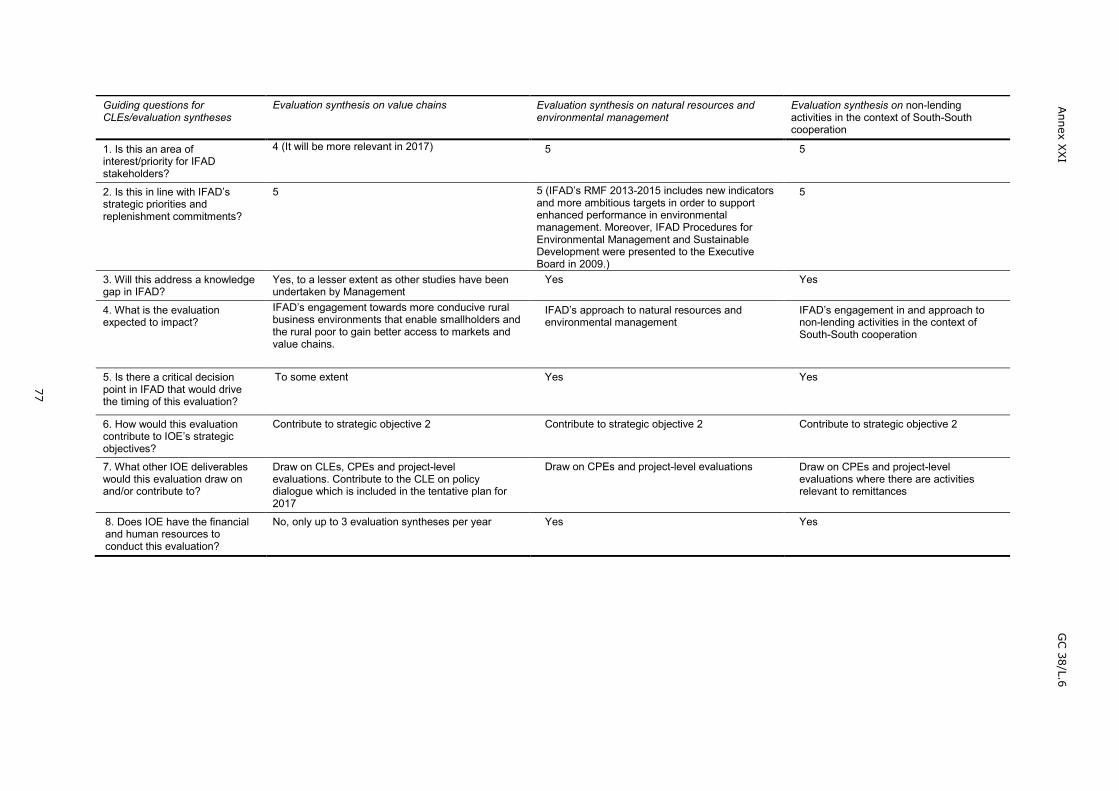
77
Annex X
XI
GC 38/L.6
Guiding questions forCLEs/evaluation syntheses
Evaluation synthesis on value chains Evaluation synthesis on natural resources andenvironmental management
Evaluation synthesis on non-lendingactivities in the context of South-Southcooperation
1. Is this an area ofinterest/priority for IFADstakeholders?
4 (It will be more relevant in 2017) 5 5
2. Is this in line with IFAD’sstrategic priorities andreplenishment commitments?
5 5 (IFAD’s RMF 2013-2015 includes new indicatorsand more ambitious targets in order to supportenhanced performance in environmentalmanagement. Moreover, IFAD Procedures forEnvironmental Management and SustainableDevelopment were presented to the ExecutiveBoard in 2009.)
5
3. Will this address a knowledgegap in IFAD?
Yes, to a lesser extent as other studies have beenundertaken by Management
Yes Yes
4. What is the evaluationexpected to impact?
IFAD’s engagement towards more conducive ruralbusiness environments that enable smallholders andthe rural poor to gain better access to markets andvalue chains.
IFAD’s approach to natural resources andenvironmental management
IFAD’s engagement in and approach tonon-lending activities in the context ofSouth-South cooperation
5. Is there a critical decisionpoint in IFAD that would drivethe timing of this evaluation?
To some extent Yes Yes
6. How would this evaluationcontribute to IOE’s strategicobjectives?
Contribute to strategic objective 2 Contribute to strategic objective 2 Contribute to strategic objective 2
7. What other IOE deliverableswould this evaluation draw onand/or contribute to?
Draw on CLEs, CPEs and project-levelevaluations. Contribute to the CLE on policydialogue which is included in the tentative plan for2017
Draw on CPEs and project-level evaluations Draw on CPEs and project-levelevaluations where there are activitiesrelevant to remittances
8. Does IOE have the financialand human resources toconduct this evaluation?
No, only up to 3 evaluation syntheses per year Yes Yes
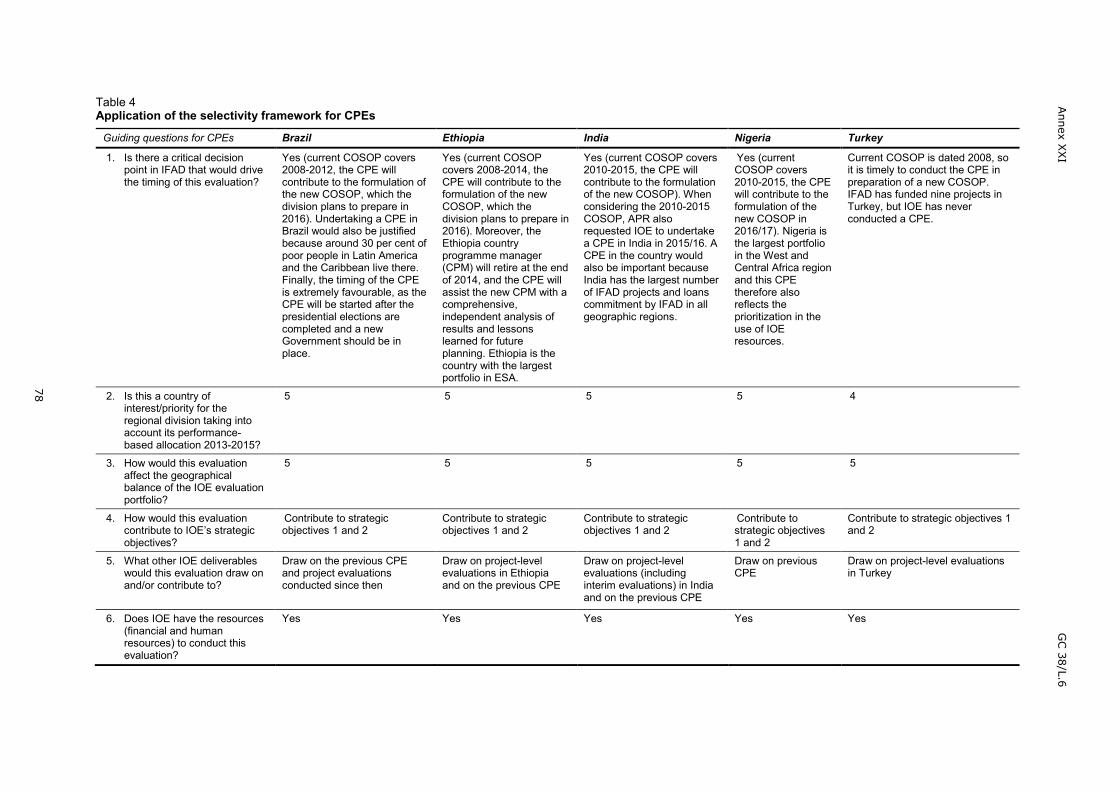
78
Annex X
XI
GC 38/L.6
Table 4Application of the selectivity framework for CPEs
Guiding questions for CPEs Brazil Ethiopia India Nigeria Turkey
1. Is there a critical decisionpoint in IFAD that would drivethe timing of this evaluation?
Yes (current COSOP covers2008-2012, the CPE willcontribute to the formulation ofthe new COSOP, which thedivision plans to prepare in2016). Undertaking a CPE inBrazil would also be justifiedbecause around 30 per cent ofpoor people in Latin Americaand the Caribbean live there.Finally, the timing of the CPEis extremely favourable, as theCPE will be started after thepresidential elections arecompleted and a newGovernment should be inplace.
Yes (current COSOPcovers 2008-2014, theCPE will contribute to theformulation of the newCOSOP, which thedivision plans to prepare in2016). Moreover, theEthiopia countryprogramme manager(CPM) will retire at the endof 2014, and the CPE willassist the new CPM with acomprehensive,independent analysis ofresults and lessonslearned for futureplanning. Ethiopia is thecountry with the largestportfolio in ESA.
Yes (current COSOP covers2010-2015, the CPE willcontribute to the formulationof the new COSOP). Whenconsidering the 2010-2015COSOP, APR alsorequested IOE to undertakea CPE in India in 2015/16. ACPE in the country wouldalso be important becauseIndia has the largest numberof IFAD projects and loanscommitment by IFAD in allgeographic regions.
Yes (currentCOSOP covers2010-2015, the CPEwill contribute to theformulation of thenew COSOP in2016/17). Nigeria isthe largest portfolioin the West andCentral Africa regionand this CPEtherefore alsoreflects theprioritization in theuse of IOEresources.
Current COSOP is dated 2008, soit is timely to conduct the CPE inpreparation of a new COSOP.IFAD has funded nine projects inTurkey, but IOE has neverconducted a CPE.
2. Is this a country ofinterest/priority for theregional division taking intoaccount its performance-based allocation 2013-2015?
5 5 5 5 4
3. How would this evaluationaffect the geographicalbalance of the IOE evaluationportfolio?
5 5 5 5 5
4. How would this evaluationcontribute to IOE’s strategicobjectives?
Contribute to strategicobjectives 1 and 2
Contribute to strategicobjectives 1 and 2
Contribute to strategicobjectives 1 and 2
Contribute tostrategic objectives1 and 2
Contribute to strategic objectives 1and 2
5. What other IOE deliverableswould this evaluation draw onand/or contribute to?
Draw on the previous CPEand project evaluationsconducted since then
Draw on project-levelevaluations in Ethiopiaand on the previous CPE
Draw on project-levelevaluations (includinginterim evaluations) in Indiaand on the previous CPE
Draw on previousCPE
Draw on project-level evaluationsin Turkey
6. Does IOE have the resources(financial and humanresources) to conduct thisevaluation?
Yes Yes Yes Yes Yes

79
Annex X
XI
GC 38/L.6
Table 5Selectivity framework for Impact Evaluations by IOE
A. Essential criteriaa
Criteria Code Guiding questions for impact evaluationsRating system(5-point scale)
Means of verification
Evaluationresults forlearning
A.01 Is a CPE planned in this country in 2015/2016?b 5 = YES 1 = NO IOE indicative rolling WP
A.02 Would the findings of this evaluation, given the subsector nature of the project,also feed into ongoing or planned evaluation synthesis reports or CLEs?
5 = YES 1 = NO IOE indicative rolling WP
Project status A.03 Did project implementation end between 1 and 3 years ago?
1 = > 5 years2 = 5 years5 years ≤3≤ 4 years4 = 3 years3 years ≤5≤ 1years
Project and PortfolioManagement System (PPMS)
Geographicaldistribution
A.04 Has IOE conducted an interim or completion evaluation or PPA of this projectin the past?
5 = NO 1 = YES IOE reports/WP
A.05 Does IFAD Management plan an impact evaluation of this project by the end of2015?
5 = NO 1 = YES PMD; Strategy and KnowledgeManagement Department
a Only projects meeting the essential criteria will be validated also against desirable criteria as detailed in section B of the table.b To ensure that impact evaluation results and lessons learned inform synthesis reports, CPEs and CLEs.
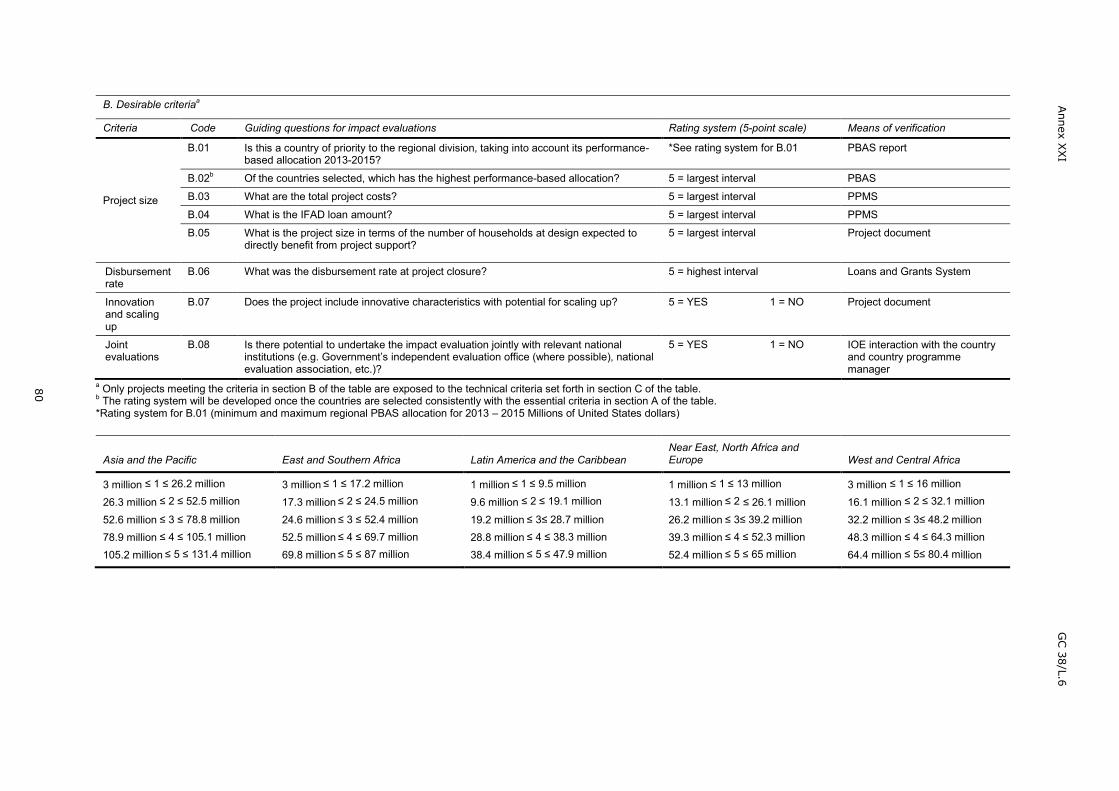
80
Annex X
XI
GC 38/L.6
B. Desirable criteriaa
Criteria Code Guiding questions for impact evaluations Rating system (5-point scale) Means of verification
Project size
B.01 Is this a country of priority to the regional division, taking into account its performance-based allocation 2013-2015?
*See rating system for B.01 PBAS report
B.02b Of the countries selected, which has the highest performance-based allocation? 5 = largest interval PBAS
B.03 What are the total project costs? 5 = largest interval PPMS
B.04 What is the IFAD loan amount? 5 = largest interval PPMS
B.05 What is the project size in terms of the number of households at design expected todirectly benefit from project support?
5 = largest interval Project document
Disbursementrate
B.06 What was the disbursement rate at project closure? 5 = highest interval Loans and Grants System
Innovationand scalingup
B.07 Does the project include innovative characteristics with potential for scaling up? 5 = YES 1 = NO Project document
Jointevaluations
B.08 Is there potential to undertake the impact evaluation jointly with relevant nationalinstitutions (e.g. Government’s independent evaluation office (where possible), nationalevaluation association, etc.)?
5 = YES 1 = NO IOE interaction with the countryand country programmemanager
a Only projects meeting the criteria in section B of the table are exposed to the technical criteria set forth in section C of the table.b The rating system will be developed once the countries are selected consistently with the essential criteria in section A of the table.*Rating system for B.01 (minimum and maximum regional PBAS allocation for 2013 – 2015 Millions of United States dollars)
Asia and the Pacific East and Southern Africa Latin America and the CaribbeanNear East, North Africa andEurope West and Central Africa
3 million ≤ 1 ≤ 26.2 million
26.3 million ≤ 2 ≤ 52.5 million
52.6 million ≤ 3 ≤ 78.8 million78.9 million ≤ 4 ≤ 105.1 million
105.2 million ≤ 5 ≤ 131.4 million
3 million ≤ 1 ≤ 17.2 million
17.3 million ≤ 2 ≤ 24.5 million
24.6 million ≤ 3 ≤ 52.4 million52.5 million ≤ 4 ≤ 69.7 million
69.8 million ≤ 5 ≤ 87 million
1 million ≤ 1 ≤ 9.5 million
9.6 million ≤ 2 ≤ 19.1 million
19.2 million ≤ 3≤ 28.7 million28.8 million ≤ 4 ≤ 38.3 million
38.4 million ≤ 5 ≤ 47.9 million
1 million ≤ 1 ≤ 13 million
13.1 million ≤ 2 ≤ 26.1 million26.2 million ≤ 3≤ 39.2 million39.3 million ≤ 4 ≤ 52.3 million
52.4 million ≤ 5 ≤ 65 million
3 million ≤ 1 ≤ 16 million
16.1 million ≤ 2 ≤ 32.1 million
32.2 million ≤ 3≤ 48.2 million48.3 million ≤ 4 ≤ 64.3 million
64.4 million ≤ 5≤ 80.4 million
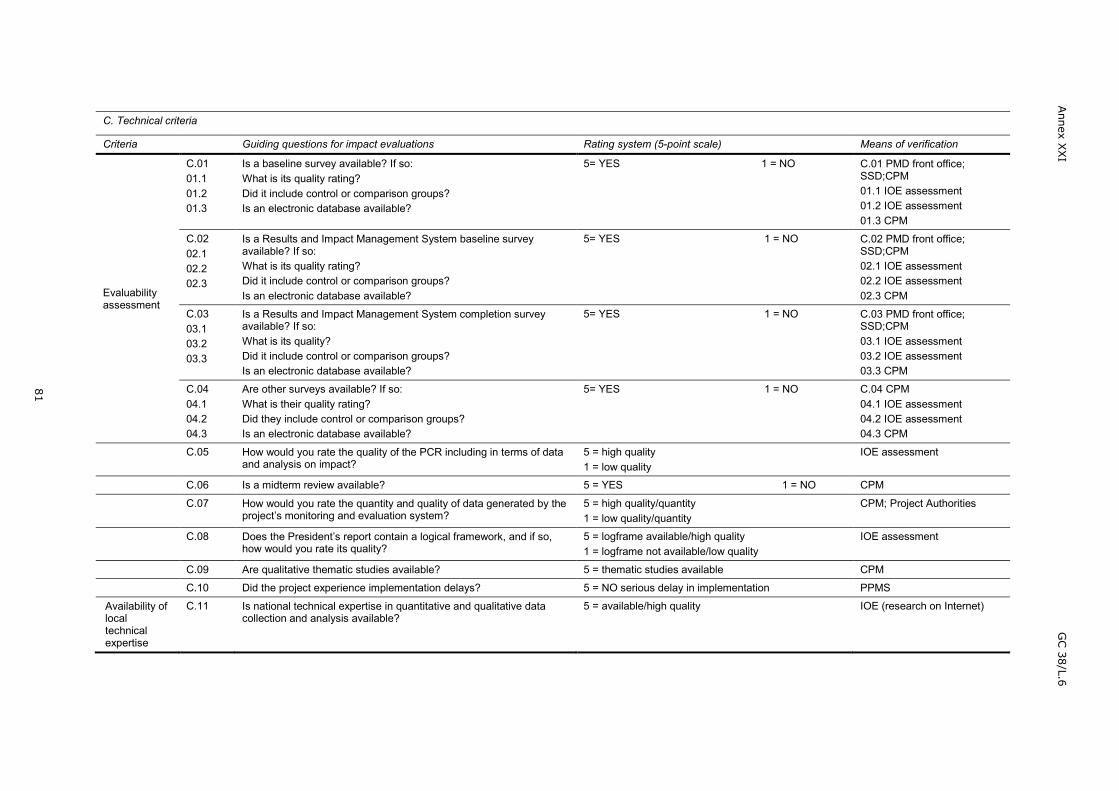
81
Annex X
XI
GC 38/L.6
C. Technical criteria
Criteria Guiding questions for impact evaluations Rating system (5-point scale) Means of verification
Evaluabilityassessment
C.0101.101.201.3
Is a baseline survey available? If so:What is its quality rating?Did it include control or comparison groups?Is an electronic database available?
5= YES 1 = NO C.01 PMD front office;SSD;CPM01.1 IOE assessment01.2 IOE assessment01.3 CPM
C.0202.102.202.3
Is a Results and Impact Management System baseline surveyavailable? If so:What is its quality rating?Did it include control or comparison groups?Is an electronic database available?
5= YES 1 = NO C.02 PMD front office;SSD;CPM02.1 IOE assessment02.2 IOE assessment02.3 CPM
C.0303.103.203.3
Is a Results and Impact Management System completion surveyavailable? If so:What is its quality?Did it include control or comparison groups?Is an electronic database available?
5= YES 1 = NO C.03 PMD front office;SSD;CPM03.1 IOE assessment03.2 IOE assessment03.3 CPM
C.0404.104.204.3
Are other surveys available? If so:What is their quality rating?Did they include control or comparison groups?Is an electronic database available?
5= YES 1 = NO C.04 CPM04.1 IOE assessment04.2 IOE assessment04.3 CPM
C.05 How would you rate the quality of the PCR including in terms of dataand analysis on impact?
5 = high quality1 = low quality
IOE assessment
C.06 Is a midterm review available? 5 = YES 1 = NO CPM
C.07 How would you rate the quantity and quality of data generated by theproject’s monitoring and evaluation system?
5 = high quality/quantity1 = low quality/quantity
CPM; Project Authorities
C.08 Does the President’s report contain a logical framework, and if so,how would you rate its quality?
5 = logframe available/high quality1 = logframe not available/low quality
IOE assessment
C.09 Are qualitative thematic studies available? 5 = thematic studies available CPM
C.10 Did the project experience implementation delays? 5 = NO serious delay in implementation PPMS
Availability oflocaltechnicalexpertise
C.11 Is national technical expertise in quantitative and qualitative datacollection and analysis available?
5 = available/high quality IOE (research on Internet)

Annex XXII GC 38/L.6
82
Annex
IEB
2014/113/R.2/A
dd.1
82
Application of the selectivity framework
The selectivity framework for impact evaluations is the master tool guiding theidentification of projects for impact evaluation by IOE. The framework groups criteriainto three categories: essential, desirable and technical. The framework filters operationsas follows: (i) only projects meeting the essential criteria are exposed to the desirablecriteria and, thereafter, (ii) those with the highest rating are assessed against thetechnical criteria and subjected to an evaluability assessment, which guides IOE’s finaldecision on the project to be evaluated.
For the 2014 impact evaluation, eight projects met the requirements of the first twosubcriteria (evaluation results for learning and project status) under the essentialcriteria. These two subcriteria are fundamental to maximize learning, and ensure thatthe project can be evaluated with due consideration of context in order to obtainadequate understanding of impact and sustainability. All eight projects were assessedagainst the remaining guiding questions under the essential criteria. This narrowed downthe sample from eight to three projects, which were assessed against the desirablecriteria. This further restricted the choice to two projects, namely the India Jharkhand-Chhattisgarh Tribal Development Project and the Nigeria Roots and Tuber ExpansionProgramme), to be exposed to the evaluability assessment (i.e. the technical criteria).
The results of the evaluability assessment indicated that the India project was the mostsuitable for evaluation in terms of both reliability of data and cost-effectiveness.

83
Annex X
XIII
GC 38/L.6
83
Allocation period 2013-20152014 country scores and annual allocations
Table 1: Asia and the Pacific
Country needs Country performance
CountryGNI per
capita 2013
RuralPopulation
2013IRAI
2013a RSP 2014bPAR
2014c
Countryperformance
rating2013 annual
allocation2014 annual
allocation2015 annual
allocation2013 to 2015
allocationAfghanistan 700 23 169 290 2.65 3.13 6 4.04 17 064 407 15 729 701 16 052 744 48 846 852Bangladesh 900 110 583 291 3.27 3.85 6 4.49 33 453 639 35 693 935 39 571 133 108 718 708Bhutan 2 460 474 124 3.68 4.26 6 4.75 2 863 365 2 695 546 2 970 856 8 529 768Cambodia 950 12 050 470 3.43 3.61 4 3.64 9 098 059 8 774 990 9 476 319 27 349 367China 6 560 637 284 480 4.39 5 4.44 43 800 000 43 710 763 43 889 237 131 400 000Cook Islands 15 125 2 612 - - - - -Fiji 4 430 413 901 3.18 3 3.01 1 202 923 1 158 713 1 000 000 3 361 635India 1 570 851 141 890 3.70 4.07 4 3.97 43 800 000 43 710 763 43 889 237 131 400 000Indonesia 3 580 119 412 284 3.90 5 4.52 18 021 440 21 389 030 29 359 855 68 770 325Iran (Islamic Republic of) 5 780 23 721 603 - - - - -Kiribati 2 620 57 116 2.91 3.54 3.34 1 000 000 1 000 000 1 000 000 3 000 000Democratic People's Republic of Korea 583 9 807 325 - - - - -Korea, Republic of 25 920 8 167 526 - - - - -Lao People's Democratic Republic 1 460 4 303 840 3.36 3.70 3 3.53 3 257 206 3 971 474 4 906 207 12 134 887Malaysia 10 400 7 714 524 - - - - -Maldives 5 600 195 446 3.23 3 1.84 - - - -Marshall Islands 4 200 14 499 2.64 2.64 - - - -Mongolia 3 770 844 891 3.36 6 2.77 - - - -Myanmar 1 126 35 262 157 2.95 3.23 4 3.27 12 302 957 13 023 115 11 864 005 37 190 076Nepal 730 22 884 145 3.38 3.64 4 3.78 13 945 026 12 615 218 14 585 682 41 145 926Niue - - - - -Pakistan 1 380 114 963 305 3.07 3.80 4 3.73 21 724 297 22 300 345 24 933 094 68 957 736Papua New Guinea 2 010 6 395 664 3.25 3.30 6 4.23 7 453 849 7 268 374 7 989 093 22 711 315Philippines 3 270 49 825 719 4.37 5 4.43 20 818 498 18 025 502 19 481 316 58 325 315Samoa 3 430 153 254 4.00 4.00 - - - -Solomon Islands 1 610 441 293 2.93 3.04 6 3.88 1 420 987 1 565 642 2 077 346 5 063 974Sri Lanka 3 170 17 349 675 3.52 3.86 4 3.67 9 510 132 8 128 428 8 378 695 26 017 255Thailand 5 370 43 643 136 4.60 4.60 266 667 266 667 - 533 333Timor-Leste 3 580 835 218 3.06 3.09 5 3.82 1 577 331 1 647 553 2 253 519 5 478 403Tonga 4 490 80 401 3.46 5 2.51 - - - -Viet Nam 1 730 60 714 266 3.79 4.38 4 4.24 17 520 389 18 687 118 22 853 276 59 060 783
Total Asia and the Pacific 280 101 170 281 362 876 306 531 614 867 995 660
a IDA Resource Allocation Indexb Rural sector performance scorec Portfolio at risk
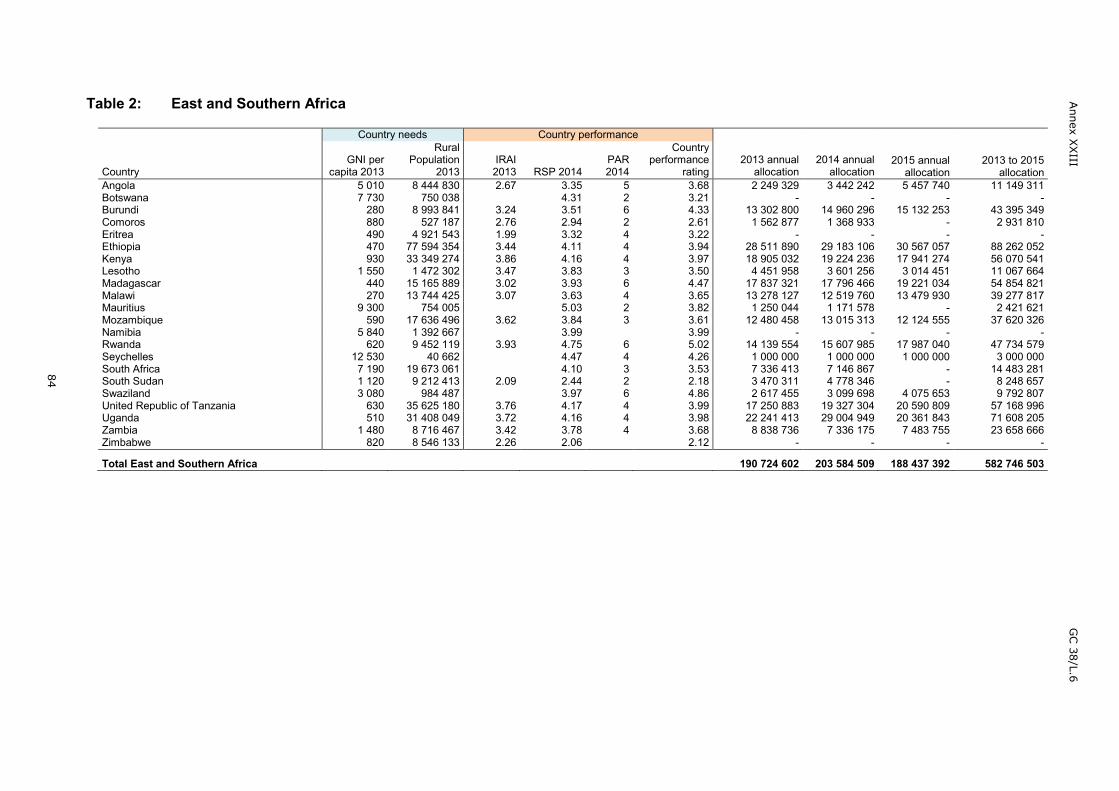
84
Annex X
XIII
GC 38/L.6
84
Table 2: East and Southern Africa
Country needs Country performance
CountryGNI per
capita 2013
RuralPopulation
2013IRAI2013 RSP 2014
PAR2014
Countryperformance
rating2013 annual
allocation2014 annual
allocation2015 annual
allocation2013 to 2015
allocationAngola 5 010 8 444 830 2.67 3.35 5 3.68 2 249 329 3 442 242 5 457 740 11 149 311Botswana 7 730 750 038 4.31 2 3.21 - - - -Burundi 280 8 993 841 3.24 3.51 6 4.33 13 302 800 14 960 296 15 132 253 43 395 349Comoros 880 527 187 2.76 2.94 2 2.61 1 562 877 1 368 933 - 2 931 810Eritrea 490 4 921 543 1.99 3.32 4 3.22 - - - -Ethiopia 470 77 594 354 3.44 4.11 4 3.94 28 511 890 29 183 106 30 567 057 88 262 052Kenya 930 33 349 274 3.86 4.16 4 3.97 18 905 032 19 224 236 17 941 274 56 070 541Lesotho 1 550 1 472 302 3.47 3.83 3 3.50 4 451 958 3 601 256 3 014 451 11 067 664Madagascar 440 15 165 889 3.02 3.93 6 4.47 17 837 321 17 796 466 19 221 034 54 854 821Malawi 270 13 744 425 3.07 3.63 4 3.65 13 278 127 12 519 760 13 479 930 39 277 817Mauritius 9 300 754 005 5.03 2 3.82 1 250 044 1 171 578 - 2 421 621Mozambique 590 17 636 496 3.62 3.84 3 3.61 12 480 458 13 015 313 12 124 555 37 620 326Namibia 5 840 1 392 667 3.99 3.99 - - - -Rwanda 620 9 452 119 3.93 4.75 6 5.02 14 139 554 15 607 985 17 987 040 47 734 579Seychelles 12 530 40 662 4.47 4 4.26 1 000 000 1 000 000 1 000 000 3 000 000South Africa 7 190 19 673 061 4.10 3 3.53 7 336 413 7 146 867 - 14 483 281South Sudan 1 120 9 212 413 2.09 2.44 2 2.18 3 470 311 4 778 346 - 8 248 657Swaziland 3 080 984 487 3.97 6 4.86 2 617 455 3 099 698 4 075 653 9 792 807United Republic of Tanzania 630 35 625 180 3.76 4.17 4 3.99 17 250 883 19 327 304 20 590 809 57 168 996Uganda 510 31 408 049 3.72 4.16 4 3.98 22 241 413 29 004 949 20 361 843 71 608 205Zambia 1 480 8 716 467 3.42 3.78 4 3.68 8 838 736 7 336 175 7 483 755 23 658 666Zimbabwe 820 8 546 133 2.26 2.06 2.12 - - - -
Total East and Southern Africa 190 724 602 203 584 509 188 437 392 582 746 503
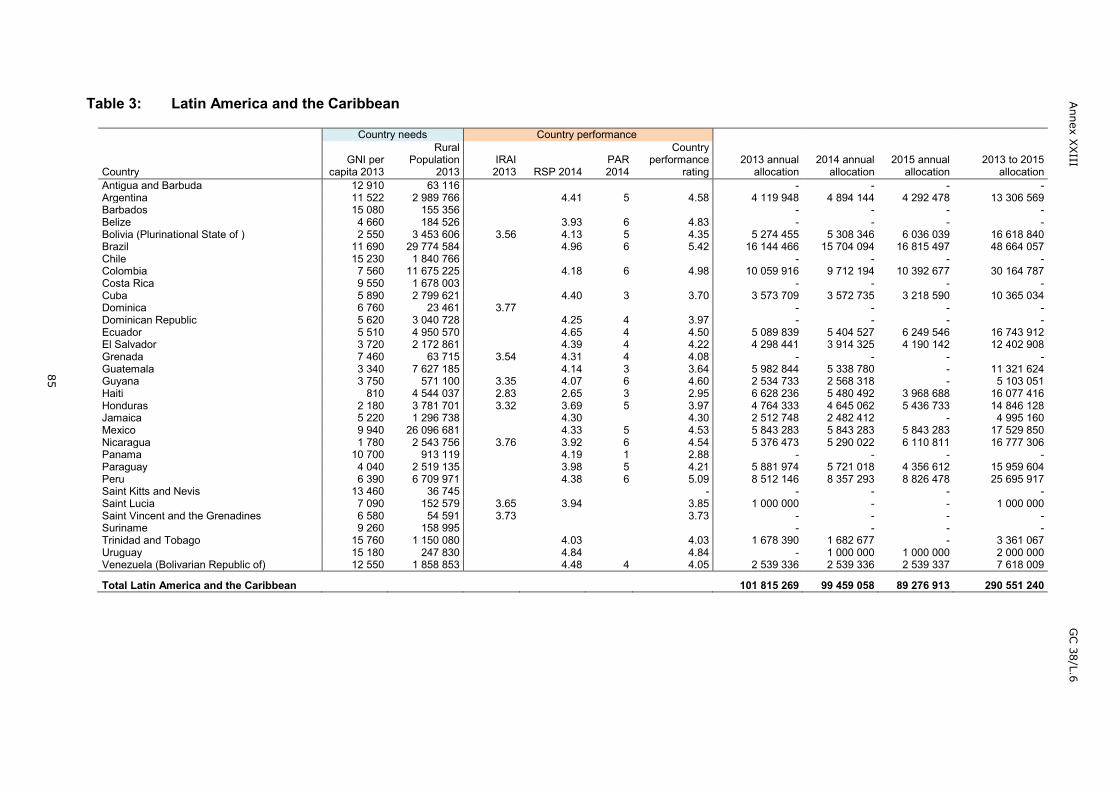
85
Annex X
XIII
GC 38/L.6
85
Table 3: Latin America and the Caribbean
Country needs Country performance
CountryGNI per
capita 2013
RuralPopulation
2013IRAI2013 RSP 2014
PAR2014
Countryperformance
rating2013 annual
allocation2014 annual
allocation2015 annual
allocation2013 to 2015
allocationAntigua and Barbuda 12 910 63 116 - - - -Argentina 11 522 2 989 766 4.41 5 4.58 4 119 948 4 894 144 4 292 478 13 306 569Barbados 15 080 155 356 - - - -Belize 4 660 184 526 3.93 6 4.83 - - - -Bolivia (Plurinational State of ) 2 550 3 453 606 3.56 4.13 5 4.35 5 274 455 5 308 346 6 036 039 16 618 840Brazil 11 690 29 774 584 4.96 6 5.42 16 144 466 15 704 094 16 815 497 48 664 057Chile 15 230 1 840 766 - - - -Colombia 7 560 11 675 225 4.18 6 4.98 10 059 916 9 712 194 10 392 677 30 164 787Costa Rica 9 550 1 678 003 - - - -Cuba 5 890 2 799 621 4.40 3 3.70 3 573 709 3 572 735 3 218 590 10 365 034Dominica 6 760 23 461 3.77 - - - -Dominican Republic 5 620 3 040 728 4.25 4 3.97 - - - -Ecuador 5 510 4 950 570 4.65 4 4.50 5 089 839 5 404 527 6 249 546 16 743 912El Salvador 3 720 2 172 861 4.39 4 4.22 4 298 441 3 914 325 4 190 142 12 402 908Grenada 7 460 63 715 3.54 4.31 4 4.08 - - - -Guatemala 3 340 7 627 185 4.14 3 3.64 5 982 844 5 338 780 - 11 321 624Guyana 3 750 571 100 3.35 4.07 6 4.60 2 534 733 2 568 318 - 5 103 051Haiti 810 4 544 037 2.83 2.65 3 2.95 6 628 236 5 480 492 3 968 688 16 077 416Honduras 2 180 3 781 701 3.32 3.69 5 3.97 4 764 333 4 645 062 5 436 733 14 846 128Jamaica 5 220 1 296 738 4.30 4.30 2 512 748 2 482 412 - 4 995 160Mexico 9 940 26 096 681 4.33 5 4.53 5 843 283 5 843 283 5 843 283 17 529 850Nicaragua 1 780 2 543 756 3.76 3.92 6 4.54 5 376 473 5 290 022 6 110 811 16 777 306Panama 10 700 913 119 4.19 1 2.88 - - - -Paraguay 4 040 2 519 135 3.98 5 4.21 5 881 974 5 721 018 4 356 612 15 959 604Peru 6 390 6 709 971 4.38 6 5.09 8 512 146 8 357 293 8 826 478 25 695 917Saint Kitts and Nevis 13 460 36 745 - - - - -Saint Lucia 7 090 152 579 3.65 3.94 3.85 1 000 000 - - 1 000 000Saint Vincent and the Grenadines 6 580 54 591 3.73 3.73 - - - -Suriname 9 260 158 995 - - - -Trinidad and Tobago 15 760 1 150 080 4.03 4.03 1 678 390 1 682 677 - 3 361 067Uruguay 15 180 247 830 4.84 4.84 - 1 000 000 1 000 000 2 000 000Venezuela (Bolivarian Republic of) 12 550 1 858 853 4.48 4 4.05 2 539 336 2 539 336 2 539 337 7 618 009
Total Latin America and the Caribbean 101 815 269 99 459 058 89 276 913 290 551 240
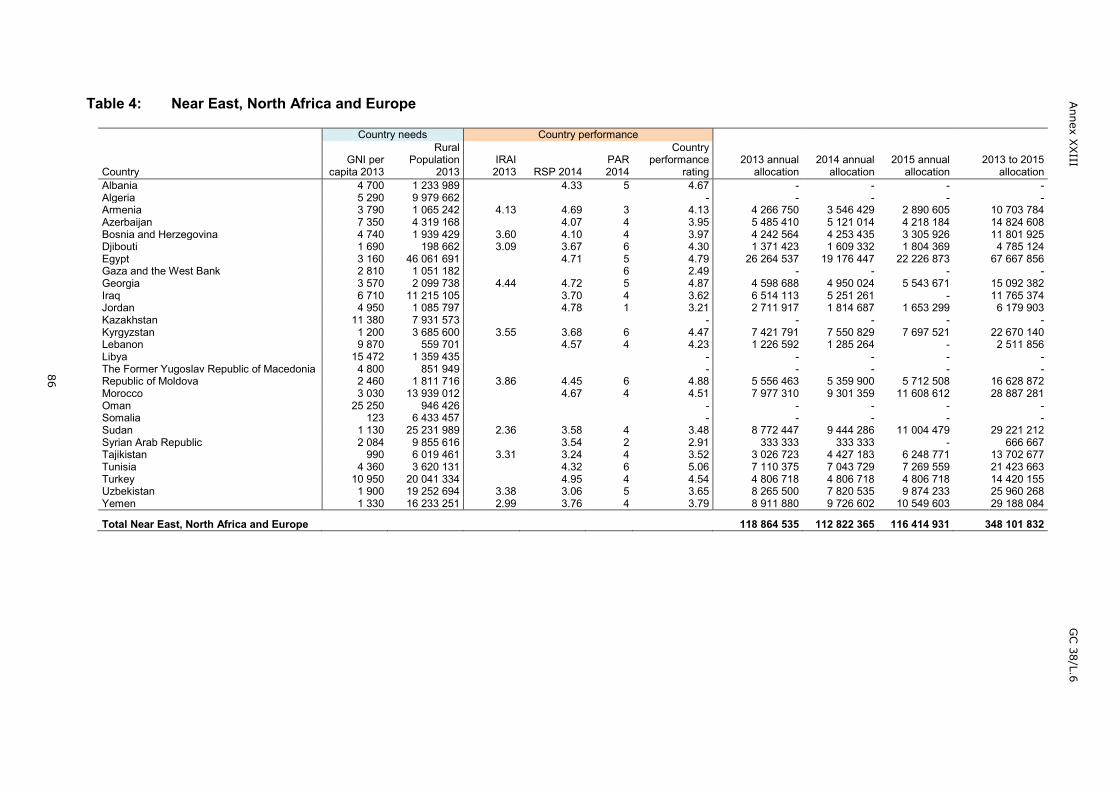
86
Annex X
XIII
GC 38/L.6
86
Table 4: Near East, North Africa and Europe
Country needs Country performance
CountryGNI per
capita 2013
RuralPopulation
2013IRAI2013 RSP 2014
PAR2014
Countryperformance
rating2013 annual
allocation2014 annual
allocation2015 annual
allocation2013 to 2015
allocationAlbania 4 700 1 233 989 4.33 5 4.67 - - - -Algeria 5 290 9 979 662 - - - - -Armenia 3 790 1 065 242 4.13 4.69 3 4.13 4 266 750 3 546 429 2 890 605 10 703 784Azerbaijan 7 350 4 319 168 4.07 4 3.95 5 485 410 5 121 014 4 218 184 14 824 608Bosnia and Herzegovina 4 740 1 939 429 3.60 4.10 4 3.97 4 242 564 4 253 435 3 305 926 11 801 925Djibouti 1 690 198 662 3.09 3.67 6 4.30 1 371 423 1 609 332 1 804 369 4 785 124Egypt 3 160 46 061 691 4.71 5 4.79 26 264 537 19 176 447 22 226 873 67 667 856Gaza and the West Bank 2 810 1 051 182 6 2.49 - - - -Georgia 3 570 2 099 738 4.44 4.72 5 4.87 4 598 688 4 950 024 5 543 671 15 092 382Iraq 6 710 11 215 105 3.70 4 3.62 6 514 113 5 251 261 - 11 765 374Jordan 4 950 1 085 797 4.78 1 3.21 2 711 917 1 814 687 1 653 299 6 179 903Kazakhstan 11 380 7 931 573 - - - - -Kyrgyzstan 1 200 3 685 600 3.55 3.68 6 4.47 7 421 791 7 550 829 7 697 521 22 670 140Lebanon 9 870 559 701 4.57 4 4.23 1 226 592 1 285 264 - 2 511 856Libya 15 472 1 359 435 - - - - -The Former Yugoslav Republic of Macedonia 4 800 851 949 - - - - -Republic of Moldova 2 460 1 811 716 3.86 4.45 6 4.88 5 556 463 5 359 900 5 712 508 16 628 872Morocco 3 030 13 939 012 4.67 4 4.51 7 977 310 9 301 359 11 608 612 28 887 281Oman 25 250 946 426 - - - - -Somalia 123 6 433 457 - - - - -Sudan 1 130 25 231 989 2.36 3.58 4 3.48 8 772 447 9 444 286 11 004 479 29 221 212Syrian Arab Republic 2 084 9 855 616 3.54 2 2.91 333 333 333 333 - 666 667Tajikistan 990 6 019 461 3.31 3.24 4 3.52 3 026 723 4 427 183 6 248 771 13 702 677Tunisia 4 360 3 620 131 4.32 6 5.06 7 110 375 7 043 729 7 269 559 21 423 663Turkey 10 950 20 041 334 4.95 4 4.54 4 806 718 4 806 718 4 806 718 14 420 155Uzbekistan 1 900 19 252 694 3.38 3.06 5 3.65 8 265 500 7 820 535 9 874 233 25 960 268Yemen 1 330 16 233 251 2.99 3.76 4 3.79 8 911 880 9 726 602 10 549 603 29 188 084
Total Near East, North Africa and Europe 118 864 535 112 822 365 116 414 931 348 101 832

87
Annex X
XIII
GC 38/L.6
87
Table 5: West and Central Africa
Country needs Country performance
CountryGNI per
capita 2013
RuralPopulation
2013IRAI2013 RSP 2014
PAR2014
Countryperformance
rating2013 annual
allocation2014 annual
allocation2015 annual
allocation2013 to 2015
allocationBenin 790 5 553 017 3.51 3.94 4 4.01 8 472 775 7 093 218 8 511 333 24 077 326Burkina Faso 670 12 160 400 3.77 3.94 3 3.58 9 661 338 9 069 637 9 764 319 28 495 295Cameroon 1 270 10 407 954 3.23 3.68 5 3.87 7 987 112 8 003 167 9 340 955 25 331 234Cabo Verde 3 630 179 255 3.94 4.66 6 4.98 1 862 957 1 782 310 1 912 661 5 557 928Central African Republic 320 2 788 140 2.50 2.44 3 2.79 3 871 084 3 257 647 - 7 128 732Chad 1 020 10 002 437 2.60 2.96 5 3.71 5 750 928 6 954 180 8 433 495 21 138 603Congo 2 660 1 578 812 3.04 3.37 4 3.63 2 540 612 2 832 431 2 917 486 8 290 530Côte d'Ivoire 1 380 9 604 348 3.18 3.04 3 3.09 8 884 294 6 034 821 5 476 540 20 395 655Democratic Republic of the Congo 400 43 625 313 2.88 3.44 1 2.55 12 300 642 12 300 642 12 300 642 36 901 926Equatorial Guinea 14 320 455 249 3.16 3.16 - - - -Gabon 10 650 221 211 3.69 4 3.82 - - - -Gambia (The) 510 770 908 3.27 4.05 6 4.58 4 483 524 4 796 222 4 951 852 14 231 599Ghana 1 760 12 129 776 3.68 4.11 6 4.69 11 782 474 12 677 288 13 489 764 37 949 526Guinea 460 7 466 182 2.97 3.05 6 4.16 7 710 439 10 273 185 11 681 221 29 664 844Guinea-Bissau 520 933 042 2.53 2.54 5 3.31 3 355 277 3 304 222 2 810 412 9 469 911Liberia 410 2 192 358 3.13 3.35 6 4.23 6 909 936 6 875 317 7 337 714 21 122 967Mali 670 9 758 872 3.38 3.87 3 3.54 11 137 965 8 618 591 8 664 986 28 421 542Mauritania 1 060 2 253 407 3.29 3.59 5 4.13 4 869 463 4 644 181 5 304 125 14 817 768Niger 410 14 555 095 3.46 3.54 6 4.39 14 341 377 16 205 573 18 013 090 48 560 040Nigeria 2 760 85 343 053 3.58 3.07 4 3.64 29 495 460 25 272 162 17 463 305 72 230 927Sao Tome and Principe 1 470 69 528 3.05 3.41 6 4.25 1 000 000 1 014 958 1 079 390 3 094 348Senegal 1 070 8 031 180 3.82 4.01 6 4.67 11 562 125 11 996 119 12 594 915 36 153 160Sierra Leone 680 3 654 307 3.27 3.79 5 4.11 9 538 724 8 444 443 7 482 764 25 465 930Togo 530 4 158 768 2.97 3.15 4 3.41 6 975 917 7 320 877 5 808 178 20 104 973
Total West and Central Africa 184 494 424 178 771 192 175 339 149 538 604 765
Total IFAD 876 000 000 876 000 000 876 000 000 2 628 000 000
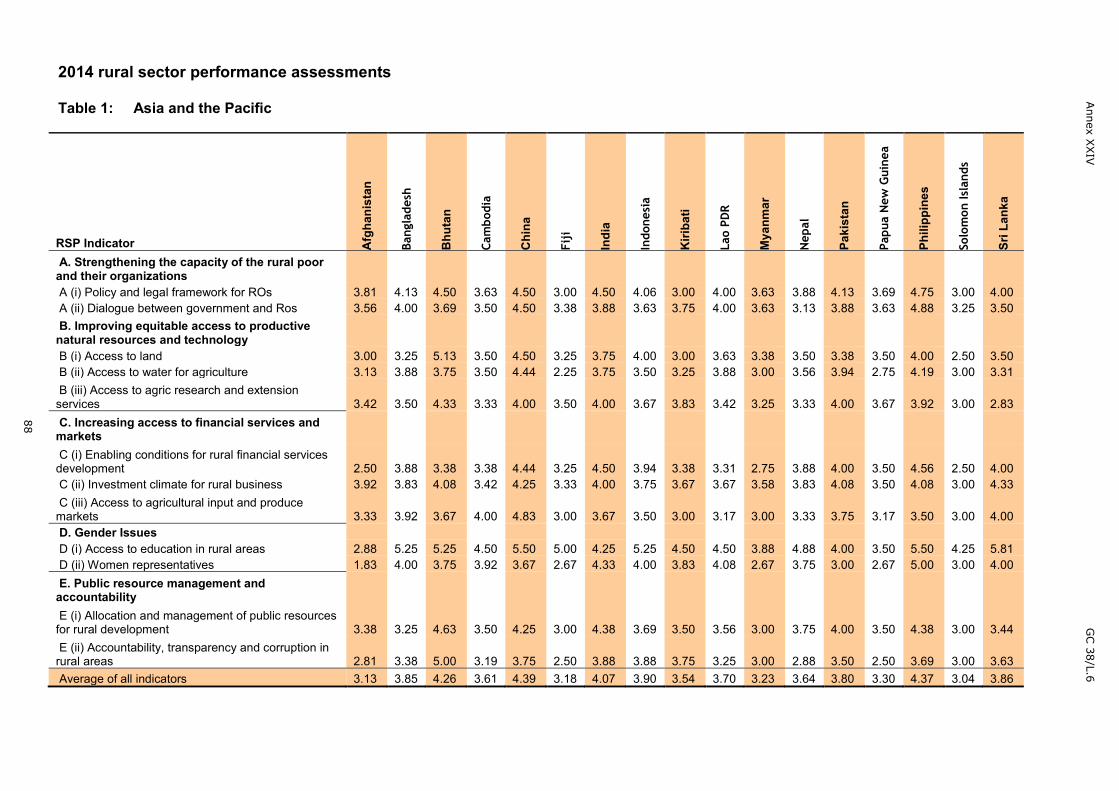
88
Annex
XXIV
GC 38/L.6
88
2014 rural sector performance assessments
Table 1: Asia and the Pacific
RSP Indicator Afg
hani
stan
Bang
lade
sh
Bhu
tan
Cam
bodi
a
Chi
na
Fiji
Indi
a
Indo
nesi
a
Kiri
bati
Lao
PDR
Mya
nmar
Nep
al
Paki
stan
Papu
a N
ew G
uine
a
Phili
ppin
es
Solo
mon
Isla
nds
Sri L
anka
A. Strengthening the capacity of the rural poorand their organizationsA (i) Policy and legal framework for ROs 3.81 4.13 4.50 3.63 4.50 3.00 4.50 4.06 3.00 4.00 3.63 3.88 4.13 3.69 4.75 3.00 4.00A (ii) Dialogue between government and Ros 3.56 4.00 3.69 3.50 4.50 3.38 3.88 3.63 3.75 4.00 3.63 3.13 3.88 3.63 4.88 3.25 3.50B. Improving equitable access to productive
natural resources and technologyB (i) Access to land 3.00 3.25 5.13 3.50 4.50 3.25 3.75 4.00 3.00 3.63 3.38 3.50 3.38 3.50 4.00 2.50 3.50B (ii) Access to water for agriculture 3.13 3.88 3.75 3.50 4.44 2.25 3.75 3.50 3.25 3.88 3.00 3.56 3.94 2.75 4.19 3.00 3.31B (iii) Access to agric research and extension
services 3.42 3.50 4.33 3.33 4.00 3.50 4.00 3.67 3.83 3.42 3.25 3.33 4.00 3.67 3.92 3.00 2.83C. Increasing access to financial services and
marketsC (i) Enabling conditions for rural financial services
development 2.50 3.88 3.38 3.38 4.44 3.25 4.50 3.94 3.38 3.31 2.75 3.88 4.00 3.50 4.56 2.50 4.00C (ii) Investment climate for rural business 3.92 3.83 4.08 3.42 4.25 3.33 4.00 3.75 3.67 3.67 3.58 3.83 4.08 3.50 4.08 3.00 4.33C (iii) Access to agricultural input and produce
markets 3.33 3.92 3.67 4.00 4.83 3.00 3.67 3.50 3.00 3.17 3.00 3.33 3.75 3.17 3.50 3.00 4.00D. Gender IssuesD (i) Access to education in rural areas 2.88 5.25 5.25 4.50 5.50 5.00 4.25 5.25 4.50 4.50 3.88 4.88 4.00 3.50 5.50 4.25 5.81D (ii) Women representatives 1.83 4.00 3.75 3.92 3.67 2.67 4.33 4.00 3.83 4.08 2.67 3.75 3.00 2.67 5.00 3.00 4.00E. Public resource management and
accountabilityE (i) Allocation and management of public resources
for rural development 3.38 3.25 4.63 3.50 4.25 3.00 4.38 3.69 3.50 3.56 3.00 3.75 4.00 3.50 4.38 3.00 3.44E (ii) Accountability, transparency and corruption in
rural areas 2.81 3.38 5.00 3.19 3.75 2.50 3.88 3.88 3.75 3.25 3.00 2.88 3.50 2.50 3.69 3.00 3.63Average of all indicators 3.13 3.85 4.26 3.61 4.39 3.18 4.07 3.90 3.54 3.70 3.23 3.64 3.80 3.30 4.37 3.04 3.86

89
Annex
XXIV
GC 38/L.6
89
Table 1: Asia and the Pacific (cont.)
RSP Indicator Thai
land
Tim
or-L
este
Vie
t N
am
Reg
iona
l ave
rage
A. Strengthening the capacity of the rural poorand their organizationsA (i) Policy and legal framework for ROs 5.25 3.25 4.56 3.96A (ii) Dialogue between government and Ros 4.50 3.00 4.06 3.77B. Improving equitable access to productive
natural resources and technologyB (i) Access to land 4.75 2.56 4.00 3.60B (ii) Access to water for agriculture 4.25 2.44 4.50 3.51B (iii) Access to agric research and extension
services 4.50 3.58 4.67 3.69C. Increasing access to financial services and
marketsC (i) Enabling conditions for rural financial services
development 5.00 2.69 4.25 3.65C (ii) Investment climate for rural business 5.00 2.75 4.67 3.84C (iii) Access to agricultural input and produce
markets 5.00 2.67 3.83 3.57D. Gender IssuesD (i) Access to education in rural areas 5.25 4.63 5.25 4.69D (ii) Women representatives 3.33 3.67 4.67 3.59E. Public resource management and
accountabilityE (i) Allocation and management of public resources
for rural development 4.63 2.75 4.13 3.68E (ii) Accountability, transparency and corruption in
rural areas 3.75 3.06 4.00 3.42Average of all indicators 4.60 3.09 4.38 3.75

90
Annex
XXIV
GC 38/L.6
90
Table 2: East and Southern Africa
RSP Indicator Ang
ola
Bur
undi
Com
oros
Ethi
opia
Ken
ya
Leso
tho
Mad
agas
car
Mal
awi
Mau
ritiu
s
Moz
ambi
que
Rw
anda
Seyc
helle
s
Sout
h A
fric
a
Sout
h Su
dan
Swaz
iland
Tanz
ania
Uga
nda
Zam
bia
Reg
iona
lav
erag
e
A. Strengthening the capacity of the rural poorand their organizationsA (i) Policy and legal framework for ROs 3.00 3.50 3.00 4.00 4.75 4.00 4.25 4.25 4.50 4.25 4.75 4.50 4.25 2.50 4.25 4.50 4.50 3.75 4.03A (ii) Dialogue between government and ROs 3.00 4.00 3.00 3.00 4.00 4.00 4.00 3.50 4.50 4.00 5.00 4.50 4.00 2.00 3.75 4.50 4.25 4.00 3.83B. Improving equitable access to productive
natural resources and technologyB (i) Access to land 4.00 3.50 3.50 4.75 4.00 3.75 3.75 3.75 4.75 4.00 4.75 4.50 4.00 3.00 3.75 4.25 4.75 3.50 4.01B (ii) Access to water for agriculture 3.50 3.75 3.00 4.50 4.00 2.75 4.25 3.75 4.50 3.75 4.75 4.25 4.00 3.00 4.25 4.00 3.75 3.50 3.85B (iii) Access to agric research and extension
services 3.00 3.33 2.67 4.00 4.33 3.67 4.33 3.67 4.00 4.33 5.00 4.33 3.33 2.00 3.33 4.33 3.33 4.00 3.72C. Increasing access to financial services and
marketsC (i) Enabling conditions for rural financial services
development 3.25 3.25 4.25 4.25 4.00 4.00 4.00 3.00 5.00 3.25 4.25 3.75 4.00 2.25 4.00 4.00 4.00 4.00 3.81C (ii) Investment climate for rural business 3.00 3.33 2.33 3.67 4.33 4.00 4.00 3.33 5.33 3.67 4.67 4.33 4.67 3.67 4.00 4.00 4.00 4.00 3.91C (iii) Access to agricultural input and produce
markets 3.33 3.00 3.00 4.00 4.00 3.33 3.33 3.33 6.00 4.00 4.67 4.00 3.67 2.00 4.00 4.00 4.00 4.00 3.76D. Gender IssuesD (i) Access to education in rural areas 4.00 3.75 3.00 4.75 4.50 5.00 4.75 4.00 6.00 3.00 5.00 5.25 4.00 2.00 4.25 4.50 5.00 4.00 4.26D (ii) Women representatives 3.33 3.67 2.33 3.67 4.00 4.00 4.00 4.00 5.33 4.33 4.67 4.67 5.00 2.33 4.33 4.00 4.33 3.33 3.96E. Public resource management and
accountabilityE (i) Allocation and management of public
resources for rural development 3.75 3.50 2.25 4.75 4.00 3.50 3.00 3.25 5.50 4.00 4.75 4.50 4.25 2.25 3.75 4.00 4.25 3.25 3.81E (ii) Accountability, transparency and corruption in
rural areas 3.00 3.50 3.00 4.00 4.00 4.00 3.50 3.75 5.00 3.50 4.75 5.00 4.00 2.25 4.00 4.00 3.75 4.00 3.83Average of all indicators 3.35 3.51 2.94 4.11 4.16 3.83 3.93 3.63 5.03 3.84 4.75 4.47 4.10 2.44 3.97 4.17 4.16 3.78 3.90
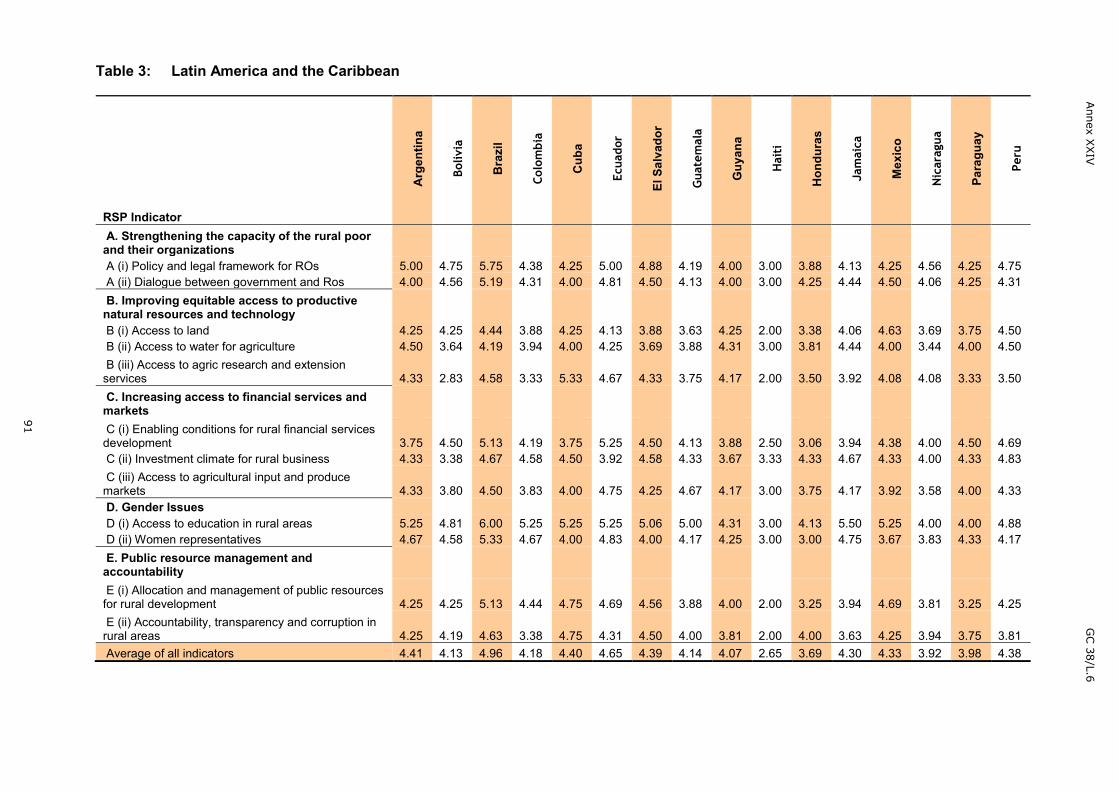
91
Annex
XXIV
GC 38/L.6
91
Table 3: Latin America and the Caribbean
RSP Indicator
Arg
entin
a
Boliv
ia
Bra
zil
Colo
mbi
a
Cub
a
Ecua
dor
El S
alva
dor
Gua
tem
ala
Guy
ana
Hai
ti
Hon
dura
s
Jam
aica
Mex
ico
Nic
arag
ua
Para
guay
Peru
A. Strengthening the capacity of the rural poorand their organizationsA (i) Policy and legal framework for ROs 5.00 4.75 5.75 4.38 4.25 5.00 4.88 4.19 4.00 3.00 3.88 4.13 4.25 4.56 4.25 4.75A (ii) Dialogue between government and Ros 4.00 4.56 5.19 4.31 4.00 4.81 4.50 4.13 4.00 3.00 4.25 4.44 4.50 4.06 4.25 4.31B. Improving equitable access to productive
natural resources and technologyB (i) Access to land 4.25 4.25 4.44 3.88 4.25 4.13 3.88 3.63 4.25 2.00 3.38 4.06 4.63 3.69 3.75 4.50B (ii) Access to water for agriculture 4.50 3.64 4.19 3.94 4.00 4.25 3.69 3.88 4.31 3.00 3.81 4.44 4.00 3.44 4.00 4.50B (iii) Access to agric research and extension
services 4.33 2.83 4.58 3.33 5.33 4.67 4.33 3.75 4.17 2.00 3.50 3.92 4.08 4.08 3.33 3.50C. Increasing access to financial services and
marketsC (i) Enabling conditions for rural financial services
development 3.75 4.50 5.13 4.19 3.75 5.25 4.50 4.13 3.88 2.50 3.06 3.94 4.38 4.00 4.50 4.69C (ii) Investment climate for rural business 4.33 3.38 4.67 4.58 4.50 3.92 4.58 4.33 3.67 3.33 4.33 4.67 4.33 4.00 4.33 4.83C (iii) Access to agricultural input and produce
markets 4.33 3.80 4.50 3.83 4.00 4.75 4.25 4.67 4.17 3.00 3.75 4.17 3.92 3.58 4.00 4.33D. Gender IssuesD (i) Access to education in rural areas 5.25 4.81 6.00 5.25 5.25 5.25 5.06 5.00 4.31 3.00 4.13 5.50 5.25 4.00 4.00 4.88D (ii) Women representatives 4.67 4.58 5.33 4.67 4.00 4.83 4.00 4.17 4.25 3.00 3.00 4.75 3.67 3.83 4.33 4.17E. Public resource management and
accountabilityE (i) Allocation and management of public resources
for rural development 4.25 4.25 5.13 4.44 4.75 4.69 4.56 3.88 4.00 2.00 3.25 3.94 4.69 3.81 3.25 4.25E (ii) Accountability, transparency and corruption in
rural areas 4.25 4.19 4.63 3.38 4.75 4.31 4.50 4.00 3.81 2.00 4.00 3.63 4.25 3.94 3.75 3.81Average of all indicators 4.41 4.13 4.96 4.18 4.40 4.65 4.39 4.14 4.07 2.65 3.69 4.30 4.33 3.92 3.98 4.38
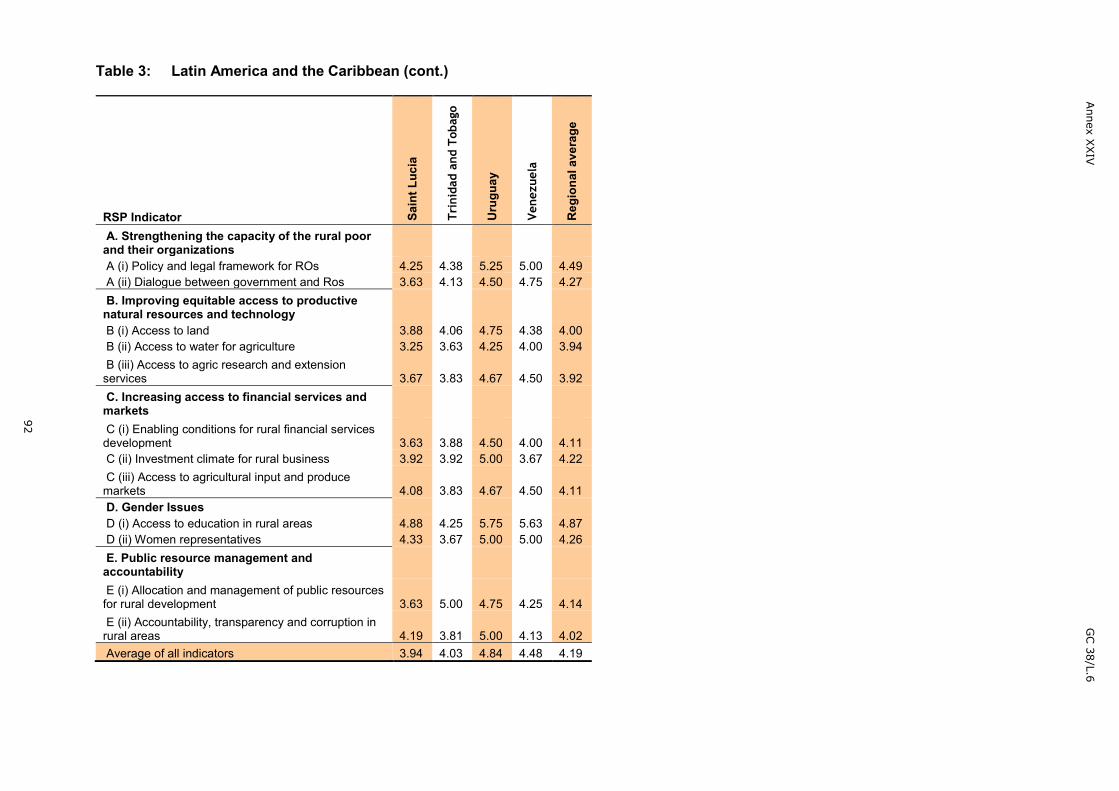
92
Annex
XXIV
GC 38/L.6
92
Table 3: Latin America and the Caribbean (cont.)
RSP Indicator Sain
t Luc
ia
Trin
idad
and
Tob
ago
Uru
guay
Ven
ezue
la
Reg
iona
l ave
rage
A. Strengthening the capacity of the rural poorand their organizationsA (i) Policy and legal framework for ROs 4.25 4.38 5.25 5.00 4.49A (ii) Dialogue between government and Ros 3.63 4.13 4.50 4.75 4.27B. Improving equitable access to productive
natural resources and technologyB (i) Access to land 3.88 4.06 4.75 4.38 4.00B (ii) Access to water for agriculture 3.25 3.63 4.25 4.00 3.94B (iii) Access to agric research and extension
services 3.67 3.83 4.67 4.50 3.92C. Increasing access to financial services and
marketsC (i) Enabling conditions for rural financial services
development 3.63 3.88 4.50 4.00 4.11C (ii) Investment climate for rural business 3.92 3.92 5.00 3.67 4.22C (iii) Access to agricultural input and produce
markets 4.08 3.83 4.67 4.50 4.11D. Gender IssuesD (i) Access to education in rural areas 4.88 4.25 5.75 5.63 4.87D (ii) Women representatives 4.33 3.67 5.00 5.00 4.26E. Public resource management and
accountabilityE (i) Allocation and management of public resources
for rural development 3.63 5.00 4.75 4.25 4.14E (ii) Accountability, transparency and corruption in
rural areas 4.19 3.81 5.00 4.13 4.02Average of all indicators 3.94 4.03 4.84 4.48 4.19

93
Annex
XXIV
GC 38/L.6
93
Table 4: Near East, North Africa and Europe
RSP Indicator Arm
enia
Aze
rbai
jan
Bos
nia
and
Her
zego
vina
Dji
bout
i
Egyp
t
Geo
rgia
Iraq
Jord
an
Kyr
gyzs
tan
Leba
non
Mol
dova
Mor
occo
Suda
n
Syri
a
Tajik
ista
n
Tuni
sia
A. Strengthening the capacity of the rural poorand their organizationsA (i) Policy and legal framework for ROs 5.00 3.50 4.63 4.00 5.00 5.00 4.00 5.00 4.00 4.25 4.50 5.38 3.75 3.88 2.75 4.50A (ii) Dialogue between government and Ros 4.25 3.50 4.38 3.25 4.75 4.50 3.88 4.00 4.25 4.00 4.25 5.00 3.50 2.50 2.50 4.00B. Improving equitable access to productive
natural resources and technologyB (i) Access to land 5.00 4.50 4.00 3.75 5.00 4.75 3.88 5.00 3.50 4.13 4.50 4.50 3.63 4.38 3.25 4.25B (ii) Access to water for agriculture 4.75 4.25 3.88 3.75 4.50 4.25 3.50 4.75 3.25 4.38 4.00 4.63 4.13 4.63 3.25 4.63B (iii) Access to agric research and extension
services 4.67 4.00 3.50 3.00 4.67 3.67 3.33 5.00 3.33 5.00 4.00 4.67 3.83 3.83 2.67 3.50C. Increasing access to financial services and
marketsC (i) Enabling conditions for rural financial services
development 4.75 4.25 4.00 4.38 5.50 4.00 3.50 5.00 3.50 4.38 4.00 5.00 3.75 3.25 3.75 3.75C (ii) Investment climate for rural business 5.33 4.67 4.00 4.17 4.83 5.33 3.83 5.00 4.33 5.00 4.50 4.50 3.50 3.33 3.33 4.33C (iii) Access to agricultural input and produce
markets 4.67 3.67 3.83 4.00 4.50 4.67 3.00 5.33 3.00 4.67 4.33 4.50 4.00 3.33 2.67 4.67D. Gender IssuesD (i) Access to education in rural areas 5.50 5.00 4.63 4.00 4.25 5.50 3.88 5.50 4.75 5.50 5.50 4.50 3.50 3.75 4.75 5.50D (ii) Women representatives 4.33 4.00 4.50 4.00 4.50 5.00 3.67 4.00 4.00 4.67 5.00 4.00 3.25 3.33 3.67 4.00E. Public resource management and
accountabilityE (i) Allocation and management of public resources
for rural development 4.50 4.25 4.00 2.75 4.50 5.00 4.13 4.25 3.00 4.63 4.63 4.75 3.13 2.75 3.25 4.63E (ii) Accountability, transparency and corruption in
rural areas 3.50 3.25 3.88 3.00 4.50 5.00 3.88 4.50 3.25 4.25 4.25 4.63 3.00 3.50 3.00 4.13Average of all indicators 4.69 4.07 4.10 3.67 4.71 4.72 3.70 4.78 3.68 4.57 4.45 4.67 3.58 3.54 3.24 4.32

94
Annex
XXIV
GC 38/L.6
94
Table 4: Near East, North Africa and Europe (cont.)
RSP Indicator Turk
ey
Uzb
ekis
tan
Yem
en
Regi
onal
ave
rage
A. Strengthening the capacity of the rural poorand their organizationsA (i) Policy and legal framework for ROs 5.25 2.50 4.50 4.28A (ii) Dialogue between government and Ros 5.75 2.50 4.50 3.96B. Improving equitable access to productive
natural resources and technologyB (i) Access to land 5.00 2.75 4.00 4.20B (ii) Access to water for agriculture 5.00 3.50 4.00 4.16B (iii) Access to agric research and extension
services 5.00 3.00 4.00 3.93C. Increasing access to financial services and
marketsC (i) Enabling conditions for rural financial services
development 4.25 3.00 3.00 4.05C (ii) Investment climate for rural business 5.67 2.67 4.00 4.33C (iii) Access to agricultural input and produce
markets 5.00 3.33 4.33 4.08D. Gender IssuesD (i) Access to education in rural areas 4.50 4.25 3.00 4.62D (ii) Women representatives 4.00 3.00 3.00 4.00E. Public resource management and
accountabilityE (i) Allocation and management of public resources
for rural development 5.00 3.50 3.75 4.02E (ii) Accountability, transparency and corruption in
rural areas 5.00 2.75 3.00 3.80Average of all indicators 4.95 3.06 3.76 4.12

95
Annex
XXIV
GC 38/L.6
95
Table 5: West and Central Africa
RSP Indicator Ben
in
Bur
kina
Fas
o
Cab
o Ve
rde
Cam
eroo
n
Cen
tral
Afr
ican
Rep
ublic
Chad
Con
go
Côte
d'Iv
oire
DR
Con
go
Gam
bia
(The
)
Gha
na
Gui
nea
Gui
nea-
Bis
sau
Libe
ria
Mal
i
Mau
rita
nia
A. Strengthening the capacity of the rural poorand their organizationsA (i) Policy and legal framework for ROs 4.38 5.00 6.00 4.25 2.75 3.25 4.00 3.25 4.50 4.80 4.25 4.50 3.50 3.25 4.50 4.50A (ii) Dialogue between government and Ros 4.63 5.00 5.25 4.25 2.38 3.13 3.50 3.00 4.63 4.15 3.75 4.00 2.00 3.19 4.50 4.25B. Improving equitable access to productive
natural resources and technologyB (i) Access to land 3.00 3.00 4.00 3.50 1.50 2.50 3.31 3.00 3.38 3.88 4.00 2.00 2.00 2.88 3.38 3.00B (ii) Access to water for agriculture 4.00 4.25 5.50 4.00 2.63 3.75 3.50 3.00 3.88 4.60 4.50 2.25 2.50 2.81 4.00 4.00B (iii) Access to agric research and extension
services 4.50 4.50 4.33 4.08 3.00 3.17 3.17 3.00 3.50 4.30 4.00 3.67 3.00 3.17 3.67 4.00C. Increasing access to financial services and
marketsC (i) Enabling conditions for rural financial services
development 3.25 3.00 4.00 3.25 2.50 3.38 3.00 3.00 3.06 3.95 4.00 2.50 2.50 2.81 3.50 2.63C (ii) Investment climate for rural business 3.50 3.50 4.33 3.50 2.00 2.50 3.50 3.00 2.00 3.90 4.00 2.67 2.50 4.58 3.83 3.00C (iii) Access to agricultural input and produce
markets 4.00 4.50 5.00 3.83 2.50 3.33 3.67 3.25 3.67 4.32 4.33 3.00 3.00 3.00 4.17 4.00D. Gender IssuesD (i) Access to education in rural areas 4.50 3.50 4.50 4.31 2.50 3.00 3.25 3.50 3.63 4.70 5.00 3.50 2.50 4.00 3.50 3.50D (ii) Women representatives 4.50 3.50 4.50 3.50 2.50 3.00 3.67 3.00 3.17 3.87 4.00 3.00 2.50 3.50 3.67 4.00E. Public resource management and
accountabilityE (i) Allocation and management of public
resources for rural development 3.50 4.00 4.00 3.63 2.50 2.50 3.00 2.50 3.19 3.63 3.50 3.00 2.50 2.75 4.00 3.50E (ii) Accountability, transparency and corruption in
rural areas 3.50 3.50 4.50 2.00 2.50 2.00 2.88 3.00 2.75 2.55 4.00 2.50 2.00 4.25 3.75 2.75Average of all indicators 3.94 3.94 4.66 3.68 2.44 2.96 3.37 3.04 3.44 4.05 4.11 3.05 2.54 3.35 3.87 3.59

96
Annex
XXIV
GC 38/L.6
96
Table 5: West and Central Africa (cont.)
RSP Indicator Nig
er
Nig
eria
Sao
Tom
e an
dPr
inci
pe
Sene
gal
Sier
ra L
eone
Togo
Reg
iona
lav
erag
e
A. Strengthening the capacity of the rural poorand their organizationsA (i) Policy and legal framework for ROs 4.63 3.50 4.75 4.88 4.00 3.25 4.17A (ii) Dialogue between government and Ros 3.88 3.30 4.00 5.00 3.75 3.50 3.87B. Improving equitable access to productive
natural resources and technologyB (i) Access to land 3.00 3.50 3.50 3.50 3.00 3.00 3.08B (ii) Access to water for agriculture 3.25 2.25 2.50 4.00 3.63 3.50 3.56B (iii) Access to agric research and extension
services 4.00 2.67 3.50 4.15 4.00 3.50 3.68C. Increasing access to financial services and
marketsC (i) Enabling conditions for rural financial services
development 3.00 2.50 2.50 3.50 4.13 3.00 3.13C (ii) Investment climate for rural business 3.00 3.67 3.20 4.00 3.83 3.00 3.32C (iii) Access to agricultural input and produce
markets 4.00 2.67 3.50 4.58 3.67 3.00 3.68D. Gender IssuesD (i) Access to education in rural areas 3.50 3.25 3.50 4.00 4.25 3.50 3.70D (ii) Women representatives 2.50 4.00 3.50 3.50 4.00 3.00 3.47E. Public resource management and
accountabilityE (i) Allocation and management of public resources
for rural development 4.00 2.50 3.00 3.50 3.50 3.00 3.24E (ii) Accountability, transparency and corruption in
rural areas 3.75 3.00 3.50 3.50 3.75 2.50 3.11Average of all indicators 3.54 3.07 3.41 4.01 3.79 3.15 3.50

Annex XXV GC 38/L.6
97
2015 Debt Sustainability Framework traffic lights
Red (100 per cent grant financing) Yellow (50 per cent grant, 50 per cent highlyconcessional)
Green
Afghanistan
Burundi
Central African Republic
Chad
Comoros
Democratic Republic of theCongo
Haiti
Kiribati
Maldives
Marshall Islands
Mauritania
Samoa
Sao Tome and Principe
Sudan
Burkina Faso
Côte d'Ivoire
Gambia (The)
Guinea
Guinea-Bissau
Kyrgyzstan
Lao People's Democratic Republic
Malawi
Mali
Mozambique
Nicaragua
Niger
Sierra Leone
Solomon Islands
South Sudan
Tajikistan
Togo
Tonga
Yemen
All othercountries