ieee transactions on biomedical engineering, vol… · ieee transactions on biomedical engineering,...
TRANSCRIPT

IEEE TRANSACTIONS ON BIOMEDICAL ENGINEERING, VOL. **, NO. **, ** 1
Bag-of-words Representation for Biomedical TimeSeries Classification
Jin Wang, Ping Liu, Mary F.H.She, Saeid Nahavandi, Senior Member, IEEE, and Abbas Kouzani, Member, IEEE,
Abstract—Automatic analysis of biomedical time series suchas electroencephalogram (EEG) and electrocardiographic (ECG)signals has attracted great interest in the community of biomed-ical engineering due to its important applications in medicine.In this work, a simple yet effective bag-of-words representationthat is able to capture both local and global structure similarityinformation is proposed for biomedical time series representation.In particular, similar to the bag-of-words model used in textdocument domain, the proposed method treats a time seriesas a text document and extracts local segments from the timeseries as words. The biomedical time series is then representedas a histogram of codewords, each entry of which is thecount of a codeword appeared in the time series. Although thetemporal order of the local segments is ignored, the bag-of-wordsrepresentation is able to capture high-level structural informationbecause both local and global structural information are wellutilized. The performance of the bag-of-words model is validatedon three datasets extracted from real EEG and ECG signals. Theexperimental results demonstrate that the proposed method is notonly insensitive to parameters of the bag-of-words model such aslocal segment length and codebook size, but also robust to noise.
Index Terms—bag of words, codebook construction, clustering,time series classification.
I. INTRODUCTION
W ITH the development of modern technology and reduc-tion of hardware cost, a large amount of biomedical
signals such as electroencephalogram (EEG) and electrocar-diographic (ECG) are collected every day. These biomedi-cal signals are very useful for monitoring human’s physicalcondition. It is however a challenging task to efficiently andeffectively analyze these signals. Traditionally, these signalsare manually analyzed by professional experts. However, thereare several disadvantages of the manual analysis. Firstly,comparing to the large amount of biomedical signals, thenumber of professional experts, especially the ones withextensive experience is very limited. Secondly, inspection andmonitoring of long-term biomedical signals such as EEG andECG signals are always very time consuming. It is difficult tokeep a high level of concentration during a lengthy inspection,giving rise to an increase in the false hit rate by the operator.Finally, it is frequently needed to find inter-reader variability in
Jin Wang and Mary F.H.She are with the Center for Intelligent SystemsResearch and the Institute for Frontier Material, Deakin University, Australia.e-mail: jay.wangjin@gmail.
Ping Liu is with Department of Computer Science and Engineering,University of South Carolina, USA.
Saeid Nahavandi is with the Center for Intelligent Systems Research,Deakin University, Australia.
Abbas Kouzani is with the School of Engineering, Deakin University,Australia.
Manuscript received **; revised **.
the manual inspection and monitoring by experts. Therefore,an automated system that can assist professional experts toanalyze long-term biomedical signals is very valuable in real-word applications.
Automatic analysis of biomedical time series such as EEGand ECG signals based on machine learning techniques hasbeen applied to a variety of real-word applications. For in-stance, EEG signals are automatically analyzed for epilepticseizure detection [1] [2] [3], brain computer interaction [4] [5][6], human mental fatigue detection [7] and emotion recog-nition [8]. ECG signals that provide useful information aboutheart rhythm are used to study heart arrhythmias [9] [10]. It isessential to extract meaningful features to represent individualtime series in the aforementioned applications. Some methods[11] [12] directly describe time series in time domain whilesome others extract features from transformed domain [2] [13][10]. For instance, Zadeh et al. [12] extracted morphologicaland timing-interval features from ECG segments to classifyheartbeats. Guo et al. [2] extracted line length features basedon Discrete Wavelet Transform (DWT) to detect epileptic EEGsegments.
Most of the previous representations extract local temporalor frequency information to characterize time series, which arevery effective for short time series or time series with periodicwaveforms. However, they may have limited ability to capturestructural similarity of long time series which have repetitivebut un-periodic waveforms, for instance, Electrocardiography(ECG) and Electroencephalography (EEG) signals. In orderto capture the high-level structural information of time series,Lin [14] proposed a bag-of-patterns (BoP) representation byconverting a time series to a words string using the SymbolicAggregate approXimation (SAX). The temporal order of localsegments, i.e., local patterns, in a time series is ignored andall the local segments in the time series are histogrammed toconstruct a bag-of-patterns representation. The bag-of-patternsrepresentation is effective to capture the structural similarityof time series. However, one drawback of the bag-of-patternsrepresentation is that its dimension may be very high, whichlimits its application for large datasets. For instance, whenthe size of the alphabet τ and the number of symbols w are4 and 8, respectively, the dimension of the bag-of-patternsrepresentation could reach τw = 65536.
In this work, motivated by the success of the bag-of-words model in text document analysis [15] [16] and imageanalysis [17] [18], we propose a simple yet effective bag-of-words representation whose dimension is much lower than thebag-of-patterns representation to characterize biomedical timeseries. The bag-of-words representation is able to capture high-
arX
iv:1
212.
2262
v1 [
cs.L
G]
11
Dec
201
2

IEEE TRANSACTIONS ON BIOMEDICAL ENGINEERING, VOL. **, NO. **, ** 2
Fig. 1. The flowchart of the proposed bag-of-words approach for analysis of biomedical time series.
level structural information of time series due to the utilizationof both local and global information. Moreover, it can beused to represent streaming data and time series with differentlengths because it is incrementally constructed.
The bag-of-words model was originally developed for doc-ument representation. The basic idea is to define a codebookthat contains a set of codewords and then represent a documentas a histogram of the codewords, each entry of which is thecount of a codeword occurred in the document. Although theorder information of words is ignored, the bag-of-words modelis still very effective to capture document information becausethe frequency information of codewords in documents are wellexplored. Recently, the bag-of-words model is extended toanalyze images and videos in computer vision [17] [18]. Localpatches extracted from images or videos are treated as wordsand the codebook is constructed by clustering all the localpatches in the training data. Similar to the extension of the bag-of-words representation in computer vision, we here extend thebag-of-words representation to characterize biomedical timeseries by regarding local segments extracted from time seriesas words and treat the time series as documents.
A. Overview of the Proposed Approach
In the bag-of-words representation, a time series is treatedas a text document and local segments extracted from thetime series as words. The general flowchart of the proposedmethod is demonstrated in Fig. 1. Firstly, we continuouslyslide a window with a pre-defined length along the time seriesto extract a group of local segments. Then, we extract afeature vector from each of the local segments using DWT.Next, similar to the bag-of-visual-words model in images andvideos analysis [17] [18], all local segments from the trainingtime series are clustered by k-means clustering to create acodebook, i.e, the cluster centers are treated as codewords.Then, a local segment is assigned the codeword that has theminimum distance to the local segment, and the time seriesis represented as a histogram of the codewords. Finally, thebag-of-words representation is used as input for classification.
B. Contribution and Organization
The main contribution of the paper is twofold: (i) a simpleyet effective bag-of-words representation is proposed for anal-ysis of biomedical time series; (ii) a series of experiments wasconducted to investigate the effectiveness and robustness of thebag-of-words representation for classification of biomedicaltime series.
The structure of the paper is organized as follows. InSection II, the proposed method including the bag-of-wordsrepresentation, distance measures and classification methodis described. Section III describes the biomedical time seriesdatasets used in the experiments. Experimental results are re-ported and analyzed in Section IV. Discussion and conclusionare given in Section V and Section VI, respectively.
II. PROPOSED METHOD
In this section, we describe the bag-of-words representationfor biomedical time series classification. The bag-of-wordsrepresentation ignores the temporal order of local segmentswithin a time series and represents the time series as ahistogram of codewords i.e., local segments. Several distancemeasures are then introduced for the histograms comparison.
A. Bag-of-words Representation
The procedure of generating the bag-of-words representa-tion is illustrated in Fig. 2. We continuously slide a windowwith pre-defined length along a time series and extract agroup of local segments from the time series. A featurevector is then extracted from each of the local segments usingthe DWT to characterize the local segment. All the localsegments from the training data are clustered to construct acodebook that contains a set of codewords, i.e., the clustercenters. Then, a local segment is assigned the codeword thathas minimum distance with the local segment. The bag-of-words representation ignores the order of local segments ina time series and represent the time series as a histogram ofcodewords.

IEEE TRANSACTIONS ON BIOMEDICAL ENGINEERING, VOL. **, NO. **, ** 3
Fig. 2. The procedure of generating the bag-of-words representation. The codebook is constructed by clustering all local segments from training data. The“circle”, “triangular” “square” and “hexagon” stand for the basis elements, i.e., codewords, in the codebook. Each local segment is assigned a codeword anda histogram representation is extracted for each time series by histogram the codewords in the time series. The figure is best viewed in color.
1) Local Segments Extraction: A group of local segmentsare extracted from each time series by continuously slidinga window with pre-defined length along the time series. Aslocal segments from different time series may be at differentscales, all the local segments are normalized to zero mean andstandard deviation. We transform a local segments into waveletdomain and use approximations wavelet coefficients of DWTas a feature vector to represent the local segment.
The wavelet transform that analyzes a signal at differentfrequency bands provides both accurate frequency informationat low frequencies and time information at high frequencies,which are very important for biomedical signal analysis. Thechoice of wavelet function and the number of decompositionlevels is of importance for the multiresolution decomposition.In this work, a single level DWT with order 3 Daubechieswavelet function (db3) is employed to decompose a localsegment into approximations coefficients and detailed coeffi-cients. Similar to the work in [13], we used the approximationcoefficients as a feature vector to represent the local segment.We do not directly use the raw value of local segmentsas feature vectors due to the fact that features using theapproximations coefficients not only are more robust to noisethan features using raw segments but also have nearly halfdimension of the local segments.
2) Codebook Formulation: In the text document analysis,a codebook (vocabulary) is a set of pre-defined words, whichare also called codewords. The bag-of-words method countsthe number of each codeword that exists in a document andprovides a document-level representation using a histogramof codewords. In image and video analysis, such codebook is
generally created by performing clustering on a group of localpatches from training data, i.e., the codewords are definedas the clustering centers. The codeword that is nearest to alocal patch is then assigned to the local patch. The spatial andtemporal order information of local patches (codewords) isignored and an image or video is represented as a histogramof codewords in the image or video. The classical k-meansclustering algorithm [17] [18] is commonly used to constructthe codebook, although some other unsupervised and super-vised methods are also developed such as mean-sift [19] andsupervised Gaussian mixture models [20].
Similar to the codebook construction in image and videoanalysis, we cluster all the local segments from training timeseries using k-means clustering to construct the codebook.The clustering centers estimated by the k-means clustering areregarded as basis elements of the codebook, i.e., codewords.Suppose a group of local segments X = [x1,x2, · · · ,xn],where xi ∈ Rd, are extracted from taring time series, thecodebook construction by k-means clustering is formulized asthe optimization problem:
minB∈Rd×K ,V∈RK×n
n∑i=1
‖xi −Bvi‖2,
s.t. card(vi) = 1, |vi| = 1,∀i,vi ≥ 0,
(1)
where B ∈ Rd×K is the clustering centers and the vector vi isthe clustering index of the local segment xi, which is a unit-basis vector that has only one component equal to one andall the other components are zero. The codebook B ∈ Rd×K
IEEE TRANSACTIONS ON BIOMEDICAL ENGINEERING, VOL. **, NO. **, ** 4
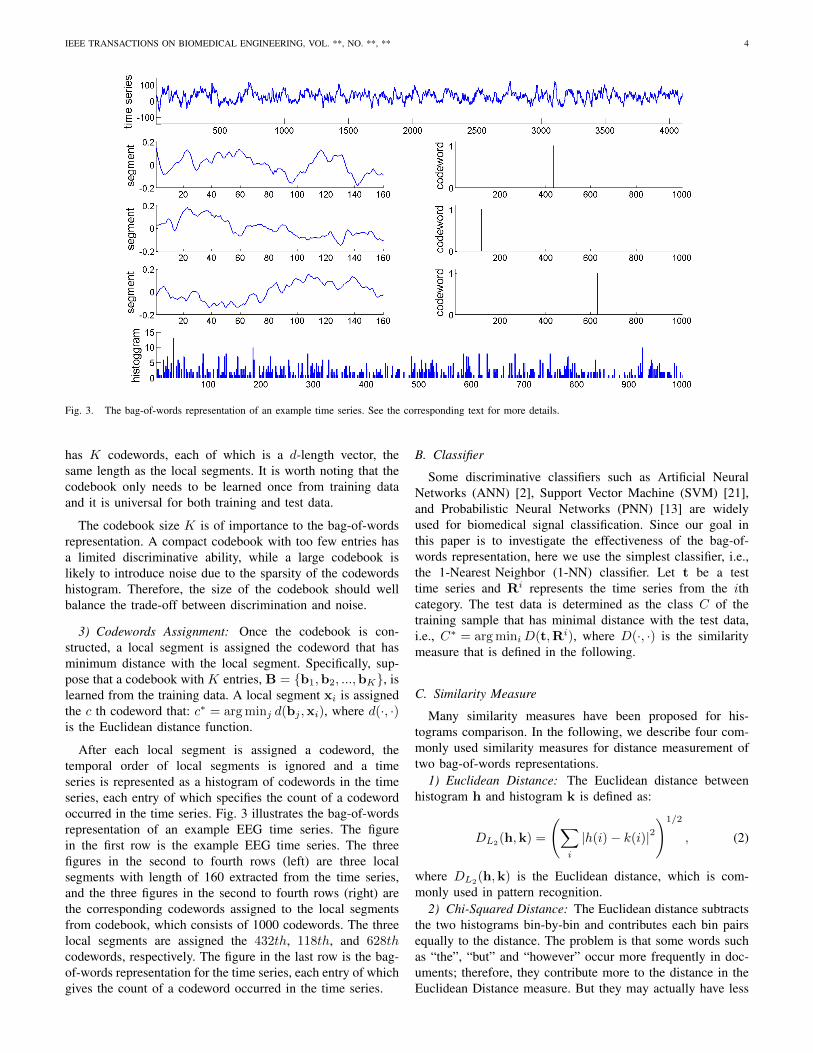
Fig. 3. The bag-of-words representation of an example time series. See the corresponding text for more details.
has K codewords, each of which is a d-length vector, thesame length as the local segments. It is worth noting that thecodebook only needs to be learned once from training dataand it is universal for both training and test data.
The codebook size K is of importance to the bag-of-wordsrepresentation. A compact codebook with too few entries hasa limited discriminative ability, while a large codebook islikely to introduce noise due to the sparsity of the codewordshistogram. Therefore, the size of the codebook should wellbalance the trade-off between discrimination and noise.
3) Codewords Assignment: Once the codebook is con-structed, a local segment is assigned the codeword that hasminimum distance with the local segment. Specifically, sup-pose that a codebook with K entries, B = {b1,b2, ...,bK}, islearned from the training data. A local segment xi is assignedthe c th codeword that: c∗ = argminj d(bj ,xi), where d(·, ·)is the Euclidean distance function.
After each local segment is assigned a codeword, thetemporal order of local segments is ignored and a timeseries is represented as a histogram of codewords in the timeseries, each entry of which specifies the count of a codewordoccurred in the time series. Fig. 3 illustrates the bag-of-wordsrepresentation of an example EEG time series. The figurein the first row is the example EEG time series. The threefigures in the second to fourth rows (left) are three localsegments with length of 160 extracted from the time series,and the three figures in the second to fourth rows (right) arethe corresponding codewords assigned to the local segmentsfrom codebook, which consists of 1000 codewords. The threelocal segments are assigned the 432th, 118th, and 628thcodewords, respectively. The figure in the last row is the bag-of-words representation for the time series, each entry of whichgives the count of a codeword occurred in the time series.
B. Classifier
Some discriminative classifiers such as Artificial NeuralNetworks (ANN) [2], Support Vector Machine (SVM) [21],and Probabilistic Neural Networks (PNN) [13] are widelyused for biomedical signal classification. Since our goal inthis paper is to investigate the effectiveness of the bag-of-words representation, here we use the simplest classifier, i.e.,the 1-Nearest Neighbor (1-NN) classifier. Let t be a testtime series and Ri represents the time series from the ithcategory. The test data is determined as the class C of thetraining sample that has minimal distance with the test data,i.e., C∗ = argminiD(t,Ri), where D(·, ·) is the similaritymeasure that is defined in the following.
C. Similarity Measure
Many similarity measures have been proposed for his-tograms comparison. In the following, we describe four com-monly used similarity measures for distance measurement oftwo bag-of-words representations.
1) Euclidean Distance: The Euclidean distance betweenhistogram h and histogram k is defined as:
DL2(h,k) =
(∑i
|h(i)− k(i)|2)1/2
, (2)
where DL2(h,k) is the Euclidean distance, which is com-monly used in pattern recognition.
2) Chi-Squared Distance: The Euclidean distance subtractsthe two histograms bin-by-bin and contributes each bin pairsequally to the distance. The problem is that some words suchas “the”, “but” and “however” occur more frequently in doc-uments; therefore, they contribute more to the distance in theEuclidean Distance measure. But they may actually have less
IEEE TRANSACTIONS ON BIOMEDICAL ENGINEERING, VOL. **, NO. **, ** 5
discriminative information than rarely happened codewords.This leads to the Chi-Squared distance (χ2 distance):
Dχ2(h,k) =∑i
|h(i)− k(i)|2
h(i) + k(i) + ε, (3)
where ε is a small value to avoid dividing by zero. The χ2
distance introduces a normalization to emphasis the rarely hap-pened codewords because common words are always sharedbetween documents from different categories.
3) Jensen-Shannon Distance: Each entry of the bag-of-words represents can be interpreted as the frequency of acodeword occurred in a time series. Therefore, the histogramstands for a probabilistic distribution over discrete randomvariables. A simple measure to compare two distribution isthe Kullback-Leibler divergence:
DKL(h||k) =∑i
h(i) (log2h(i)− log2k(i)) . (4)
If and only if h and k are the same, the KL divergencebecomes zero. In order to keep the distance symmetric, theJensen-Shannon distance [22] is introduced as a symmetricextension:
DJS =1
2(DKL(h||k) +DKL(k||h)) . (5)
4) Histogram Intersection based Distance: The histogramintersection which counts the total overlap between two his-tograms is able to address the problem of partial matches whenthe two histograms have different sum over all the bins. Thedistance based on the histogram intersection is defined as [23]:
DHI(h||k) = 1−∑i
max (h(i), k(i)) , (6)
where h and k are normalized histogram vectors. Two his-tograms that have larger overlap will obtain a smaller distance.
D. Practical ImplementationA large number of local segments may be extracted from
training data, especially for large datasets. Clustering a largenumber of local segments to construct the codebook is compu-tationally expensive. In practice, instead of using all the localsegments extracted from the training data, we performing thek-means clustering on a subset of local segments randomlyselected from the training data to construct the codebook.This strategy is also employed in image and video analysis toreduce the computation of codebook construction [17], [18].
We continuously slide a window along a time series toextract local segments. However, when the time series containstoo many data points, a large number of local segments willbe extracted from the time series, which requires expensivecomputation. For instance, for a time series consisting of2000 data points, about 1900 local segments will be extractedusing a window with 100 length. In practice, we can slidethe window with a step of n data points (n = 2, 4, 6 or 8)along the time series to reduce the number of local segmentsextracted from the time series.
The MATLAB code of the bag-of-words representationin this work was made publicly available athttp://www.mathworks.com/matlabcentral/fileexchange/38050.
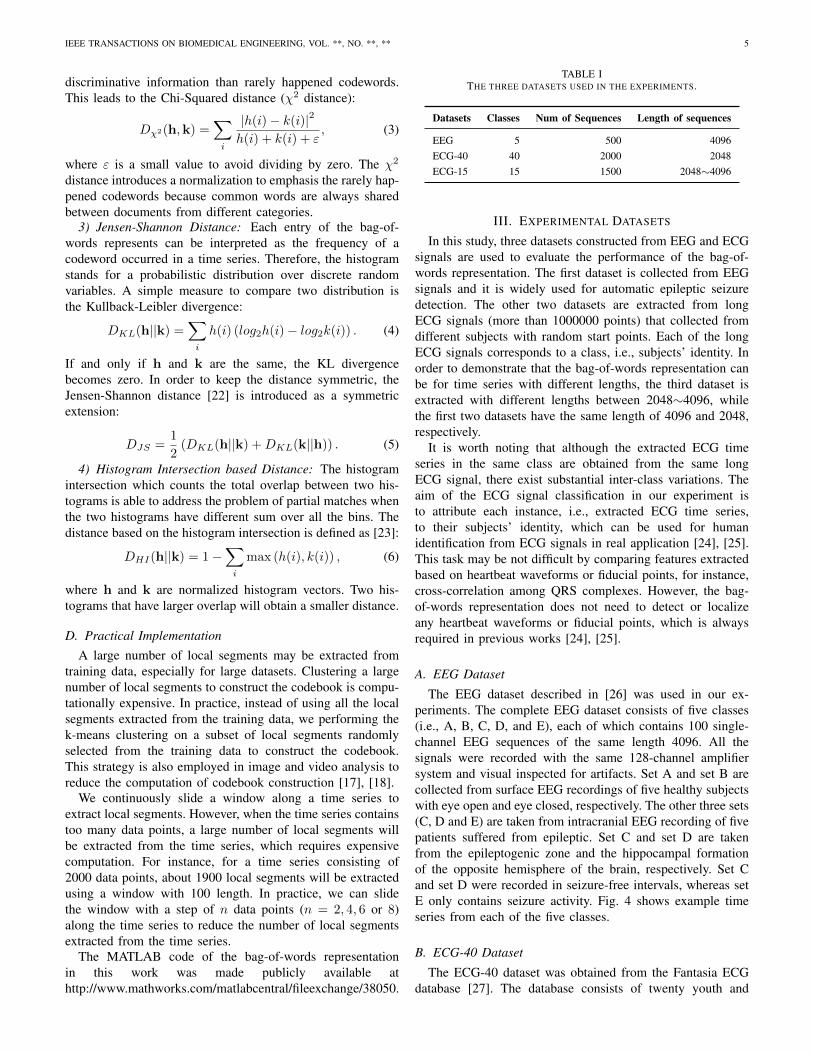
TABLE ITHE THREE DATASETS USED IN THE EXPERIMENTS.
Datasets Classes Num of Sequences Length of sequences
EEG 5 500 4096ECG-40 40 2000 2048ECG-15 15 1500 2048∼4096
III. EXPERIMENTAL DATASETS
In this study, three datasets constructed from EEG and ECGsignals are used to evaluate the performance of the bag-of-words representation. The first dataset is collected from EEGsignals and it is widely used for automatic epileptic seizuredetection. The other two datasets are extracted from longECG signals (more than 1000000 points) that collected fromdifferent subjects with random start points. Each of the longECG signals corresponds to a class, i.e., subjects’ identity. Inorder to demonstrate that the bag-of-words representation canbe for time series with different lengths, the third dataset isextracted with different lengths between 2048∼4096, whilethe first two datasets have the same length of 4096 and 2048,respectively.
It is worth noting that although the extracted ECG timeseries in the same class are obtained from the same longECG signal, there exist substantial inter-class variations. Theaim of the ECG signal classification in our experiment isto attribute each instance, i.e., extracted ECG time series,to their subjects’ identity, which can be used for humanidentification from ECG signals in real application [24], [25].This task may be not difficult by comparing features extractedbased on heartbeat waveforms or fiducial points, for instance,cross-correlation among QRS complexes. However, the bag-of-words representation does not need to detect or localizeany heartbeat waveforms or fiducial points, which is alwaysrequired in previous works [24], [25].
A. EEG Dataset
The EEG dataset described in [26] was used in our ex-periments. The complete EEG dataset consists of five classes(i.e., A, B, C, D, and E), each of which contains 100 single-channel EEG sequences of the same length 4096. All thesignals were recorded with the same 128-channel amplifiersystem and visual inspected for artifacts. Set A and set B arecollected from surface EEG recordings of five healthy subjectswith eye open and eye closed, respectively. The other three sets(C, D and E) are taken from intracranial EEG recording of fivepatients suffered from epileptic. Set C and set D are takenfrom the epileptogenic zone and the hippocampal formationof the opposite hemisphere of the brain, respectively. Set Cand set D were recorded in seizure-free intervals, whereas setE only contains seizure activity. Fig. 4 shows example timeseries from each of the five classes.
B. ECG-40 Dataset
The ECG-40 dataset was obtained from the Fantasia ECGdatabase [27]. The database consists of twenty youth and

IEEE TRANSACTIONS ON BIOMEDICAL ENGINEERING, VOL. **, NO. **, ** 6
Fig. 4. Example EEG sequences from each of the five classes.
twenty old healthy subjects. Forty long ECG signals arecollected from each of the forty subjects monitored for abouttwo hours with a sampling rate of 250 Hz. All the signalscontain more than 1000000 data points, which are very long.We extracted fifty time series of length 2048 from each of theforty long signals with random start points. Totally, the ECG-40 dataset contains 2000 time series of length 2048, which areevenly distributed in the forty classes.
C. ECG-15 Dataset
The ECG-15 dataset consists of 1500 time series extractedfrom fifteen long ECG signals in the BIDMC Congestive HeartFailure Database [27]. The fifteen long ECG signals wererecorded from fifteen patients suffered from severe congestiveheart failure. One hundred time series of length between 2048and 4096 are extracted from each of the fifteen long ECGsignals with random start points. Totally, the ECG-15 datasetconsists of fifteen classes, each of which has 100 time seriesof length between 2048 and 4096.
Table I summaries the three datasets used in the experi-ments. It should be noted that the lengths of the 1500 timeseries in the ECG-15 dataset are not the same, which varybetween 2048 and 4096.
IV. RESULTS
In this section, we report experimental results on the threedatasets. Firstly, we investigated the impact of parameters byvarying the length of local segments and the size of codebookK based on different distance measures. Then, we comparedthe proposed method with the Discrete Wavelet Transform(DWT) [13] representation, the Discrete Fourier Transform(DFT) [28] representation, the NN classifier based on DynamicTime Warping (DTW) [29] distance and the bag-of-patternsrepresentation (BoP) [14]. In addition, we compared the clas-sification accuracies achieved by the proposed method withthose achieved by other state-of-the-art methods on the EEGdataset. Finally, we investigated the robustness of the bag-of-words representation to noise. In order to ensure an un-biasedevaluation, a dataset is randomly partitioned into 10 subsets.Nine subsets are used for training while the remaining one
is retained for test. The classification process is then repeated10 times with each of the 10 subsets used exactly once as testdata.
A. Length of Local Segments
We varied the length of local segments between 8 and 256 inthe experiments. The determination of such parameter rangesrelies on the fact that the biomedical time series such asECG and EEG signals are relatively flat. The classificationaccuracies on the EEG, ECG-40 and ECG-15 datasets with acodebook size of 1000 using the Chi-Squared distance is illus-trated in Fig. 5(a), Fig. 5(b) and Fig. 5(c), respectively. Fromthe experimental results, it can be seen that the performanceis relatively stable with respect to the length of local segmentswhen it is between 64 and 192. The classification accuraciesdecrease considerably with the length less than 16. This ismainly due to the fact that a local segment with too short or toolong length can not capture local structure information withintime series. In the following experiments, we empirically setthe length of local segments as 128.
B. Codebook Size
To show the performance of the bag-of-words representationwith respect to the size of the codebook, we report the classi-fication accuracies on the three datasets in Fig. 6, increasingthe size of the codebook from 10 to 3500. We can see that theresults become very stable when the size of the codebook islarger than 500. The classification accuracies reduce quicklyif the size of the codebook is less than 100, which confirmsthat a compact codebook with too few entries has a limiteddiscriminative ability. The optimal size of the codebook canbe roughly identified as 1000∼3500.
C. Distance Measurement
We compared the classification performance on the threedatasets using the four similarity measures described in Sec-tion II-C. Fig. 7 demonstrates the classification accuraciesbased on the four distance measures with the codebook size of10, 100, 1000 and 2000. We can see that the results are slightlydifferent using various distance measures, indicating that thedistance measures have limited impact on the performance ofthe bag-of-words representation. Overall, the Chi-Squared dis-tance measure performs slightly better than the other measuresfor all the four sizes of the codebook.
D. Comparison with Other Methods
We compared the performance of the proposed bag-of-words representation with that of the DWT representation [13],the DFT representation [28], and the NN classifier based onthe DTW distance [29]. In addition, we also compared theproposed bag-of-words representation with the bag-of-patternsrepresentation [14], which is very similar to the proposedapproach.• DWT that represents a signal in multiresolution is able to
capture both frequency and location information of time

IEEE TRANSACTIONS ON BIOMEDICAL ENGINEERING, VOL. **, NO. **, ** 7
(a) (b) (c)
Fig. 5. Classification accuracies with respect to the length of segments on the EEG (a), ECG-40 (b) and ECG-15 (c) datasets, respectively.
(a) (b) (c)
Fig. 6. Classification accuracies with respect to the codebook size on the EEG (a), ECG-40 (b) and ECG-15 (c) datasets, respectively.
(a) (b) (c)
Fig. 7. Classification accuracies using different distance measures on the EEG (a), ECG-40 (b) and ECG-15 (c) datasets, respectively. The figure is bestviewed in color.
TABLE IICOMPARISON OF RESULTS ON THE THREE DATASETS USING DIFFERENT
METHODS.
methods EEG ECG-40 ECG-15
DWT 76.0 25.1 20.1DFT 91.6 85.6 60.6DTW 71.6 74.5 85.5BoP [14] 87.8 99.4 99.8Proposed method 93.8 99.5 100
series. Similar to the DWT based feature used in [13], weused the Daubechies wavelet (db2) and decomposed thetime series into 4 levels. The detail wavelet coefficients ofthe four levels and the approximation wavelet coefficientsof the fourth level are concatenated to form the finalrepresentation.
• DFT is a widely used transformation technique to extractfrequency information from time series. We transformedthe original time series into the frequency domain andextracted the DFT coefficients as features.
• DTW that uses dynamic programming technique to de-termine the best alignment of two sequences is able to
IEEE TRANSACTIONS ON BIOMEDICAL ENGINEERING, VOL. **, NO. **, ** 8
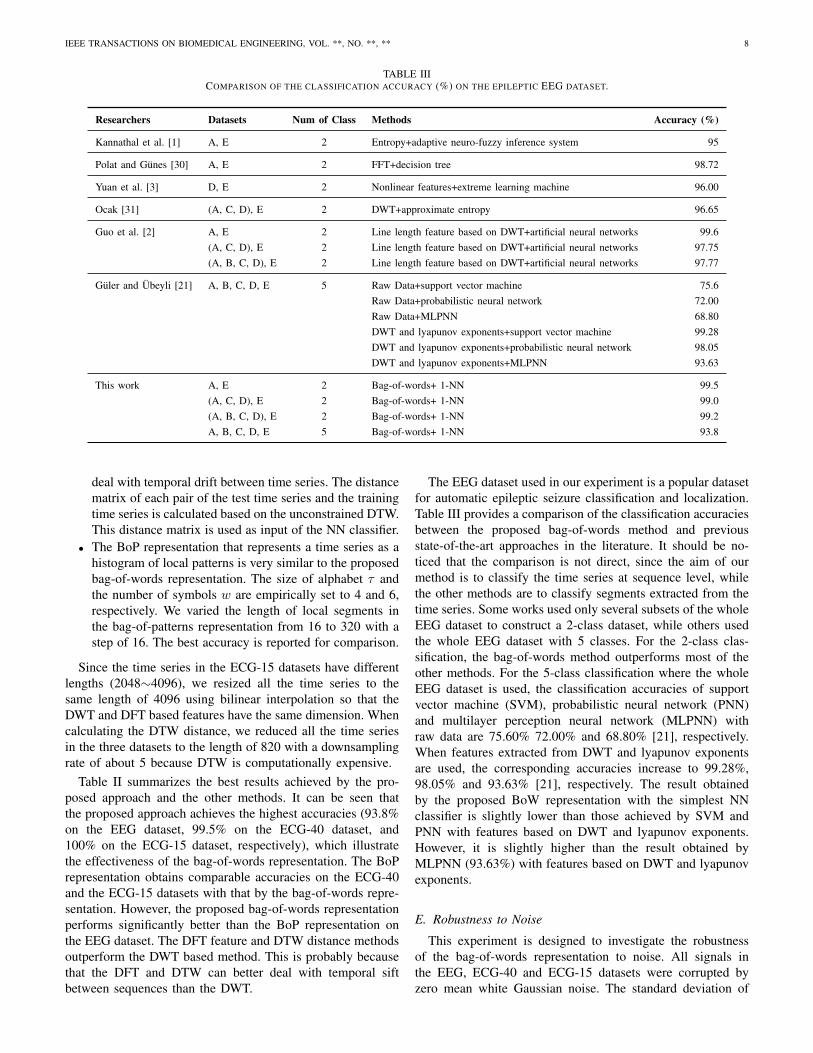
TABLE IIICOMPARISON OF THE CLASSIFICATION ACCURACY (%) ON THE EPILEPTIC EEG DATASET.
Researchers Datasets Num of Class Methods Accuracy (%)
Kannathal et al. [1] A, E 2 Entropy+adaptive neuro-fuzzy inference system 95
Polat and Gunes [30] A, E 2 FFT+decision tree 98.72
Yuan et al. [3] D, E 2 Nonlinear features+extreme learning machine 96.00
Ocak [31] (A, C, D), E 2 DWT+approximate entropy 96.65
Guo et al. [2] A, E 2 Line length feature based on DWT+artificial neural networks 99.6(A, C, D), E 2 Line length feature based on DWT+artificial neural networks 97.75(A, B, C, D), E 2 Line length feature based on DWT+artificial neural networks 97.77
Guler and Ubeyli [21] A, B, C, D, E 5 Raw Data+support vector machine 75.6Raw Data+probabilistic neural network 72.00Raw Data+MLPNN 68.80DWT and lyapunov exponents+support vector machine 99.28DWT and lyapunov exponents+probabilistic neural network 98.05DWT and lyapunov exponents+MLPNN 93.63
This work A, E 2 Bag-of-words+ 1-NN 99.5(A, C, D), E 2 Bag-of-words+ 1-NN 99.0(A, B, C, D), E 2 Bag-of-words+ 1-NN 99.2A, B, C, D, E 5 Bag-of-words+ 1-NN 93.8
deal with temporal drift between time series. The distancematrix of each pair of the test time series and the trainingtime series is calculated based on the unconstrained DTW.This distance matrix is used as input of the NN classifier.
• The BoP representation that represents a time series as ahistogram of local patterns is very similar to the proposedbag-of-words representation. The size of alphabet τ andthe number of symbols w are empirically set to 4 and 6,respectively. We varied the length of local segments inthe bag-of-patterns representation from 16 to 320 with astep of 16. The best accuracy is reported for comparison.
Since the time series in the ECG-15 datasets have differentlengths (2048∼4096), we resized all the time series to thesame length of 4096 using bilinear interpolation so that theDWT and DFT based features have the same dimension. Whencalculating the DTW distance, we reduced all the time seriesin the three datasets to the length of 820 with a downsamplingrate of about 5 because DTW is computationally expensive.
Table II summarizes the best results achieved by the pro-posed approach and the other methods. It can be seen thatthe proposed approach achieves the highest accuracies (93.8%on the EEG dataset, 99.5% on the ECG-40 dataset, and100% on the ECG-15 dataset, respectively), which illustratethe effectiveness of the bag-of-words representation. The BoPrepresentation obtains comparable accuracies on the ECG-40and the ECG-15 datasets with that by the bag-of-words repre-sentation. However, the proposed bag-of-words representationperforms significantly better than the BoP representation onthe EEG dataset. The DFT feature and DTW distance methodsoutperform the DWT based method. This is probably becausethat the DFT and DTW can better deal with temporal siftbetween sequences than the DWT.
The EEG dataset used in our experiment is a popular datasetfor automatic epileptic seizure classification and localization.Table III provides a comparison of the classification accuraciesbetween the proposed bag-of-words method and previousstate-of-the-art approaches in the literature. It should be no-ticed that the comparison is not direct, since the aim of ourmethod is to classify the time series at sequence level, whilethe other methods are to classify segments extracted from thetime series. Some works used only several subsets of the wholeEEG dataset to construct a 2-class dataset, while others usedthe whole EEG dataset with 5 classes. For the 2-class clas-sification, the bag-of-words method outperforms most of theother methods. For the 5-class classification where the wholeEEG dataset is used, the classification accuracies of supportvector machine (SVM), probabilistic neural network (PNN)and multilayer perception neural network (MLPNN) withraw data are 75.60% 72.00% and 68.80% [21], respectively.When features extracted from DWT and lyapunov exponentsare used, the corresponding accuracies increase to 99.28%,98.05% and 93.63% [21], respectively. The result obtainedby the proposed BoW representation with the simplest NNclassifier is slightly lower than those achieved by SVM andPNN with features based on DWT and lyapunov exponents.However, it is slightly higher than the result obtained byMLPNN (93.63%) with features based on DWT and lyapunovexponents.
E. Robustness to Noise
This experiment is designed to investigate the robustnessof the bag-of-words representation to noise. All signals inthe EEG, ECG-40 and ECG-15 datasets were corrupted byzero mean white Gaussian noise. The standard deviation of

IEEE TRANSACTIONS ON BIOMEDICAL ENGINEERING, VOL. **, NO. **, ** 9
TABLE IVCLASSIFICATION ACCURACIES (%) ON THE THREE DATASETS CORRUPTED
BY ZERO-MEAN WHITE GAUSSIAN NOISE.
SNR EEG ECG-40 ECG-15
10db 92.6 98.9 99.88db 91.8 98.4 99.76db 91.2 97.6 99.64db 90.4 95.5 99.22db 88.8 92.6 98.90db 85.2 89.9 98.6
the white Gaussian noise is varied so that the SNRs arebetween 10dB and 0dB. The training data and the test dataare separated exactly the same as those in the previousexperiments. Table IV summaries the classification accuracieson the three datasets contaminated by the white Gaussiannoise with different SNRs. It can be seen that the bag-of-words approach is relatively robust to noise. The accuraciesdecreased by less than 2 percents when the SNR is 10dB.Even for considerable noise contamination with the SNR 0dB,the accuracies reduced less than 10 percents for the EEG andECG-40 datasets, and only less than 2 percents for the ECG-15dataset.
V. DISCUSSION
Although the bag-of-words representation ignores the tem-poral order of local segments, it is able to effectively capturehigh-level structural information due to the fact that thefrequency of the codewords (local segments) occurred in atime series is well utilized. However, since the local segmentsare extracted by sliding a window along time series, a timeseries that is not reasonably long cannot provide enoughlocal segments to capture local structures in the time series.Therefore, the bag-of-words representation may be ineffectiveto represent short time series, which is mainly due to thelimitation that the bag-of-words representation cannot extractenough meaningful and discriminative local segments fromshort sequences.
The size of the codebook N is pre-defined and empiricallydetermined in the method. A compact codebook with smallsize has a limited discriminative ability, while a codebookwith large size is likely to introduce noise. How to adaptivelyset the optimal size of the codebook to make the codebookcompact and yet discriminative is still an open question. Somecriteria can be defined to merge entries of a codebook toconstruct an adaptive codebook. For instance, the methodin [32] utilized Maximization of Mutual Information (MMI)principal to estimate the optimal N . Two entries of a codebookare merged by maximizing the mutual information in anunsupervised way. Creating a codebook with adaptive size willbe investigated in our future work.
VI. CONCLUSION
In this paper, we proposed a bag-of-words representation forbiomedical time series analysis. The proposed method treatsa time series as a document and local segments extracted
from the time series as words. The time series is representedas a histogram of codewords. Although the temporal orderinformation of the local segments is ignored, both localstructure and global structure information of the time seriesare captured. Experimental results on three publicly availabledatasets demonstrate that the bag-of-words representation iseffective for characterizing biomedical time series such asEEG and ECG signals. Furthermore, the bag-of-words repre-sentation is not only insensitive to the length of local segmentsand the size of codebook, but also robust to noise. The distancemeasures for comparison of histograms are also investigatedin the experiments, showing that the Chi-Squared distancemeasure is more suitable for comparing histograms than theother distance measures. We compared the performance ofthe bag-of-words representation with several state-of-the-artapproaches in the literature. Experimental results show thatthe bag-of-words representation with the simplest 1-NearestNeighbor (1-NN) classifier achieves comparable or higherclassification accuracies than those by the others.
REFERENCES
[1] N. Kannathal, M. L. Choo, U. R. Acharya, and P. Sadasivan, “Entropiesfor detection of epilepsy in EEG,” Compu. Meth. Prog. Bio., vol. 80,no. 3, pp. 187 – 194, 2005.
[2] L. Guo, D. Rivero, J. Dorado, J. R. Rabual, and A. Pazos, “Automaticepileptic seizure detection in EEGs based on line length feature andartificial neural networks,” J. Neurosci Meth., vol. 191, no. 1, pp. 101 –109, 2010.
[3] Q. Yuan, W. Zhou, S. Li, and D. Cai, “Epileptic EEG classificationbased on extreme learning machine and nonlinear features,” EpilepsyRes., vol. 96, no. 1-2, pp. 29 – 38, 2011.
[4] J. R. Wolpaw, N. Birbaumer, D. J. McFarland, G. Pfurtscheller, and T. M.Vaughan, “Brain computer interfaces for communication and control,”Clin. Neurophysiol., vol. 113, no. 6, pp. 767 – 791, 2002.
[5] H. Lu, H.-L. Eng, C. Guan, K. Plataniotis, and A. Venetsanopoulos,“Regularized common spatial pattern with aggregation for EEG classi-fication in small-sample setting,” IEEE Trans. Biomed. Eng., vol. 57,no. 12, pp. 2936 –2946, dec. 2010.
[6] H. Wang, “Multiclass filters by a weighted pairwise criterion for EEGsingle-trial classification,” IEEE Trans. Biomed. Eng., vol. 58, no. 5, pp.1412 –1420, may 2011.
[7] K.-Q. Shen, C.-J. Ong, X.-P. Li, Z. Hui, and E. Wilder-Smith, “A featureselection method for multilevel mental fatigue EEG classification,” IEEETrans. Biomed. Eng., vol. 54, no. 7, pp. 1231 –1237, july 2007.
[8] Y.-P. Lin, C.-H. Wang, T.-P. Jung, T.-L. Wu, S.-K. Jeng, J.-R. Duann,and J.-H. Chen, “EEG-based emotion recognition in music listening,”IEEE Trans. Biomed. Eng., vol. 57, no. 7, pp. 1798 –1806, july 2010.
[9] T. Ince, S. Kiranyaz, and M. Gabbouj, “A generic and robust system forautomated patient-specific classification of ECG signals,” IEEE Trans.Biomed. Eng., vol. 56, no. 5, pp. 1415 –1426, may 2009.
[10] A. Kampouraki, G. Manis, and C. Nikou, “Heartbeat time series classifi-cation with support vector machines,” IEEE Trans. Inf. Technol. Biomed.,vol. 13, no. 4, pp. 512 –518, july 2009.
[11] M. Huken and P. Stagge, “Recurrent neural networks for time seriesclassification,” Neurocomputing, vol. 50, pp. 223 – 235, 2003.
[12] A. E. Zadeh, A. Khazaee, and V. Ranaee, “Classification of the electro-cardiogram signals using supervised classifiers and efficient features,”Compu. Meth. Prog. Bio., vol. 99, no. 2, pp. 179 – 194, 2010.
[13] I.Guler and E. D. Ubeyli, “ECG beat classifier designed by combinedneural network model,” Pattern Recogn., vol. 38, no. 2, pp. 199 – 208,2005.
[14] J. Lin, R. Khade, and Y. Li, “Rotation-invariant similarity in time seriesusing bag-of-patterns representation,” J. Intell. Inf. Syst, pp. 1–29, 2012.
[15] G. Lebanon, Y. Mao, and J. Dillon, “The locally weighted bag of wordsframework for document representation,” J. Mach. Learn. Res., vol. 8,pp. 2405–2441, December 2007.
[16] D. Blei, A. Ng, and M. Jordan, “Latent dirichlet allocation,” J. Mach.Learn. Res., vol. 3, pp. 993–1022, 2003.

IEEE TRANSACTIONS ON BIOMEDICAL ENGINEERING, VOL. **, NO. **, ** 10
[17] L. Fei-Fei and P. Perona, “A bayesian hierarchical model for learningnatural scene categories,” in Proc. IEEE Int’l Conf. Computer Visionand Pattern Recognition, vol. 2, 2005, pp. 524 – 531.
[18] J. C. Niebles, H. Wang, and L. Fei-Fei, “Unsupervised learning of humanaction categories using spatial-temporal words,” Int. J. Comput. Vision.,vol. 79, no. 3, pp. 299–318, 2008.
[19] F. Jurie and B. Triggs, “Creating efficient codebooks for visual recogni-tion,” in Proc. IEEE Int’l Conf. Computer Vision, vol. 1, oct. 2005, pp.604 – 610 Vol. 1.
[20] B. Fernando, E. Fromont, D. Muselet, and M. Sebban, “Supervisedlearning of gaussian mixture models for visual vocabulary generation,”Pattern Recogn., vol. 45, no. 2, pp. 897 – 907, 2012.
[21] I.Guler and E. D. Ubeyli, “Multiclass support vector machines for EEG-signals classification,” IEEE Trans. Inf. Technol. Biomed., vol. 11, no. 2,pp. 117 –126, march 2007.
[22] D. Endres and J. Schindelin, “A new metric for probability distributions,”IEEE Trans. Inf. Theory, vol. 49, no. 7, pp. 1858 – 1860, july 2003.
[23] K. Grauman and T. Darrell, “The pyramid match kernel: Efficientlearning with sets of features,” J. Mach. Learn. Res., vol. 8, pp. 725–760,May 2007.
[24] L. Biel, O. Pettersson, L. Philipson, and P. Wide, “ECG analysis: a newapproach in human identification,” IEEE Trans. Instrum. Meas., vol. 50,no. 3, pp. 808 –812, 2001.
[25] S.-C. Fang and H.-L. Chan, “Human identification by quantifyingsimilarity and dissimilarity in electrocardiogram phase space,” PatternRecogn., vol. 42, no. 9, pp. 1824 – 1831, 2009.
[26] R. G. Andrzejak, K. Lehnertz, F. Mormann, C. Rieke, P. David, and C. E.Elger, “Indications of nonlinear deterministic and finite-dimensionalstructures in time series of brain electrical activity: dependence onrecording region and brain state.” Phys. rev. E, vol. 64, no. 6 Pt 1,Dec. 2001.
[27] A. L. Goldberger, L. A. N. Amaral, L. Glass, J. M. Hausdorff,P. Ch.Ivanov, R. G. Mark, J. E. Mietus, G. B. Moody, C.-K. Peng, andH. E. Stanley, “PhysioBank, PhysioToolkit, and PhysioNet: componentsof a new research resource for complex physiologic signals,” Circulation,vol. 101, no. 23, pp. 215–220, 2000.
[28] D. Rafiei and A. Mendelzon, “Querying time series data based onsimilarity,” IEEE Trans. Knowl. Data Eng., vol. 12, no. 5, pp. 675 –693, 2000.
[29] T. chung Fu, “A review on time series data mining,” Eng. Appl. Artif.Intel., vol. 24, no. 1, pp. 164 – 181, 2011.
[30] K. Polat and S. Gunes, “Classification of epileptiform EEG usinga hybrid system based on decision tree classifier and fast fouriertransform,” Appl. Math. Comput., vol. 187, no. 2, pp. 1017 – 1026,2007.
[31] H. Ocak, “Automatic detection of epileptic seizures in EEG usingdiscrete wavelet transform and approximate entropy,” Expert Syst. Appl.,vol. 36, no. 2, Part 1, pp. 2027 – 2036, 2009.
[32] J. Liu and M. Shah, “Learning human actions via information max-imization,” in Proc. IEEE Int’l Conf. Computer Vision and PatternRecognition, 2008, pp. 1–8.
Jin Wang received his M.S. in Pattern Recognitionand Artificial Intelligence from Huazhong Universityof Science and Technology, China. Currently, heis pursuing the Ph.D. degree in the Center forIntelligent System Research (CISR) and the Institutefor Frontier Material (IFM) at Deakin University,Australia. His major research interests are signalprocessing, machine learning and intelligent system,including biomedical time series analysis, automaticimage and video analysis, and intelligent wearablesystems.
Ping Liu got his Bachelor degree (EE) in WuHanuniversity of Technology, 2005; Master degree (CS)in Huazhong University of Science and Technology,2008. From 2011, he have been studying in theUniversity of South Carolina, American. Generally,his interest includes computer vision, pattern recog-nition and machine learning.
Mary F.H.She received her B.Sc. and M.Sc. degreesin Engineering from Donghua University, Shanghai,China and Ph.D from Deakin University, Victo-ria, Australia. She was awarded Australian Post-doctorial Fellowship by Australian Research Councilin 2002. She currently is a research fellow in theCenter for Intelligent System Research (CISR) andthe Institute for Frontier Material (IFM) at DeakinUniversity. Her major research interest includes im-age processing and intelligent wearable systems.
Saeid Nahavandi received the B.Sc. (hons.), M.Sc.,and Ph.D. degrees in automation and control fromDurham University, Durham, U.K. He is the Al-fred Deakin Professor, Chair of Engineering, andthe director for the Center for Intelligent SystemsResearch (CISR), Deakin University, Geelong, VIC,Australia. His research interests include modelingof complex systems, simulation-based optimization,robotics, haptics and augmented reality. Dr. Naha-vandi is the Associate Editor of the IEEE SystemsJournal, an Editorial Consultant Board member for
the International Journal of Advanced Robotic Systems, an Editor (SouthPacific Region) of the International Journal of Intelligent Automation and SoftComputing. He is a Fellow of Engineers Australia (FIEAust), IET (FIET) andSenior member of IEEE (SMIEEE).
Abbas Kouzani received his M.Eng. degree inelectrical and electronics engineering from the Uni-versity of Adelaide, Australia, 1995, and Ph.D. de-gree in electrical and electronics engineering fromFlinders University, Australia, 1999. Currently, heis an Associate Professor with the School of Engi-neering, Deakin University. He has been involved inseveral ARC and industry research grants, and morethan 150 publications. His research interests includepattern recognition and intelligent systems.