identifying special products in developing countries: preliminary findings of ictsd’s country...
TRANSCRIPT
Identifying Special Products in Developing countries:
Preliminary Findings of ICTSD’s Country Studies
Christophe BellmannProgrammes Director - ICTSD
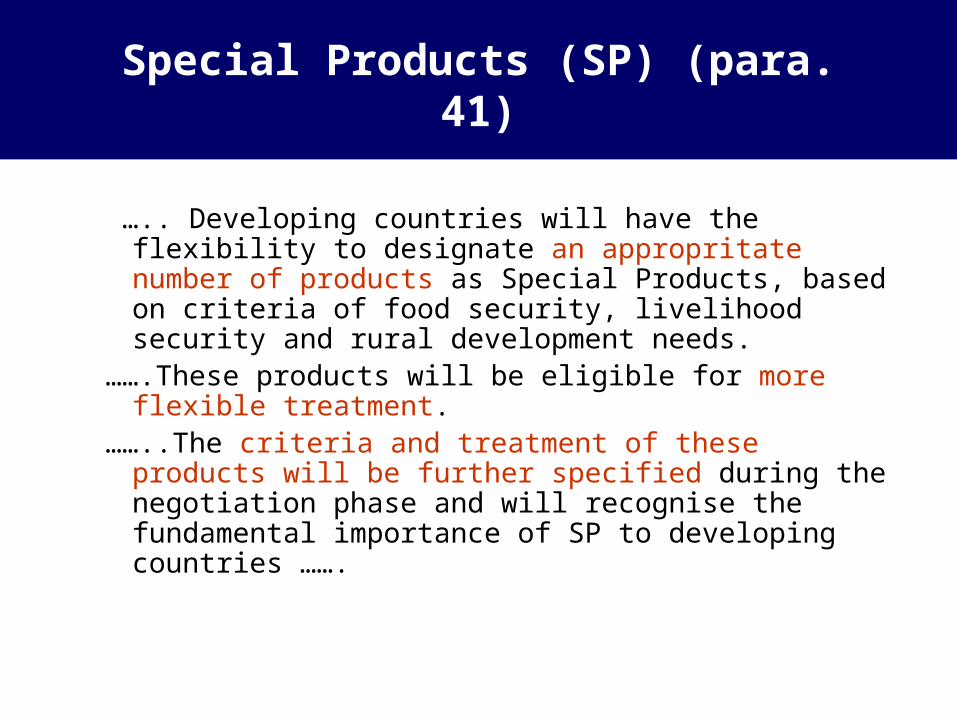
Special Products (SP) (para. 41)
….. Developing countries will have the flexibility to designate an appropritate number of products as Special Products, based on criteria of food security, livelihood security and rural development needs.
…….These products will be eligible for more flexible treatment.
……..The criteria and treatment of these products will be further specified during the negotiation phase and will recognise the fundamental importance of SP to developing countries …….

The Rationale for Special Products
• Food security: combination of domestic production, importation and public stockholding. However some degree of self-sufficiency for basic foodstuffs remains a major objective for DC. Availability of foreign exchange is also a constraint on the import capacity of some DC.
• Livelihood security: Agriculture accounts for 70 % of the employment in low-income countries and 30 % in middle-income countries. Alternative avenues of employment are lacking.
• Rural Development: In DC, agriculture constitutes a big slice of the GDP. Since in the rural areas agriculture is the dominant economic activity, rural development can be sustained only by a vibrant and growing agricultural activity.
• Importance of looking at the three criteria together as opposed to individually
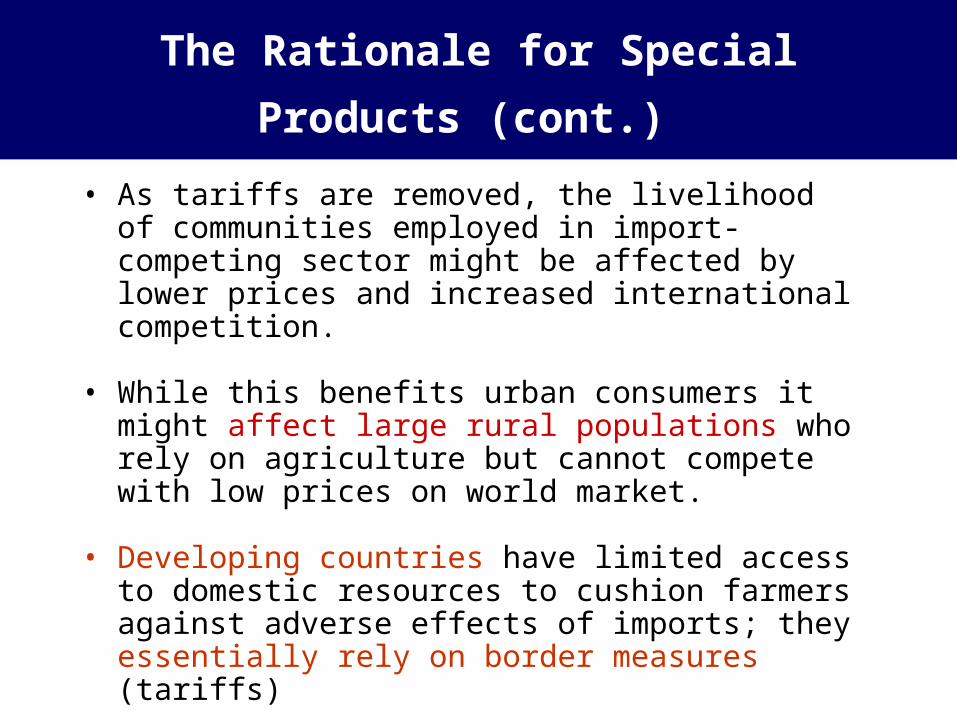
The Rationale for Special Products
(cont.) • As tariffs are removed, the livelihood of communities
employed in import-competing sector might be affected by lower prices and increased international competition.
• While this benefits urban consumers it might affect large rural populations who rely on agriculture but cannot compete with low prices on world market.
• Developing countries have limited access to domestic resources to cushion farmers against adverse effects of imports; they essentially rely on border measures (tariffs)

Undernourished as a percentage of total population (average 2000-2002)
0 10 20 30 40 50 60
Zambia Haiti
Mozambique Tanzania
Zimbabwe Congo
Madagascar Kenya
Botswana Mongolia
Nicaragua Panama
Dominican Rep Guatemala
Senegal Honduras
Philippines Sri Lanka
India Pakistan Uganda
Venezuela Benin
Côte d'Ivoire Peru
Trinidad and Tobago China
El Salvador Suriname
Guyana Jamaica
Nigeria IIndonesia Mauritius
Turkey Korea, Rep
Countries
Share of undernourishment Source: Based on the Millennium Development Indicators Database (UNSD)
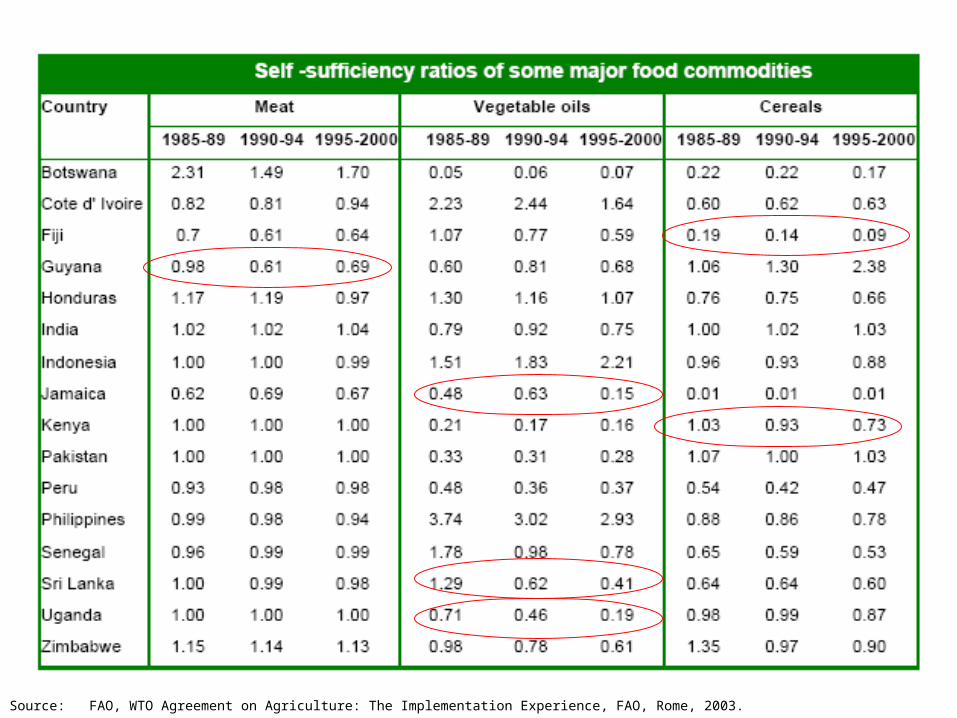
Source: FAO, WTO Agreement on Agriculture: The Implementation Experience, FAO, Rome, 2003.

0
2
4
6
8
10
12
14
16
<15 15-30 30-45 45-60 60-75 >75
Share of agricultural working force
Number of countries
e.g. Cuba, Venezuela, Barbados
e.g. Honduras, Peru, Jamaica, Guyana
e.g. Sri Lanka, Turkey, Philippines Nigeria
e.g. Haiti, India, Côte d’Ivoire, Indonesia
e.g. Kenya, Senegal, Zambia, China
e.g. Mozambique, Tanzania, Uganda
Agricultural Employment in G33 Countries
Source: Earth Trends database (World Resources Institute)
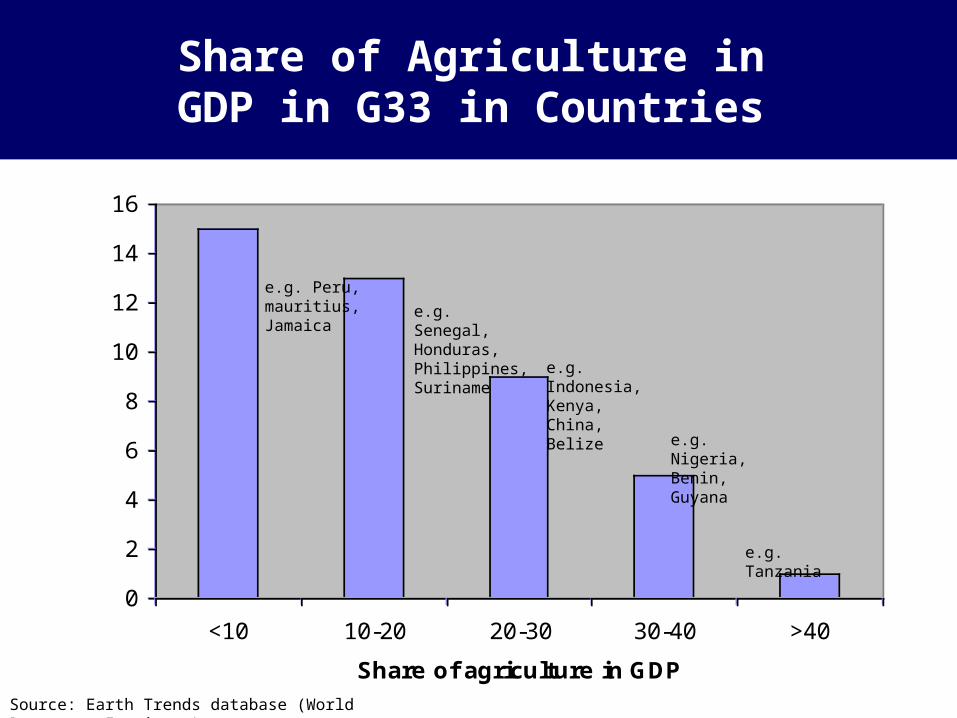
0
2
4
6
8
10
12
14
16
<10 10-20 20-30 30-40 >40
Share of agriculture in GDP
Number of countries
e.g. Peru, mauritius, Jamaica
e.g. Senegal, Honduras, Philippines, Suriname e.g. Indonesia,
Kenya, China, Belize
e.g. Nigeria, Benin, Guyana
e.g. Tanzania
Share of Agriculture in GDP in G33 in Countries
Source: Earth Trends database (World Resources Institute)
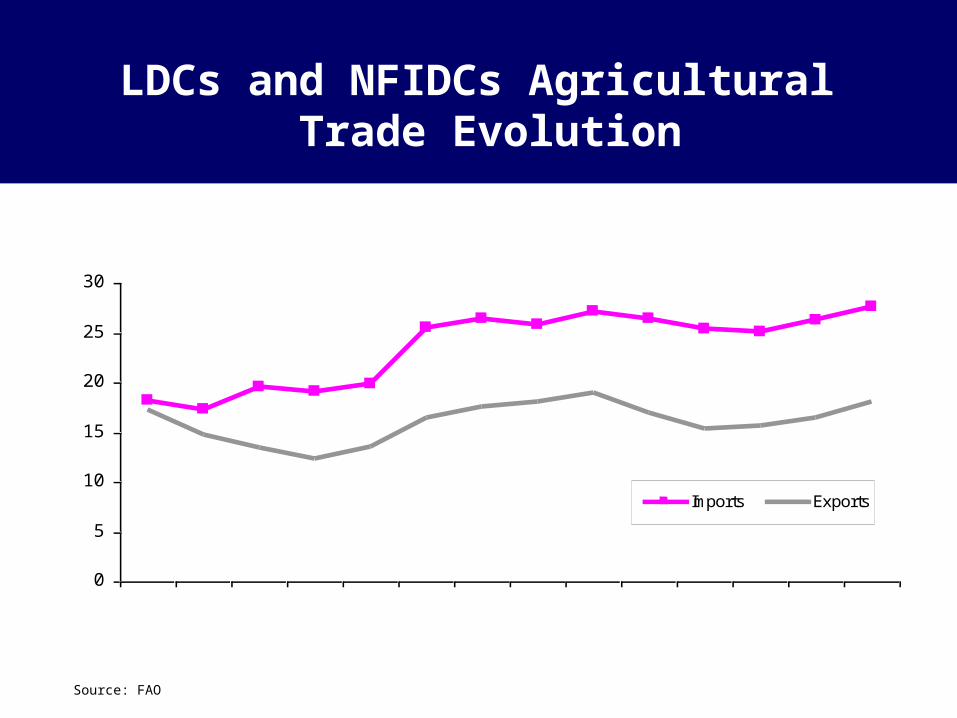
0
5
10
15
20
25
30
1990 1991 1992 1993 1994 1995 1996 1997 1998 1999 2000 2001 2002 2003
US $ billion
Imports Exports
Source: FAO
LDCs and NFIDCs Agricultural Trade Evolution
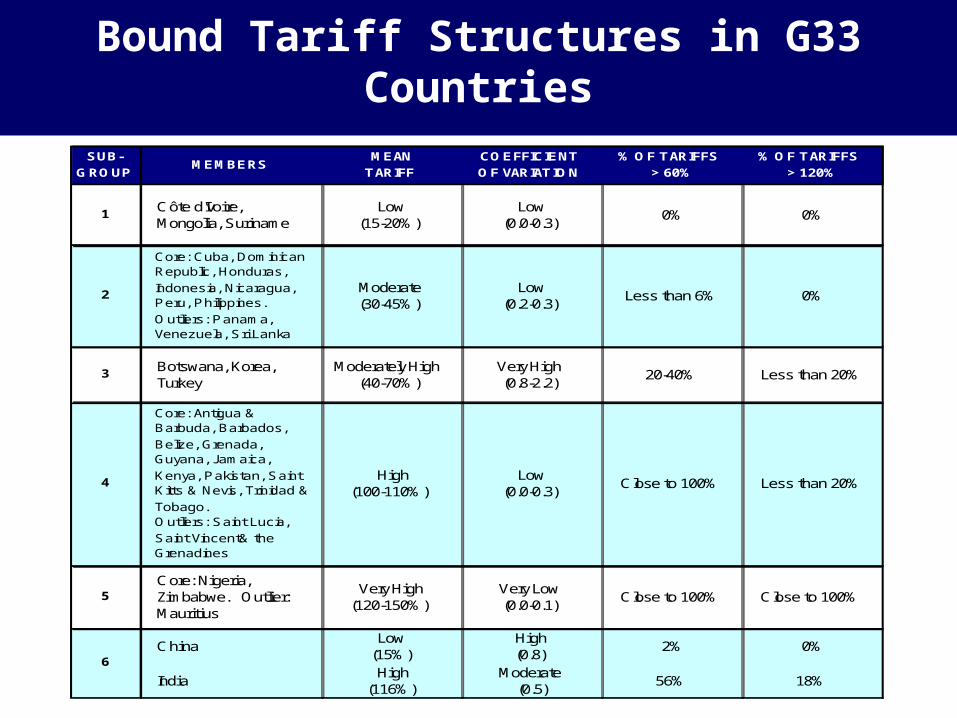
SUB-
GROUPMEMBERS
MEAN
TARIFF
COEFFICIENT
OF VARIATION
% OF TARIFFS
> 60%
% OF TARIFFS
> 120%
1Côte d'Ivoire, Mongolia, Suriname
Low (15-20%)
Low (0.0-0.3)
0% 0%
2
Core: Cuba, Dominican Republic, Honduras,
Indonesia, Nicaragua, Peru, Philippines.
Outliers: Panama, Venezuela, Sri Lanka
Moderate (30-45%)
Low (0.2-0.3)
Less than 6% 0%
3Botswana, Korea, Turkey
Moderately High (40-70%)
Very High (0.8-2.2)
20-40% Less than 20%
4
Core: Antigua & Barbuda, Barbados,
Belize, Grenada, Guyana, Jamaica,
Kenya, Pakistan, Saint Kitts & Nevis, Trinidad &
Tobago. Outliers: Saint Lucia,
Saint Vincent& the Grenadines
High (100-110%)
Low (0.0-0.3)
Close to 100% Less than 20%
5Core: Nigeria, Zimbabwe. Outlier: Mauritius
Very High (120-150%)
Very Low (0.0-0.1)
Close to 100% Close to 100%
ChinaLow
(15%)High (0.8)
2% 0%
IndiaHigh
(116%)Moderate
(0.5)56% 18%
6
Bound Tariff Structures in G33 Countries
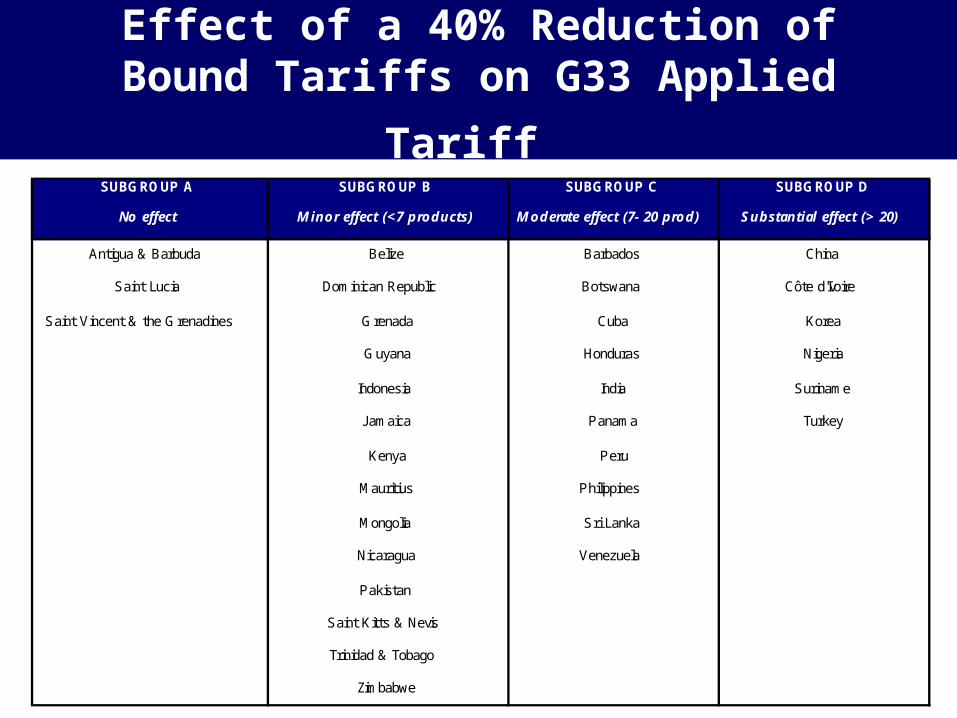
Effect of a 40% Reduction of Bound
Tariffs on G33 Applied Tariff SUBGROUP A SUBGROUP B SUBGROUP C SUBGROUP D
No effect M inor effect (<7 products) M oderate effect (7- 20 prod) Substantial effect (> 20)
Antigua & Barbuda Belize Barbados China
Saint Lucia Dominican Republic Botswana Côte d'Ivoire
Saint Vincent & the Grenadines Grenada Cuba Korea
Guyana Honduras Nigeria
Indonesia India Suriname
Jamaica Panama Turkey
Kenya Peru
Mauritius Philippines
Mongolia Sri Lanka
Nicaragua Venezuela
Pakistan
Saint Kitts & Nevis
Trinidad & Tobago
Zimbabwe
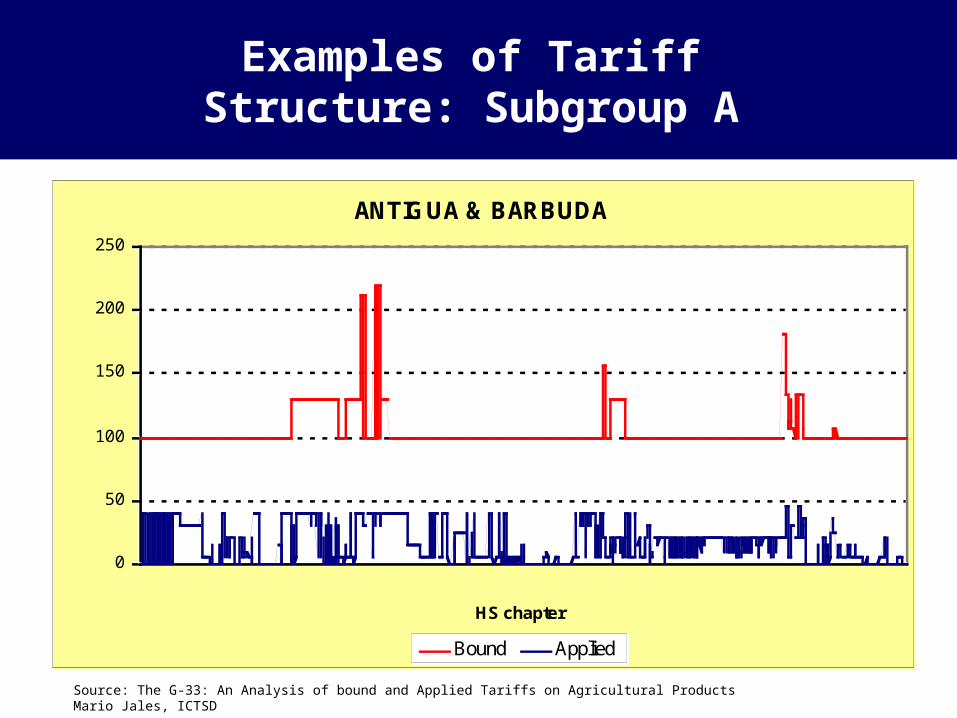
Examples of Tariff Structure: Subgroup A
ANTIGUA & BARBUDA
0
50
100
150
200
250
01 01 02 04 05 07 07 07 08 09 10 11 12 12 15 16 18 20 20 20 21 22 24 35 51HS chapter
%
Bound Applied
Source: The G-33: An Analysis of bound and Applied Tariffs on Agricultural Products Mario Jales, ICTSD
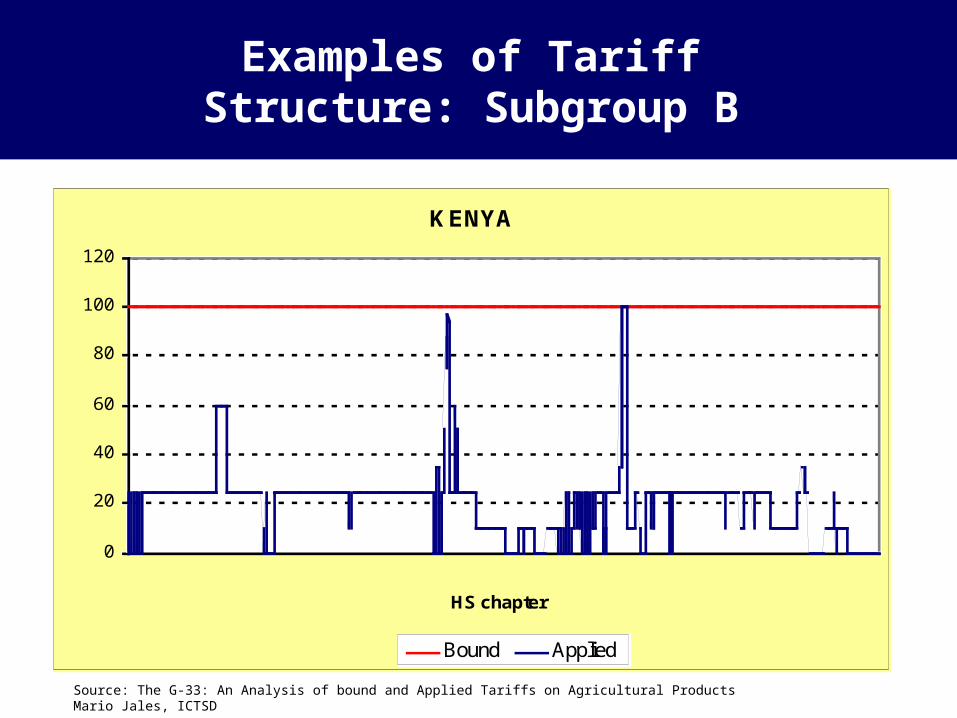
Examples of Tariff Structure: Subgroup B
KENYA
0
20
40
60
80
100
120
01 02 02 04 05 07 07 08 08 09 10 11 12 13 15 16 18 19 20 21 22 24 35 51HS chapter
%
Bound Applied
Source: The G-33: An Analysis of bound and Applied Tariffs on Agricultural Products Mario Jales, ICTSD

Examples of Tariff Structure: Subgroup C
HONDURAS
0
10
20
30
40
50
60
01 02 02 04 04 06 07 07 07 08 08 09 10 11 12 12 15 15 16 18 20 20 21 22 23 24 38 51HS chapter
%
Bound Applied Price Bands
Source: The G-33: An Analysis of bound and Applied Tariffs on Agricultural Products Mario Jales, ICTSD
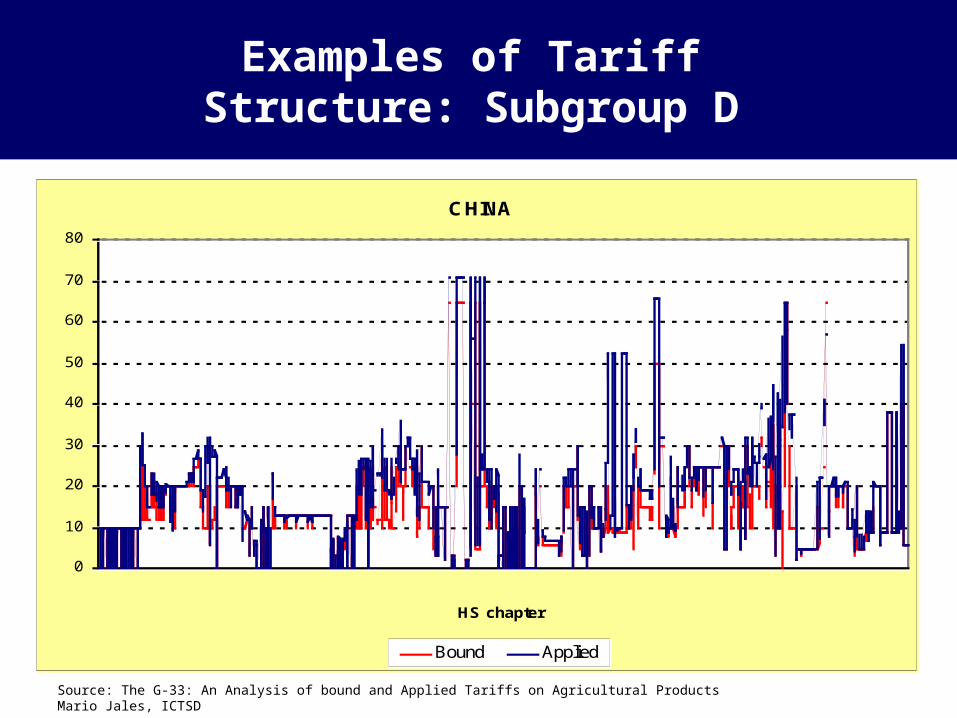
CHINA
0
10
20
30
40
50
60
70
80
01 01 02 02 04 05 07 07 07 08 08 09 10 11 12 12 12 14 15 17 19 20 20 22 23 33 41 51
HS chapter
%
Bound Applied
Examples of Tariff Structure: Subgroup D
Source: The G-33: An Analysis of bound and Applied Tariffs on Agricultural Products Mario Jales, ICTSD

Examples of Tariff Structure: Subgroup D
Source: The G-33: An Analysis of bound and Applied Tariffs on Agricultural Products Mario Jales, ICTSD
COTE D’IVOIRE
0
10
20
30
40
50
60
70
01 02 02 04 04 05 07 07 07 08 08 09 09 09 11 11 12 12 14 15 15 16 17 18 20 20 21 22 22 23 33 41 51
HS chapter
%
Bound Applied
Sources: WTO (2004) and WITS (2002).
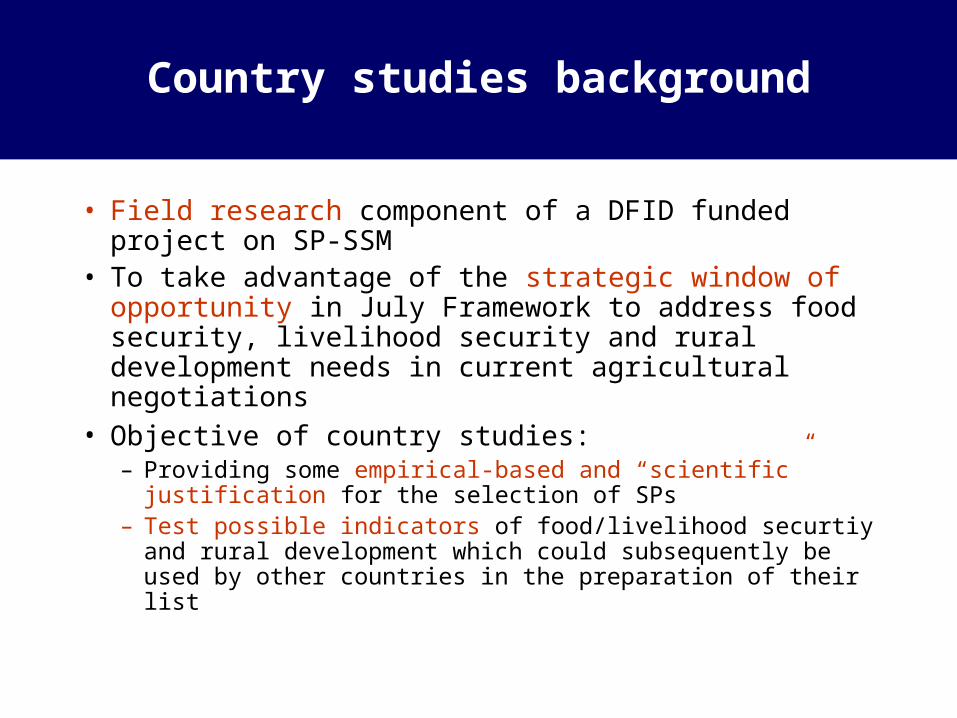
Country studies background
• Field research component of a DFID funded project on SP-SSM
• To take advantage of the strategic window of opportunity in July Framework to address food security, livelihood security and rural development needs in current agricultural negotiations
• Objective of country studies: – Providing some empirical-based and “scientific” justification
for the selection of SPs– Test possible indicators of food/livelihood securtiy and rural
development which could subsequently be used by other countries in the preparation of their list
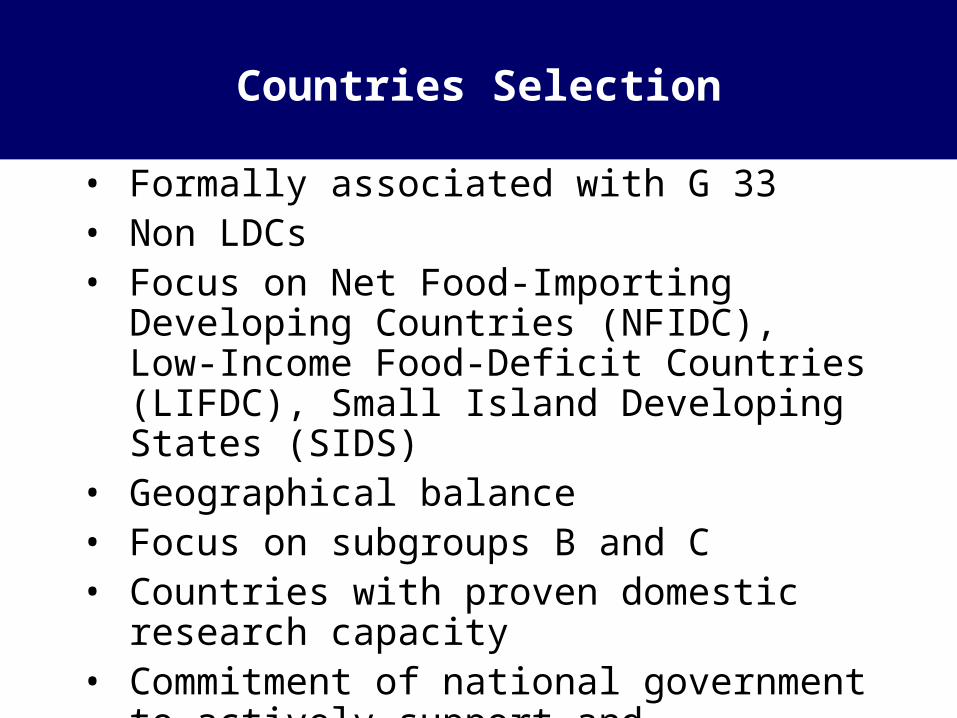
• Formally associated with G 33• Non LDCs• Focus on Net Food-Importing Developing
Countries (NFIDC), Low-Income Food-Deficit Countries (LIFDC), Small Island Developing States (SIDS)
• Geographical balance• Focus on subgroups B and C• Countries with proven domestic research
capacity• Commitment of national government to
actively support and participate in the project
Countries Selection
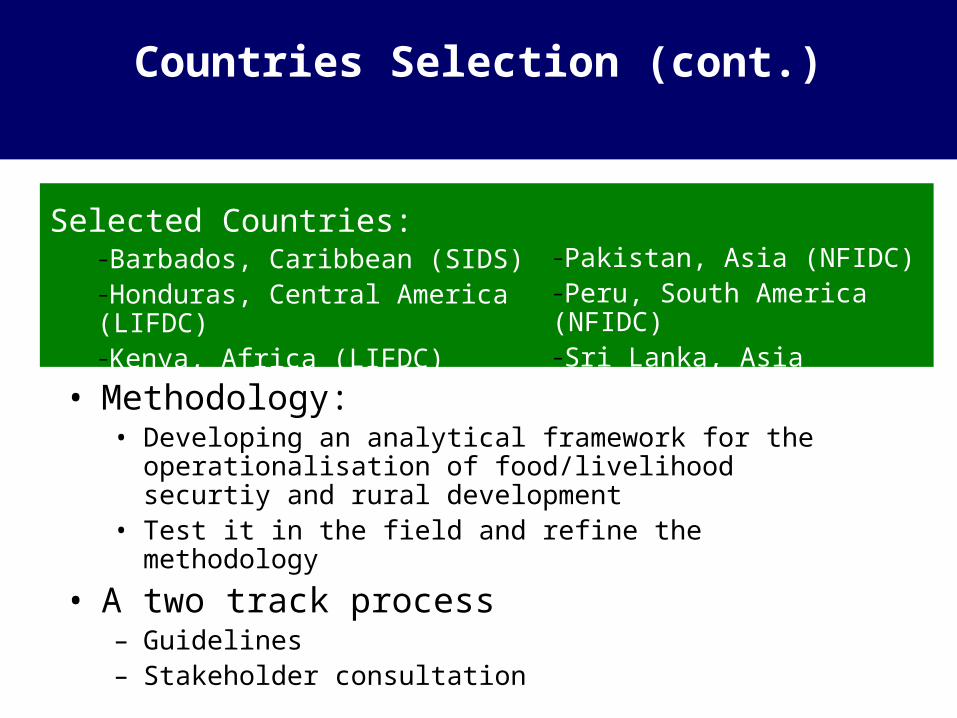
Selected Countries: –Barbados, Caribbean (SIDS)–Honduras, Central America (LIFDC) –Kenya, Africa (LIFDC)
• Methodology: • Developing an analytical framework for the
operationalisation of food/livelihood securtiy and rural development
• Test it in the field and refine the methodology
• A two track process – Guidelines– Stakeholder consultation
–Pakistan, Asia (NFIDC)–Peru, South America (NFIDC) –Sri Lanka, Asia (LIFDC)
Countries Selection (cont.)
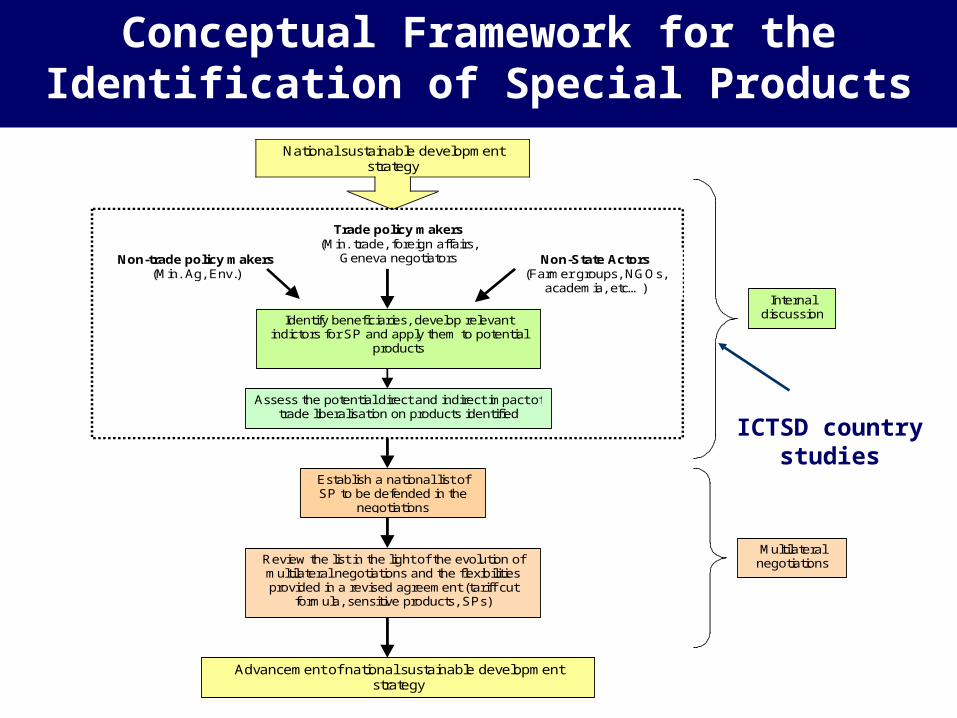
National sustainable development strategy
Identify beneficiaries, develop relevant indictors for SP and apply them to potential
products
Assess the potential direct and indirect impact of trade liberalisation on products identified
Establish a national list of SP to be defended in the
negotiations
Review the list in the light of the evolution of multilateral negotiations and the flexibilities provided in a revised agreement (tariff cut
formula, sensitive products, SPs)
Advancement of national sustainable development strategy
Trade policy makers (Min. trade, foreign affairs,
Geneva negotiators Non-trade policy makers (Min. Ag, Env.)
Non-State Actors (Farmer groups, NGOs,
academia, etc…) Internal
discussion
Multila te ra l negotia tions
ICTSD country studies
Conceptual Framework for the Identification of Special Products
Conceptual Framework for the Identification of Special Products
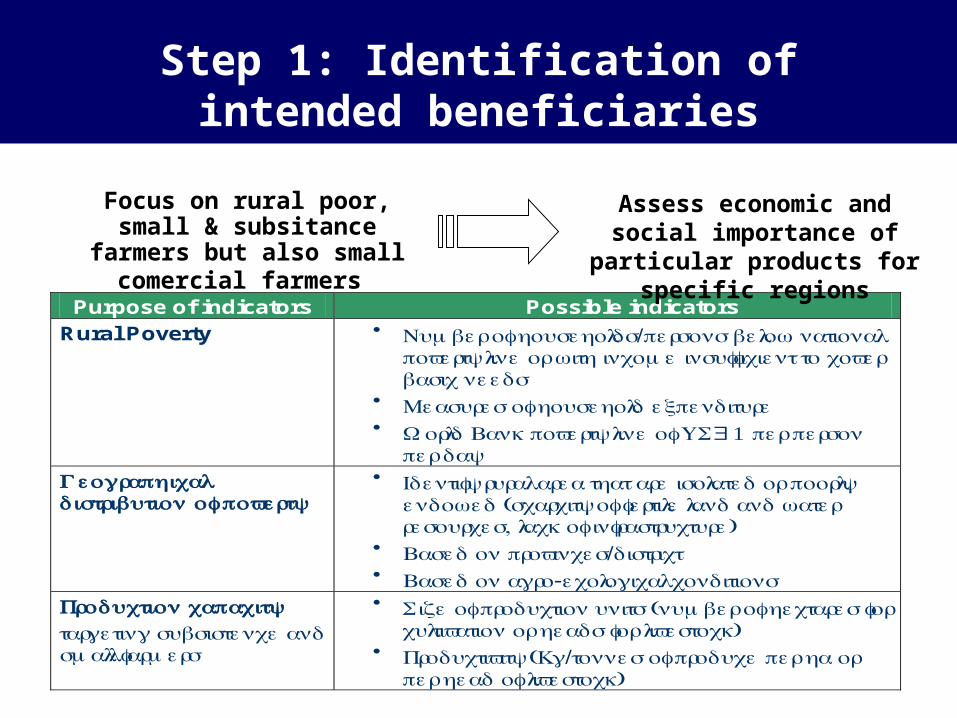
Step 1: Identification of intended beneficiaries
Purpose of indicators Possible indicators
Rural Poverty
• Number of households/persons below national poverty line or with income insufficient to cover basic needs
• Measures of household expenditure • World Bank poverty line of US$ 1 per person
per day Geographical distribution of poverty
• Identify rural area that are isolated or poorly endowed (scarcity of fertile land and water resources, lack of infrastructure)
• Based on provinces/district • Based on agro-ecological conditions
Production capacity targeting subsistence and small farmers
• Size of production units (number of hectares for cultivation or heads for livestock)
• Productivity (Kg/tonnes of produce per ha or per head of livestock)
Focus on rural poor, small & subsitance farmers but also
small comercial farmers
Assess economic and social importance of particular
products for specific regions
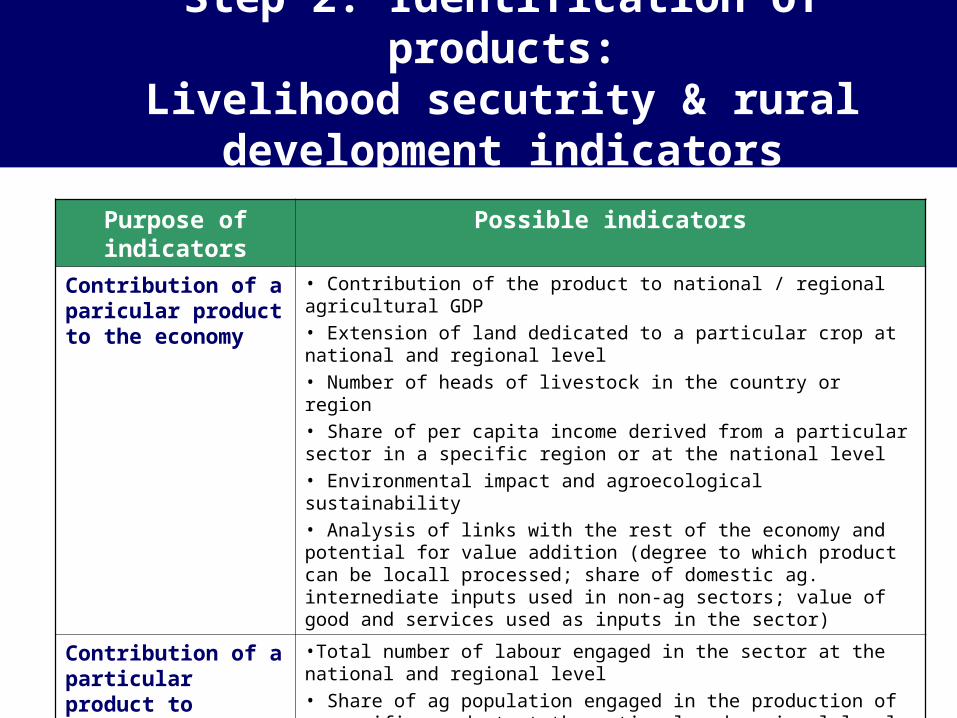
Step 2: Identification of products:Livelihood secutrity & rural
development indicators
Purpose of indicators
Possible indicators
Contribution of a paricular product to the economy
• Contribution of the product to national / regional agricultural GDP• Extension of land dedicated to a particular crop at national and regional level• Number of heads of livestock in the country or region• Share of per capita income derived from a particular sector in a specific region or at the national level• Environmental impact and agroecological sustainability• Analysis of links with the rest of the economy and potential for value addition (degree to which product can be locall processed; share of domestic ag. internediate inputs used in non-ag sectors; value of good and services used as inputs in the sector)
Contribution of a particular product to employment
•Total number of labour engaged in the sector at the national and regional level• Share of ag population engaged in the production of a specific product at the national and regional level• Labour requirement: nb. of workers per day/year to cultivate one ha of land (crop/livestock and technology specific)
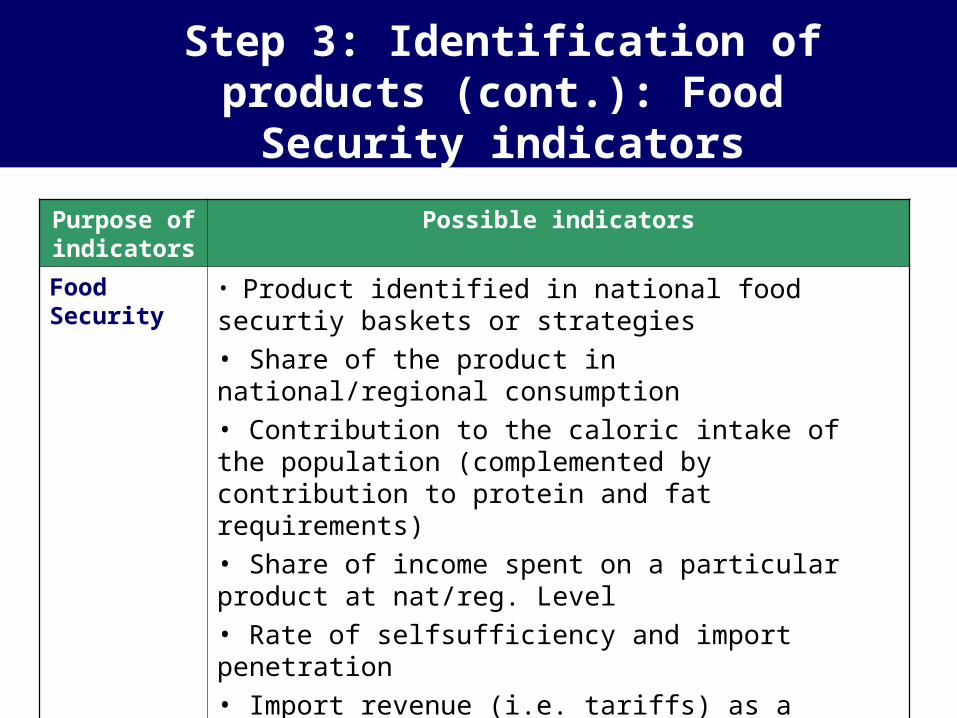
Step 3: Identification of products (cont.): Food Security indicators
Purpose of indicators
Possible indicators
Food Security
• Product identified in national food securtiy baskets or strategies• Share of the product in national/regional consumption• Contribution to the caloric intake of the population (complemented by contribution to protein and fat requirements)• Share of income spent on a particular product at nat/reg. Level• Rate of selfsufficiency and import penetration• Import revenue (i.e. tariffs) as a contribution to financing of food security programmes
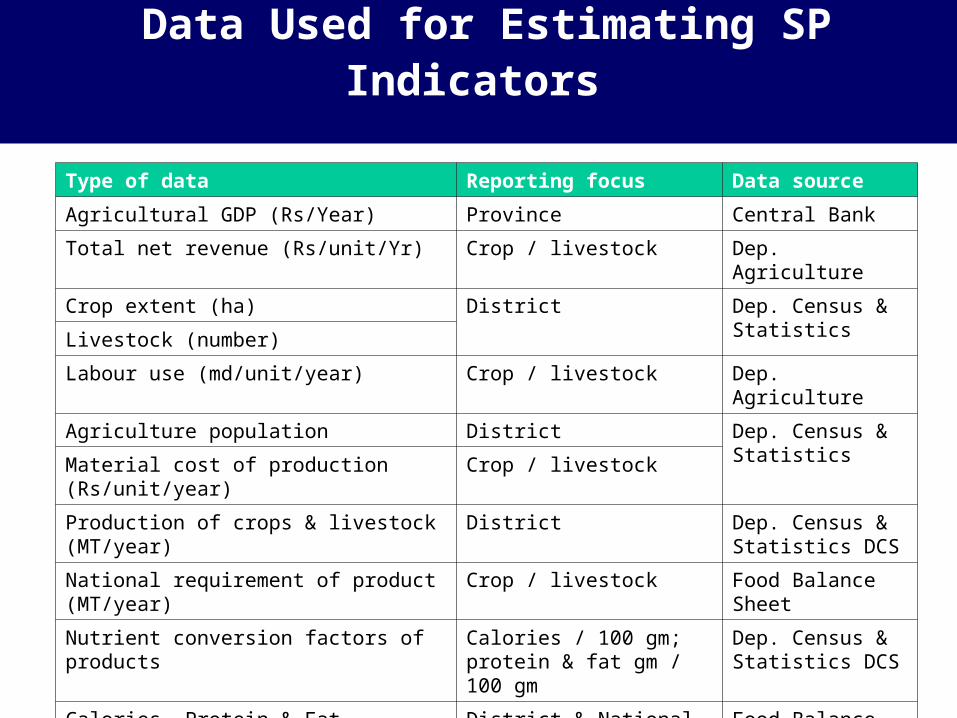
Type of data Reporting focus Data source
Agricultural GDP (Rs/Year) Province Central Bank
Total net revenue (Rs/unit/Yr) Crop / livestock Dep. Agriculture
Crop extent (ha) District Dep. Census & StatisticsLivestock (number)
Labour use (md/unit/year) Crop / livestock Dep. Agriculture
Agriculture population District Dep. Census & StatisticsMaterial cost of production (Rs/unit/year) Crop / livestock
Production of crops & livestock (MT/year) District Dep. Census & Statistics DCS
National requirement of product (MT/year) Crop / livestock Food Balance Sheet
Nutrient conversion factors of products Calories / 100 gm; protein & fat gm / 100 gm
Dep. Census & Statistics DCS
Calories, Protein & Fat requirement District & National Food Balance Sheet
Total imports of products (Mt/Year) National Custom Returns
Data Used for Estimating SP Indicators Data Used for Estimating SP Indicators
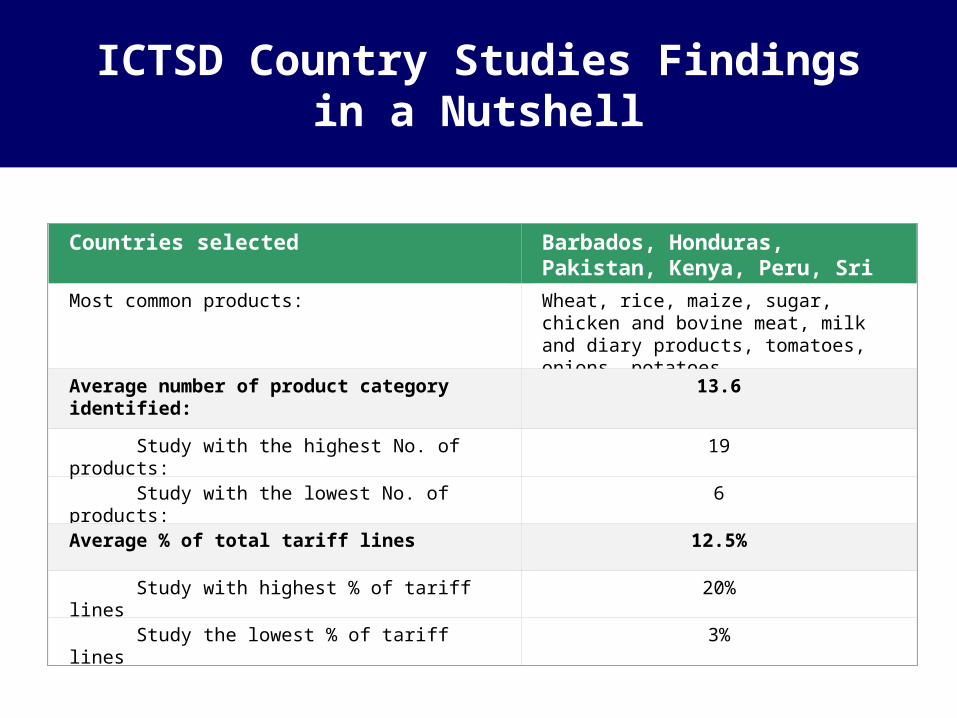
Countries selected Barbados, Honduras, Pakistan, Kenya, Peru, Sri Lanka
Most common products: Wheat, rice, maize, sugar, chicken and bovine meat, milk and diary products, tomatoes, onions, potatoes
Average number of product category identified: 13.6
Study with the highest No. of products: 19
Study with the lowest No. of products: 6
Average % of total tariff lines 12.5%
Study with highest % of tariff lines 20%
Study the lowest % of tariff lines 3%
ICTSD Country Studies Findings in a Nutshell

Supplementary elements for the analysis
• Substitutes
• Unfair competition
• Vulnerability to import displacement
• Current level of protection
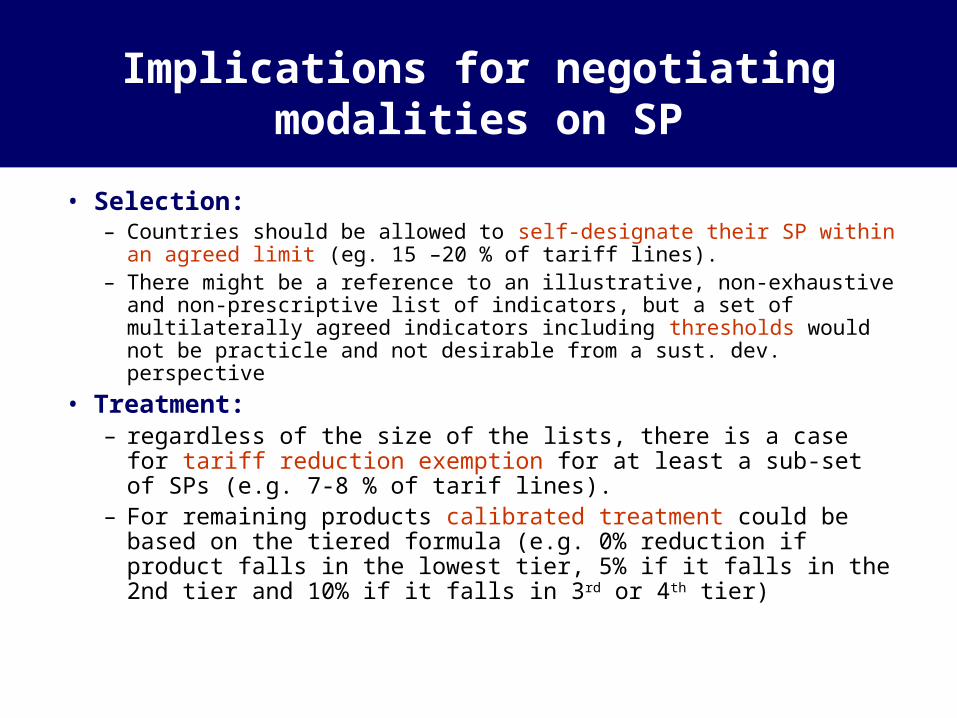
Implications for negotiating modalities on SP
• Selection: – Countries should be allowed to self-designate their SP within an
agreed limit (eg. 15 –20 % of tariff lines).– There might be a reference to an illustrative, non-exhaustive and non-
prescriptive list of indicators, but a set of multilaterally agreed indicators including thresholds would not be practicle and not desirable from a sust. dev. perspective
• Treatment:– regardless of the size of the lists, there is a case for tariff
reduction exemption for at least a sub-set of SPs (e.g. 7-8 % of tarif lines).
– For remaining products calibrated treatment could be based on the tiered formula (e.g. 0% reduction if product falls in the lowest tier, 5% if it falls in the 2nd tier and 10% if it falls in 3rd or 4th tier)