identifying renewable energy potential by innovative ... identifying renewable energy potential by...
TRANSCRIPT
1
Identifying Renewable Energy
potential by innovative
mapping tools
and research platforms
International Off-Grid Renewable Energy Conference November 1-2 2012
Sándor Szabó – Katalin Bódis
2
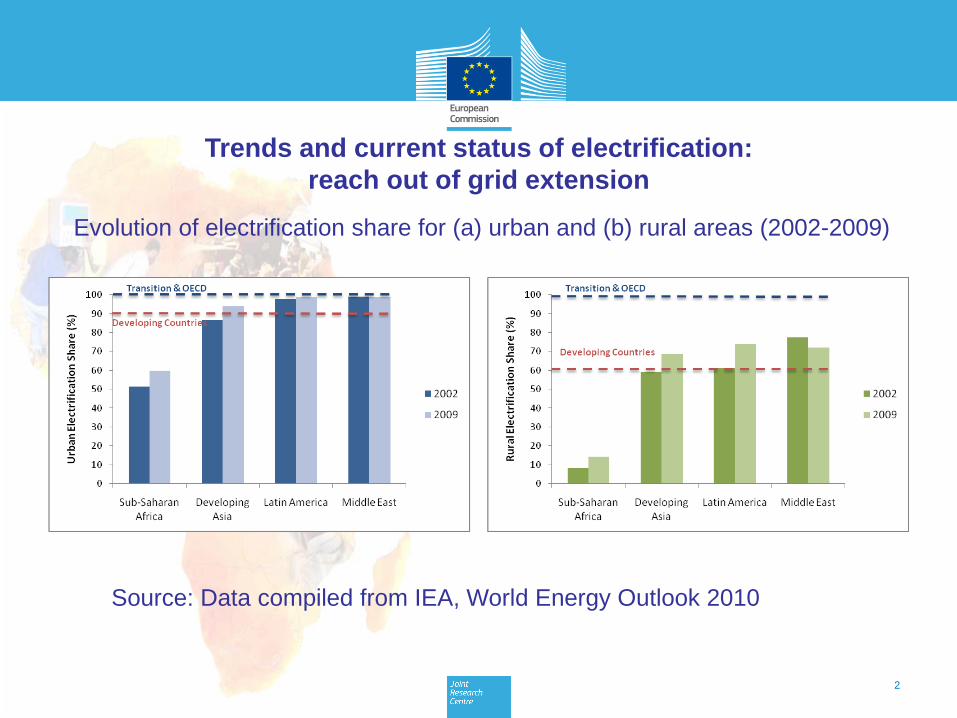
Trends and current status of electrification:
reach out of grid extension
Evolution of electrification share for (a) urban and (b) rural areas (2002-2009)
Source: Data compiled from IEA, World Energy Outlook 2010
3
4
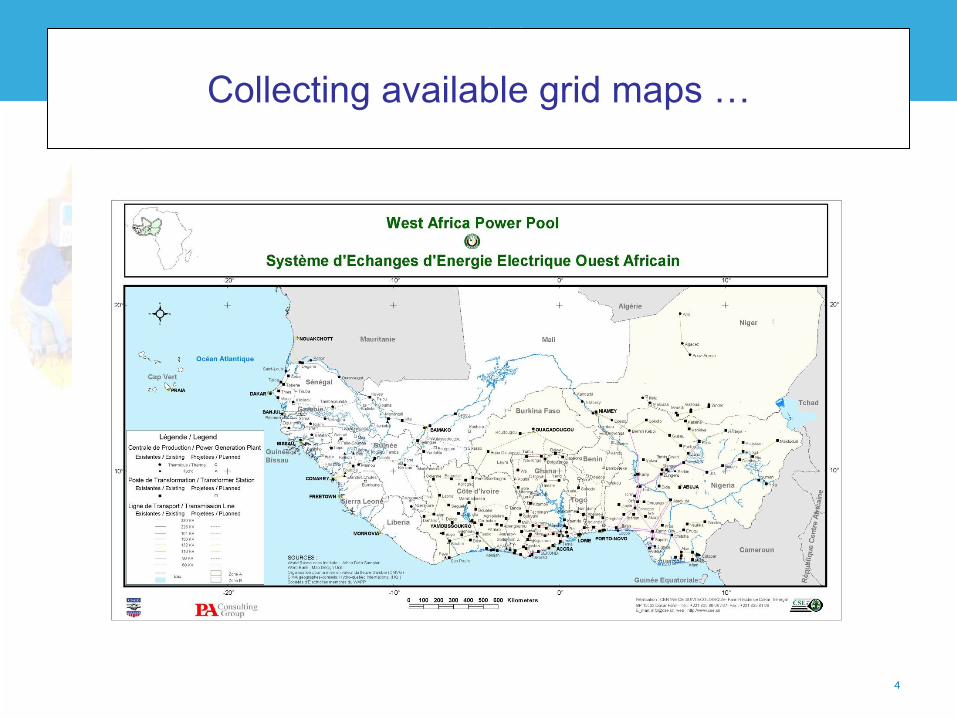
Collecting available grid maps …
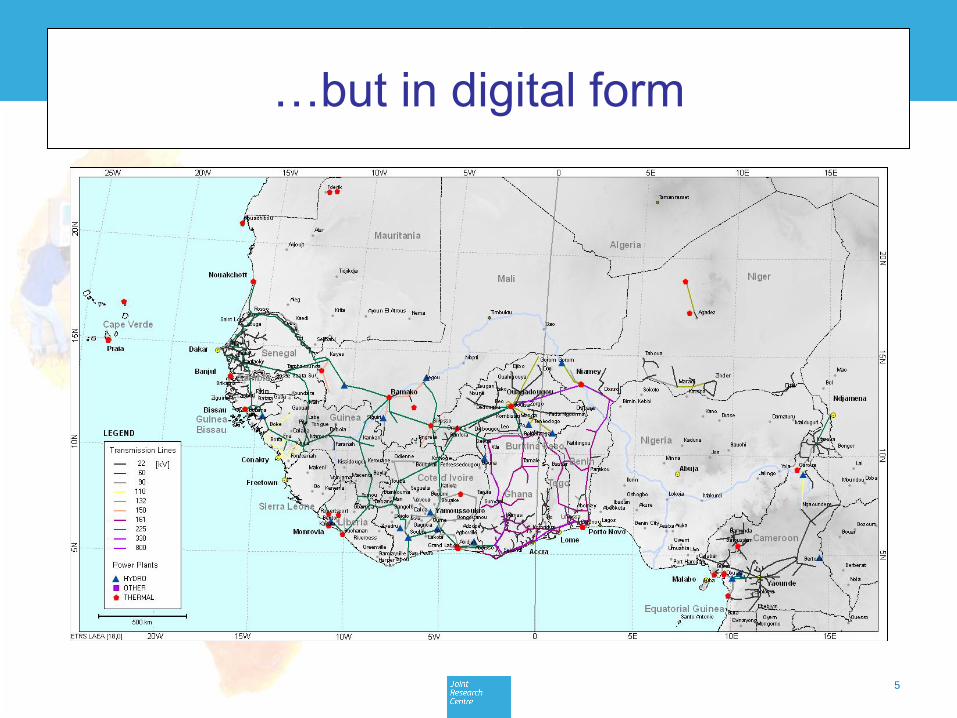
5
…but in digital form
6
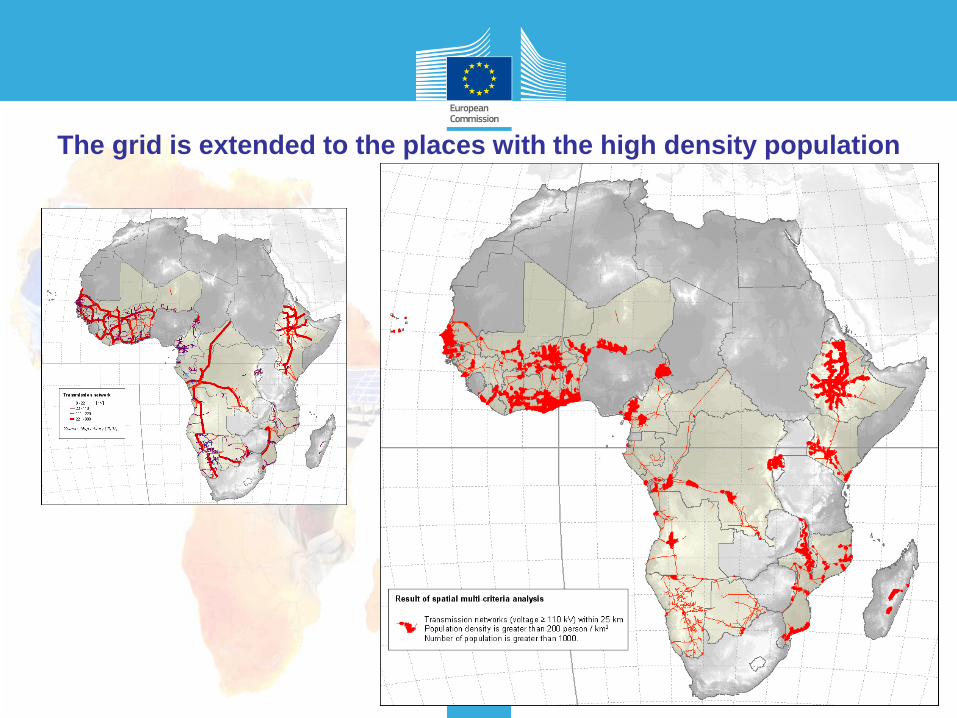
The grid is extended to the places with the high density population
7
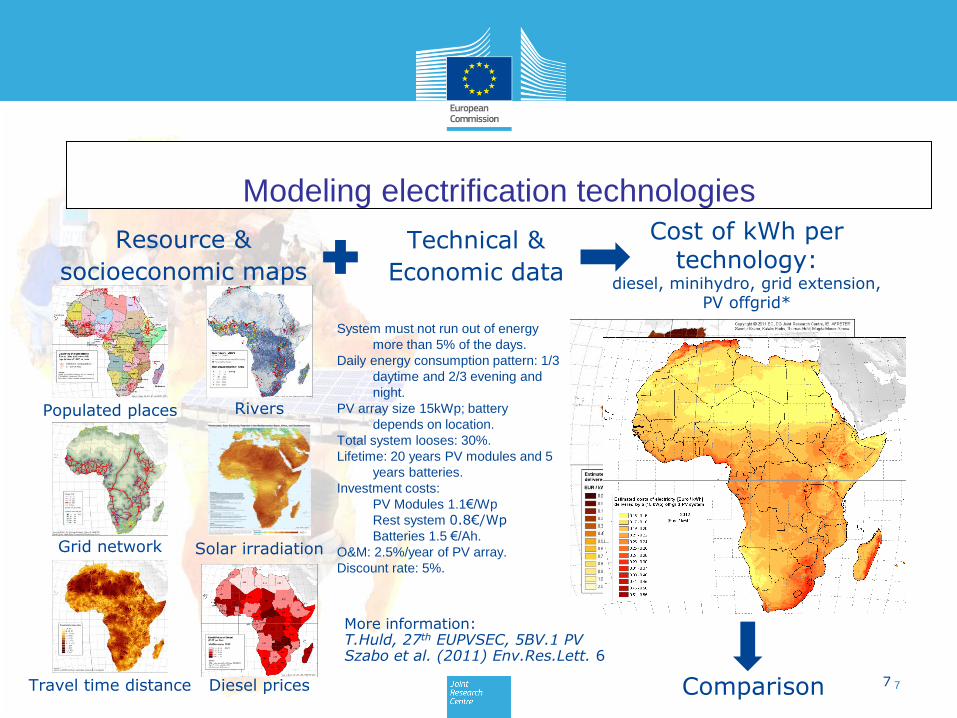
Modeling electrification technologies
7
Populated places
Resource &
socioeconomic maps
Rivers
Grid network Solar irradiation
Travel time distance Diesel prices
More information: T.Huld, 27th EUPVSEC, 5BV.1 PV Szabo et al. (2011) Env.Res.Lett. 6
Technical &
Economic data
Cost of kWh per technology:
diesel, minihydro, grid extension, PV offgrid*
Comparison
System must not run out of energy
more than 5% of the days.
Daily energy consumption pattern: 1/3
daytime and 2/3 evening and
night.
PV array size 15kWp; battery
depends on location.
Total system looses: 30%.
Lifetime: 20 years PV modules and 5
years batteries.
Investment costs:
PV Modules 1.1€/Wp
Rest system 0.8€/Wp Batteries 1.5 €/Ah.
O&M: 2.5%/year of PV array.
Discount rate: 5%.
8
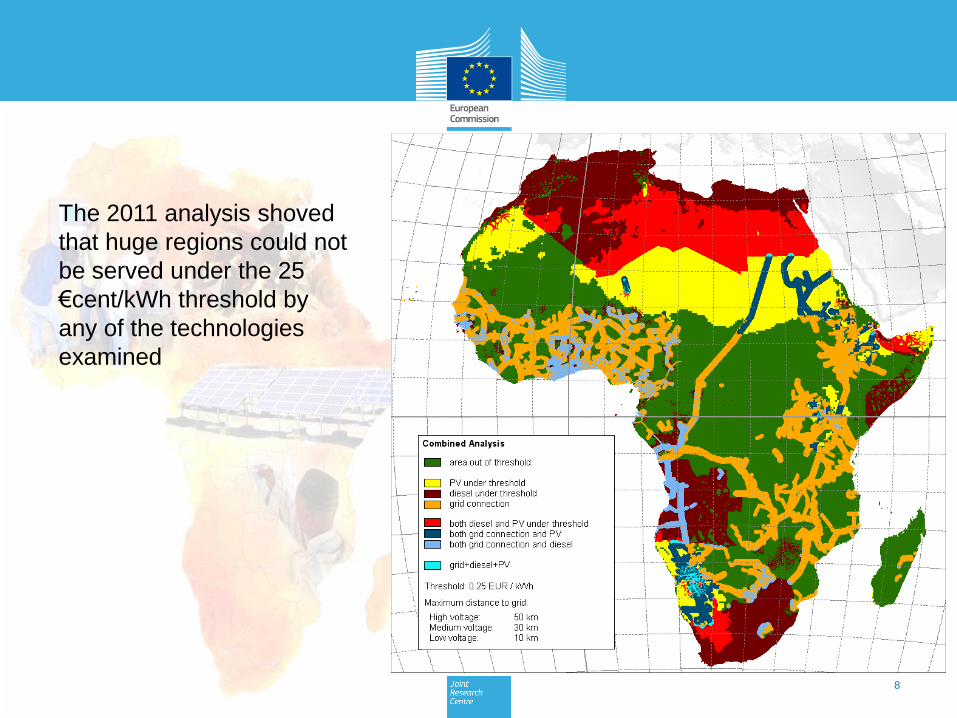
The 2011 analysis shoved
that huge regions could not
be served under the 25
€cent/kWh threshold by
any of the technologies
examined
9
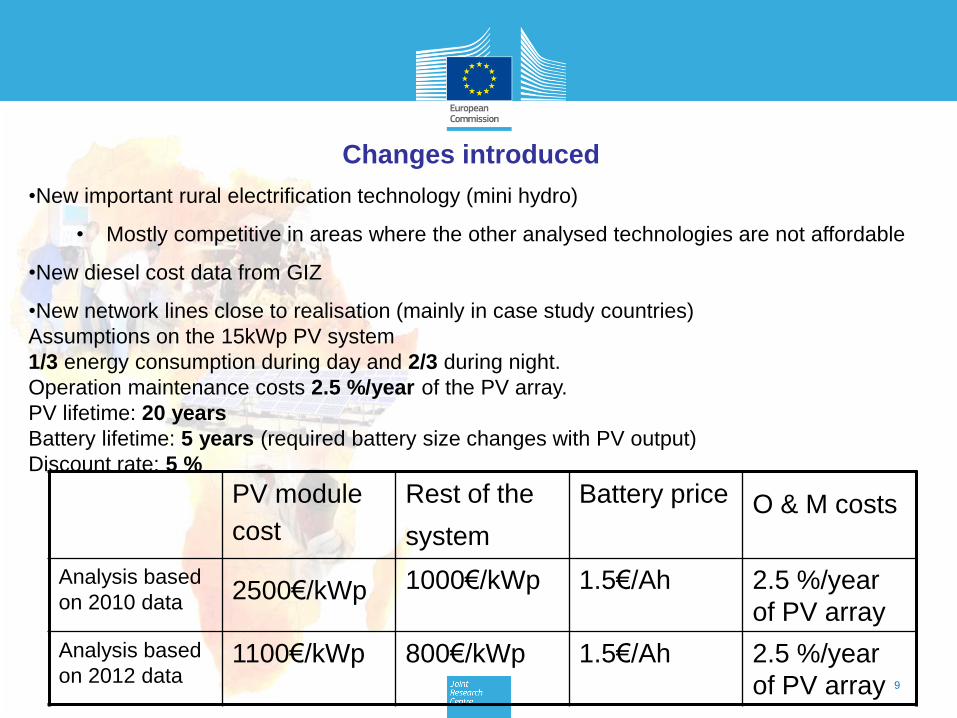
Changes introduced
•New important rural electrification technology (mini hydro)
• Mostly competitive in areas where the other analysed technologies are not affordable
•New diesel cost data from GIZ
•New network lines close to realisation (mainly in case study countries)
Assumptions on the 15kWp PV system
1/3 energy consumption during day and 2/3 during night.
Operation maintenance costs 2.5 %/year of the PV array.
PV lifetime: 20 years
Battery lifetime: 5 years (required battery size changes with PV output)
Discount rate: 5 %
PV module
cost Rest of the
system Battery price O & M costs
Analysis based
on 2010 data 2500€/kWp 1000€/kWp 1.5€/Ah 2.5 %/year
of PV array
Analysis based
on 2012 data 1100€/kWp 800€/kWp 1.5€/Ah 2.5 %/year
of PV array

10
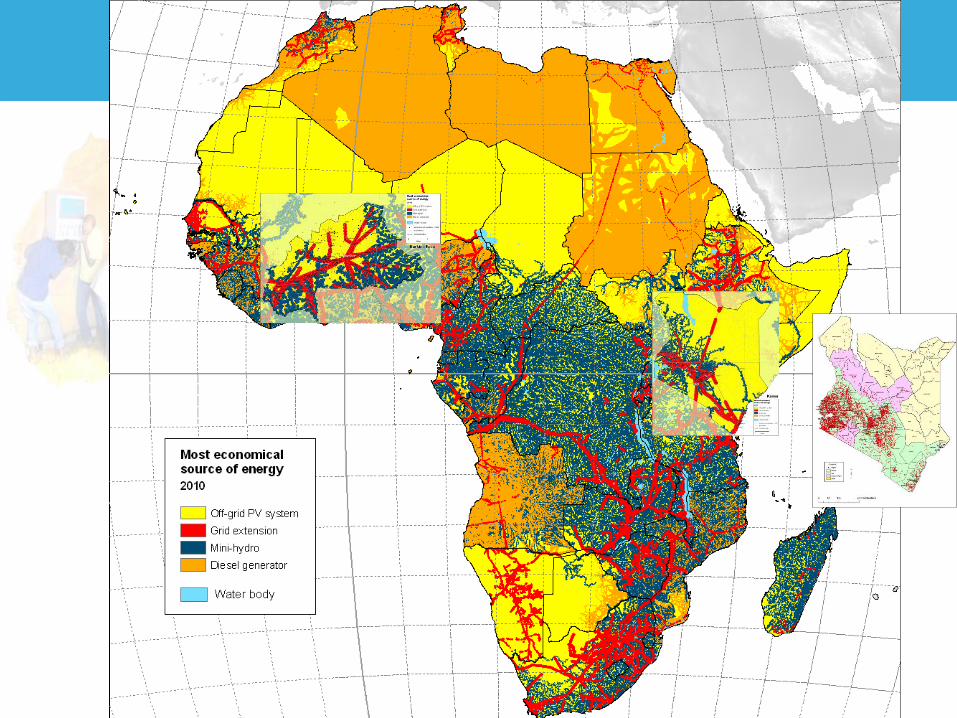
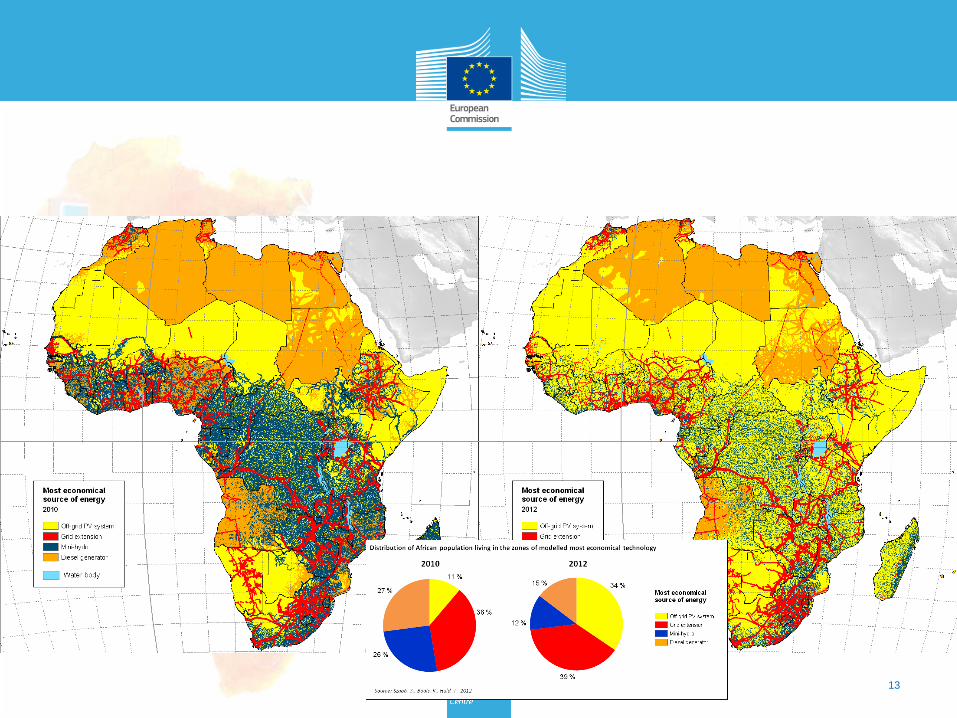
The kWh electricity cost using the
2010 PV module cost data The kWh electricity cost using the
2012 PV module cost data
11
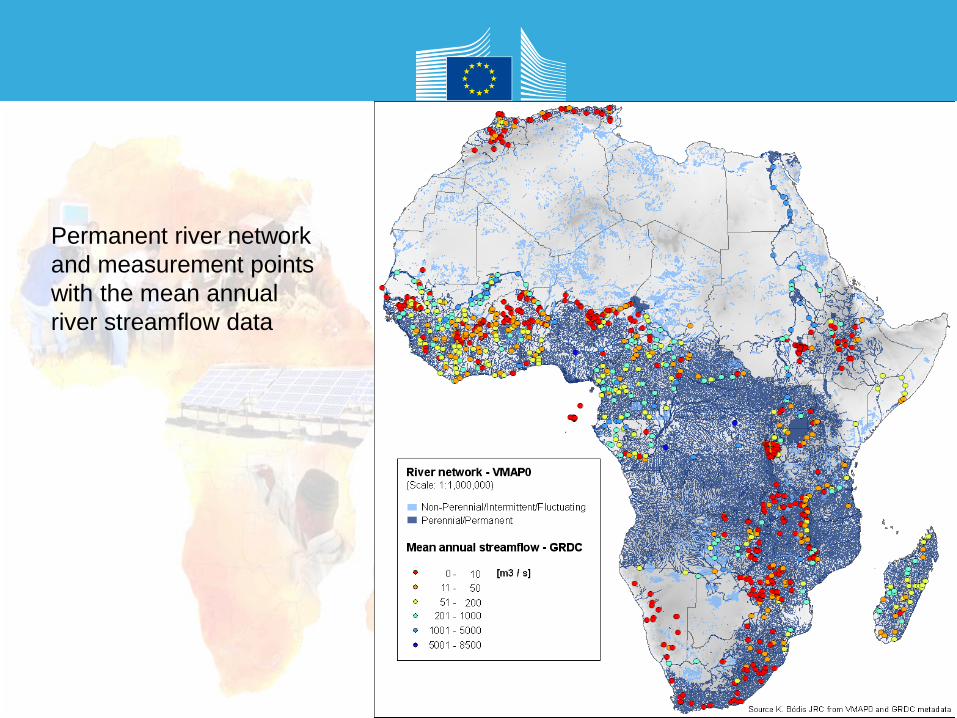
Permanent river network
and measurement points
with the mean annual
river streamflow data
12 12
13
14
The maps show clearly how the competitiveness of the different
rural electrification options have changed due to the
technological learning, diesel price and due to the changing
subsidy policies.
Despite the PV became the cheapest rural electrification option
in vast territories of Africa, the high up-front costs require that the
market find non-traditional commercialisation. As the ability-to-
play is very low compared to the rest of the world the system has
to be paid during the operation from the generated cash flow or
in small yearly instalments.
The Africa-Eu Energy Partnership can instrumental in setting up
the right business-public policy framework. www.aeep-
forum.org/en/aeep
Adequate partners are needed which require networking: ARE,
AREA or AFRETEP could be a good way to start with.
15
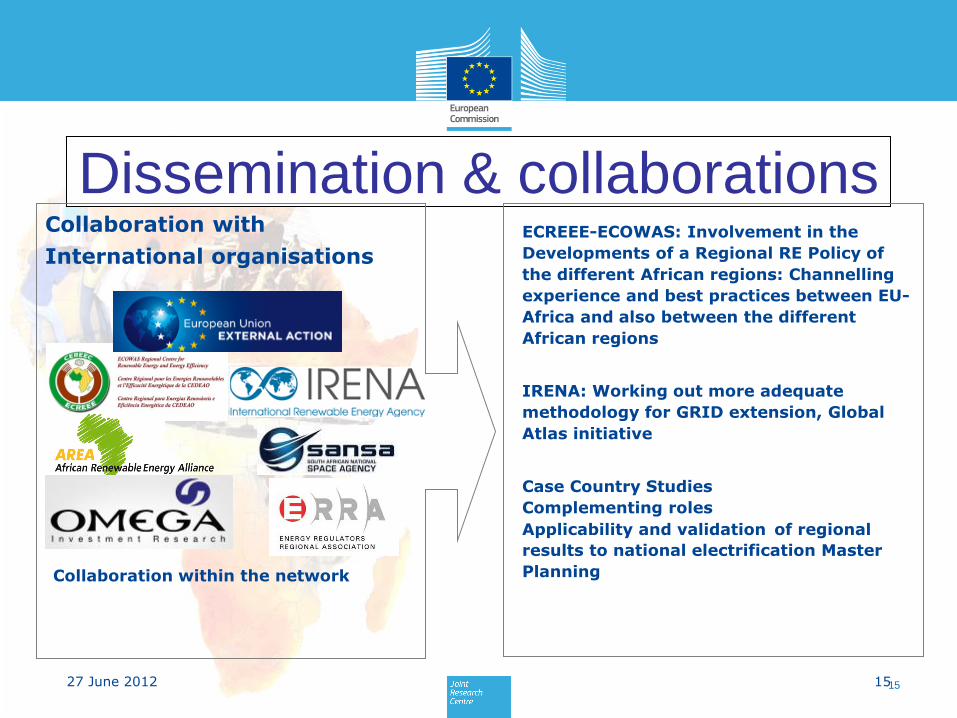
Dissemination & collaborations
27 June 2012 15
Collaboration with
International organisations
Collaboration within the network
ECREEE-ECOWAS: Involvement in the
Developments of a Regional RE Policy of
the different African regions: Channelling
experience and best practices between EU-
Africa and also between the different
African regions
IRENA: Working out more adequate
methodology for GRID extension, Global
Atlas initiative
Case Country Studies
Complementing roles
Applicability and validation of regional
results to national electrification Master
Planning
16
• Thanks for your
attention
• www.afretep.net