identifying auditory attention with ear-eeg: ceegrid versus high
TRANSCRIPT

This content has been downloaded from IOPscience. Please scroll down to see the full text.
Download details:
This content was downloaded by: martinbleichner
IP Address: 134.106.150.180
This content was downloaded on 05/10/2016 at 14:30
Please note that terms and conditions apply.
Identifying auditory attention with ear-EEG: cEEGrid versus high-density cap-EEG
comparison
View the table of contents for this issue, or go to the journal homepage for more
2016 J. Neural Eng. 13 066004
(http://iopscience.iop.org/1741-2552/13/6/066004)
Home Search Collections Journals About Contact us My IOPscience

Identifying auditory attention with ear-EEG:cEEGrid versus high-density cap-EEGcomparison
Martin G Bleichner1,2,4, Bojana Mirkovic1,2 and Stefan Debener1,2,3
1Department of Psychology, Neurospsychology Lab, University of Oldenburg, Oldenburg, Germany2Cluster of Excellence Hearing4all, Oldenburg, Germany3Research Center Neurosensory Science, University of Oldenburg, Oldenburg, Germany
E-mail: [email protected]
Received 26 April 2016, revised 7 August 2016Accepted for publication 26 August 2016Published 5 October 2016
AbstractObjective. This study presents a direct comparison of a classical EEG cap setup with a newaround-the-ear electrode array (cEEGrid) to gain a better understanding of the potential of ear-centered EEG. Approach. Concurrent EEG was recorded from a classical scalp EEG cap and twocEEGrids that were placed around the left and the right ear. Twenty participants performed aspatial auditory attention task in which three sound streams were presented simultaneously. Thesound streams were three seconds long and differed in the direction of origin (front, left, right)and the number of beats (3, 4, 5 respectively), as well as the timbre and pitch. The participantshad to attend to either the left or the right sound stream. Main results. We found clear attentionmodulated ERP effects reflecting the attended sound stream for both electrode setups, whichagreed in morphology and effect size. A single-trial template matching classification showed thatthe direction of attention could be decoded significantly above chance (50%) for at least 16 outof 20 participants for both systems. The comparably high classification results of the single trialanalysis underline the quality of the signal recorded with the cEEGrids. Significance. Thesefindings are further evidence for the feasibility of around the-ear EEG recordings anddemonstrate that well described ERPs can be measured. We conclude that concealed behind-the-ear EEG recordings can be an alternative to classical cap EEG acquisition for auditory attentionmonitoring.
Keywords: ear-EEG, cEEGrid, auditory attention, mobile EEG
(Some figures may appear in colour only in the online journal)
Introduction
Electroencephalography (EEG) is extensively used in neu-roscience to study the brain–behavior relationship. EEGhardware is relatively low-priced and provides the
possibility to conduct mobile brain electrical activityrecordings outside the classical lab environment (Debeneret al 2012, de Vos and Debener 2013, Lin et al 2014). EEGstudies ‘in the wild’ enable the study of brain function incomplex, ecologically valid situations (Gramann 2011,2014, Wascher et al 2014). Beyond helping to understandhow the brain functions in everyday situations, mobile EEGcan also be used for every day application such as brain–computer interfaces (De Vos et al 2014) and to addressclinical needs, such as continuous EEG monitoring in epi-lepsy patients (Askamp and van Putten 2014). However,major limitations in this context are the need of electrode
Journal of Neural Engineering
J. Neural Eng. 13 (2016) 066004 (13pp) doi:10.1088/1741-2560/13/6/066004
4 Author to whom any correspondence should be addressed
Original content from this work may be used under the termsof the Creative Commons Attribution 3.0 licence. Any
further distribution of this work must maintain attribution to the author(s) andthe title of the work, journal citation and DOI.
1741-2560/16/066004+13$33.00 © 2016 IOP Publishing Ltd Printed in the UK1

caps, and the clear visibility and poor comfort this tech-nology comes with.
Classical head-mounted EEG caps are impractical forout-of-the-lab recordings and every day usage for severalreasons. One is that they are not well accepted in publicsituations as they would raise attention of others (Askamp andvan Putten 2014, Lee et al 2014). To solve this problem anumber of ear-centered EEG systems have been proposed asan alternative that measure the EEG signal using miniaturizedelectrodes placed inside the outer ear-canal, the concha, oraround the ear (Looney et al 2011, Lee et al 2014, Bleichneret al 2015, Debener et al 2015, Norton et al 2015). In-ear andaround-the-ear electrodes can be worn comfortably and maynot raise attention from others, that is, concealed use would bepossible. Moreover, ear-centered EEG may interfere less withthe participant’s normal behavior and may not alter thebehavior of other people around, hence it would be sociallyacceptable for every day usage. In combination with minia-ture wireless amplifiers and smartphone signal acquisition(Debener et al 2015) ear-centered EEG provides newopportunities for clinical as well as research-dedicatedapplications. Several studies have shown that ear-centeredEEG can capture some of the signals that can be capturedwith classical scalp EEG very well. Obviously the location ofear electrodes, and the biased, smaller spatial coverage of thehead sphere may make ear-centered EEG highly sensitive tosome brain activity features and blind to others. However, dueto the effects of volume conduction even far-field signalsoriginating in remote cortical locations may be captured with
ear-centered EEG, as we and others have shown (Kidmoseet al 2013, Bleichner et al 2015, Debener et al 2015).
Based on the results of a previous study (Bleichneret al 2015) we have developed a c-shaped multi-electrodearray that is placed around the ear (cEEGrid; Debeneret al 2015). The cEEGrids are designed as semi-disposableelectrode grids. The flexprint material includes several layersof a biocompatible polyimide, the conductive parts consist ofgold plated ends, pure copper traces, and conductive Ag/AgCl based polymer thick film ink. The ten electrodes arepositioned around the ear using a double-sided adhesive tape(figure 1). A small amount of electrolyte electrode gel assuresa low impedance electrode–skin contact. The conductive gelused to make the contact between cEEGrid electrodes andskin does not dry out over time as the electrode skin con-nection is sealed by the adhesive tape around the electrodes.We could show that the skin electrode contact is stable overthe course of several hours, enabling the continuous recordingof oscillatory as well as event-related potentials (Debeneret al 2015).
The objective of the current study is to further evaluatethe potential of the cEEGrid. Here we directly comparecEEGrid recorded EEG signals with concurrently recordedcap-EEG signals. Firstly, to see which ERP effects (and towhat degree) of spatial auditory attention are detectable in thecEEGrid EEG in comparison to classical scalp EEG. Sec-ondly, to evaluate whether single trial classification of spatialauditory attention is feasible using only the cEEGrid.Addressing these points is crucial to evaluate whether thecEEGrid, which allows for concealed EEG recordings, could
Figure 1. The digitized electrode positions of the cap-EEG (black) and cEEGrid (green) electrodes. The electrodes E27 and E25 (marked inred) were used as linked mastoid reference substitute for the cap, as no cap electrodes are located on the mastoids. Further bipolar derivationswere computed between the electrodes E79 and E27, and the electrodes E73 and E25. The renderings were generated with the Brainstorm3software. The cEEGrids are attached around the ear (inset upper left corner) with a double sided adhesive tape. The cEEGrids are designed assemi-disposable electrode grids. The flexprint material includes several layers of a biocompatible polyamide, the conductive parts consist ofgold plated ends, pure copper traces, and conductive Ag/AgCl based polymer thick film ink. Middle: The electrode positions of the left andthe right cEEGrid with the corresponding channel names. R4a and R4b serve as ground and reference during the recording. L4a and L4b arenot considered in the analysis to keep the number of electrodes the same on both head sides. Below: The lines indicate the 32 bipolarchannels that were used for the cEEGrid EEG classification. Center: Bipolar channels are considered to have an angle of 0° if the comprisingelectrodes are arranged vertically and 90° if they are arranged horizontally.
2
J. Neural Eng. 13 (2016) 066004 M G Bleichner et al
be an alternative to cap-EEG for auditory attentionmonitoring.
A paradigm developed by Choi et al (2013) was used, asit represents an approach that is potentially suitable for anauditory BCI application. Three auditory streams, whichdiffer from each other in timbre, pitch progression, number oftones and sound direction, are presented simultaneously. Theparticipants were asked to pay attention to one of the streamsand to state whether the pitch progression was ascending,descending or alternating. These complex sound streamsprovide several cues for the listener to attend to, but they alsoprovide a complex, challenging soundscape that requires thelistener to pay attention to successfully complete the task.Choi et al (2013) showed that the temporal structure (i.e.onset of the tones) of the attended sound stream is reflected inthe EEG trace and can be identified on a single-trial bases. Weasked whether this finding can be confirmed in cEEGridrecordings. By directly comparing the simultaneously recor-ded cEEGrid and high-density scalp-EEG signals we wereable to quantify the loss concealed EEG may come with thetask of monitoring someone’s auditory attention.
Methods
Participants
Twenty individuals participated in the study (mean age 25, 8male, 1 left-handed) with self-reported normal hearing. Thestudy was approved by the local ethics committee of theUniversity of Oldenburg. All participants signed writteninformed consent prior to the experiment and were financiallycompensated for their participation.
Task
Participants performed an auditory attention task in whichthey had to shift their attention to one of several soundstreams. Three concurrent sound streams were presented forthree seconds. The streams differed in timbre (cello, oboe, andclarinet sound), sound direction (front, left, right) and numberof tones (3, 4, and 5 respectively). Each stream was con-structed of a sequence of tones that differed in pitch (for adetailed description of the construction of the tones please seeChoi et al 2013). The tones were generated with Matlab(MATLAB R2012a, The Mathworks Inc. Natick, MA, USA)and had a sampling rate of 44 100 Hz. Each tone had a 100ms cosine squared onset and offset ramp. The stream from theleft side consisted of four tones (tone length 750 ms) whichwere based on a cello sound with a pitch of either 240 Hz or300 Hz. The stream from the right side consisted of five tones(tone length 600 ms), the tones were based on an oboe soundwith a pitch of either 720 or 900 Hz. The stream from thecenter consisted of three tones (tone length 1000 ms), thetones were based on a clarinet sound with a pitch of either 320or 400 Hz. All three streams started simultaneously while thetone onsets of the remaining tones did not coincide in time. Ineach sequence the pitch changed either once or twice within
the trial, resulting either in an ascending, descending oralternating tone sequence. An ascending sequence startedwith a low pitch tone and ended with a high pitch tone afterthe pitch was changed once in between, a descendingsequence started with a high pitch tone and ended with a lowpitch tone after the pitch was changed once in between. Thealternating sequence started and ended with the same tonepitch and the pitch was changed twice during the trial.
Listeners were instructed to pay either attention to the leftor the right stream, but never the central stream. The side tobe attended was cued by an arrow pointing either to the left orthe right side, and listeners were instructed to indicate whe-ther the attended sequence was ascending (press 8 on thenumpad), descending (press 2) or alternating (press 5). In total160 trials were presented. Participants were cued 80 times topay attention to the left stream and 80 times to pay attentionthe right stream.
Prior to the experiment participants had to fill in theGoldsmiths musical sophistication index(GOLD-MSI) toassess whether the musical background of the participants isrelated to task performance (Müllensiefen et al 2014, Schaalet al 2014).
Stimulus material and presentation
Stimulus presentation was controlled using the Psychophysics3 toolbox for Matlab (Brainard 1997, Pelli 1997, Kleineret al 2007). The sounds were presented binaurally in asoundproof booth at a comfortable listening level over EAR-Tone 3A insert earphones (3M Auditory Systems, Indiana-polis, Unites States).
At the beginning of each trial a fixation point and anarrow indicating which stream had to be attended were pre-sented in white on a black background on a computer screendistanced 1.3 m from the participant. The participants initiatedeach trial by pressing a button with their left hand, after whichthe arrow disappeared. The sound sequence started 1200 mslater, was presented for 3000 ms, and the participants had1000 ms to give a response.
Procedure
After washing the hair and the skin around the ears thecEEGrid and the EEG cap were fitted. To each cEEGrid adouble-sided sticky tape was attached and a drop of electro-lyte gel was applied to each electrode (Abralyt HiCl, EasycapGmbH, Germany). The cEEGrids were positioned around theears (figure 1, inset). Afterwards, the EEG caps were fitted.To each electrode the same electrolyte gel was applied andgood impedance was assured for all electrodes (below 20 kΩ).After fitting of the cap the cEEGrids were connected with awireless head-mounted amplifier (for details see below),which was attached with a headband at the back of the head.Electrodes from the EEG cap were attached to a secondamplifier. During the recording, participants were seated inthe sound shielded room in a comfortable chair.
The task took approximately 18 min, depending on howquickly the participant initiated the next trial. After
3
J. Neural Eng. 13 (2016) 066004 M G Bleichner et al
completion participants performed two other tasks which willbe reported elsewhere. After EEG acquisition the exactpositions of all cap and cEEGrid electrodes were digitized(Xensor electrode digitizer, ANT Neuro, The Netherlands).
Signal acquisition
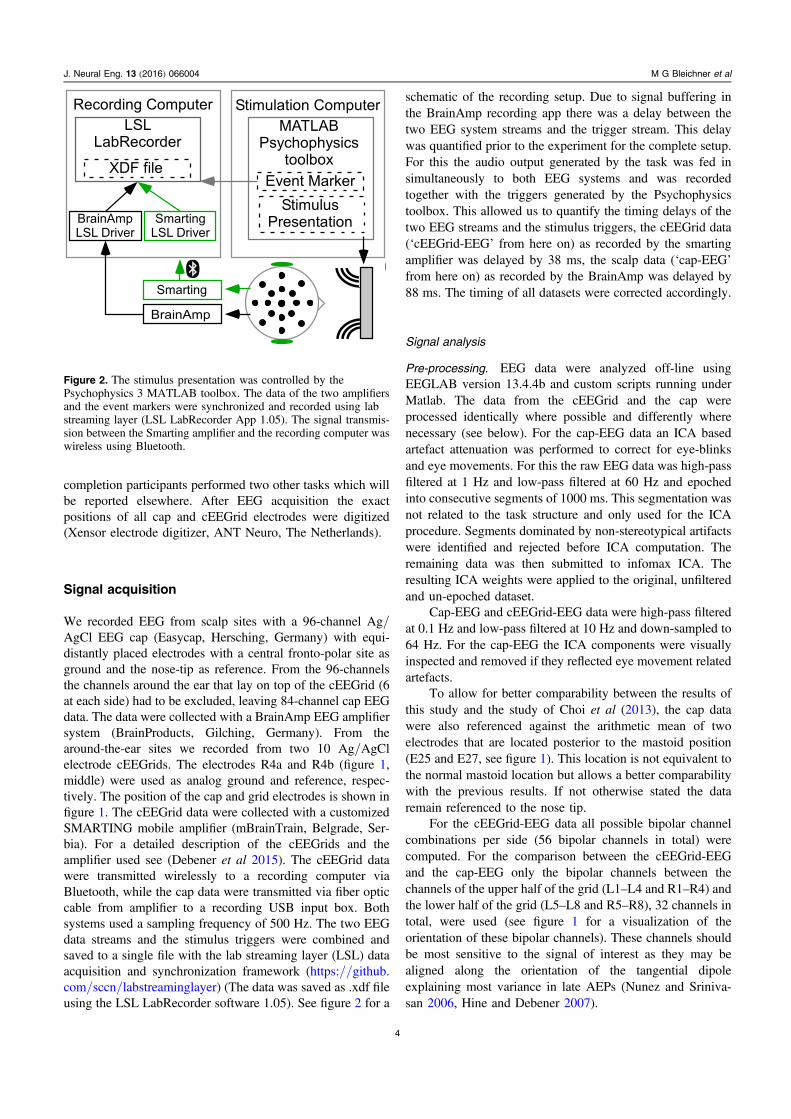
We recorded EEG from scalp sites with a 96-channel Ag/AgCl EEG cap (Easycap, Hersching, Germany) with equi-distantly placed electrodes with a central fronto-polar site asground and the nose-tip as reference. From the 96-channelsthe channels around the ear that lay on top of the cEEGrid (6at each side) had to be excluded, leaving 84-channel cap EEGdata. The data were collected with a BrainAmp EEG amplifiersystem (BrainProducts, Gilching, Germany). From thearound-the-ear sites we recorded from two 10 Ag/AgClelectrode cEEGrids. The electrodes R4a and R4b (figure 1,middle) were used as analog ground and reference, respec-tively. The position of the cap and grid electrodes is shown infigure 1. The cEEGrid data were collected with a customizedSMARTING mobile amplifier (mBrainTrain, Belgrade, Ser-bia). For a detailed description of the cEEGrids and theamplifier used see (Debener et al 2015). The cEEGrid datawere transmitted wirelessly to a recording computer viaBluetooth, while the cap data were transmitted via fiber opticcable from amplifier to a recording USB input box. Bothsystems used a sampling frequency of 500 Hz. The two EEGdata streams and the stimulus triggers were combined andsaved to a single file with the lab streaming layer (LSL) dataacquisition and synchronization framework (https://github.com/sccn/labstreaminglayer) (The data was saved as .xdf fileusing the LSL LabRecorder software 1.05). See figure 2 for a
schematic of the recording setup. Due to signal buffering inthe BrainAmp recording app there was a delay between thetwo EEG system streams and the trigger stream. This delaywas quantified prior to the experiment for the complete setup.For this the audio output generated by the task was fed insimultaneously to both EEG systems and was recordedtogether with the triggers generated by the Psychophysicstoolbox. This allowed us to quantify the timing delays of thetwo EEG streams and the stimulus triggers, the cEEGrid data(‘cEEGrid-EEG’ from here on) as recorded by the smartingamplifier was delayed by 38 ms, the scalp data (‘cap-EEG’from here on) as recorded by the BrainAmp was delayed by88 ms. The timing of all datasets were corrected accordingly.
Signal analysis
Pre-processing. EEG data were analyzed off-line usingEEGLAB version 13.4.4b and custom scripts running underMatlab. The data from the cEEGrid and the cap wereprocessed identically where possible and differently wherenecessary (see below). For the cap-EEG data an ICA basedartefact attenuation was performed to correct for eye-blinksand eye movements. For this the raw EEG data was high-passfiltered at 1 Hz and low-pass filtered at 60 Hz and epochedinto consecutive segments of 1000 ms. This segmentation wasnot related to the task structure and only used for the ICAprocedure. Segments dominated by non-stereotypical artifactswere identified and rejected before ICA computation. Theremaining data was then submitted to infomax ICA. Theresulting ICA weights were applied to the original, unfilteredand un-epoched dataset.
Cap-EEG and cEEGrid-EEG data were high-pass filteredat 0.1 Hz and low-pass filtered at 10 Hz and down-sampled to64 Hz. For the cap-EEG the ICA components were visuallyinspected and removed if they reflected eye movement relatedartefacts.
To allow for better comparability between the results ofthis study and the study of Choi et al (2013), the cap datawere also referenced against the arithmetic mean of twoelectrodes that are located posterior to the mastoid position(E25 and E27, see figure 1). This location is not equivalent tothe normal mastoid location but allows a better comparabilitywith the previous results. If not otherwise stated the dataremain referenced to the nose tip.
For the cEEGrid-EEG data all possible bipolar channelcombinations per side (56 bipolar channels in total) werecomputed. For the comparison between the cEEGrid-EEGand the cap-EEG only the bipolar channels between thechannels of the upper half of the grid (L1–L4 and R1–R4) andthe lower half of the grid (L5–L8 and R5–R8), 32 channels intotal, were used (see figure 1 for a visualization of theorientation of these bipolar channels). These channels shouldbe most sensitive to the signal of interest as they may bealigned along the orientation of the tangential dipoleexplaining most variance in late AEPs (Nunez and Sriniva-san 2006, Hine and Debener 2007).
Figure 2. The stimulus presentation was controlled by thePsychophysics 3 MATLAB toolbox. The data of the two amplifiersand the event markers were synchronized and recorded using labstreaming layer (LSL LabRecorder App 1.05). The signal transmis-sion between the Smarting amplifier and the recording computer waswireless using Bluetooth.
4
J. Neural Eng. 13 (2016) 066004 M G Bleichner et al

Epoching. For ERP analysis and single trial classification,epochs from 0 to 3000 ms were extracted relative to the onsetof the sound stream. The mean of the entire epoch was usedfor baseline correction. Epochs dominated by artifacts wereidentified using the probability criteria implemented inEEGLAB (standard deviation: 2) and rejected from furtheranalysis. After removing these trials and the trials withincorrect responses, a minimum of 25% of the trials (for theparticipant with the worst task performance) and a maximumof 80% of the trials was available for analysis (mean 53%).The grand average ERP was computed for the attend-left andattend-right condition by averaging over all trials from onecondition and consequently over all datasets.
ERP analysis. For the statistical analysis of the attend-leftand attend-right ERP we performed a mass univariate analysisfor all electrodes and all times points using a permutation testwith 2500 permutations with a strong control of the familywise error rate (FWER) as described in (Groppe et al 2011)and implemented for EEGLAB (tmax, Mass Univariate ERPToolbox, http://openwetware.org/wiki/Mass_Univariate_ERP_Toolbox). For the cap data all electrodes and all timepoints between 0 and 3000 ms were included in the test. Forthe cEEGrid data all bipolar pairs with a vertical orientation(see above) and all time points between 0 and 3000 ms wereincluded in the test. Additionally, we performed anotherpermutation test for the cEEGrid data where we comparedeight horizontally oriented channel pairs (L2–L3, L1–L4, L8–L5, L7–L6 and R2–R3, R1–R4, R8–R5, R7–R6) and eightvertically oriented channel pairs (L1–L8, L2–L7, L3–L6, L4–L5 and R1–R8, R2–R7, R3–R6, R4–R5) of the left and rightcEEGrid, to get an estimate of the effect of the channelorientation on the signal of interest.
To analyze the attention effect on the single tone level(attended and unattended) we extracted sub-epochs from thetrials that were used in the above analysis. For each tone(excluding the first one) an epoch was extracted from 0 to 600ms relative to the single tone onsets. For the attend-leftcondition we extracted three epochs per trial corresponding tothe last three notes of the left stream (attended notes) and fourepochs corresponding to the last four notes of the right stream(unattended notes). For the attend-right condition weextracted four epochs corresponding to the last four notesof the right stream (attended notes) and the last three notes ofthe left stream (unattended notes). The attended tone of theattend-left and the attend-right condition were combined, aswere the unattended tones. The grand average ERPs forattend-left and attend-right were computed. The effect size ofattended versus unattended tones was measured as Hedges’ gbetween 0 and 600 ms. Hedges’ g is a variation of Cohen’s dbut reduces the estimation error for smaller samples bycorrecting the pooled variance. The interpretation of Hedges’g is analogous to Cohen’s d, and effect size above 0.8 isconsidered as large. For the ERP analysis we computed thegrand average over all trials and all dataset. This analysis wasperformed for three bipolar channels on the right hemisphere:cap vertex position minus E25 (figure 1, marked in red), cap
E73 minus cap E25, and cEEGrid R3 minus R6. The vertexchannel pair allows a direct comparison of our results with theresults from Choi et al (2013). The two other channel pairsallow a more direct comparison of the cap and the cEEGridusing electrodes at roughly the same location, inter-electrodedistance, and orientation. Note that this cap pair is the bestapproximation for the cEEGrid pair we can achieve with ourcap layout, but differences remain.
Single trial classification. For the single trial classification weused a leave-one-out cross validation template matchingapproach following the procedure described by (Choiet al 2013). For this an individual trial was compared withthe average response of the remaining trials for the attend-leftand the attend-right condition (i.e. attend-left and attend-righttemplate). For each electrode the normalized cross-correlationfunction (NCF) was computed between each trial and the twotemplates. The cross-correlation was computed for the trialsegment of 400–2800 ms, thereby excluding the onsetresponse and the offset response. To allow for a small timejitter between the single trial and the template the maximalcross correlation in the range of −50 to 50 ms wasdetermined. Consequently the difference between themaximum NCF for the left-template and the right-templatewas computed, and this value was summed up over allelectrodes. A trial was classified as attend-left if the resultingvalue was positive (i.e. the match between trial and attend-lefttemplate is higher than between trial and attend-righttemplate) and classified as attend-right otherwise. Theclassification accuracy is the number of correctclassifications divided by the number of trials and theconfusion matrix was computed for each participant.Further we computed for each participant whether theclassification accuracy was significantly above the chancelevel using a binominal statistic with a confidence limit ofp=0.05, thereby taking the individual differences in thenumber of trials into account (Müller-Putz et al 2008). For thestatistical analysis of the differences in classification accuracyand the behavioral response (hit rates) we used the non-parametric Friedman and Wilcoxon signed rank test. For thesemeasures we provide the requivalent as an effect size indicator(Rosenthal and Rubin 2003). The statistical analysis wasperformed using the statistical software package R (RDevelopment Core Team 2013).
Inter-electrode distance and angle analysis. In ear-centeredEEG the electrodes are arranged relatively close to each other.In order to gain a better understanding of the influence of theelectrode distance and the orientation of the electrodes, wecompared the single channel classification accuracy with theinter-electrode distance of the electrodes that comprise abipolar channel and the orientation of these electrodes to eachother. For each bipolar channel we computed the singlechannel classification accuracy and computed the distancebetween the two electrodes that comprise the bipolar channelas well as their respective angle. The distances were binnedinto six bins (1.9, 3.3, 3.8, 5.4, 5.9 and 6.9 cm). The angles
5
J. Neural Eng. 13 (2016) 066004 M G Bleichner et al

were computed as absolute values in respect to a vertical axis.The vertical axis was considered as 0°, the horizontal axis as90° (see figure 1 middle). Note that, due to the ellipsoid shapeof the cEEGrid the effects of bipolar channel distance andangle cannot be fully dissociated from each other.
Results
Behavioral results
Participants had to indicate for each attended tone sequencewhether it was ascending, descending or alternating. Onaverage participants responded in 84.5% (median hit rate) ofthe sequences correctly. The lowest performance was 45%the highest performance 98% correct responses (figure 3).The median in response accuracy for the attend-left conditionwas 85% and 88% for the attend-right condition. The Wil-coxon signed-rank test revealed that there was no significantdifference between the two (W=1, Z=0.8034, p=0.4355,requivalent=0.185). The median response was 84% for alter-nating streams, 91% for ascending streams and 85%for descending streams. The Friedman test showed thatthere was no significant difference in hit rate for these dif-ferent pitch progressions (χ2 (2)=5.4805, p=0.06455,requivalent=0.858). The overall high percentage of correctresponses indicates that most of the participants could per-form the task well. The error rate of 15% also indicates thatthe task was not too easy but that some effort had to be putinto performing well. There was a positive correlationbetween the self-reported perception ability as measures bythe MSI-Gold and the individual hit rate (r=0.51,p<0.05), indicating that people who judged themselves tobe poor in musical perception performed worse in judging thetone sequences.
Attention modulation of the ERP
Figure 4(A) shows the grand average ERPs for the attend-left(blue) and the attend-right (red) condition for the cap-EEG(shown for the vertex electrode, referenced against the arith-metic mean of E25 and E27, see figure 1). In response tostimulus onset (i.e. the onset of all 3 streams) an auditory-evoked P1–N1–P2 complex is apparent in both conditions.For the attended tones (i.e. the subsequent tones) a compar-able N1-P2 response is apparent for the attend-left and theattend-right condition. Compared to the response to stimulusonset, this response is reduced in amplitude and has a longerlatency. The difference wave (figure 4(B), top) shows cleardifferences between the conditions especially in the secondhalf of the stimulus. The permutation test reveals that the twoconditions are significantly different at these later time points(figure 4(B), bottom). The raster diagram (figure 4(C)) illus-trates the temporal—spatial distribution of the significanteffects for each time-electrode bin (critical t-value: ±5.55,FWER corrected for multiple comparisons). The topographicrepresentation (figure 4(D)) of the time bins with the strongesteffect, show that the most significant differences are primarilyat electrodes located over the left and right temporal cortex.
The grand average ERP for the cEEGrid (figure 5(A))shows a clear evoked response (N1–P2 complex) to the sti-mulus onset and to the attended tones. The difference wave(figure 5(B) top) shows a difference between the conditionsthat increases over time. The permutation statistics shows thatthe two conditions are significantly different at these latertime points (figure 5(B), bottom). The raster diagram(figure 5(C)) illustrates the temporal-spatial distribution of thesignificant effects for each time-electrode bin (critical t-value:±5.30, FWER corrected for multiple comparisons). A directcomparison of vertically and horizontally oriented channelpairs of the cEEGrid (figure 5(D)) reveals significant differ-ences between the conditions for the vertically but not
Figure 3. Behavioral responses shown for the stream direction (left) and the pitch progression (right), there were no significant differences inthe response behavior for stream direction and pitch progression.
6
J. Neural Eng. 13 (2016) 066004 M G Bleichner et al

Figure 4. (A) Grand average ERP of one cap electrode (Vertex referenced to the arithmetic mean of E25 and E27) shown for the attend-left(blue) and attend-right (red) condition. The horizontal bars in blue (left sound stream) and red (right sound stream) indicate the sound onsetsand sound durations. For each tone in the attended stream the onset responses can be seen (boxes), the numbers indicate the respective peaklatencies. Based on the latency of the first N1 (140 ms) the peaks should occur at 890, 1630 and 2390 ms for the attend-left conditions, and at740, 1340, 1940 and 2540 ms for the attend-right condition. The observed latencies occur approximately 35 ms later. (B) Top: butterfly plotillustrating difference waves between attend-left and attend-right condition. Each waveform (gray) represents one of the 84 cap electrodes.The black line shows the average difference wave for all electrodes. Bottom: butterfly plot of the temporal evolution of the t-values (attendleft–attend right) for all cap electrodes (gray) and their average score (black) according to the permutation test. The horizontal dashed linerepresents the critical t-score (±5.55, FWER corrected for the number of channels and time points). A t-value more extreme than the criticalt-score indicates a significant difference between the conditions for that electrode. The vertical lines indicate the time points for which the t-values exceed the critical t-value. (C) Raster diagram illustrating the same results for each electrode and time bin; each row represents oneelectrode, each column represents one time bin. White and black rectangles indicate electrodes/time points in which the ERP differences aresignificant, more positive or negative respectively. Gray rectangles indicate electrodes/time points at which no significant differences werefound. The electrodes are arranged roughly topographically along the y-axis. (D) Topographic representation of the t-values shown for fivetime points (that showed above threshold t-values of ±5.55 , see vertical lines in plot (B) and the respective two successive time points. Thesignificant electrodes are located primarily over the left and right temporal lobes.
7
J. Neural Eng. 13 (2016) 066004 M G Bleichner et al

Figure 5. (A) Grand average ERP of the cEEGrid electrodes (mean of R3–R6 and L3–L6) for the attend-left (blue) and attend-right (red)condition. The horizontal bars in blue (left sound stream) and red (right sound stream) indicate the sound onsets and sound durations. Foreach tone in the attended stream the onset responses can be seen (boxes), the numbers indicate the respective peak latencies. Based on thelatency of the first N1 (180 ms) the peaks should occur at 930, 1680 and 2430 ms for the attend-left conditions, and at 780, 1380, 1980 and2580 ms for the attend-right condition. The observed latencies occur approximately 70 ms later. (B) Top: butterfly plot illustrating differencewaves between attend-left and attend-right. Each waveform (gray) represents one of the 32 cEEGrid vertically oriented channel pairs. Theblack line shows the average difference wave for all electrodes. Bottom: butterfly plot of the temporal evolution of the t-values (attend left–attend right) for all electrodes (gray) and their average (black) according to the tmax permutation test. The horizontal dashed line represents thecritical t-score FWER corrected for the number of channels and time points (critical t-value: ±5.30). A t-score more extreme than the criticalt-scores indicates a significant difference between the conditions for that electrode. (C) Raster diagram illustrating the same results for eachelectrode and time bin; each row represents one electrode, each column represents one time bin. White and black rectangles indicateelectrodes/time points in which the ERP differences are significant, more positive or negative respectively. Gray rectangles indicateelectrodes/time points at which no significant differences were found. (D) Raster diagram illustrating the t-scores for horizontally andvertically oriented channels for the left and the right cEEGrid, rows represent electrodes, columns represent time bins (critical t-value, ±5.10,FWER corrected for multiple comparisons). From top to bottom (L2–L3, L1–L4, L8–L5, L7–L6, L1–L8, L2–L7, L3–L6, L4–L5 and R2–R3,R1–R4, R8–R5, R7–R6, R1–R8, R2–R7, R3–R6, R4–R5).
8
J. Neural Eng. 13 (2016) 066004 M G Bleichner et al

horizontally oriented channels (critical t-value, ±5.10, FWERcorrected for multiple comparisons).
For both systems we see N1 responses to the tone onsetsof the attended sound stream. The observed differencesbetween conditions are significantly different and increaseover time.
The analysis of the individual responses to attended andunattended tones shows clear differences. For the attendedtones there is a P1–N1–P2 pattern for cap (vertex electrode)and the cEEGrid electrodes (figure 6(A)). The amplitude ofthe vertex electrode is roughly twice as large as the amplitudeobserved at the ear. There is a clear latency shift of the N1between the vertex electrode and the cEEGrid: the vertexelectrode shows a peak at around 190 ms, whereas the
cEEGrid electrode shows a peak at around 250 ms. Further-more, for the cEEGrid a double peak pattern of the N1 isvisible which is absent for the vertex electrode. When com-paring the cEEGrid to a cap channel pair that has a compar-able inter-electrode distance, location and orientation(figure 6(A), middle column) these differences disappear to alarge extent. The effect size (Hedges’ g) over time was similarfor cap-EEG and cEEGrid, both in its temporal evolution aswell as in its magnitude, and can be considered as a verystrong effect (>1). The topographic representation of the ERPof the attended tones (figure 6(B)) shows a central negativityat the time of the first negative peak observed at the vertexelectrode (187 ms). The observed activity pattern correspondsto what has been described as the tangential dipole source of
Figure 6. (A) Average ERP waveforms (shown in white) for bipolar channels of the cap (column 1 and 2 and the cEEGrid (column 3), forunattended tones (1st row) and attended (2nd row). The shaded gray areas show the standard error of the mean. Note the values on the y-axisare different for the first electrode pair. The heads indicate the position of the respective recording electrodes (black and green circles). Theeffect size over time is given as Hedges’ g (bottom row, absolute values). (B) Topographic maps of the attended condition for four timepoints, corresponding to tone the first negative (0.187 s) and second positive (0.344 s) peak of the vertex electrode and the first negative (0.26s) and second positive (0.421 s) peak of the cEEGrid electrode as indicated by the errors. It is evident that several sub-processes with differenttopographies occur over time. The different electrode configurations (i.e. different orientations) are more or less sensitive to the different sub-process. The vertex electrode is sensitive to the tangential source, while the cEEGrid electrodes are more sensitive to the radial than thetangential source.
9
J. Neural Eng. 13 (2016) 066004 M G Bleichner et al
the N1 in the literature (Näätänen and Picton 1987). Thebilateral negativity at the time of the negative peak observedfor the cEEGrid (260 ms) is in accordance to the radial dipolesource of the N1. The negativity is followed by the fronto-central positivity of the P2. The vertex electrode (referencedto E25) is almost ideally oriented to be sensitive to the tan-gential component of the N1. While the orientation of thecEEGrid electrode appears to make it sensitive to both sour-ces (to different degrees).
Classification results
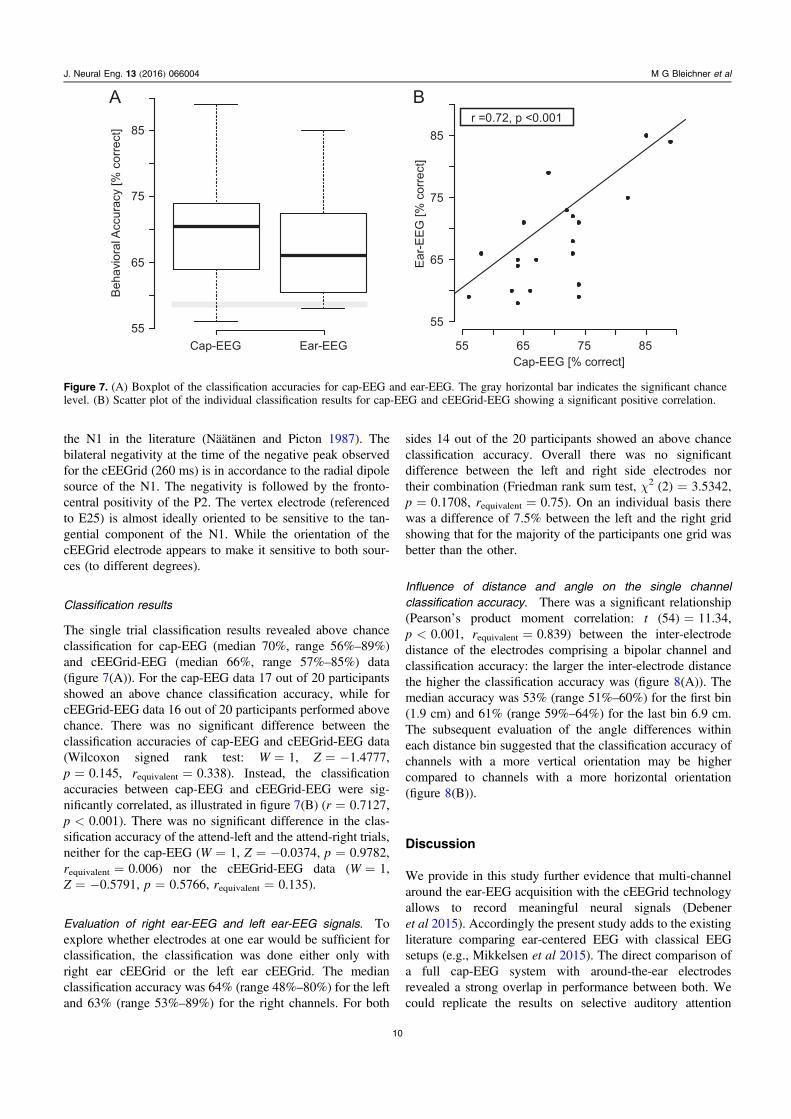
The single trial classification results revealed above chanceclassification for cap-EEG (median 70%, range 56%–89%)and cEEGrid-EEG (median 66%, range 57%–85%) data(figure 7(A)). For the cap-EEG data 17 out of 20 participantsshowed an above chance classification accuracy, while forcEEGrid-EEG data 16 out of 20 participants performed abovechance. There was no significant difference between theclassification accuracies of cap-EEG and cEEGrid-EEG data(Wilcoxon signed rank test: W=1, Z=−1.4777,p=0.145, requivalent=0.338). Instead, the classificationaccuracies between cap-EEG and cEEGrid-EEG were sig-nificantly correlated, as illustrated in figure 7(B) (r=0.7127,p<0.001). There was no significant difference in the clas-sification accuracy of the attend-left and the attend-right trials,neither for the cap-EEG (W=1, Z=−0.0374, p=0.9782,requivalent=0.006) nor the cEEGrid-EEG data (W=1,Z=−0.5791, p=0.5766, requivalent=0.135).
Evaluation of right ear-EEG and left ear-EEG signals. Toexplore whether electrodes at one ear would be sufficient forclassification, the classification was done either only withright ear cEEGrid or the left ear cEEGrid. The medianclassification accuracy was 64% (range 48%–80%) for the leftand 63% (range 53%–89%) for the right channels. For both
sides 14 out of the 20 participants showed an above chanceclassification accuracy. Overall there was no significantdifference between the left and right side electrodes northeir combination (Friedman rank sum test, χ2 (2)=3.5342,p=0.1708, requivalent=0.75). On an individual basis therewas a difference of 7.5% between the left and the right gridshowing that for the majority of the participants one grid wasbetter than the other.
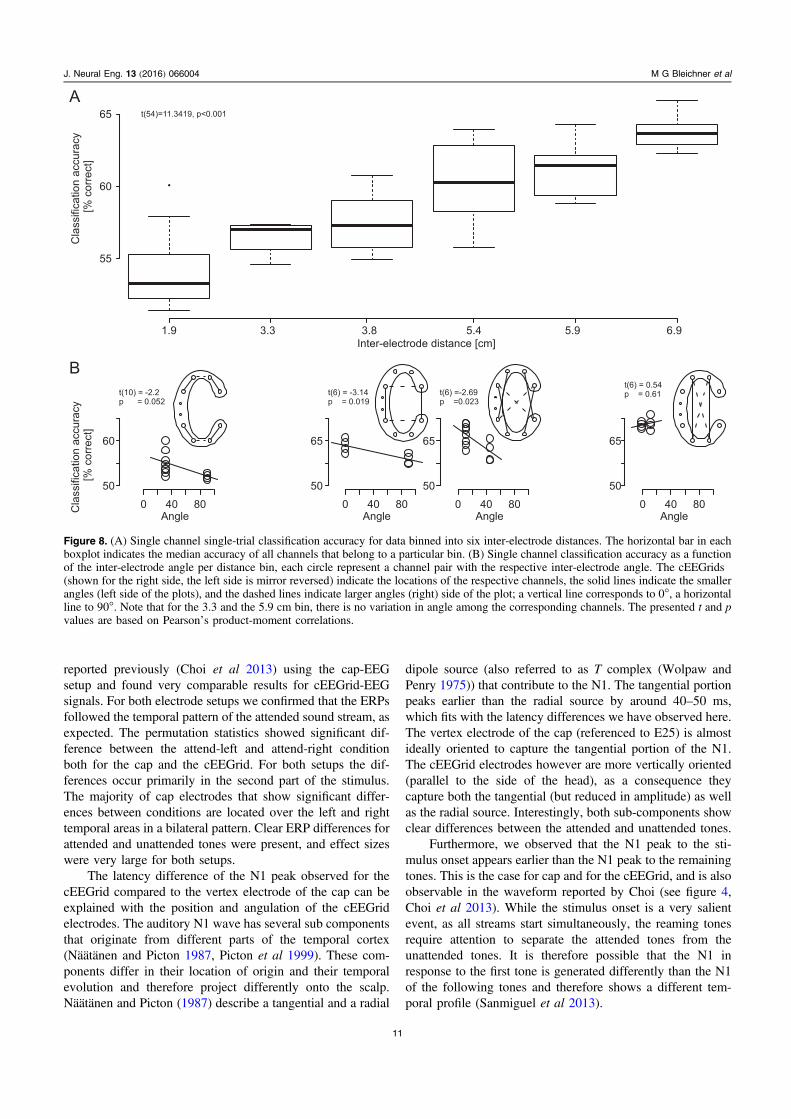
Influence of distance and angle on the single channelclassification accuracy. There was a significant relationship(Pearson’s product moment correlation: t (54)=11.34,p<0.001, requivalent=0.839) between the inter-electrodedistance of the electrodes comprising a bipolar channel andclassification accuracy: the larger the inter-electrode distancethe higher the classification accuracy was (figure 8(A)). Themedian accuracy was 53% (range 51%–60%) for the first bin(1.9 cm) and 61% (range 59%–64%) for the last bin 6.9 cm.The subsequent evaluation of the angle differences withineach distance bin suggested that the classification accuracy ofchannels with a more vertical orientation may be highercompared to channels with a more horizontal orientation(figure 8(B)).
Discussion
We provide in this study further evidence that multi-channelaround the ear-EEG acquisition with the cEEGrid technologyallows to record meaningful neural signals (Debeneret al 2015). Accordingly the present study adds to the existingliterature comparing ear-centered EEG with classical EEGsetups (e.g., Mikkelsen et al 2015). The direct comparison ofa full cap-EEG system with around-the-ear electrodesrevealed a strong overlap in performance between both. Wecould replicate the results on selective auditory attention
Figure 7. (A) Boxplot of the classification accuracies for cap-EEG and ear-EEG. The gray horizontal bar indicates the significant chancelevel. (B) Scatter plot of the individual classification results for cap-EEG and cEEGrid-EEG showing a significant positive correlation.
10
J. Neural Eng. 13 (2016) 066004 M G Bleichner et al
reported previously (Choi et al 2013) using the cap-EEGsetup and found very comparable results for cEEGrid-EEGsignals. For both electrode setups we confirmed that the ERPsfollowed the temporal pattern of the attended sound stream, asexpected. The permutation statistics showed significant dif-ference between the attend-left and attend-right conditionboth for the cap and the cEEGrid. For both setups the dif-ferences occur primarily in the second part of the stimulus.The majority of cap electrodes that show significant differ-ences between conditions are located over the left and righttemporal areas in a bilateral pattern. Clear ERP differences forattended and unattended tones were present, and effect sizeswere very large for both setups.
The latency difference of the N1 peak observed for thecEEGrid compared to the vertex electrode of the cap can beexplained with the position and angulation of the cEEGridelectrodes. The auditory N1 wave has several sub componentsthat originate from different parts of the temporal cortex(Näätänen and Picton 1987, Picton et al 1999). These com-ponents differ in their location of origin and their temporalevolution and therefore project differently onto the scalp.Näätänen and Picton (1987) describe a tangential and a radial
dipole source (also referred to as T complex (Wolpaw andPenry 1975)) that contribute to the N1. The tangential portionpeaks earlier than the radial source by around 40–50 ms,which fits with the latency differences we have observed here.The vertex electrode of the cap (referenced to E25) is almostideally oriented to capture the tangential portion of the N1.The cEEGrid electrodes however are more vertically oriented(parallel to the side of the head), as a consequence theycapture both the tangential (but reduced in amplitude) as wellas the radial source. Interestingly, both sub-components showclear differences between the attended and unattended tones.
Furthermore, we observed that the N1 peak to the sti-mulus onset appears earlier than the N1 peak to the remainingtones. This is the case for cap and for the cEEGrid, and is alsoobservable in the waveform reported by Choi (see figure 4,Choi et al 2013). While the stimulus onset is a very salientevent, as all streams start simultaneously, the reaming tonesrequire attention to separate the attended tones from theunattended tones. It is therefore possible that the N1 inresponse to the first tone is generated differently than the N1of the following tones and therefore shows a different tem-poral profile (Sanmiguel et al 2013).
Figure 8. (A) Single channel single-trial classification accuracy for data binned into six inter-electrode distances. The horizontal bar in eachboxplot indicates the median accuracy of all channels that belong to a particular bin. (B) Single channel classification accuracy as a functionof the inter-electrode angle per distance bin, each circle represent a channel pair with the respective inter-electrode angle. The cEEGrids(shown for the right side, the left side is mirror reversed) indicate the locations of the respective channels, the solid lines indicate the smallerangles (left side of the plots), and the dashed lines indicate larger angles (right) side of the plot; a vertical line corresponds to 0°, a horizontalline to 90°. Note that for the 3.3 and the 5.9 cm bin, there is no variation in angle among the corresponding channels. The presented t and pvalues are based on Pearson’s product-moment correlations.
11
J. Neural Eng. 13 (2016) 066004 M G Bleichner et al
The classification performance for both systems wasabove chance level for the majority of the participants (16 outof 20 cEEGrid, 17 out of 20 for the Cap). The median clas-sification accuracy of 70% that we found with the cap-EEG isin line with the 71% as reported by Choi et al (2013). Theclassification accuracy between cap-EEG and cEEGrid-EEGwas not significantly different. The high correlation betweenthe classification performance achieved with the cap-EEG andthe cEEGrid-EEG are additional evidence that comparableprocesses are captured with both systems. Interestingly, theclassification analysis using only one cEEGrid (either left orright) showed that there is no significant loss in classificationaccuracy. However, for most participants one of the sides ledto considerable higher classification results compared to theother. Future work is required to determine the test-retestreliability of this effect, which would be important for anindividualized application, such as a BCI-controlled hearingaid steering. In any case, this finding suggests that a singlecEEGrid may be sufficient for decoding auditory attention.However, note that while the classification accuracy weachieved was significantly above chance for both cap-EEGand cEEGrid-EEG data and reached for some participants areasonable level of 85% and above, overall classificationperformance with a median accuracy of 70% (cap-EEG) and67% (cEEGrid-EEG) is not sufficient for many BCI appli-cations. Most auditory BCI paradigms have modest classifi-cation rates and lower transfer rates than what can beachieved in the visual sensory modality. However, futurepassive BCI applications (Kothe and Zander 2011) maydemonstrate a benefit even for low-accuracy systems.
The core design idea of the cEEGrid was to collect multi-channel EEG signals from around the ear, enabling theselection of individual bipolar channels with different orien-tations. In the present study we found an effect of inter-electrode distance and angle on single channel classificationaccuracy. Classification accuracy was highest for channelsthat are relatively distant from each other and oriented verti-cally, as expected. Whereas the distribution of the electrodeson the cEEGrid does not allow for the analysis of distance andangle information independently, since the sampling of thedistance-angle subspace is suboptimal, our results indicatethat both factors play a role. The exact influence of distanceand angle depends probably on the relative location of thecEEGrid to the location and orientation of a neural source ofinterest as well, an issue that requires further evaluation.However, ear-centered EEG approaches should be aware ofthis phenomenon.
When relating the cEEGrid with other ear-EEG solutions(e.g. Kidmose et al 2012, Bleichner et al 2015) that haveelectrodes in the outer ear canal and the concha, one should beaware of a number of factors. The electrode arrangement ofthe cEEGrid is more or less constrained to a plane parallel tothe side of the head (2D), but provides large inter-electrodedistances, and can sample different orientations. Electrodesplaced in the ear however can span a 3D space, but with amuch smaller inter-electrode distance, generally resulting in amuch reduced signal amplitude. Based on our findings con-cerning the sensitivity of the cEEGrid to the later aspects of
the N1 we speculate that an electrode in the ear canal,referenced to an above ear electrode might be optimallyoriented to capture the radial component of the late N1. Theideal orientation of electrodes that comprise a bipolar pair torecord from a given EEG source will be a future researchquestion.
Evidently, a small number of electrodes in or around theear cannot be a substitute for a high-density EEG setup.However, for many EEG applications a small number ofelectrodes suffices (Lau 2012) and is even desirable when itcomes to ease of use and user comfort (Krusienski et al 2008,Askamp and van Putten 2014, Wascher et al 2014). Onestrength of the behind-the-ear cEEGrid EEG approach is, thatit allows for unobtrusive and concealed EEG acquisition. Incombination with a small amplifier and a smartphone basedrecording system (Debener et al 2015) this enables out-of-thelaboratory EEG recordings over extended periods of timesand provides therefore the means to study the relationshipbetween brain and behavior in more naturalistic settings. Afurther advantage of the around the ear setup is the fastelectrode placement and the easy electrode removal after therecording that make it an interesting candidate for applica-tions such as BCI or continuous EEG monitoring. Futurestudies have to investigate the motion tolerance of thisrecording setup which would be a prerequisite for EEGmeasurements in daily life applications. Moreover, an onlinesmartphone-operated BCI application, used in daily life set-tings, would be needed before ear-EEG could be merged withhearing aid technology to adjust devices to user states andneeds.
Conclusion
We replicate the single-trial selective auditory attentionresults of Choi et al (2013) using a classical EEG cap setup.Moreover, we demonstrate that around-the-ear, cEEGridbased EEG acquisition results in similar system performance.The overall task-induced auditory attention effects seem to besimilarly well captured by cEEGrid-EEG and cap-EEG,whereas the cEEGrid seems to be especially sensitive to thelater components of the N1. For auditory attention monitor-ing, concealed behind-the-ear EEG recordings can be analternative to classical cap EEG acquisition.
Acknowledgments
We thank Reiner Emkes for his technical support, and JeremyThorne and Joost Meekes for their valuable comments. Wethank Twente Medical Systems International BV, Oldenzaal,The Netherlands, for sharing knowledge and supporting thedesign and production of the cEEGrid. We are grateful tomBrainTrain, Belgrade, Serbia, for development of theSMARTING amplifier and excellent software support. Thisresearch was funded by Task Group 7 ‘BCI for Hearing Aids’and other funds from the DFG Cluster of Excellence 1077‘Hearing4all’, Oldenburg, Germany.
12
J. Neural Eng. 13 (2016) 066004 M G Bleichner et al
References
Askamp J and van Putten M J A M 2014 Mobile EEG in epilepsyInt. J. Psychophysiol. 91 30–5
Bleichner M G, Lundbeck M, Selisky M, Minow F, Jager M,Emkes R, Debener S and De Vos M 2015 Exploringminiaturized EEG electrodes for brain–computer interfaces. AnEEG you do not see? Physiol. Rep. 3 e12362
Brainard D H 1997 The psychophysics toolbox Spat. Vis. 10433–6
Choi I, Rajaram S, Varghese L A and Shinn-Cunningham B G 2013Quantifying attentional modulation of auditory-evoked corticalresponses from single-trial electroencephalography Front.Hum. Neurosci. 7 115
de Vos M and Debener S 2013 Mobile EEG: towards brain activitymonitoring during natural action and cognition Int. J.Psychophysiol. 91 1-2
De Vos M, Kroesen M, Emkes R and Debener S 2014 P300 spellerBCI with a mobile EEG system: comparison to a traditionalamplifier J. Neural Eng. 11 36008
Debener S, Emkes R, De Vos M and Bleichner M 2015 Unobtrusiveambulatory EEG using a smartphone and flexible printedelectrodes around the ear Sci. Rep. 5 16743
Debener S, Minow F, Emkes R, ras G , K, Vos M, de Vos M andGandras K 2012 How about taking a low-cost, small, andwireless EEG for a walk? Psychophysiology 49 1617–21
Gramann K, Gwin J T, Ferris D P, Oie K, Jung T P, Lin C T,Liao L D and Makeig S 2011 Cognition in action: imagingbrain/body dynamics in mobile humans Rev. Neurosci. 22593-608
Gramann K, Jung T P, Ferris D P, Lin C T and Makeig S 2014Toward a new cognitive neuroscience: modeling natural braindynamics Front. Hum. Neurosci. 8 444
Groppe D M, Urbach T P and Kutas M 2011 Mass univariateanalysis of event-related brain potentials/fields: I. A criticaltutorial review Psychophysiology 48 1711-25
Hine J and Debener S 2007 Late auditory evoked potentialsasymmetry revisited Clin. Neurophysiol. 118 1274–85
Kidmose P, Looney D, Ungstrup M, Rank M and Mandic D 2013 Astudy of evoked potentials from ear-EEG IEEE Trans.Biomed. Eng. 60 2824-30
Kidmose P P, Park C C, Ungstrup M M, Rank M M,Rosenkranz K K, Mandic D D and Looney D D 2012 The In-the-Ear recording concept: user-centered and wearable brainmonitoring IEEE Pulse 3 32–42
Kleiner M, Brainard D H, Pelli D G, Broussard C, Wolf T andNiehorster D 2007 What’s new in Psychtoolbox-3? Perception36 S14
Kothe C and Zander T 2011 Towards passive brain–computerinterfaces: applying brain–computer interface technology tohuman–machine systems in general J. Neural Eng. 8 25005
Krusienski D J, Sellers E W, McFarland D J, Vaughan T M andWolpaw J R 2008 Toward enhanced P300 speller performanceJ. Neurosci. Methods 167 15–21
Lau T M 2012 How many electrodes are really needed for EEG-based mobile brain imaging? J. Behav. Brain Sci. 02 387–93
Lee J H, Lee S M, Byeon H J, Hong J S, Park K S and Lee S-H 2014CNT/PDMS-based canal-typed ear electrodes forinconspicuous EEG recording J. Neural Eng. 11 46014
Lin Y-P, Wang Y and Jung T-P 2014 Assessing the feasibility ofonline SSVEP decoding in human walking using a consumerEEG headset J. Neuroeng. Rehabil. 11 119
Looney D, Park C, Kidmose P, Rank M L, Ungstrup M,Rosenkranz K and Mandic D P 2011 An in-the-ear platformfor recording electroencephalogram Conf. Proc. IEEE Eng.Med. Bio. Soc., EMBS 6882-5
Mikkelsen K B, Kappel S L, Mandic D P and Kidmose P 2015 EEGrecorded from the ear: characterizing the ear-EEG methodFront. Neurosci. 9
Müllensiefen D, Gingras B, Musil J and Stewart L 2014 Themusicality of non-musicians: an index for assessing musicalsophistication in the general population PLoS One 9
Müller-Putz G R, Scherer R, Brunner C, Leeb R and Pfurtscheller G2008 Better than random ? A closer look on BCI results Int. J.Bioelectromagn. 10 52–5
Näätänen R and Picton T 1987 The N1 wave of the human electricand magnetic response to sound: a review and an analysis ofthe component structure Psychophysiology 24 375–425
Norton J J S et al 2015 Soft, curved electrode systems capable ofintegration on the auricle as a persistent brain–computerinterface Proc. Natl Acad. Sci. 112 201424875
Nunez P L and Srinivasan R 2006 Electric Fields of the Brain: TheNeurophysics of EEG 2nd edn (New York: Oxford UniversityPress) (doi:10.1093/acprof:oso/9780195050386.001.0001)
Pelli D G 1997 The videotoolbox software for visual psychophysics:transforming numbers into movies Spat. Vis. 10 437-42
Picton T, Alain C, Woods D L, John M S, Scherg M, Valdes-Sosa P,Bosch-Bayard J and Trujillo N J 1999 Intracerebral sources ofhuman auditory-evoked potentials Audiol. Neuro-Otol. 464–79
2013 R: A language and environment for statistical computing. RFoundation for Statistical Computing, Vienna, Austria http://R-project.org/ R Found. Stat. Comput. Vienna, Austria
Rosenthal R and Rubin D B 2003 r equivalent: a simple effect sizeindicator Psychol. Methods 8 492–6
Sanmiguel I, Todd J and Schröger E 2013 Sensory suppressioneffects to self-initiated sounds reflect the attenuation of theunspecific N1 component of the auditory ERPPsychophysiology 50 334–43
Schaal N K, Bauer A-K R and Müllensiefen D 2014 Der Gold-MSI:replikation und validierung eines fragebogeninstrumentes zurMessung musikalischer erfahrenheit anhand einer deutschenstichprobe Music. Sci. 18 423–47
Wascher E, Heppner H and Hoffmann S 2014 Towards themeasurement of event-related EEG activity in real-life workingenvironments Int. J. Psychophysiol. 91 3–9
Wolpaw J R and Penry J K 1975 A temporal component of theauditory evoked response Electroencephalogr. Clin.Neurophysiol. 39 609–20
13
J. Neural Eng. 13 (2016) 066004 M G Bleichner et al