identifying and managing the market barriers to renewable energy in kenya tampere university
TRANSCRIPT
Identifying and Managing the Market Barriers to Renewable
Energy in Kenya
Tampere University of Applied Sciences
KILONZO, DAVID MUTHAMI.
2013
Bachelor’s thesis
April 2013
Environmental Engineering

2
ABSTRACT
Tampereen Ammattikorkeakoulu
Tampere University of Applied Sciences
Degree programme in Environmental Engineering
KILONZO, DAVID MUTHAMI
Identifying and Managing the Market Barriers to Renewable Energy in Kenya
Bachelor’s Thesis. Pages 58, appendices 10
April 2013
ABSTRACT
The topic came to mind after thinking of the challenges in Kenyan energy sector we are facing
today and which are likely to get more challenging with time. As the population grows some of
the resources we have will be strained further; these includes energy, water resources, forestry,
transport systems and more wastes will be generated. How to provide the population with
adequate supplies of energy, cleanly, safely and sustainably? This is the question which will be
of interest to policy makers. Our world today is been run by energy mainly from fossil fuels
which are not sustainable and the resources is to diminish further due to the increasing energy
demands and the ever growing population not forgetting the developing nations in the world
which are in high demand for energy.
The study analyses different barriers to RE in Kenya and for comparison also elsewhere. The
study is based on available literature and goes further to give solutions on ways to mitigate RE
barriers in Kenya. The current energy situation and RE potential in Kenya is presented. The aim
of the study is to give ideas on how to have more RE as the source of energy in Kenya.The
largest barrier is policies and regulatory framework. Conventional energy sources getting tax
reduction and R& D funds. The barriers to RE are not technological , but they are more political,
financial, educational and all related to the- infrastructure.
Keywords: energy, renewable energy, barrier, potential
3
ACKNOWLEDGEMENT
My sincere gratuities goes to Peter Kuria of Shalin Suomi ry for suggesting the topic and
offering advice, Tampere University of Applied sciences fraternity for the support, my degree
program head Eeva Liisa Viskari who was also my thesis supervisor for guiding me through the
thesis writing process. I also would like thank and dedicate this thesis to my parents for the
encouragement during the research and writing process.
Kilonzo David Muthami
Tampere April 2013

4
ABBREVIATIONS AND TERMS
RE- renewable energy
RED-renewable energy development
RET-renewable energy technology
NGO-nongovernmental organization
R&D-research and development
RD&D –research development and dissemination
MOE-ministry of energy Kenya
LCA-life cycle assessment
GHGs-green house gases
SMEs-small micro enterprises
ERC-energy regulatory commission Kenya
REA-renewable energy authority
KETRACO-Kenya electricity Transmission Company
GoK-government of Kenya
VAT-value added tax
KPLC- Kenya Power and Lighting Company
IPPs-independent power producers
GDC-Geothermal Development Company
KENGEN – Kenya electricity generating company
UNFCC-united nation framework convention on climate change
5
IPCC-international panel on climate change
Km- kilometre
KES-Kenya shilling
Ksh- Kenya shilling
IEA-international energy Agency
SREP- scaling up renewable energy program
UN-united nations
UNEP-united nation environmental program
CDM-clean development mechanism
PURPA-public utility regulatory policies act
KWh-kilowatt hour
MW-megawatt
GWh-gigawatt hour
FiT-feed in Tariff
LPG-liquefied petroleum gas
TAMK-Tampereen Ammattikorkeakoulu / Tampere University of applied science
EU-European union
dB- decibels
SO2-sulphur dioxide
CO2-carbon dioxide
NOx-nitrogen oxides
6
CH4-methane
IAP-indoor air pollution
WTP-willingness to pay
REP-renewable energy program
PV-photovoltaic
PGR-partial risk guarantees
PPAs-power purchase agreements
CURRENCY EQUIVALENTS
As of 21.11.12i
1 US$=Ksh 85.7198
1 euro=109.369Ksh
ENERGY UNITS
The energy contents of fuels and electricity in different units around the world are shown below;
Quad (quadrillion Btu) =1.055 exajoules
Ton of oil equivalent (toe) =41.9Gj=39.7Million Btu
Barrel of oil (bbl) =6.1Gj=5.8Million Btu
Ton of coal equivalent (tce) =29.3Gj=27.8Million Btu
Kilowatt hour (kWh) =3.6Mj=3.412Btu
Watt=1J/s=3.412Btu/hour

7
TABLE OF CONTENT
1. INTRODUCTION.................................................................................................9
2. KENYA BASIC DATA........................................................................................10
3. AIM OF THE STUDY..........................................................................................11
4. INTERNATIONAL ENERGY STATISTICS ABOUT KENYA.......................12
4.1 Kenya electricity institutional framework......................................................12
4.2 Firewood, fossil fuels and kerosene use effects due to lack of RE................15
4.3 Renewable energy potential...........................................................................15
5. RURAL ELECTRIFICATION IN KENYA........................................................16
6. KENYA ENERGY SECTOR..............................................................................16
6.1 Policy history................................................................................................16
6.2 Challenges in Kenya energy sector..............................................................18
6.3 Renewable energy in Kenya.........................................................................19
6.3.1 EU comparison with Kenya...................................................20
6.3.2 Geothermal energy in Kenya..................................................22
6.3.3 Biomass energy in Kenya........................................................23
6.3.4 Biofuels from Biomass.............................................................25
6.3.5 Biogas energy in Kenya............................................................25
6.3.6 Solar power in Kenya................................................................26
6.3.7 Wind power in Kenya...............................................................27
6.3.8 Hydro power in Kenya...............................................................31

8
6.3.9 Municipal waste in Kenya........................................................ 31
6.3.10 Energy Cogeneration in Kenya..................................................32
6.3.11 Nuclear power in Kenya............................................................32
7. ENERGY POLICY TOOLS.........................................................................................33
7.1 Policies and strategies........................................................................................33
7.2 Feed in tariff.................................................................................................33
8. BARRIERS................................................................................................................34
8.1 Costs and pricing barriers...............................................................................36
8.2 Legal and Regulatory barriers.......................................................................36
8.3 Market performance......................................................................................37
9 GENERAL PROMOTION POLICIES........................................................................38
9.1 Price setting and quantity forcing policies..................................................38
9.2 Cost reduction policies...............................................................................39
9.3 Public investment and market facilitation activities..................................39
9.4 Infrastructure policies/market infrastructure……………..........................39
10 KENYA RENEWABLE ENERGY BARRIERS......................................................41
11 DISCUSSION..................................................................................................... .......45
12 CONCLUSION..........................................................................................................55
13 REFERENCES................................................................................................... ......56
14 TABLE AND APPENDIXES.................................................................................69
9
1. INTRODUCTION
Renewable energy (RE) is defined as any naturally occurring, theoretically inexhaustible source
of energy, as biomass, solar, wind, tidal, wave and hydroelectric power, which is not got from
fossil or nuclear fuel (Goli ,2013) . Energy is derived from a Greek word en (in) and ergon
(work). Energy is the capacity labiality to do work (moving something against a force (Boyle
1990).
In 1990s there was an outburst of energy policy changes around the world. Driven by economic,
ecological, security and social concerns, energy regulation has been in great - flux. The world
population is growing and is to reach 10 Billion people in 2050 according to Boyle, 1990 and
also by end of 21st century UN projection is that the population would be between 10 and
12Billion people.
According to Kenya institute of public policy research and analysis study and analysis ,2010 of
energy consumption in Kenya most of households (52%) in Kenya use kerosene for lighting and
60% of households use biomass for cooking. The connectivity to electricity also varies from
region to region; Nairobi 53.47%, Central 42.4%, North Eastern 14.5% and western
14.7%ii(ERC, 2010).
In Kenya only a small percentage of the 1500 rural health clinics were using solar refrigerators
until in 1991 when there was severe gas shortage that disrupted fuel supply and shut down
immunization services in seven districts an indication that efficient and trustworthy source of
energy is of great need (Ricardo 2002).
Carbon dioxide concentration had increased to over 390Pmm above industrial levels by the end
of 2010. Demand for energy and associated services are on increase. Various types of RE can
supply electricity, thermal energy and mechanical or produce fuels. The cost of most RE
technologies has declined and technical advances will see more declines in costs. The life cycle
assessment (LCA) of green house gases (GHGs) emissions for RE median value is 4-46g CO2
eq/kwh while that of fossil fuel is 469-1001gCO2eq/kwh. This shows the contribution RE can
help in fighting climate change which is associated with GHGs like CO2. RE increase worldwide

10
in 2009 was wind 32% increase 38GW added, hydropower 3% 31GW added, grid connected PV
53% 75GW added, geothermal 4% 0,4GW added, solar hot water 21% 31GW(IPCC, 2012).
In 2030 if no new policy to change poverty is introduced 1.3Billion people (16% of world
population) will have no electricity access mostly in Asia and Africa(Niez, 2010).This shows the
big attention required in order to ensure people have descent life and access to electricity. 30GW
the entire generation of 47 countries of sub-Saharan excluding South Africa equals that of
Argentina despite the big population in Africa. Africa has a population of 820M and it’s
expected to reach 1,5B in 2030 according to Abeeku Brew (Hammond et al 2008). Energy is a
key player to economic growth and according to UNEP 7000MW/yr needed to meet increasing
demand and support economic growth.
2. KENYA BASIC DATA
Total area: 582,650 km2 (almost size of France)
Boundaries: Ethiopia(861km), Somalia (682km), Sudan(232km), Tanzania(769km),
Uganda(933km). The distances in kilometres indicate the length of the bounder line.
Length of coastline: 536km of Indian Ocean
GDP 2012 (PPP)-US$71.427billiom
GDP nominal 2011-US$34.796billion
Population- a little over 43,013,341million 2012
Water percentage-2.3%
Energy: oil 55000 barrels/day-2004
Fiscal year: July 1 through June 30
Independence: December 12, 1963 from the United Kingdom
Currency-Kenyan shilling (KES) / Ksh
11
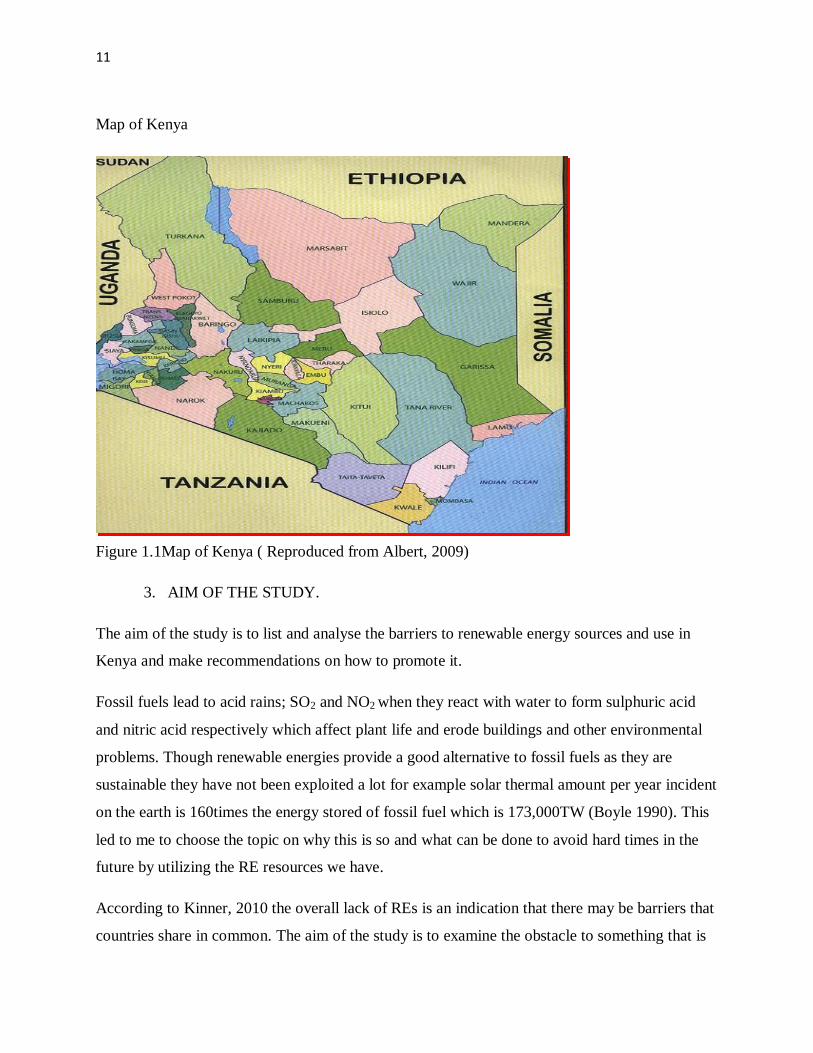
Map of Kenya
Figure 1.1Map of Kenya ( Reproduced from Albert, 2009)
3. AIM OF THE STUDY.
The aim of the study is to list and analyse the barriers to renewable energy sources and use in
Kenya and make recommendations on how to promote it.
Fossil fuels lead to acid rains; SO2 and NO2 when they react with water to form sulphuric acid
and nitric acid respectively which affect plant life and erode buildings and other environmental
problems. Though renewable energies provide a good alternative to fossil fuels as they are
sustainable they have not been exploited a lot for example solar thermal amount per year incident
on the earth is 160times the energy stored of fossil fuel which is 173,000TW (Boyle 1990). This
led to me to choose the topic on why this is so and what can be done to avoid hard times in the
future by utilizing the RE resources we have.
According to Kinner, 2010 the overall lack of REs is an indication that there may be barriers that
countries share in common. The aim of the study is to examine the obstacle to something that is

12
almost universally seen as beneficial and to help other scholars and policy makers. Though this
thesis is about helping how to improve investing in renewable energies in Kenya still the country
is doing some efforts this is according to a article published on the star newspaper Kenya on
15.10.2012 indicating that Kenya is ranked first out of nine African countries (Ethiopia, Rwanda,
Tanzania, Burkina Faso, Senegal, Benin and Cameroon) in the implementation of the biogas
programme after farmers embraced the energy technology. According to the article about 300
farmers are taking up the technology every month and close to 6000 have built biogas units in
their farms in the last three years. According to Kenya national farmers federation 2,557 units
have been built in 2012 alone compared to Uganda with 1.511 units (the Star, 2012).
4. INTERNATIONAL ENERGY AGENCY STATISTICS ABOUT KENYA
Table1.1 2009 Kenya energy sector overview (IEA, 2009)
Commercial energy use 514.5MW
Electrical power consumption 4,684,000,000 kWh
Electrical outages>days 83.6days
Fossil fuels
Hydro power
Nuclear power
Wind ,solar and import
71%
17.7%
0
11.3%
4.1 Kenya electricity institutional framework
Kenya institutional framework comprises of nine main players as shown in figure 1.2 below.
This may confuse investors as it becomes challenging to know which department to visit as they
are all related to electricity which calls for a need of one stop shop. According to SREP, 2011 the

13
institutional arrangement in Kenya in the electricity sub sector has many institutions; Ministry of
energy, ERC, KENGEN, REA, Kenya electricity transmission company (KETRACO),
geothermal development company (GDC) and IPPs. The many institutions may lead to long time
in making decisions if consultations are to be made by all institutions which may discourage
investors.
Figure 1.2 Kenya electricity institutional framework stakeholders. Reproduced from Reinkenya,
2011 available online at http://reinkenya.blogspot.fi/2011/01/kenya-energy-sector-
institutional.html)
Ministry of energy
(MoE)
REA
IPPs
ERC
GDC KENGEN
KETRACO
KPLC
Domestic and industrial Customers
IPPs
14
Kenya with a population of over 41million has a poor electricity supply with a supply of
1500MW compared to Finland with a population of roughly around 5.5M but with energy supply
of 70.4TWh. 83% of the rural population has no electricity and the people who are connected
experience power cut now and then due to reliance on hydro power which is affected by climate
according to Kenya national energy policy 2012 as seen in table 1.1. Despite the challenges
facing energy sector, Kenya is situated in a region which experiences strong winds of up to
11m/s and about six hours of sunshine. These potentials have not been utilized to the maximum
despite the technologies been available (National energy policy Kenya, 2012).
The government in 2011 incurred losses amounting to US$17M due to transmission losses. In
the year 2002 to 2008 the government lost ksh 2.414B due to vandalism on transmission
network. The electricity connection charges range from 17000ksh to 35000ksh (150-320euros)
which is still a lot of money taking into account a primary school teacher earns around 100euros
per month (National energy policy Kenya, 2012).
KENGEN is the government entity producing 80% of electricity consumed in the country. Hydro
power contributes 64.9% from 14 stations; geothermal produces a total of 45MW in Olkaria
1(1981, 1982, and 1985) and 70MW in Olkaria 2(2010). In regards to wind power there is power
plants in Ngong with the first one been established in 1993 through a Belgium donation but is
now not in operation, the second wind plant in Ngong established in 2009 produces 5.1MW and
has a potential of 14.9GWh/yr. Plans are underway to increase the capacity to 25.5MW (National
energy policy Kenya, 2012).
From thermal energy power is generated at Kipevu 3 station in Mombasa. The contract was
signed in November 2009 with Wärtsilä Oy Finland and there was an oil spill in 2012. The plant
went into operation in March 2011 with 7 diesel engines generating 74.5MW at an efficiency of
42.5%. Some off grid stations are in Lamu 2,4MW and Garissa 3.4MW all running on diesel oil.
Combustion engine technologies have adverse effects which are well known such as noise,
exhaust fumes and oil leakage dangers but governments prefer them as their have short lead
times and they have been there for long so the negative impacts are known (Ricardo 2002).With
the opening of Kipevu 3 the national grid is now 115MW richer which cost the government Ksh
11billion according to an article on daily nation on 4.12.12iii
. This raised the country’s installed
15
capacity to 1,232MW (Agutu, 2012). Though thermal generation is the most expensive to run
due to prices of oil but the government seems ok with it with the anticipation of oil to be
produced in the country. In 2011 the price for electricity was ksh15/kwh and the average
domestic user needs 3kwh/day which translates to around 90kWh/month at a cost of ksh1350
(National energy policy Kenya, 2012).
4.2 Firewood, fossil fuels and kerosene use effects due to lack of RE.
Some of effects associated with lack of clean energy include health problems due to indoor air
pollution, high opportunity costs related to time spend gathering fuel(wood) and lack of media
information due to lack of information facilities like radio or television. Outdoor air pollution is
causing 5% of deaths in urban areas in developing countries. Smoke exposure in wood fuel in
cooking leads to respiratory and eye infections (sayigh 2011). According to Susanne Schwan,
2011 indoor air pollution contributes to 1.9 million deaths/year and 1.5 Billion people in
developing nations have no access to electricity. There has been an increase of 31% rise in CO2
and 151% CH4 levels since pre industrial times due to dependence on fossil fuels rather than RE
(Howard, 2002).
4.3 Renewable energy potential.
Modern RE sources account for only 1/3 of RE total. The energy demand is likely to increase by
54% 1997 levels by 2020 according to IEA, 2009. RE sources could provide all the energy
consumed in the world for example wind power has a potential of 20-50trillion KWh/yr which is
1.5-4 times current world wide electricity production (Howard, 2002).
Kenya has a potential of 7000-10000MW of geothermal energy. Geothermal energy has an
advantage over hydro as it not affected by climate change, its reliable, has no fuel costs, long
plant life and it’s green and available but also it should be noted that energy is needed to pump
the heat up from the soil. The government has puts lot of effort to tap this potential and
government commitment was indicated by the establishment of Geothermal Development
Company (GDC) to undertake initial project activities through which the government absorbs the
attendant risks associated with geothermal development (Howard, 2002).
16
According to the national energy policy of 2012 the energy sector is to be the key enabler for
vision 2030. Vision 2030 is a long term development blue print aiming at transforming the
country into a globally competitive, newly industrialized, middle income and prosperous country
with clean and secure environment. Government targets are geothermal energy 5,110MW, hydro
power 1,039MW, wind energy 2036MW, thermal energy (diesel engines) 3,615MW, coal
2420MW and import 2000MW. The government plans to replace electrical water system heaters
with solar water heating systems. Approximately 20,000 institutions in Kenya approximately
consume 270tonnnes of wood/year. In the whole of Africa biomass contributes 47% of total
energy consumed, oil 24.8%, coal 16.5%, and gas 10.4% and RE 1.3% (Howard, 2002).
5 RURAL ELECTRIFICATION IN KENYA
The section 66 of the energy act no.12 of 2006 provided for the establishment of Rural
Electrification Authority (Kenya national energy policy 2012).Worldwide 1,456B people have
no access to electricity of which 83% are in rural areas. This is no exception in Kenya where
majority of people in rural areas have no access to electricity and rely heavily on wood for
cooking which has adverse effects on indoor pollution leading to health complications as
indicated earlier. Collecting firewood too takes a lot of time which mainly affects girl education
as girls are the one who usually collect firewood. In Sub Saharan Africa 12% of rural population
have electricity which is far less to the 35.4% average access of developing countries worldwide
(Kenya national energy policy 2012).
6 KENYA ENERGY SECTOR
6.1 Policy history
The energy policy in Kenya has evolved through the sessional papers, regulations and acts of
parliamentiv. The first policy was on sessional paper No. 10 of 1965 also referred to as the
electric power act (CAP 314) which was used to regulate the electricity sector. The second
sessional paper was No. 1 of 1986 which called for establishment of department of price and
monopoly control within the finance ministry to enforce pricing. In 1981 National oil
Corporation of Kenya Limited was established through companies act (CAP 486) to coordinate
oil exploration. Act No.22 of 1997 allowed IPPs to enter into power purchase agreement with

17
KPLC, it also called for KPLC to be divided into three sectors: KPLC, KENGEN and electricity
regulatory board to regulate power sector.
The sessional paper No. 4, 2004 came into force to ensure enough, quality, cost friendly and
affordable supply of energy to meet development while protecting the environment. The Energy
ACT No.12, 2006 called for energy regulatory board to be changed to Energy Regulatory
Commission (ERC) in 2007 to offer regulatory stewardship to electricity, petroleum and new
renewable sub sector. This act also saw the establishment of rural electrification authority and
energy tribunal.
The Kenyan government has established an energy policy. The mission of the policy is to
facilitate provision of clean, sustainable, reasonably priced, reliable and secure energy service at
least cost while protecting the environment. The policy is important to the country as Kenya tries
to achieve its 2008 vision 2030(Kenya national energy policy 2012).
The sessional paper no. 4 of 2004 and the energy act no. 12 of 2006 restructured the energy
sector in a bid to facilitate high level performance; the sessional paper and the energy act were
made to transform the energy sector and provide for more people to have access to power. The
policy has enabled increased private participation in the development of the sector whilst
focusing on improved management and delivery of energy services. This was intended to enable
the sector address its mission of proving clean, sustainable, affordable, reliable and secure energy
services at least cost while protecting the environment. The involvement of private sector
eliminates monopoly which is enjoyed by government owned companies (Kenya national energy
policy, 2012)
The ministry of energy (MoE) is responsible for formulation and implementation of energy
policies through which it provides an enabling environment for all parties. The Energy regulatory
commission (ERC) was established as an energy sector regulator under energy act, 2006, for
economic and technical regulation of electric power, renewable energy and petroleum sub
sectors. Its responsibilities include setting tariff, re-evaluate, licensing, enforcement dispute
settlement and authorization of power purchase and network contracts. Kenya Power and
lighting company limited (KPLC) is a state corporation with GoK shareholding of 30% as at
18
December 2011. It’s responsible for electric power generation and produces the bulk of
electricity used in Kenya (hydro, geothermal, thermal and wind) (Kenya national energy policy,
2012)
6.2 Challenges in Kenya energy sector
Some of the challenges facing the energy sector in Kenya is quantity, quality and reliability of
energy supply, high initial capital outlay, and long lead times from feasibility studies to
development of energy infrastructure, mobilizing adequate financial resources to undertake
investment in the power sector and high cost of energy, low per capita incomes and the low level
of industrialization. Challenges of institutional arrangements; governance issues, lack of research
institute, funding constraints and inadequate human resources capacity, overlap of mandate of
various institutions (Kenya national energy policy 2012).
According to Kenya national energy policy 2012 with the use of renewable energy there would
be available energy for all Kenyans and the government would avoid the use of taxation to
discourage wasteful consumption of energy. The government also has exemption of VAT for
domestic users with a bill of 200KWhrs/month (Kenya national energy policy 2012). In 2011
fossil fuel produced 22% of total energy consumed while coal contributed 1%. With recent
discoveries of oil in Ngamia 1 in Turkana country by Tullow oil n January 2012 the contribution
of fossil fuel is to increase at the expense of other sources. The government is putting more
efforts towards discovery of oil due to rising world crude oil prices (Kenya national energy
policy 2012).
According to economy survey report 2011 Kenya fuel consumption was 2.9million tons of oil
equivalent in 2004 and it increased to 3.6milion tons of oil equivalent in 2009 showing a
increasing demand of energy of around 17%. In 2009-2010 financial year there was 3.95million
metric tonnes of import of crude oil which is 25.3 % of country’s total annual import bill. The
demand is likely to increase by 3.1%/year between 2009 and 2030. In 2020 oil prices were US$
73 to 86/barrel and this changed in December 2010 to US$91.85/barrel (economy survey report
2011).

19
According to the national energy policy 2012 the peak load in Kenya is to grow to 2511MW by
2015 and later to 15026Mw by 2030. As on 30.6.2011 only 28.9% of Kenya’s total population
was connected to electricity this was an increase from 15% on 30.4.2004. This shows a growing
population and not growing energy provision (Kenya national energy policy 2012).
By 2030 the government projections according to economy survey report 2011 Kenya is to
produce nuclear energy 19%, geothermal 26%,coal 13%,hydro 5%, , thermal 9%, gas turbine
(LPG) 11% ,wind 9% and import 8% and this should help to generate the 15026 which will be
required by 2030 as shown in table 1.2 below.
Table 1.2 Energy source productions in 2011 and expected production in 2030 (Kenya national
energy policy 2012).
2011 2030
Geothermal 12.4% 26%
Nuclear 0 19%
Fossil 37% 0
Coal --- 13%
Wind 9% 0,3%
solar -- --
hydro 47.6% 5%
LPG 2.4%(bagasse) 11%
6.3 Renewable energy in Kenya
According to the economic survey 2011 renewable energies account for 69% of the Kenya’s
overall energy mix while petroleum accounts for about 22% and electricity 9%.Though the
20
percentage seems high for RE but the majority come from hydro power which is unreliable due
to its dependence on climate. Kenya deployed one million improved household stoves, 200,000
solar PVs, 1000 biogas units to meet cooking, heating and lighting needs of undeserved
communities
According to a study by Sabah Abdullah and Anil Markandya, 2007 on rural electrification
programmes (REP) in Kenya it indicates that the program has faced set back due to high
connection costs. The willingness to pay (WTP) to be connected to the grid and photovoltaic
services is less due to the high cost which the government should deal by reforming the energy
sector by giving subsidies.
The Kenya overall electrification rate in rural area is 14% which far below the sub Saharan
Africa level of 23 % (Abdullah, 2007). Lack of enough capital in rural areas has led to poor
electrification as the cost increases with distance from the grid, this makes connection cost in
urban areas cheaper than in rural areas. The low consumption of electricity in rural areas and low
income makes extension of grid to those areas uneconomical. In Kenya wood fuel provide up to
70% of the energy sector except for transport and commercial purposes. This has led to high
indoor air pollution (IAP) (Abdullah, 2007).
The REP in Kenya gets its fund from rural electrification levy fund which is 5% levies charged
from all electricity users nationwide. The ‘umeme’ program (Swahili) which is electricity
together was introduced to help households to come together to save cost and pay for extension
of grid. There is also less WTP for solar photovoltaic system due to awareness of the limitation
of the service (Abdullah 2007).
6.3.1 EU comparison with Kenya
Most countries in the world are aiming to reduce their emissions by choosing cleaner energy
sources. European Union for example aims to reduce emissions by 20% from 1990 levels
according to the 20-20-20 targets binding legislation. The union also wants to have 20% of gross
final energy from RE sources by 2020, 10% of transport from RE. The progress in EU can be
seen in the table below. This is an indication that with good and operating legislations RE can be
of success (Lowe, 2012).
21
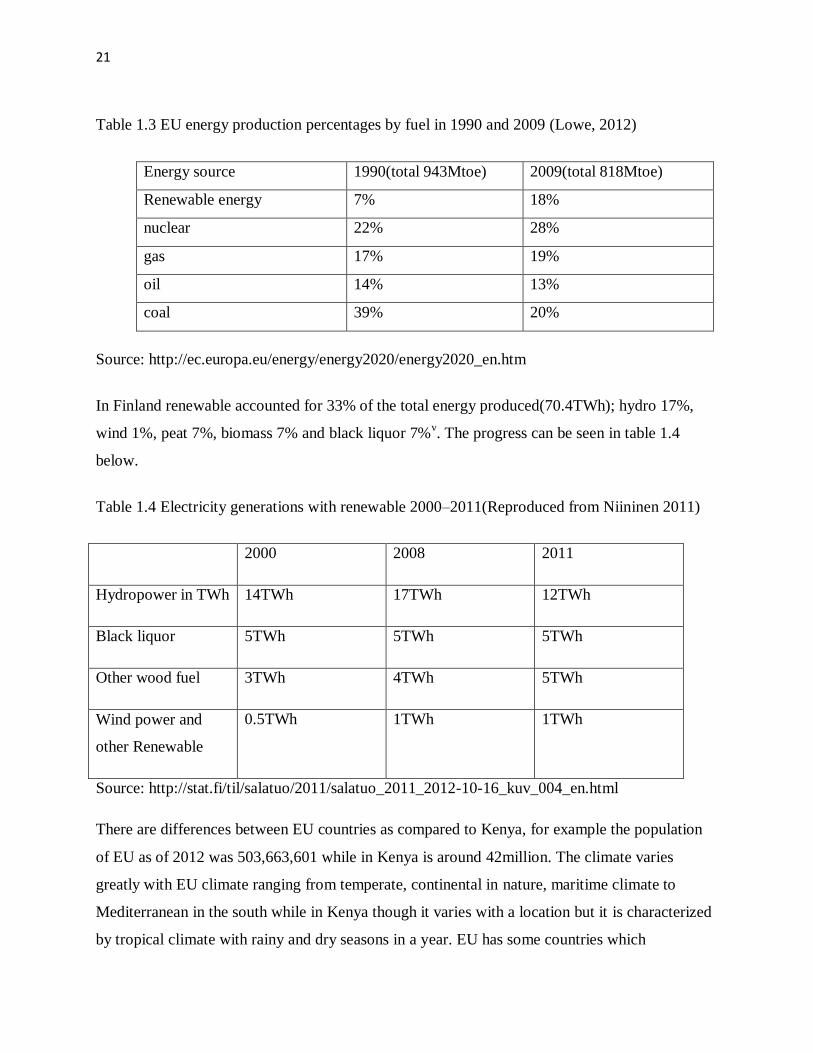
Table 1.3 EU energy production percentages by fuel in 1990 and 2009 (Lowe, 2012)
Energy source 1990(total 943Mtoe) 2009(total 818Mtoe)
Renewable energy 7% 18%
nuclear 22% 28%
gas 17% 19%
oil 14% 13%
coal 39% 20%
Source: http://ec.europa.eu/energy/energy2020/energy2020_en.htm
In Finland renewable accounted for 33% of the total energy produced(70.4TWh); hydro 17%,
wind 1%, peat 7%, biomass 7% and black liquor 7%v. The progress can be seen in table 1.4
below.
Table 1.4 Electricity generations with renewable 2000–2011(Reproduced from Niininen 2011)
2000 2008 2011
Hydropower in TWh 14TWh 17TWh 12TWh
Black liquor 5TWh 5TWh 5TWh
Other wood fuel 3TWh 4TWh 5TWh
Wind power and
other Renewable
0.5TWh 1TWh 1TWh
Source: http://stat.fi/til/salatuo/2011/salatuo_2011_2012-10-16_kuv_004_en.html
There are differences between EU countries as compared to Kenya, for example the population
of EU as of 2012 was 503,663,601 while in Kenya is around 42million. The climate varies
greatly with EU climate ranging from temperate, continental in nature, maritime climate to
Mediterranean in the south while in Kenya though it varies with a location but it is characterized
by tropical climate with rainy and dry seasons in a year. EU has some countries which
22
experience extreme cold winters like Finland which can have an impact on solar energy during
winter season unlike in Kenya where sun is available almost every day of the year (Ecorys,
2010).
Renewable energy barriers in EU as indicated by Ecorys, 2010 include planning delays and
restrictions, lack of coordination between different authorities, long lead times to obtain
authorization, costs of obtaining permissions and lack of a one stop shop to cater for all RE
issues. To get RE permits in EU varies greatly within EU countries and ranges from 1-2 months
in Denmark to 40months in Greece. The lead time in grid connection which is a also a barrier to
RE varies to with country from 6months in Finland to 3 years in Spain (Ecorys, 2010)
A one stop shop helps avoid dozens of authorizing institutions and has been effective for
example in Germany. In EU the barriers facing RE also varies according to the size of the project
whether on large scale or small scale. Large scale projects barriers to RE include long time of
planning, strict Environment impact assessment requirements and legal suits. For small scale
projects the barriers to RE may involve the costs of permits. For example in Italy a 5kW solar
panel installation on a roof permit costs 40% of the total cost (Ecorys, 2010).
6.3.2 Geothermal Energy in Kenya
Geothermal energy is caused due to high temperature at earth centre which is around 7000oc this
is attributed to when the earth forming process was taking place and tiny quantities of long lived
radioactive isotopes e.g. thorium 232 which release heat as they decay. The total thermodynamic
heat content of a system is called enthalpy. The Environmental impacts include noise(during
preparation), disposal of drilling fluids, accidents e.g. santiaguito volcano in Guatemala in 1991,
CO2, H2S, SO2, H2, CH4, N2 emissions , metals disposal, NaCl, KCl, CO2-
3 releases depending on
nature of water rock interaction at reservoir depth (Boyle 1990).
According to an article published in standard newspaper on 21.11.12 by Macharia Kamau
geothermal development company (GDC) will next year name four companies to generate
electricity (400MW) from geothermal well in Menengai 2 project. This shows the enormous
potential available in Kenya of up to 7000MW still remains achievable with good plans and
committed government.

23
According to Kalei, 2010 with right policies and private sector partnership, Kenya can harness
much geothermal energy to even export to her neighbouring countries. The heat produced from
the ground is used to heat water which turns into steam. The steam is then directed towards
turbines under high pressure which turn to generate electricity.
In order to encourage private companies to verger into partnership with GDC, GDC plans to
drill the wells and develop basic structures which it will operate with the four firms in a public
private partnership. GDC will also provide 20-40% of the capital. Each investor however will
need to raise at least ksh17B (around 15M Euros) to be short listed. According to the article the
capital intensive nature of the business and the risks of drilling wells which turn out dry are some
of the reasons private sector has shield away from investing.GDC advices on insuring against dry
wells (Kamau, 2012).
6.3.3 Biomass Energy in Kenya
Biomass is organic matter that can be used to give heat, produce fuel and generate electricity.
Wood, plant residues from agriculture, forestry and organic components of municipal and
industrial wastes and landfill gas are the products which can be used to get biomass. In Kenya
firewood and charcoal contributed to 68% of primary energy consumption (Githui 2010).
According to Githui, 2010 in 2000, 34.3 million tonnes of biomass was used for fuel of which
half of it was in form of fuel wood while the rest was charcoal processed in kilns with 10%
efficiency.
It is agreeable to some level that biomass energy will be the main and for some the only source
of energy in developing countries for some years to come (quoted from O’Keefe et al., 1984 by
Githui, 2010). In Kenya biomass is provided mainly from fuel wood and charcoal (89%), farm
residues used by only 21% of households, nationally about 2% of households use animal dung
for energy along with other sources like wood. Other source of biomass is wood waste from
wood shaving, saw dust and wood rejects which is used by 2.5% of households in 2010
compared to 5.1% in 1980(Githui, 2010).
According to Githui, 2010, the charcoal industry employs an estimated 700,000 people and
supports 2.8million people and has estimated market values of US$427miilion as of 2005.
24
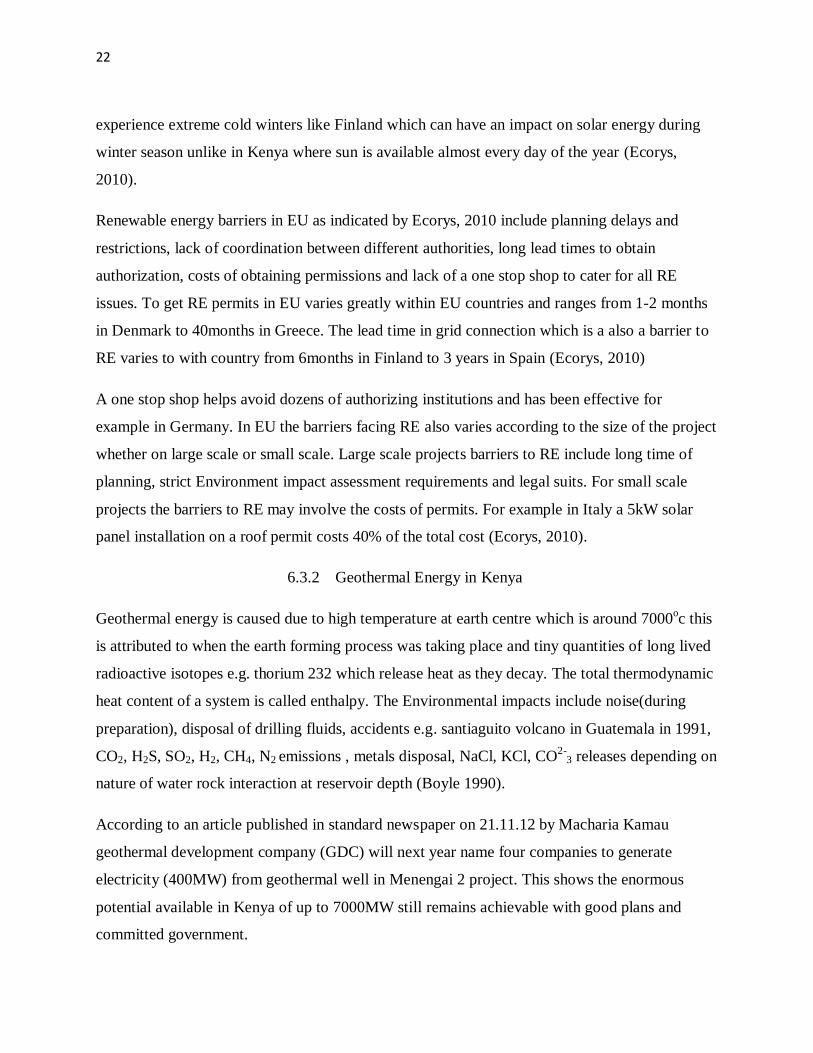
According to Abeeku, 2008 Kenya ceramic jiko (KJC) shown in figure 1.3 below is one of the
most successful projects in Africa. It saves 600kg of charcoal/yr, US$60/yr for a family. The cost
of jiko is around US$82 and 1.6million jikos were sold between 1997 and 2001.
Figure 1.3 Kenya ceramic jiko (picture from
Greenstone, 2007)
Though biomass is a renewable energy source if used unsustainably for example in case of using
wood without reforestation can have effects on climate change. This is due to the fact that plants
help absorb some of the carbon dioxide gas in the air ensuring carbon balance. Limited
awareness of the FiTs aimed at encouraging investments in renewable energies has led to poor
investment for example on biomass. Biomass can be processed either by gasification or by
pyrolysis. Biomass gasification is where solid fuels reacted with hot steam and O2 is used to
produce gaseous fuels under hundreds thousands degree Celsius operating temperature.
Conventional pyrolysis involves heating biomass in absence of O2 at 300-500oc until volatile
materials is driven off. The residue is char and has high energy density (Boyle 1990).
By using 30% of the agriculture residues and 10% of wood processing industry residues
15000MW can be generated from biomass (UNEP 2012). Biomass is currently the most
important RE source on a global scale which can be used for heat, electricity, liquid fuels and
chemicals (Veena 2009). Baggasse from sugar cane has also been used to produce power mainly
from sugar factories. It has a significant potential as a biomass fuel since it mainly arise at sugar
factories where flow of materials and energy are already well organized (Boyle 1990).

25
6.3.4 Biofuels from Biomass in Kenya
It’s the conversion of biomass into liquid fuel (ethanol and biodiesel) to meet transport need. It
helps reduce emission and save on foreign currency for importing crude oil. Sugarcane and
sorghum may be used to produce ethanol, coconut, and croton and cotton seed can be used to
produce biodiesel.
Challenges facing biofuels include lack of sufficient research, insufficient legal and institutional
framework to support sustainable generation, lack of public knowledge on the viability of
growing crops for Biofuels as a business. Some of the policies available include tax holiday, duty
waivers for biofuels production projects, plants and equipments.
Biofuels are seen as potential source of economic growth and as an alternative source of ‘clean’
energy. Agriculture provided jobs for 1.3B small holders and landless workers in 2007
worldwide. In Ghana larger areas of land have been outsourced by traditional land owners for
biofuel production (Matondi et al 2011)
6.3.5 Biogas Energy in Kenya
Biogas is the gas produced due to anaerobic fermentation of different materials for example cow
dung. It can be either from slaughter house, municipal waste, some of the projects which have
been successful includes bio power limited in Kilifi which use sisal waste and cowdung to
produce 150Kw. Flower farms (cut flower waste) can generate 87GWh/yr which is equivalent to
20MW this is due to large flower farms in Kenya. According to Abeeku Brew Hammond biogas
was introduced in Kenya in mind 1950’s by European farmers, by 1958 tunnel technology
limited had constructed about 150 plants in some parts of the country. Most of them were
however abandoned 5years later (Abeeku, 2008).
The government is involved in ‘biogas for better life’ a business opportunity to provide two
million households with biogas digesters by 2020. A feasibility study in Kenya has shown a
potential of 6,500 digesters every five years. Out of 300units built between 1980 and1990 only
25% were operation by 2002. This has been attributed to poor designs and construction of
digesters, lack of maintenance, poor dissemination strategy, and lack of follow up by promoters,
26
lack of government support through a focused energy policy. In rural Kenya 80% of people own
livestock (quoted by Abeeku, 2008 from Njoroge, 2002, B4BL initiative, 2007) showing the
enormous potential available in rural areas which are poorly connected to the grid.
Biogas for better life programme in Rwanda Cyangungu prison; a 150m3 fixed dome biogas
digester uses human waste generated by 1500 prisoners and contributes 50% of cooking needs of
6000 inmate prisons (Abeeku, 2008). This is an indication of how with good planning biogas can
contribute to save energy by providing all the required or some energy to institutions. Ghana has
a potential of 278000 biogas plant which can create massive employment but there is need for
project monitoring and follow up (Abeeku, 2008).
6.3.6 Solar power in Kenya
Solar energy is derived from the sun by use of solar panels which have a life span of 20-30yrs.
Photovoltaic (PV) were discovered by a French physician Becquerel in 1839. PV cells prices
have reduced due to use of solar grade silicon which is manufactured cheaply unlike the previous
mono crystalline silicon PV modules which were expensive (Boyle 1990). Solar thermal energy
can either be active solar heating (discreate solar collector/domestic water heating) or passive
solar heating (reduce energy needed for heating/low energy building design) or solar thermal
engines (extension of active solar heating can drive steam turbines) (Boyle 1990).
PV provides electricity in developing nations to an estimated 500,000-1million people in rural
areas. Solar home systems (SHS) can be used for lights, TV, radio and fans. Solar energy can be
used for lighting bulbs, heating houses and water, drying and generating electricity. Kenya
location astride the equator gives it a unique opportunity to invest in solar energy as it
experiences solar radiations of 4-6kwh/m2/day and around 6hours of strong sunlight (National
energy policy, 2012). To get the amount of energy or the number of solar panels one would need
the calculation below can be used;
In Kenya where there is 5.6hours of sun/day
A 80W solar panel would produce=450Wh/day
27
No. of solar panels one would need if 10200Wh is the power requirement in a house/institution
for lighting and other electrical appliances;
Total power usage=10200Wh
Charge hours=5.5hrs
Inefficiency-20%
10200Wh/5.5hrs=1854.54W
20%=2225.45W
2225.4W/75W panels=30 panels each 75W will be needed in this scenario.
Some of the barriers facing solar energy include lack of trained technicians cause market spoiling
leading to erosion of consumer confidence due to faulty installation, lack of political will (lack of
vision, no policies, and corruption), regulations, infrastructure, raw materials, awareness,
exploitation from experts, expensive solar home systems. Policies strategy which can be used
should involve promoting wide use, incentives for local production, frame work for connection
of solar energy to national grid through direct sale or net metering, and enforce minimum
standards for technologies, financiers for credits, tax rebates, zero tax and duties (National
energy policy, 2012).
6.3.7 Wind power in Kenya
Wind was first used to propel sailing boats, windmills used for about 4000yrs. Kenya has a
potential of 346w/m2 as it experiences wind speeds of up to 11m/s. According to Ricardo, 2002
wind is a form of energy which is caused by uneven heating of the atmosphere by the sun, the
earth’s rough surface and the rotation of the earth. Wind energy is used to generate mechanical
power to electricity. Most of the wind pumps in Kenya are manufactured locally for example by
Kijito wind pumps (Abeeku, 2008). Winds pumps have a life span of Wind 10-20 yrs.
Wind turbine suppliers globally and their respective percentage in terms of the number wind
pumps they supply include vestas from Denmark 34%, Gamesa from Spain 18%, enercon from
Germany 15%, GE from USA 11%, Siemens 6%, suzlon from India 4%, Repower 3%,

28
Mitsubishi 2%, ecotecuia 2% and nordex 1%. Wind pumps can either be horizontal axis wind
turbines (blades) or vertical axis wind turbines (vertical axis of rotation can harness wind from
any direction). The total installed capacity in the leading countries in the world is US 25,170MW
in 2008, Germany 23,903MW, Egypt 365MW (Veena 2009) showing the great potential and
thousands of megawatt of energy wind can supply to the grid.
Lake Turkana wind project source which is one project the government intends to build will
supply 300MW by late 2014. It will cover an area of 162km2 with 365 turbines each 850kW
making it the largest wind power project in Africa at a cost of 800m dollars/582m
Pounds/ksh75B. The project is expected to earn 260mUS$ from trading carbon under UNFCC
carbon trade programvi. Other projects include Aeolus 100MW and Gitson energy 300MW.
Challenges acting as barriers to wind energy include high upfront costs, potential areas far from
the grid and load centres, inadequate wind regime data, inadequate wind energy industry
standards, competing land interests and lack of R&D (National energy policy, 2012).
. figure 1.4. Kijitowind pump, manufactured in
Kenya in use in Turkana to pump water .Source: http://www.appropedia.org/Windpumps
According to an article published in Capital fm newspaper on 3.12.12 by Margaret Wahito the
proposed Lake Turkana wind project (330MW:40,000acres of land) is now is to be financed with
a guarantee from African Development Bank. This was after World Bank which was the main
financiers pulled out over fears that the power plant was too big for Kenya’s power grid and may

29
produce huge amounts of electricity which may go to waste hurting its position to pay creditorsvii
(Wahito, 2012).
Wind is an interruptible source as it requires reserve backup. It changes the dynamic of grid
behaviour and system study would be required to assess the impact in the grid and the need for
reinforcement. According to a report by the ministry of energy Kenya wind changes the dispatch
regime and the capability of KPLC to operate it need to be augmented this to some extend acts as
a barrierviii
. Evecon E-126 is the biggest wind pump generating 7.58MW with a height of 198m
and a diameter of 126m.Some of the calculation which need to be done before starting a project
on wind power are shown below;
Power output=kCp1/2ρAV3
K=0, 000133(a constant to yield power in KW)
Cp=maximum power coefficient (0, 25-0, 45)
Ρ=air density
A=rotor swept area (ft2) ∏D2/4
V=wind speed (mph)
Annual energy output (Kwh/yr) =0.01328D2V3
D=rotor diameter
V=annual average wind speed (mph)
The power output of wind is generator is proportional to the area swept by the rotor i.e. swept
area doubles the power output doubles
Example
D=126m A=12470m2 ρ=1.23kg/m3 energy=5MW V=14m/s
P=0, 5*12470m2*1.123kg/m
3*(14m/s*14m/s*14m/s) =19213277W

30
A wind pump with an efficiency of 10% the generated power would be 1921317.7W
Annual electricity production=KvmAkT
Where K=2.5 factor based on typical turbine performance characteristics
Vm=annual mean wind speed (m/s)
At=swept area of the turbine in square metres
T=no of turbines
Wind negative impacts include noise, electromagnetic interference for example radio and TV
and visual impact. Figure 1.4 below shows the noise effect by wind pumps at different distances
from the pump.
Turbine
Figure1.4. The noise levels at different distances from a wind pump. Reproduced from
http://www.planningni.gov.uk 2009
150m 400m
160m 45.3dB
42.9dB
44.7dB
200m
36.9dB
31
6.3.8 Hydro power in Kenya
The current generation of hydro power in Kenya is around 750MW (national energy policy
report, 2012). Kenya has a potential of 1450MW from plants with generation of 10MW or more
each and a potential of 31000mw of small hydro powers plants(less than 10MW). Mini hydros
have a life span of 30-50yrs. Some of the calculations to be taken into consideration when
starting a project on hydropower are;
Power (kW) =10*Q*h
Q=amount of water/second (m3/sec)
H=water fall height (m)
Some of the barriers facing hydro energy include the destruction of catchment areas it can cause,
inadequate financial resources&techical personnel for carrying out feasibility studies, inadeqaute
hydrological data and land and water competing interests, displacement of people and wildlife
Submersion of extensive areas upstream, destroying ecologically rich and productive land,
riverine valley forest, marshlands and grasslands (National energy policy, 2012)
6.3.9 Municipal wastes in Kenya
Municipal waste consists of solid wastes including durable and non durable
goods,containers,food scraps, yard wastes,inorganice wastes, manufacturing
wastes,agriculture,mining and constrtuction,demolition debris, sludge and liquid water from
water and waste water treatment facilities, septic tanks, slaughter houses and sewerage
systems(National energy policy, 2012)
The waste can be used to produce energy in form of biogas for example where food left over can
be used. Nairobi has over 2million people so the waste generated is a lot and can produce energy
with good planning where people separate waste from their households before they throw it
away. 1,530 tonnes of waste are generated every day. Dandora dumpsite had 1.3million cubic
metre of waste as of 2002(National energy policy, 2012).All legislature and policies on solid
waste management have been for local councils through local government act cap 265 (Muniafu
et al, 2010)

32
6.3.10 Energy Cogeneration in Kenya
Cogeneration is simultaneous production of heat and power from one single fuel source. Mumias
sugar company one of the largest sugars producing company cogenerates 38MW and sends to the
grid 26MW through a power purchase agreement. Cogeneration is possible where steam is
generated for process requirement in factories. Excess steam used for electricity generation for
example to turn turbines under pressure (National energy policy, 2012).
Close to 30% of Kenya’s population is directly or indirectly dependant on sugar and tea
subsectors. According to a study by MoE in 2007 Kenya has a potential of 120MW of electricity
for export to grid. The planned generation from all sugar companies is to reach 90MW this year
of which 38MW is currently been generated by Mumias sugar company (National energy policy,
2012).
In Mauritius though there has been an exception with around 5.5million tonnes of bagasse cane
been use to produce 318GWh contributing to 40% of total amount generated. Policy guidelines,
legal framework and incentives from government saw a rise from 242MW in 1995 to 318GWh
in 2004. The government intends to undertake capacity building programmes in available
technologies on this form of energy, carry out study on its potential, provide incentives to
promote cogeneration from biomass and undertake RD&D in cogeneration technologies National
energy policy, 2012).
6.3.11 Nuclear power in Kenya
A nuclear power plant is a facility at which energy released by fission of atoms is converted to
electrical energy under strict regulated operating conditions. Nuclear fuel cycle starts from
mining of uranium to disposal of nuclear waste (National energy policy, 2012).
As of September 2011 there were a total of 434 nuclear power plants in the world, 28 under
construction and 222 were in planning stage. The advantage of nuclear to solar and wind is that
less land is required for example to generate 1000MW from a power plant nuclear plant will
require 333,000m2, solar 332,000,000m
2 while wind 165,000,000m
2. Kenya so far has no nuclear
energy just like many other developing nations though the government plans to have nuclear

33
plants running to be able to meet the increasing energy demand by 2030 (national energy policy,
2012).
7 ENERGY POLICY TOOLS
7.1 Policies and strategies
Policies and strategies are tools used to encourage investors to invest on RE. There are different
forms of polices which can be used and may vary from eliminating taxes to subsidies. In Kenya
there is 15yrs income tax holiday for hydroelectric projects whose installed capacity is not less
than 50MW, 10yrs for between 20MW-49MW, 7yrs for less than 20MW but more than 1MW.
The government also has 15yr tax holiday for geothermal plants, 10yrs holiday for fossil fuel
plants of at least 50MW, 7yr-30MW-49MW, 5yrs-10MW-29MW 10yrs tax holiday for RE
including biomass (National energy policy, 2012).
7.2 Feed in Tariffs
Feed in tariff is a policy instrument that makes it mandatory for energy companies or utilities
responsible for operating the national grid to purchase electricity from RE sources at a pre-
determined price that is sufficiently attractive to stimulate investments in the RE sectorix (UNEP,
2012).
A FiT is an instrument for promoting electricity generation from renewable energy sources. In
Kenya the FiT policy was launched in April 2008 and applied to wind, small hydro and biomass
(municipal waste and cane bagasse). To attract private sector investment, a realistic review of the
tariff has to be undertaken to include other energy sources like biogas (national energy policy,
2012).
Its objectives are;
Encourage resource mobilization by providing investment security and stable
market for investors in electricity generation from RE sources.
Minimize transaction and administrative costs and time wasted by eliminating the
conventional bidding process.

34
Encourage private sectors to operate their plants prudently and efficiently to
maximize returns.
The challenges facing FiT include insufficient data to inform the level of tariff in different
technologies, lack of awareness on FIT among investors, no clear guidelines on PPA negotiation
results in lengthy negotiation and inadequate technical and financial capacity of some
community base projects. For Fit to be of greater attraction to investors it should include
operation and maintenance escalation components of electricity industry value chain which
includes fuel, generation, transmission, distribution and also delivery(national energy policy,
2012).
8 BARRIERS
According to Ricardo Forcano, 2002 lack of knowledge, costs and people preferring extension of
grid other than use of micro grids can act as a barriers to development on RE. This is due to most
people perception that when connected to the major grid they trust it more than small scale
projects like biogas plant. With lack of economic development in rural areas it leads to
alleviation of poverty levels in urban areas as more people migrate to urban areas constraining
more the available energy resources (Ricardo 2002).
According on an article by Matt McGrath on Desertec project on 19.11.2012 on BBC (British
broadcasting corporation), Desertec project was set up in 2009 with a budget plan of 400B Euros
to invest on solar energy mainly from North Africa. Major companies were Siemens and Bosch
as industrial partners but they have since pulled out of the imitative. The Spanish government
also declined to sign a declaration of intent citing difficulties finding subsidies. Unstable political
situation in North Africa has also brought concerns to investors and governments.
In Kenya in regard to IPPs power transformers, electrical switch gear with metering and an
adequate power line linking to the grid needed and producers should have them. The electric
power act Kenya requires IPP operators to have resources and experience that is unlikely to be
35
found in indigenous people. Cogeneration has been less successful due to low pressure boilers in
sugar producing factories (Abeeku, 2008 pg 16).
Barriers which limit the supply or investing on RE include limited supply infrastructure which
mainly involves poor connection of the grid with some areas been unreached. Quality standards
issues lead to people losing trust on some RE sources. For example solar power if the panels are
installed wrongly with low standards they may not work efficiently leading to poor supply. In
case of wind accurate data is needed for example wind speed in the area. In case there is no data
then it becomes a barrier as investors need the data to be publicly available (Margolis et al,
2006).
Lack of information in potential customers for example on biogas may lead to people preferring
the major grid to be extended to their facilities to micro grids. The most frequently identified
barriers as indicated by R. Margolis and J. Zuboy ,2006 in the report on non technical barriers
include ; Lack of government policy supporting renewable energy, Lack of information
dissemination and consumer awareness about energy and renewable energy, High cost of
renewable energy technologies compared with conventional energy, Inadequate financing
options, Failure to account for all costs and benefits of energy choices, Inadequate workforce
skills and training, Poor perception by public of renewable energy systems aesthetics, Lack of
stakeholder/community participation in renewable energy projects. Lack of institutional
familiarity with the technology can act as a barrier for example if builders and architects are not
comfortable enough with the technologies to suggest or offer it in new building designs
(Margolis et al., 2006).
Kenya spends more than half of its export for importing energy; this can lead to even poor
economic growth as the money can be used for other infrastructural benefits. Kenya has poor
financing options according to IPCC with rural population using rotating saving and community
based financing methods. According to IPCC a country which majority of people use saving and
credit cooperatives is termed to have poor financing option unlike in a place where banks and
insurance companies are used (IPCC report, 2012).
36
8.1 Costs and pricing barrier
Cost of renewable energy has been the greatest barrier to renewable energy due to the costs
incurred before one can generate energy from the plant. This has faced more sets backs due to
governments reducing subsidies for fossil fuels and nuclear power rather than increasing
subsidies for renewable energy (Beck, 2004).The world bank and IEA put global annual
subsidies for fossil fuels in the range of US$100-200B ( Beck,2004). IEA put global subsidies
for fossil fuels at US$312B/yr in 2009, RE at US$57B/yr in 2011. Subsidies for oil include tax
incentives, RD, insurance, leases, waste disposal, fuel prices risk guarantees political risks-war,
civil disturbance, critical for foreign investors and financing institutions (Beck, 2004).
The high initial cost discourages investors which is made worse by high lending rates by
financial institutions due to low pay back time of RE. There is also the location value factor
which occurs where most RE are located near the consumer and far from the grid making it hard
to connect to the grid. The time factor is created and may build a barrier due to the additional
time required in permitting finances due to lack of information about the technologies on RE.
Though majority of people may argue that RE is expensive compared to fossil fuels but most of
the calculation on cost does not include environmental externalities which is the money spend
due to fossil fuels for example health care costs (Beck, 2004).
8.2 Legal and regulatory barrier
In Kenya there is monopoly in power utilities both in electricity production and distribution. But
off late the sector has seen the entry of independent power producers (IPP) selling some amount
of electricity to grid. Though for IPP to be operational according to Beck, 2004 a legal frame
work is needed for them to invest, this leads to creation of power purchase agreements. The
failure to have a legal framework to encourage private sector to invest on the grid is a barrier.
Other restrictions which affect RE are restrictions on buildings upon height, noise and safety or
in urban areas (TAMK wind turbines certain height due to Tays hospital landing helicopters).
Wind turbines may also be restricted in places with migratory bird paths (Beck et al, 2004). New
transmission lines been built to access remote RE sites may be blocked by transmission access
37
rulings. In Kenya this is experienced in case people are to be resettled and they go to court
blocking the resettlement which delays construction works. The long court cases discourage
investors who want to invest and get profits from the projects they want to start.
Another form of legal and regulatory barrier according to Beck, 2004 is on transaction costs of
hiring legal and technical experts to understand and comply with the interconnection
requirements as stipulated in different regulatory frameworks. This can be avoided by creating
policies that create uniform and sound interconnection standards to reduce interconnection
hurdles and costs.
Legally binding national targets forcing the government to have a certain percentage of RE
providing power to the grid can be of great boost to RE. In European Union for example the
legally binding target to increase the amount of RE has helped the countries to increase RE
amounts and at the same time reduce emissions from fossil fuels. Several countries have adopted
RE targets for example EU 22% by 2012, Japan 3% by 2010, US 10% by 2020. India and china
became the first developing countries to have RE targets, India 10% 2012 and china 5% 2010.
Kenya has a policy on what she intends to have as source of energy by 2030 but the targets are
not legally binding which can cause poor RE performance at the expense of fossil fuels.
8.3 Market performance
Lack of access to credit by potential investors is a barrier as any project needs money to start.
Most of the big projects need a substantial amount of capital which one cannot be able to finance
unless there is credit or loans from financial institutions. Market barriers include inconsistent
pricing structure, institutional, political and regulatory, though these barriers differ between
developing and developed nations. Traditional energies benefit from a long history of
government intervention unlike RE. Regulatory framework enabling policies and subsidies that
favour conventional energy should be removed. Conventional energy companies are extremely
wealthy and powerful and can influence political decisions or they bring about a political
challenge (Kinner 2010).
New technologies may be perceived as risks if new in a region in case people have no confidence
in it .This is normal in every part of the world as new products are not trusted due to lack of

38
information about the technology. This creates the need for government to set up experimental
centres where people can learn and see the technology work (Kinner, 2010).
Dispersed population can bring a challenge for example on extension of the grid. The
economical value will be none as the cost will be high yet the people to be covered are few. This
can be avoided by use of micro grids instead of grid extension. For example using solar panels or
wind power can act as a good solution. People in dispersed population should be a great
opportunity for RE to succeed with the use of micro grid (Kinner, 2010).
9 GENERAL PROMOTION POLICIES
General promotion policy to RE include Price setting and quantity forcing policies, Investment
cost reduction policies and incentives and Public investments and market facilitation activities.
They are made to reduce market barriers and facilitates RE markets.
9.1 Price setting and quantity forcing policies
These policies are set to reduce costs and pricing related barriers (beck et al, 2004). They set
favourable pricing regimes which are aimed at attracting investors to verger into RE related
investments. The quantity under such regimes is unknown but the price is known in advance.
Quantity forcing do the opposite, they mandate a certain percentage quantity of generation to be
supplied from RE at unspecified prices. These policies can attract investors and create RE boom
if the government is committed to having RE (Beck et al, 2004).
They provide a good playing field for investors as the price is already set and they are
favourable. The quantity forcing policies requires the government to commit to have a certain
percentage of its energy from RE. This attract investors as they have government support as the
target are been aimed at. To get a certain quantity of energy from RE the government will be
forced to create favourable conditions to investors by reducing taxes to encourage investors
(Beck et al, 2004).
39
9.2 Cost reduction policies
These policies are made to reduce capital costs upfront(subsidies and rebates), reduce capital
after purchase(tax relief), offset cost though a stream of payments based on power
production(production tax credits), provide concessionary loans and financial assistances and
reduce capital and installation costs through economies of bulk procurement(Beck et al,2004).
Some of examples where the above policies have been used include Germany where in 1991,
only 1000 solar roofs in individual households, the government gave 60% off in 1999 leading to
a rise to 100,000 roof households amounting to 300MW peak. In US there are investment tax
credits where businesses get 10% tax credits for purchase of solar and geothermal RE property.
Other forms of tax reliefs include accelerated depreciation tax benefits to recover investment,
production tax credits, personal income tax incentives, sale tax incentives, pollution tax
exemptions, grants and loans (Beck et al, 2004).
9.3 Public investment and market facilitation activities
This may involve setting up a Public benefit fund or state clean energy fund. The funds from the
system can be used to encourage RE investing. For example the funds can be used to establish
experimental facilities where people can learn more about RE (Beck et al 2004).
This kind of activities can work and in Kenya the rural electrification program gets its fund from
a levy collected from electricity payments by each individual. With proper planning the
government can get funds to facilitate RE activities in the country (National energy policy,
2012).
9.4 Infrastructure policies/market Infrastructure
These policies are made to create a good infrastructure for RE projects to start and run on.
Construction design policies require buildings to have RE or a design that encourages RE. Other
tools which can be used are site prospecting where areas with potentials are studied and the
information made ready for access by investors, review and permitting-assessment programs to
enable investors to get required permits to invest in RE in a easy way and zoning to identify best

40
sites to invest. India for example has 600 stations where one can acquire information on sites,
equipment standards and contractor certification (Beck et al, 2004).
For market infrastructure industrial recruitment for example giving credits, grants to attract RE
equipment manufacturers, direct equipment sales where consumers buy and lease RE systems
can also encourage investors (Beck, 2004). In case where people have no confidence in a certain
RE systems they can lease and use it for some time instead of buying. In Kenya where majority
of people have less capital leasing RE systems like solar panels can see major use of it.
Transport Biofuels policies mandate requires a certain percentage of all liquefied transport fuels
be derived from RE for example the ‘proAlcool’ program of Brazil since 1980’s which mandated
the use of ethanol to be blended with all gasoline. In 2000 40% of all automobile fuel
consumption in Brazil was ethanol (Beck, 2004). In another example in Germany biodiesel
consumption shot to 750Mgallons in 2002 from 200M gallons on 1991 due to tax incentives.
Kenya has no transport policy which can attract investing in RE fuels for example use of
Biofuels in vehicles (Beck, 2004).
Emission reduction policies; these are policies to reduce power plant emissions (NOx, SO2 and
CO2). Through RE sets aside can reduce emissions by companies buying credits from RE power
producers. Green house mitigation policies can be achieved by low interest rates for development
of biomass and methane energy resources. By having policies to reduce emissions may create
market for RE which is clean with no emissions. This is a challenge to developing countries for
example Kenya which want to be middle income country. Reducing emissions by using RE
which are seen as expensive is seen to hinder development in developing nations which will need
a lot of energy so they can run industries (Beck, 2004).
Power sector restricting policies; these policies have an effect on electric power technologies,
costs, prices, institution and regulatory framework. Competitive wholesale power markets and
removal of price regulations on generation in power markets according to Fred Beck, 2004
power contract are signed between buyers and sellers in wholesale to avoid advantages
monopolies have had due to presence of IPP. RE has difficulty competing on the basis on price
alone as short term contracts favour fossil fuels. Green power can be used to increase the
41
competitiveness of RE in retail markets, for example in Netherlands high tax on fossil fuels has
created more interest on RE.
10 KENYA RE BARRIERS
RE incentives and policies are needed in Kenya since IPPs and private sector can end up
investing in fossil fuels (IEA, 2007) which have short lead time and the risks associated with
fossil fuels are known since the fuel has been used for long time.
In Kenya there has been a over reliance on hydropower and low investment in power sector by
private sector, high cost or rural electrification and low countrywide electricity access(SREP,
2011). According to a report by Kenya electricity transmission limited company (KETLC)
January 2012 a 428km transmission line (suswa transmission line) will affect 1,250 land titled
parcels. This will cost around 140M Euros and 184 residential have to be relocated and
compensated. The process of relocating people increases the cost of projects and the time before
the project can start can become many years.
Traditional fuel remain dominant resulting in slow market development and poor commitment
to science and technology education and low budgetary allocation to research and development
and demonstration. In Africa according to Abeeku, 2008 there are 78 researchers for one million
inhabitants and 1% of total global gross expenditure in R&D (Abeeku, 2008 pg. 37). Absence of
mandatory standards and enforcement leads to poor designs, competition of energy crops with
arable land, inadequate access to high quality planting materials, media passes non essential
information materials mostly about politics (Abeeku pg 1-52).
Geothermal Kenya has mainly been operated by government and has seen little progress. With a
potential of around 7000MW only hundreds megawatts have been exploited. The government
should move from use of parastatals to private sector. The private sector if given a good business
environment can exploit and start many projects which can lead to more power been generated
from Geothermal (Abeeku, 2008).
Large investment used for maintaining the existing power infrastructure especially hydro power
plants has led lack of starting of new projects. Most of the power plants are old and needs a lot of
money to maintain them. According to a report by UNEP, 2012 the use of Private sector is a key
42
will be play key role to opening up of new RE projects. The average generation cost in sub
Saharan Africa is US$0.181/kwh while in Asia US$0.04/kwh. With 80% of the population living
on US$2.5 the choice of electricity source will be cost motivated (UNEP, 2012).
RE projects requires some data e.g. wind, sun radiation, precipitation history which is not or may
not be available in developing nations (UNEP, 2012) .Unfamiliarity with RE mean long process
assessment, sitting, permitting, planning ,development, proposals, assembling financing
packages and negotiating power purchase contract with utilities (UNEP, 2012). The government
should collect all the data and make it available to investors. Geothermal sector has been
characterized by long gestation period due to various constraints which include financial and
geothermal resource risks.
According to engineer Henry Gichungi, 2012, 51% of earth’s sunlight is in Africa though the
continent has the smallest amount of electricity supply. In Kenya 13 micro grids are operated by
KPLC and additional 9 microgrid financed by REA are under construction all of which are diesel
powered. The use of diesel powered micro grid projects by REA is an indication of lack of
capital to start RE projects which are termed as costly.
The current electricity demand in the country is 1,191MW and the effective installed capacity is
1,429MW. By 2015 it is projected that the peak load will reach 2,500MW and in 2030 it will
reach 15,000MW, the installed capacity by 2030 should be 19,200MW as per the government
plans. It costs KES 35,000(US$422) to get connected to the grid and UScents15 equivalent/kWh
of electricity service. The high cost is brought about by the investment needed to build new
generation utilities, transmission lines and distribution facilities due to the weak distribution and
transmission network. The increasing demand may force the government to invest on fossil fuels
at the expense of RE if there is no policy and legal framework committing the government to
have some percentage of its total energy production from RE.
According to Dario Yuko, 2004 modern energy supports the three pillars of sustainable progress
namely social equality, economic growth and preserving environment. Most of the new projects
in areas perceived as new or untested have failed due to decision makers sticking to ‘business as
usual’ policies. KPLC was ordered to buy all available power from sugar companies
43
(cogeneration plants) in an effort to encourage sugar companies to produce power. For RE to
experience robust growth an appropriate mix of public and private partnership will be needed.
Least cost power development plant(LCPD) is a twenty year forward plant which is a tool used
by the ministry of energy to identify power resources and to assess their financial viability
before power projects are commissioned( prepared in 1986 and updated annually). This is an
example of tools which can be used to encourage investors as they have information on areas
which can be of importance in RE (National energy policy, 2012).
According to SREP report, 2011 wind energy experiences high capital costs and lack of
sufficient wind regime data. The potential areas are also far away from the grid. In 2003 the first
Wind Atlas was developed to help guide investors to invest in wind energy. The solar energy in
Kenya also experiences some barriers which include high initial costs, low awareness of
potential opportunities and economic benefits and lack of adherence to system standards by
suppliers. The government has zero rated import duties, removed VAT and RE equipments and
accessories. Hydro power though common in Kenya also has its own barriers which include high
installation cost(US$2,500/kw), inadequate hydrological data, effects of climate change, limited
capacity to manufacture small hydro power components as the government has to import them
making them costly.
According to Peter Kahare, 2012, in Kenya one wind installed MW costs between US$2-2.4M
while one hydropower installed MW costs between US$2-3.1M. The 300MW wind power
project in Turkana in Northern Kenya is expected to cost US$1B. Easily available information
on the internet can help attract investorsx. Empowering rural areas to produce power can help
develop rural electrification program. Lack of framework to promote RE investment at the
lowest level has contributed to poor rural electricity supply (Kahare, 2012). The use of small
hydro off grid may be more beneficial to remote areas which are far away from the main grid as
it will save cost on grid extension which may be uneconomical. In Kenya only 5.1MW is
generated from wind power, there is a potential of 7000-10000MW of which only 2% has been
exploited. The budget allocation to ministry of energy was US$753m of which 30% was used for
geothermal.
44
The urban population is growing at 6% growth per year which means more electricity demandxi.
According to an article published on 28/10/2012 on daily nation Kenya, Kenya acquired 100,000
acres of land in Marsabit County to generate wind of 300MW at a cost of US$1B; the cost may
be reduced if the land is leased instead of buying. The large acres of land required for example
for wind power is a barrier due to competing land interests by farmers. Most of the population
practices agriculture and more land is needed to feed the nation as the population grows.
The government seems to be putting lots of effort on thermal energy due to its short lead time,
predictable risks and cheaper price. Solar power is viewed as expensive and unpotential. This
was proved in the feed in tariff of 2008 which excluded solar but was later included in 2010 but
only for 100MW plants which can provide 500KW to the grids. To generate 500KW it is
estimated that an investor needs US$1,25M. The 500kw to provide to the grid is too high and
should be reduced to 3kw which is the maximum demand for ordinary consumers in the country
if investors are to be encouraged to exploit this sector. Though Kenya receives good amount of
sun due to its geographical location around the equator the energy has remained fully
unexploited. For example a 1KW of solar installation can generate 2000KWh in Kenya as
compared to Germany where it will generate 1000Kwh (National energy policy, 2012).
According to a report by national climate change response strategy in April 2010 the effects of
climate change on hydro power are likely to increase in the future due to lack of rains (pg 55). In
Kenya the emissions from energy sector increased by 50% in the period 1990-2010 (pg 59). This
can be attributed to thermal energy especially diesel engines. The cogeneration from tea and
coffee husks has a potential of 300MW as Kenya is a major tea and coffee producer.
45
11 DISCUSSION
To analyse on the facts provided previously it is worthy to say that RE can be managed with
proper policies to provide a substantial amount of energy in Kenya. Currently RE provides over
60% of the total energy but this though RE it is not sustainable anymore. This is due to the fact
the energy is coming from old hydro power plants which are costly to maintain making it hard
for government to start new power projects in the country.
RE is likely to face more competition in Kenya for the next few years after the discovery of
commercially viable oil deposits in the country. This will provide a worrying trend as the
government will be keen to get oil deposits in the country at the expense of other sources of
energy in the country affecting RE. The government currently spends 23% of its import capital
annually to import crude oil so it will be critical for them to get oil deposits in the country to save
on that.
Kenya been a developing country with growing energy demand day by day due to the growing
population and setting up of new factories it can be noted that it will be hard for the energy
sector to grow towards RE due to the long lead times. In the near future more thermal energy
will be used as it has short lead times which can provide energy after the installation of
generators running on fossil fuels.
The government has some targets which it intends to achieve by 2030 for example improving the
current geothermal generation from around 200MW to 5,110MW. Though this is achievable it
will need commitment and big incentives to attract investors who are more likely to invest on
thermal energy. Another challenge is the cost factor; to generate 115MW thermal energy it cost
the government 11Billion Ksh while to generate 300MW of wind for example the Lake Turkana
project will cost 75Billion Ksh which could generate over 700MW from thermal in a shorter lead
time.
The peak load in Kenya currently is 1500MW and is to rise to 2511MW is 2015 and later to
15026 in 2030. If the predictions are right and 15026MW will be required by 2030 then it
provides the government with an enormous challenge on how to generate this energy in less than
20 years time. This can be a good time for RE like wind and solar to flourish if the government is
46
to plan and acquire all the regime data required by investors. If the government does not pass
legally binding targets in the next five years then it will be impossible to get substantial amount
of energy from RE by this time. This will in turn open investment opportunities for thermal
energy using fossil fuels to try to get enough energy for the economy.
Some of the initiatives that the government started before for example the ‘umeme pamoja’ can
be effective especially in poor rural areas. In these areas most people struggle to get money for
food and fees to educate their children. It is almost impossible for them to get loans to pay for
grid extension. Another issue is that the cost of grid extension depends on how far a house is
located from the grid, this provides another challenge where people are scarcely populated and
they have less income. The government needs to extend the grid to every rural area so the
distance to grid is less. The other best scenario is the use of micro grids for example use of solar
panels of wind power to serve a certain region.
RE requires some capital to start the projects and get them running. In a country which is still
struggling with poverty, hunger and security issues the cost burden increases. In this scenario to
be realistic the government will spend a substantial amount of its budget to buy food, provide
security and improve the welfare of the people. Though energy is a key to improving the welfare
of the people but it will be outcompeted by other factors like providing descent houses for
example to people leaving in slums. Energy from RE is still attainable but it will cost the
government to have legally binding targets and polices which have to be enforced if RE is to
compete with other interests in the country.
Since Kenya has Kijito wind Pump Company which can manufacture wind pumps locally the
government should take that opportunity and channel funds to this company so people or
institutions can have winds pumps at a cheaper price. The presence of this company is the
country indicates that the expertise is there in the country. The presence of good governance
polices and regulations can help a lot in attracting investors. Kenya is crippled by corruption in
government institutions which can make investing in the country or having policies implemented
hard. The presence or a good road map on government plans can help to avoid scenarios like was
with the case with Lake Turkana wind project where the World Bank pulled out citing issues that
the energy to be generated is a lot for the country and will go to waste.

47
Most of the municipal wastes for example in Nairobi end up in landfill. The councils are the one
given the work to collect waste but there is no legislation requiring them to generate energy from
the waste. If the councils were to generate energy and sell to the grid they can get more income
to run the councils but it will need a legally binding legislation to enforce the same. Creation and
enforcement of waste management policies as well as ways to do it, incentives, community
involvement, education and awareness will be of great importance.
Most people are happier if given the chance to have the main grid extended to their place than
having solar panels as they trust it more. This is also strange taking into account that Kenya
experiences 83days in a year of power cuts. The government can set experimental centres for
example utilizing schools which can improve the confidence of local people. This is the only
way to have majority of people have RE in their homes since the reality of it is that before the
main grid gets to every house in the country it will take tens of years.
The political situations in the country especially when nearing the general election is so tense
that the economy is at stand still and most investors hold on their finances and wait after the
election when they can invest. General elections are held after every five years and the
campaigns take almost 6 months before the Election Day. This translates to one year in every ten
years when the country is in tense mood and investors shy away in fear of losing their capital.
The government has to set up strong legislation to ensure politics do not interfere with investors
who can invest for example in RE boosting the energy situation in the country.
RE sector though sustainable it will need government intervention for it to be a success. This is
due to many barriers which face the sector and the preferred fossil fuel because of their long
history in the world. To create market the affecting factors need to be taken into account to
improve the market. In Kenya most consumers have the willingness to pay for energy they use.
Willingness to pay is the maximum amount of money that may be contributed by an individual to
equalize a utility charge. This indicates with good energy supply the market will be there.
In Chile rural electrification is at 80% due to government subsidies. The Kenyan government
should commit itself to see the success of rural electrification by giving subsidies and also
allowing the private sector to supply energy to rural areas within agreed terms. In Kenya KPLC
48
is the only entity who owns the markets in electricity transmission and distribution. As of 2002,
200,000 households had solar panels (Abdullah 2007)xii
. This is a big success showing how RE
can help provide energy. With tax reliefs and reduced prices the number of people who will use
solar panels can increase to millions.
To make RE to be of a success by removing the existing market barriers several measures have
to be undertaken. The measures could only be taken after knowing the barriers we face so we can
break the barriers and achieve our goals on RE. The measure should be made to eliminate cost
barriers, information barriers and policies and regulatory frame work will be the key measures to
be used.
The use of cooperatives which involves people coming together with the same goal can be of
great contribution in the breaking of barrier on high costs and access to credit. Cooperatives can
share the burden of cost making it cheaper to individual people. The cooperatives can also easily
access credits from banks or financial institutions as they have more guarantees/trustee which the
financial institutions can trust. The use of cooperatives has been in Kenya for a while and would
end achieving much if the government encouraged their formation and allowed easy access to
credit from financial institutions. Micro financing also can be of great help to breaking the
barrier on cost. Local communities wind turbines in Denmark where group of people buying
wind turbine (cooperatives) have been a success where 50% of all wind turbines are owned this
way (Boyle 1990).
For private sector to invest in energy to supply to the grid real time pricing and interconnection
regulation legal access laws need to be passed. This will help avoid time wastage in
interconnection issues. In Kenya full grid extension is costly and unrealistic as people spend less
electricity mainly for lighting and electrical appliances. The government should encourage
private sectors to invest and supply rural areas with electricity or the government can use energy
service concession where the government selects on company to serve an area; the government
regulates fees and provide subsidies.
Democracy and security is a key to economic development and energy development. Lack of
security may force the government to spend much capital on providing security at the expense of
49
development. The 2007/2008 post election violence in Kenya cost the government billions of
Kenya shillings settling the displaced people. The money could have been used to invests a lot of
energy from RE. The little progress by Desertec project due to political tension in North Africa is
also an indication how political stability is important in energy sector. Democracy will also be
needed and it is needed to pass key bills and polices to encourage investing in RE. Political
tensions also discourage investors as in case of government failure their businesses may collapse
incurring losses (McGrath, 2012).
Education campaigns, available information to investors and people, working regulatory
framework, subsidies, utilizing CDM facilities, involvement of local personnel, technology
transfer both horizontal(technical and management) and vertical(skills) will play a key role in
breaking RE market barriers. Government should plan and coordinate RE projects. Low
budgetary allocation to the ministry of energy or to R&D leads to little progress towards a
sustainable energy system. The capital should be made available and the government should
commit itself to supporting energy related institutions. Financial institutions should be sensitized
to make provision for special packages to promote RE according to Abeeku, 2008.
IPP should be for RE not fossil fuels this can only be achieved by providing tax reliefs, subsidies
and good interconnection to grid terms. Fossil fuels provide a fast and cheap way to generate
energy creating a challenge to investing in RE. The government should start training programs
on the use of RE, have agreements with financial institutions to provide low cost long term
financing for RE projects and create awareness for existing financing mechanisms. Potential
investors also should be trained on how to identify and manage RE projects and commercializing
IPPs to electricity utilities.
Lack of government policy in acquisition of new technology and equipments have been
recommended by Alexandra Niez, March 2010. In Kenya there exists monopoly in the energy
utility with only government owned companies providing for generation and distribution of
electricity. Opening up for private sector may create room for more investing and competition
leading to more projects opening up.
50
In USA they have PURPA (public utility regulatory policies act) which was set up in 1978 to
reduce dependence of fossil oil. In California they set up a standard offer in 1980 of 6cents/kwh
which spurred many investments but failed in 1990’s. The electricity feed in laws in EU in
1990’s set up a fixed price for utility package of RE, for example Germany in 1991, RE
producers could sell power at 90% of retail market prices(Beck et al,2004). Utilities were also
obliged to purchase power, this led to 8500MW of wind power in 2001 making Germany RE
leader. In UK they have non fossil fuel obligation of 1990 policy. This led to wind power
contracts been reduced from 10pounds/kwh in 1990 t0 4.5pounds/kwh in 1997 though this did
not lead to projects. All this success is a good indication that with good government plans and
policies RE can achieve a lot.
RE green certificates can also be used to encourage investment in RE. It’s a way for utilities and
customers to trade RE production and consumption credits in order to meet obligations under RE
portfolio standards (RPS) and similar policies. In this situation according to Beck, 2004 one can
buy and sell certificates from those who have met set standards in case you have not. This has
been tried in EU between 2001 and 2002 where 40 companies in seven countries had opened
trading accounts.
To replace 1000MW power station by wind farms it would require 667km2 of protected space.
Wind alone cannot support all energy needs but can contribute something. Ethanol use in Brazil
has led to Amazon deforestation (Pimentel, 2008). The large land areas required by some RE
sources require government good planning to avoid human conflict with these RE sources.
Displaced people also should be well compensated.
The tariff rates should be lowered as the rates have gone high due to thermal generations in the
country. In 2011 SREP (scaling up RE program) allocated to Kenya US$50M to invest in RE.
Kenya is more ambitious to geothermal than other renewable. There is need to lower feed in
tariff so as to scale up investment but this would require regulations. In Kenya there is need for
an incentive regime. The sector experiences regulatory constraints, high initial costs, limited pool
of trained technicians for operation and maintenance, insufficient public awareness and less
transmissions network.

51
Globally some 300,000 people are employed in wind power, 170,000 in solar photovoltaic
600,000 in solar thermal, 1.2M in biomass and 2.3 M people overall(UNEP, 2009). This is an
indication of enormous benefits got from RE apart from it been sustainable. Global oversupply
of solar energy goods lead to decreased price. Though it’s good for prices to go low but the issue
of manufacturers closing due to low prices has be taken care of by policies (closure of
component manufactures ought to be thought of). Kenya exported solar panels worth US$1M in
2007 and imported solar panels worth US$10.3M (IEA, 2007).
To stimulate RE, laws requiring utilities to purchase all electricity generated from RE or law
requiring RE to be a certain percentage of all power generated need to be passed to ensure
investors have market for the power they produce from RE. Subsidies for investment in
component manufacturers, reduction in taxed for component manufacturers and tariff for
electricity from RE (Veena 2009). Though technology transfer is good it should be regulated to
avoid crowding out local innovation according to Veena which could be of greater significant.
Building codes are been reviewed and should be analysed further to incorporate measures that
will encourage climate proofing and the construction of energy efficient buildings. Regulations
to provide framework for the solar PV value chain and facilitate good design, installation and
proper use of solar PV systems; this will help avoid supply of substandard components and
installation. Another challenge is on geothermal resources located in underdeveloped areas. This
can be solved by use of micro grids to provide energy to the surrounding population in case in it
uneconomical to extend the major grid. The first 45MW in Olkaria drilling started in 1955 but it
was commissioned in 1985, 30years later. GDC aims to make the process shorter to 5yrs from
drilling to commissioning. The government budget allocation to GDC rose from US$85M in
2009/2010 to US$188M in 2012 financial year. Private sector has key role in boosting the
exploration of geothermal energy use.
Wind power in good location can deliver power at a cost below US$69/mwh compared to coal
at US$67/MWh (unep 2012). Private sector needs a level playing field which can be created by
public incentive mechanism, ease of market access by eliminating monopoly as in the case in
Kenya and mitigating political and regulatory investment risks (UNEP 2012). Most countries
have RE targets but no support policies to achieve the targets according to UNEP making it
52
impossible to achieve the targets. This is the case in Kenya where they have the targets but no
legal framework on how to achieve them.
According to a report by the MOE on guide for investors 2012 , in March 2008 the MOE
formulated and published FiT for wind, small hydro, biomass, geothermal, biogas and solar. FiT
allows power producers to sell and obligates the distributors to buy in priority basis all REs
generated electricity at a pre determined fixed tariff for a given period of time. FiT levels are
technology specific and depend on investment costs of the plant, operation and management
costs, fuels costs where applicable, financing costs and return on the invested capital, estimated
lifetime of the plant and amount of electricity generated.
Wind atlas in Kenya provides broad national information which may be of little help in case an
investor needs data of a specific area thus a detailed feasibility study is required. The government
should undertake feasibility study in areas with potential for wind power and make the data
available if needed by investors
The most successful states are the states that have intervened on the part of RE markets.
Countries with intervention policies still struggle with Renewable energy development (RED).
Kinner notes that government intervention should not go very far but policies and regulatory
frame work is good for RED. One such good example is in Albania where the government
intervenes on financial institutions.
In the case of developing countries the market perspective can be shaped by outside sources,
honesty of government and capacity of government to intervene effectively. Energy sector plays
a role on basic health and nutritional needs and in developing countries it takes a sizable share on
total house expenditure (Kinner 2010). Countries doing well in producing oil perform poorly in
RE for example Saudi Arabia and the Kenyan government has to pass supporting polices and
legal framework on RE with recent discovery of oil which may shift government attention from
other sources of energy to fossil fuels. R&D important as RET is an emerging sector,
demonstration centres need to be established so to enlighten the population on the greater
potential available from RE. NGOs have a role to play as they are the link between the

53
government and the people. NGOs can plan and implement government facilities like
demonstration centres to educate people.
Energy saving cook stoves and solar PV systems has seen some success in Kenya. According to
Abeeku RE sector needs planning, resource assessment, rebate, industry development and public
awareness programs. The institutions mandated with RE should be well staffed and resourced.
Market studies, LCA studies, policy studies will be needed. According to Abeeku primary player
in energy markets include public utilities, large energy companies, SMEs, community based
organizations, micro enterprises, consumers and energy services and product Media engagement,
active public and private sector and empowered consumers. According to Abeeku Re projects
which have failed it has occurred when projects are donor funded, pursed by research and
development institutions and focused on training alone. The writer recommends learning by
doing more it’s more effective than seminars and workshops. Political commitment is needed
together with engaged NGOs that RETs initiatives founded on industry and private enterprises.
Capacity development efforts to focus in primary players, R&D institutions to support local
industry/private sector and work more on real life projects, energy policy research institutions to
undertake studies of both successful and failed experience in RE technology and publish them.
Abeeku also notes that donor funded projects have largely been unsustainable after project
funding is exhausted and also curtailed by the absence of enabling policies and support to
stimulate technological process and market scale up. This has been the case with Turkana wind
project where the World Bank pulled out. High subsidies and donor driven programs can also
lead to end users to expect free and heavily subsidized systems undermine market. Voluntary
agreements between governments and private sector can also work for the benefit of RE as each
party will sign voluntarily.
RD&D and policies such as financial incentives/regulations can be powerful force for technology
innovation and deployment. Partnering between developed and developing nations can be
valuable driving force to have technology transfer. India 10 yr loan with low interest by PV
dealers US$20 but dealer retains ownership and provide maintenance has proven to be successful
in developing nations where people do not have much capital.
54
RE is the least cost option if all environmental and social costs are included in the comparison
option therefore incentives are justified to make RE affordable. Germany banks offered low
interest rates for RE. Spain wind power and RE fixed price to the average price saw a boost from
(50MW) in 1993 to 2700MW in 2000.
Home grown technologies with government support for example ethanol use in Brazil. This is an
indication that with support to RD by local people can be of great success. Since these
innovations will be home made the population will embrace them as their won boosting RE. This
was the case with Kenyan Jiko which was a great success. Taxing fossil fuels and using part of
tax to subsidy RE can also help reduce cost. Though this may a challenge as majority of people
use fossil fuels for example to run vehicles and some industries which could lead to
demonstrations and protests.
According to a report by IEA about Finland the energy supply was 35M tones of oil equivalent
in 2005. The emissions levels to be stabilized to 1990’s level according to Kyoto protocol. Solar
and wind energies rose from 80ktoe in 2005 to 173ktoe in 2005. The country also has a Policy to
have 40%RE by 2025. In Finland hydro has a potential of 9.7TWh more though some is in
protected areas or uneconomic to develop areas. The potential in unprotected areas is 1TWh/yr.
wind has high potential of 6TWh/yr though freezing seas makes offshore projects challenging
Hydro contributes 3% and this has attributed to the flat terrain of the country and lack of
mountains limiting unlike in Kenya where the terrain is good for hydro .In EU renewable energy
rose from 4% in 1990 to 9% in 2009 while the use of oil declined from 38% in 1990 to 37% in
2009.This is an indication that with good strategies and policies energy sector can be operated
for the better part of the nature.
Developing countries have some features that could enable them to be leaders in the transition to
a clean energy future; plenty of RE resources, energy efficient opportunities, transport, building
and high growth rates. Article 12 of Kyoto protocol provide for CDM which developing
countries can use to get money through establishing RE projects. RE can provide all the energy
needs Kenya needs as long as the government is committed to achieve energy from RE. By
providing polices and working regulatory framework RE can be of great success.
55
Challenges facing biogas production include lack of information on the benefits and potentials of
biogas technology, lack of research on emerging technologies, high upfront costs of domestic
and commercial biogas plant and equipment; a 10m3 biogas plant costs US$2800-4200( Sayigh
2011) which is expensive for farmers and even middle income people which are the majority in
the country, inadequate skilled installers, lack of post installation operation and maintenance
service for plant, equipment and appliances, lack of clear registration and regulation guidelines
for biogas installation contractors.
Policies and strategies which can be adopted are to create awareness, promote research,
introduce rebates and waivers and promote local manufactures of biogas plant and equipments,
registers technicians, zero VAT and reduce custom duty on biogas plants and equipment, training
programs, develop guidelines for registration and regulation of biogas technicians.
12 CONCLUSION
In conclusion the market barriers which are currently and are likely to continue hindering RE
unless the solutions given in this thesis are taken include poor policies and regulatory
framework, lack of R&D funding, tax reduction on fossil fuels, high costs of RE installations and
projects, long lead times of RE projects, less human resource power and lack or poor awareness
on RE potential within the population and FiT. Other market barriers include the government
over reliance on hydro power over other RE sources, over reliance on wood fuel by majority of
the population and poor involvement of private sector in the energy sector.
The solutions to deal with RE market barriers which can be used include offering tax reliefs and
subsidies to reduce on RE projects costs, having one stop shop to cater for all RE activities
including licensing and permit issuance for RE projects to reduce lead times, strengthening FiT,
setting prices for RE so that the prices are known before hand by investors, educating the public
on RE potential and benefits associated with it and having improved infrastructure like good grid
connection.

56
13 REFERENCES
1. Godfrey Boyle ,1990 Renewable energy POWER FOR SUSTAINABLE
FUTURE, ISBN 0-19-856452-x, oxford university press-UK 1990
2. Pimental David, 2008,Biofuel, Solar and wind as RE systems, ISBN: 978-1-4020-
8653-3, 2008, Springler publishers, USA, Colorado
3. Prosper B. Matondi et al, 2011 .Biofuels, land grabbing and food security in
Africa.ISBN-9781848138797 by Zed book Ltd, London
4. Muniafu, M and Otiato, E. 2010, the journal of language and entrepreneurship in
Africa, vol. 2 No. 1. ISSN 1998-1279
5. The energy act of 2006 Available at www.energy.go.ke accessed 1.12.2012
6. Kenya National Energy Policy, 2012. Available at www.energy.go.ke accessed
31.11.2012
7. R. Margolis and J. Zuboy, 2006. Nontechnical Barriers to Solar Energy use:
Review of Recent literature. Available at http://www.osti.gov/bridge 10.10.2012
8. Ricardo Farcano, 2001. Removal of barriers to the use of Renewable energy
source for rural electrification in Chile available at
http://web.ing.puc.cl/~power/paperspdf/forcano.pdf accessed 6.10.2012
9. Colter H. Kinner, 2010. The international barriers to renewable energy
development available at
http://digitool.library.colostate.edu///exlibris/dtl/d3_1/apache_media/L2V4bGlicm
lzL2R0bC9kM18xL2FwYWNoZV9tZWRpYS84NTIxMQ==.pdf accessed
6.10.2012
10. Abeeku Brew-Hammond et al, 2008. Renewable energy Technology capacity and
R&D in Africa available at
http://www.unido.org/fileadmin/media/documents/pdf/Energy_Environment/Tech
nologies__Capacity__R_D_for_scaling_un_Renewables.pdf accessed 10.10.2012
11. Feed in tariff policy on wind, biomass, small-hydro, geothermal, biogas and solar
resource generated electricity, 2008. Available at www.energy.go.ke accessed
20.10.2012
57
12. Ecorys, 2010, Assessment of non-cost barriers to renewable energy growth in EU
member states-AEON-DG TREN.NO. TREND/D1/48 available at
http://ec.europa.eu/ accessed 6.3.2013
13. Financing Renewable energy in developing countries, UNEP Report, 2012.
Available at www.unep.org accessed 10.10.2012
14. Kenya scaling up Renewable Energy Program, 2011. Available at
www.climateinvestmentfunds.org accessed 1.11.2012
15. Fred Beck, 2004. Renewable energy polices and barriers. Available at
www.martinot.info/Beck_Martinot_AP.pdf accessed 1.11.2012
16. A.A.M. Saying, 2011. Renewable energy an international journal. Available at
http://www.elsevier.com accessed 5.11.2012
17. Susanne Schwan, 2011. Overcoming barriers to rural electrification. An Analysis
of micro energy lending and its potential in the international carbon market on the
example of solar home systems in Bangladesh. Available at
http://www.universitymeetsmicrofinance.eu/site/fileadmin/planetUniversity/PDF_
UMM/Theses/Master_Thesis_-_SusanneSchwan.pdf accessed 10.11.2012
18. Veena Jha, 2009. Trade flows, barriers and market drivers in renewable energy
supply goods; the need to level the playing field. Available at
http://ictsd.org/downloads/2011/12/trade-flows-barriers-and-market-drivers-in-
renewable-energy-supply-goods.pdf accessed 10.11.2012
19. Alexandra Niez, 2010, IEA comparative study on rural electrification policies in
emerging economies available at www.iea.org accessed 1.12.2012
20. FINLAND-IEA-energy policies of IEA countries-Finland, 2007, ISBN -978-92-
6463071-8 available at www.iea.org accessed 1.12.2012
21. The steam issue 1, Dr. Silas Simiyu et al, January-march 2010, a publication of
the geothermal development company. Available at www.gdc.co.ke accessed
10.2.2013
22. Biomass energy use in Kenya, Githui Tameezan, 2010, prepared for international
institute of environment and development, available at practicalaction.or.ke
(http://pubs.iied.org/pdfs/G02985.pdf) accessed 10.2.2013
58
23. Planning policy statement 18, Renewable energy, 2009, planning and
environment policy group available at http://www.planningni.gov.uk accessed
10.2.2013
24. Kenya institute of public policy research and analysis study and analysis of
energy consumption in Kenya report, July 2010 available at www.erc.go.ke
accessed 10.12.2012
25. Partial risk guarantees project for IPPs in Kenya, may 2011 available at
www.kplc.co.ke accessed 12.11.2012
26. Inima Albert, 2009, Kenya county maps available at
http://www.flickr.com/photos/albertkenyaniinima/3757385142/in/photostream/
accessed 5.3.2013

59
14 TABLES AND APPENDIXES
Table 1.5 summaries of renewable energy policies and barriers
policies description Key barriers addressed
Renewable energy promotion polices
Price setting and
quantity forcing policies
Mandate prices to be paid
for RE/fixed amount of
shares of generation to be
renewable
High costs,unfavorable power
pricing rules, expected risks
Cost reduction polices Reduce investments costs
through subsidies, rebates,
tax relief, loans and
grants.
High costs, perceived risks
Power grid access policies Gives RE equal
treatment to access to
power grids and
transmission systems
Independent power producer
frameworks, transmission
access, interconnection
requirements.
Transport biofuels policies
Biofuels mandates Mandates specific shares
of transport fuel
consumption from
biofuels
Lack of fuel production or
delivery infrastructure
Biofuel tax policies Provides tax reliefs for High costs

60
biofuels
Emissions reduction policies
Renewable energy set
asides
Allocates, or sets
aside, a percentage of
mandated environmental
emissions reduction to be
met by RE
Environmental externalities
Emissions cap and trade Allows renewable to
receive monetary credit
for local pollutant
emission reductions
Environmental externalities
Green house gas
mitigation policies
Allows renewable to
receive monetary credit
for local pollutant
emission reductions
Environmental externalities
Power sector restructuring policies
Competitive wholesale
power markets
Allows competition in
supplying wholesale
generation to the utility
network and eliminates
wholesale pricing
restrictions
May heighten barriers of high
costs, lack of fuel prices , risk
assessment, unfavourable power
pricing rules
Self generation by end
users
Allows end users to
generate their own
electricity and either sell
surplus power back to the
Reduces barriers on
interconnection requirements,
but heighten barriers of high
capital costs, lack of fuel price
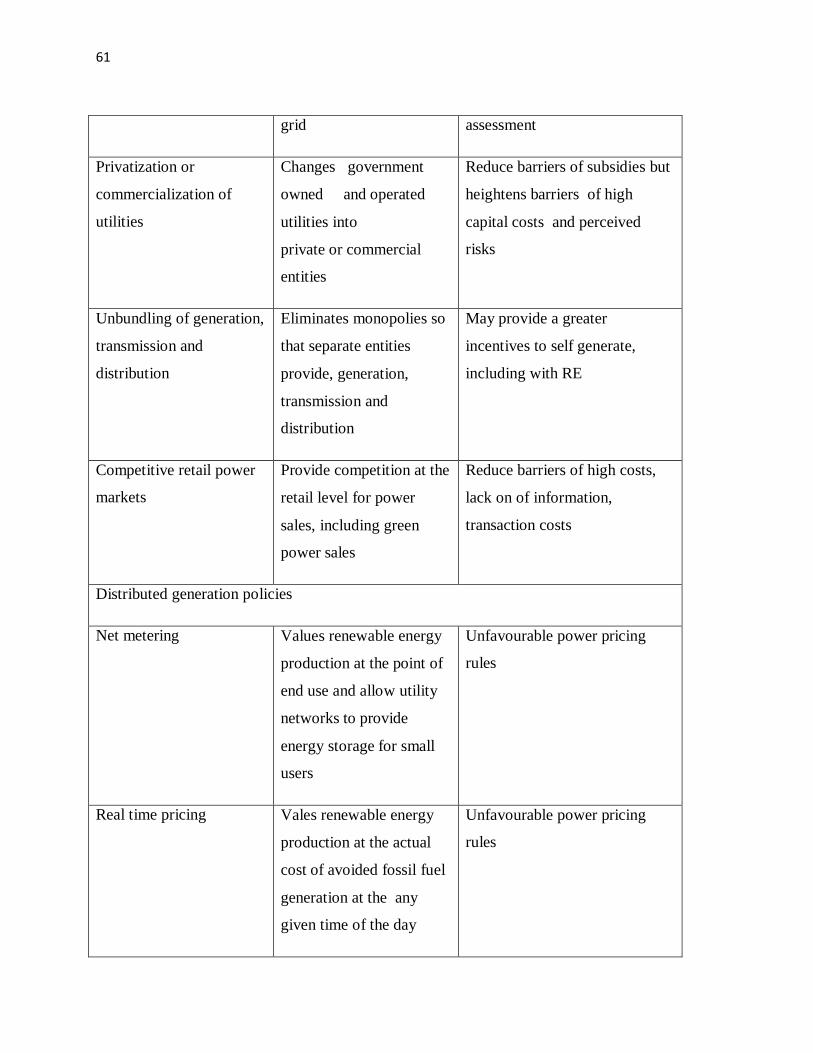
61
grid assessment
Privatization or
commercialization of
utilities
Changes government
owned and operated
utilities into
private or commercial
entities
Reduce barriers of subsidies but
heightens barriers of high
capital costs and perceived
risks
Unbundling of generation,
transmission and
distribution
Eliminates monopolies so
that separate entities
provide, generation,
transmission and
distribution
May provide a greater
incentives to self generate,
including with RE
Competitive retail power
markets
Provide competition at the
retail level for power
sales, including green
power sales
Reduce barriers of high costs,
lack on of information,
transaction costs
Distributed generation policies
Net metering Values renewable energy
production at the point of
end use and allow utility
networks to provide
energy storage for small
users
Unfavourable power pricing
rules
Real time pricing Vales renewable energy
production at the actual
cost of avoided fossil fuel
generation at the any
given time of the day
Unfavourable power pricing
rules

62
Capacity credit Provides credit of the
value of standing
renewable energy
capacity, not just energy
production
Unfavourable power pricing
rules
Interconnection regulation Creates consistent and
transparent rules, norms
and standards for
interconnection
Interconnection requirements
and transaction costs incurred
Rural electrification policies
Rural electrification
policy and energy service
concession
Makes RE part of rural
electrification policy and
planning and creates
regulated business to
serve rural customers
Subsidies for competing fuels,
lack of skills and information,
high costs, lack of access to
credit
Rural business
development and
microcredit
Supports private
entrepreneurs to provide
RE products and services
to end users and offer
consumer credit for
purchases
Lack of skills and lack of
access to credit
Comparative line
extension analyses
Analyzes the relative
costs of RE with
conventional fuels and
power delivery
Subsidies for competing fuels,
lack of information

63
Table 1.6 the barriers affecting the exploitation of renewable energy resources and the
government mitigation efforts
Barriers/affected resource mitigation
High capital cost-wind,
solar small hydro,
geothermal
Designed incentive packages to promote
private sector investments by zero rating
import duties and taxes on equipment and
accessories
Annual budget allocation
Partner with development partners
Green energy facility
Inadequate data-wind,
small
hydro,biomass,geothermal
Installation of wind masts and data loggers
Undertake feasibility studies
Renewable energy
resource distribution
relative to existing grid-
wind, geothermal
Strategic expansion of the transmission
lines taking into consideration new areas
with potentials to generate electricity
Challenges in reaching
financial closure-wind,
solar ,geothermal
Green energy facility introduction
FiT policy and periodic review
Partner with development partners to
provide guarantees to private sector
Lack of appropriate and
affordable credit and
Green energy facility introduction

64
financing mechanism-
solar, biomass
Low awareness of the
potential opportunities
and economic benefits-
solar, wind, biomass
Awareness creating though sensitization
and demonstrations
Promote planting of fast growing tree
species
Introduction of green energy facility
Lack of adherence to
system standards and poor
after sale service-solar
Development of standards by KBS and
regulation by ERC
High cost of resources
assessment and feasibility
studies-small hydro,
geothermal, wind
Undertake feasibility studies and avail the
report to potential investors
Climate change impact-
small hydro
Re-afforestation
Limited capacity for
equipment and human
resources-solar, small
hydro,biomass,geothermal
Procurement of drilling rigs
Train human resource
Encourage manufacture of equipment by
Kenyans.
High resource risk-
geothermal
GDC taking up the initial project
preparations activities which have been
deterred for geothermal development e.g.
infrastructure development and purchase
of drilling rigs.
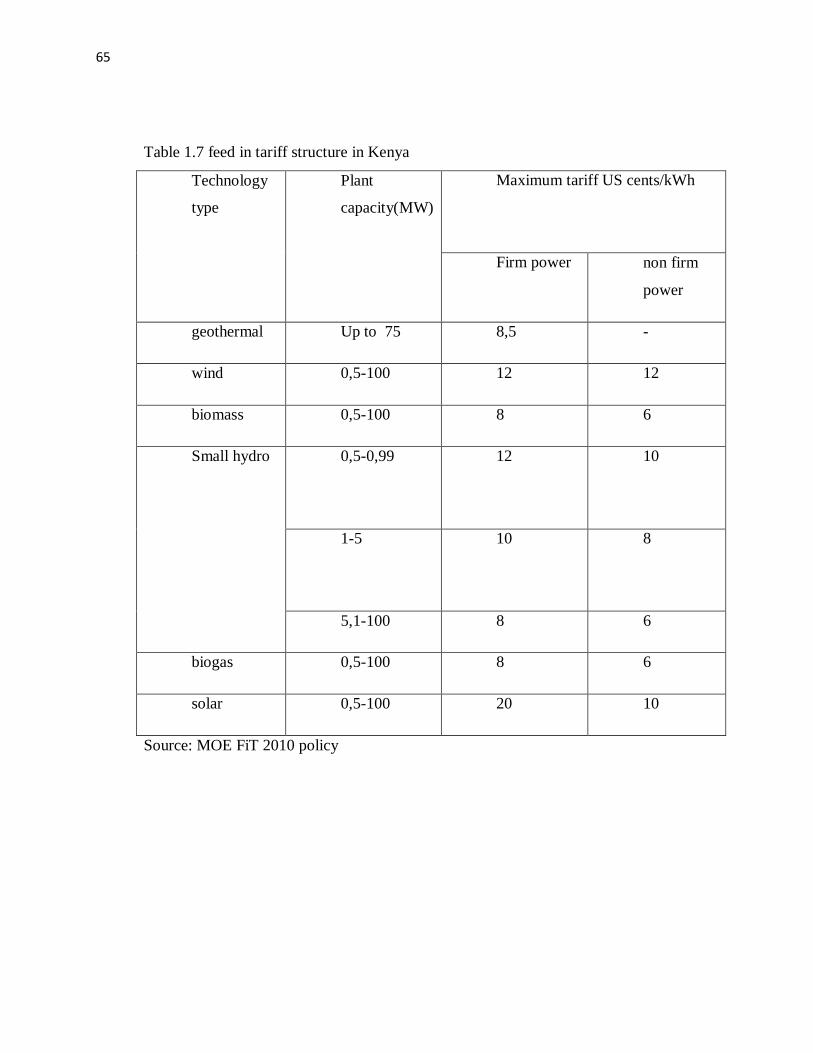
65
Table 1.7 feed in tariff structure in Kenya
Technology
type
Plant
capacity(MW)
Maximum tariff US cents/kWh
Firm power non firm
power
geothermal Up to 75 8,5 -
wind 0,5-100 12 12
biomass 0,5-100 8 6
Small hydro 0,5-0,99
12 10
1-5
10 8
5,1-100 8 6
biogas 0,5-100 8 6
solar 0,5-100 20 10
Source: MOE FiT 2010 policy

66
Table 1.8 Electric power generation sources and energy generated in FY 2012/11
Source of electric power
generation
Installed
capacity
Annual
generation
M
W
% GW
Hrs
%
Renewa
ble
energy
hydro 762 47
,8
3,427 46
,9
geotherm
al
198 12
,4
1,453 19
,9
wind 5 0,
3
18 0,
2
cogenerat
ion
38 2,
4
87 1,
2
imports 30 0,
4
total 1.0
03
63
,0
5.015 68
,7
Fossil
fuels
MSD 452 28
,4
1.976 27
,1
Gas
turbines
60 3,
8
1 0
HSD 18 1,
1
44 0,
6
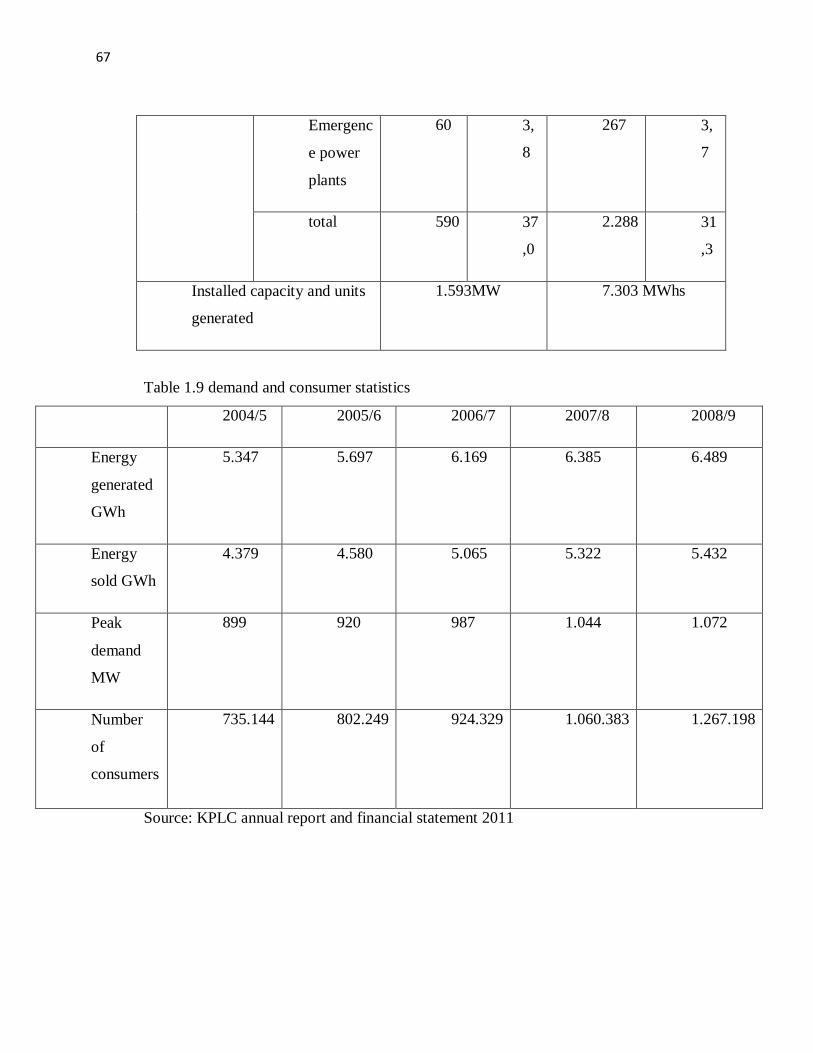
67
Emergenc
e power
plants
60 3,
8
267 3,
7
total 590 37
,0
2.288 31
,3
Installed capacity and units
generated
1.593MW 7.303 MWhs
Table 1.9 demand and consumer statistics
2004/5 2005/6 2006/7 2007/8 2008/9
Energy
generated
GWh
5.347 5.697 6.169 6.385 6.489
Energy
sold GWh
4.379 4.580 5.065 5.322 5.432
Peak
demand
MW
899 920 987 1.044 1.072
Number
of
consumers
735.144 802.249 924.329 1.060.383 1.267.198
Source: KPLC annual report and financial statement 2011
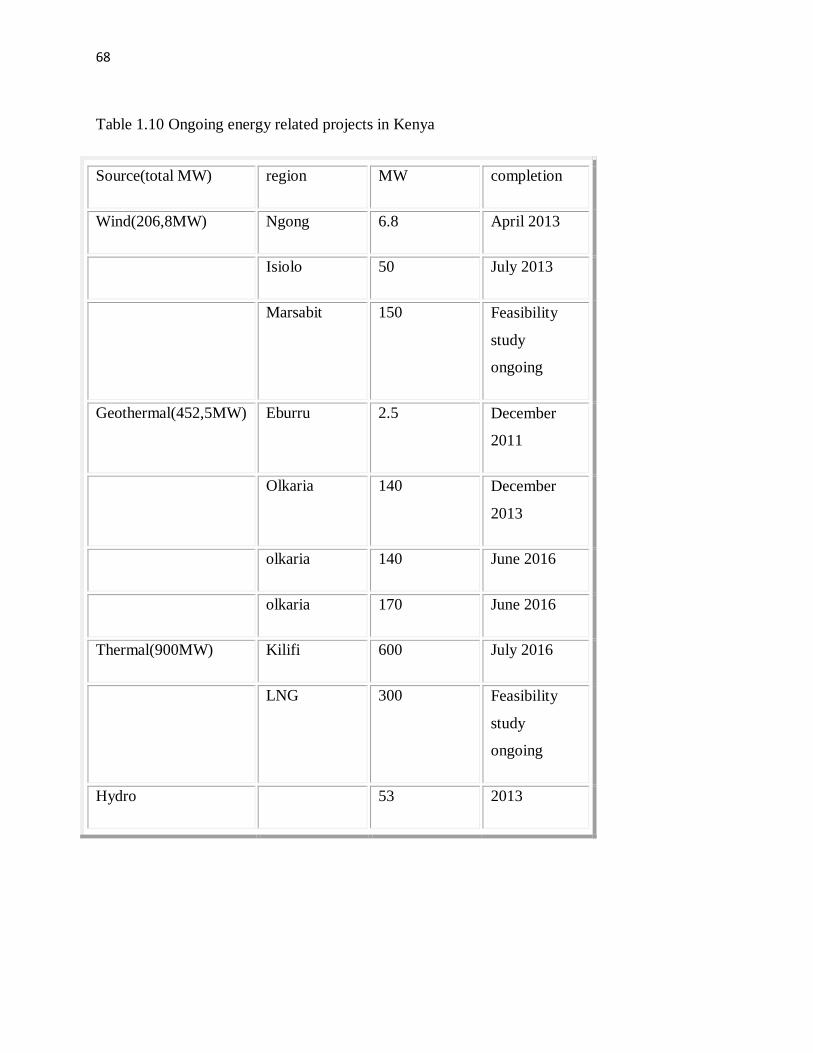
68
Table 1.10 Ongoing energy related projects in Kenya
Source(total MW) region MW completion
Wind(206,8MW) Ngong 6.8 April 2013
Isiolo 50 July 2013
Marsabit 150 Feasibility
study
ongoing
Geothermal(452,5MW) Eburru 2.5 December
2011
Olkaria 140 December
2013
olkaria 140 June 2016
olkaria 170 June 2016
Thermal(900MW) Kilifi 600 July 2016
LNG 300 Feasibility
study
ongoing
Hydro 53 2013

69
i http://www.xe.com/ucc/ accessed 21.11.12 ii www.erc.go.ke accessed 10.11.12 iiihttp://www.nation.co.ke/business/news/Power-output-up-by-10pc/-/1006/1636636/-/tom7kk/-
/index.html accessed 10.11.12 iv www.kippra.org accessed 10.11.12 v http://stat.fi/til/salatuo/2011/salatuo_2011_2012-10-16_kuv_001_en.html accessed 10.11.12 vi http://ltwp.co.ke/location/47-un-commend-kenya-plan-to-build-solar-transmission-line
accessed 2.12.12
vii
http://www.capitalfm.co.ke/business/2012/12/afdb-to-guarantee-financier-of-turkana-project/
3.12.12
viii www.energy.go.ke. accessed 10.11.12 ix
http://www.unep.org/greeneconomy/SuccessStories/FeedintariffsinKenya/tabid/29864/Default.as
px accessed 10.11.12 x www.renewableenergyworld.com/rea/u/peterK accessed 6/10/2012
xi www.christrianaid.org.uk accessed 10.11.12 xii
http://www.feem.it/userfiles/attach/201153112554262011.04.21_Sabah%20Abdulla_paper.pdf
accessed 10.11.12