identification of soil salinity and contamination by ... · using soil surface information, halite...
TRANSCRIPT

Identification of Soil salinity and Identification of Soil salinity and contamination by combined contamination by combined
remote sensing methods in Israel remote sensing methods in Israel and Uzbekistanand Uzbekistan
GoldshlegerGoldshleger N.N.,, Ben Ben DorDor E., E., LivneLivne I,. I,. BassonBasson U., U., MirlasMirlas V., V.,

MedicineMedicineUltra sound and CT is an imaging tests for imaging the Inside body :limbs their size , structure
subsurface
Catheterization
Medicine and soil science a lot of similarities between the methods


Soil salinitySoil salinity--IntroductionIntroduction
Soil salinity is common soil degradation processes, Soil salinity is common soil degradation processes, found in agricultural areas in arid and semifound in agricultural areas in arid and semi--arid arid regions.regions.
Soil salinization is a process in which dissolved salts Soil salinization is a process in which dissolved salts concentrate on the soil surface and in the upper soil concentrate on the soil surface and in the upper soil layers. layers. Salt contamination monitoring Salt contamination monitoring methods represented in this lecture will methods represented in this lecture will be used as an example for monitoring be used as an example for monitoring other contamination likeother contamination likePOPO44, , CaClCaCl, CaCo, CaCo3, 3, SOSO44

The Problem:The Problem:Soil Degradation as a result of soil Soil Degradation as a result of soil
salinizationsalinization Process Process In Arid and Semi AridIn Arid and Semi Arid zones, one of the most zones, one of the most prevalent soil degradation processes, is prevalent soil degradation processes, is soil soil salinizationsalinization..
Insufficient rainfalls forInsufficient rainfalls for water to percolate water to percolate through the soil.through the soil.
Low underground water table levelLow underground water table level
Salt accumulates in the soil profileSalt accumulates in the soil profile , ,which which degrades the soil quality.degrades the soil quality.

Flooding irrigation
4.2008 Problem

The Research Objective The Research ObjectiveThe Research Objective
To monitor and map the soil salinity of salineTo monitor and map the soil salinity of saline--affected affected soils across the soils across the JezreJezre’’elel Valley and later in Uzbekistan Valley and later in Uzbekistan ((SirSir--DaryoDaryo ) by combining remote sensing methods: ) by combining remote sensing methods: Reflectance Spectroscopy, GPR (ground penetrating Reflectance Spectroscopy, GPR (ground penetrating radar) and FDEM (frequency domain electromagnetic).radar) and FDEM (frequency domain electromagnetic).
To create a database system (GIS) for improving the To create a database system (GIS) for improving the assessment of soil salinization potential in agricultural assessment of soil salinization potential in agricultural lands.lands.
In the Later stage to built a generic model for soil In the Later stage to built a generic model for soil salinity analysis from Israel and Uzbekistansalinity analysis from Israel and Uzbekistan

Izraelvalley
SyrDaryo צ
The Research Areas

In each field, three parallel In each field, three parallel scan lines were outlined in scan lines were outlined in an approximately south to an approximately south to north direction. north direction.
The field research was The field research was donedonealong these lines. along these lines.

MethodsA. Conventional (chemical and physical)
MethodsMethodsA. Conventional (chemical and physical)A. Conventional (chemical and physical)
Tested soil samples were taken from the Tested soil samples were taken from the surface and from various depths. Our surface and from various depths. Our examination of chemical parameters examination of chemical parameters included: EC (electric conductivity); SAR included: EC (electric conductivity); SAR (Sodium absorptions ratio); (Sodium absorptions ratio); ClCl, Mg, SO4, , Mg, SO4, Na, CaNa, Ca..Sampled observation wells were sampled Sampled observation wells were sampled in order to in order to monitor the changes in the monitor the changes in the underground water levels and water underground water levels and water chemistry. chemistry. MeasuredMeasured the moisture weight using the the moisture weight using the gravimetric system in an ovengravimetric system in an oven ..
Correlation

Methodsb. Modern research methodologies
MethodsMethodsb. Modern research methodologiesb. Modern research methodologies
Combination of Remote Sensing tools for identification and mappiCombination of Remote Sensing tools for identification and mapping ng of saline areas:of saline areas:
and Imagingand Imaging Air PhotoAir Photo
ASD spectrometer (Hyper Spectroscopy) ASD spectrometer (Hyper Spectroscopy)
GPR (ground penetration radar)GPR (ground penetration radar)
FDEM (frequency domain electroFDEM (frequency domain electro--magnetic)magnetic)
Correlation of FDEM data acquisition from air (2Correlation of FDEM data acquisition from air (2--3m) by Balloon3m) by Balloonand from surfaceand from surface
Using hyper spectral air borne sensor (AISA)Using hyper spectral air borne sensor (AISA)
Hyperion HPR Sensor (in the near future)

definition: receiving continuous spectrum from a given cell area with chemical and physical meaning .
CO3
OH
NH4
Fe
Particle Size
hyperspctral :definition and aim.
Spectral methods: unique identification of material
characterization and quantities in space

Spectral Characteristics of VegetationSpectral Characteristics of Vegetation
0.4 0.6 0.8 1.0 1.2 1.4 1.6 1.8 2.0 2.2 2.4
0
20
40
60
80
100
% re
flect
ance
rela
tive
to h
alon
wavelength in microns
H2O-absorption
chlorophyll-carotenoid-absorption
leafpigments
cellstructure
watercontent
a) healthy (green)b)c) stressedd)e) dry (brown)
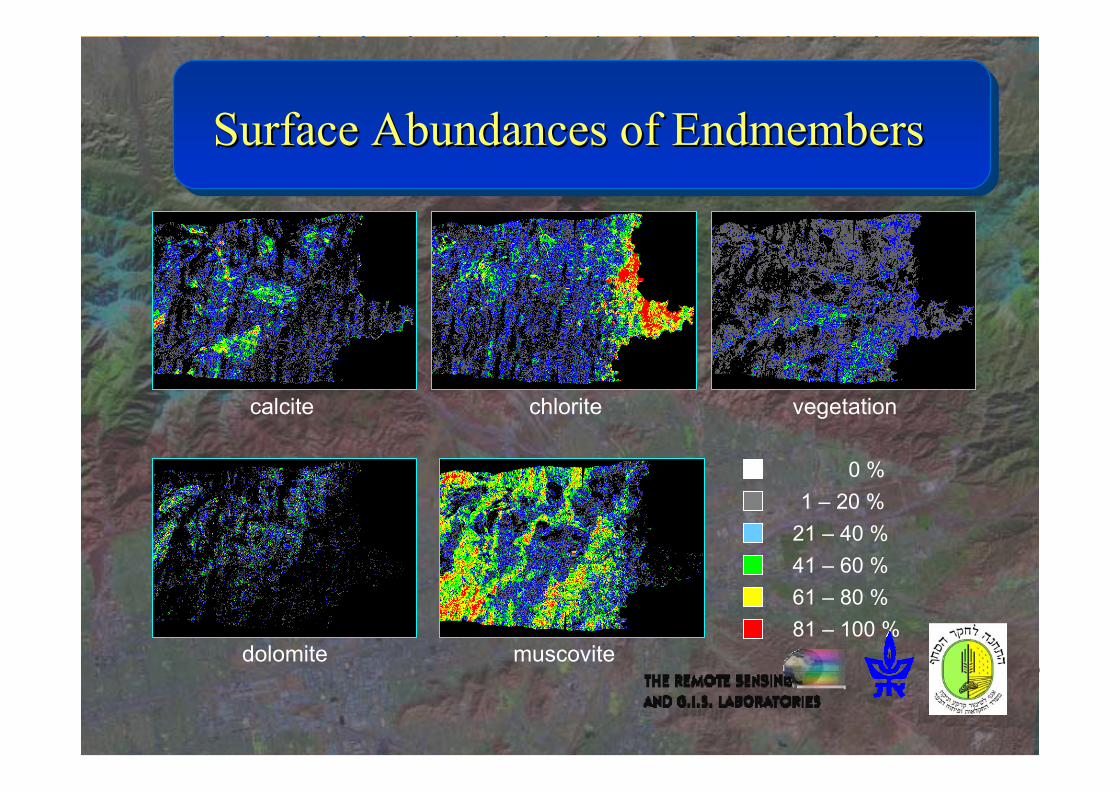
Surface Abundances of EndmembersSurface Abundances of Endmembers
calcite
muscovitedolomite
vegetationchlorite
0 %1 – 20 %
21 – 40 %41 – 60 %61 – 80 %81 – 100 %

Spectral Methods Using Spectral Methods Using ASD Field spectrometerASD Field spectrometer
The sensor is sensitive The sensor is sensitive to electromagnetic to electromagnetic radiation between radiation between 0.40.4 toto 2.52.5 μμmm . .
Each sample point is Each sample point is tested by spectral and tested by spectral and laboratory laboratory measurement, for measurement, for comparison and comparison and calibration. calibration.
Hyper SpectroscopyHyper Spectroscopy

15 cm
Fiber optic
95 cm
Mirror at 45÷ angleASD
Halogen Lamp
Stabilizer bar
Telescopic bar
9 cm
Handle bar
Fiber Holder
(0.8cm φ )
Lamp holder
(1.2 cm φ)
Handle bar
ab
The 3S-HED assembly: parts and way of operation
CatherizationBen-Dor et al., 2008).

The calibration and The calibration and spatial repair of the spatial repair of the data, provide a data, provide a visual cross section visual cross section of the soil layers at of the soil layers at different depths.different depths.
GPR GPR
GPR (Ground Penetration Radar) Transmits radar pulses into the ground; and receives wave signals reflected off of the interfaces below.
Resolution m Depth m Frequencies MHz
0.6 7-15 100 0.4 3-9 250
0.3 2-5 500
0.2 1-2 1000

FDEM Scanning FDEM Scanning FDEM Scanning
Conductivity, Conductivity, resistivity, resistivity, magnetic magnetic susceptibility. susceptibility. frequency sounding frequency sounding measurements measurements were acquired by were acquired by using a GEMusing a GEM--2 2 FDEM (frequency FDEM (frequency domain electrodomain electro--magnetic) magnetic) instrument several instrument several
FDEM96 Hz - 96 kHz

AISAAISA--ESES in Israel
Spectral Bands between 401-2372nm (FWHM 3.3-6.84nm)
FOV 9o, IFOV 0.525 mRad
IMOD-INTA meeting October 18, 2004 Madrid

Comparison of our spectrum data to the laboratory spectrum data for Gypsum
Comparison of our spectrum data to the Comparison of our spectrum data to the laboratory spectrum data for Gypsumlaboratory spectrum data for Gypsum
1450nm
1480nm1550nm 1750nm
2200nm
1950nm
Important absorption in relation to air-bone sensor
Halite Spectrum

Surface Gypsum Correlated with surface EC
y = 0.3483x - 0.8084R2 = 0.9014
0
10
20
30
40
50
60
70
80
90
0 20 40 60 80 100 120 140 160 180 200 220 240
Surface CaSo4 (mgr/l)
Surfa
ce E
C (d
s/m
)
Surface Gypsum Correlated with 60 cm depth EC
y = 0.3568x - 1.98R2 = 0.9566
0102030405060708090
0 50 100 150 200 250
Surface CaSO4 (mgr/l)
60 c
m d
epth
EC
(ds/
m)
Correlation between Gypsum and EC Correlation between Gypsum and ECCorrelation between Gypsum and EC

GIS mapping of soil salinity based on spectroscopic data at Genigar field.
The soil surface (A) and 60 cm below soil surface (B).
GIS mapping of soil salinity based on spectroscopic data at GIS mapping of soil salinity based on spectroscopic data at GenigarGenigar field. field.
The soil surface (A) The soil surface (A) and 60 cm below soil surface (B).and 60 cm below soil surface (B).kriging
A B

Spectral changes along the scanning line In Genigar field
Spectral changes along the Spectral changes along the scanning line In scanning line In GenigarGenigar fieldfield
מט רים 15
Genigar field
Sampling point
15 m
Shift

The use of an air-photo from 1962, and of GPR, for characterization of the buried layer.
The use of an airThe use of an air--photo from 1962, and of photo from 1962, and of GPR, for characterization of the buried layer.GPR, for characterization of the buried layer.
Eastern scan line
Lateral changes in the soil layer, point to the existence of a buried layer .

The use of GPR The use of GPR
drains
Drawdown of the Groundwater level
Groundwater level
Mizra

EC variation mapsEC variation mapsEC variation maps
EC variations at a certain frequencies. The following (Hz) EC variations at a certain frequencies. The following (Hz) 3,025; 6,025; 12,025; 24,025 and 47,975, with corresponding 3,025; 6,025; 12,025; 24,025 and 47,975, with corresponding estimated integral depths (m, estimated integral depths (m, ±±25%) of 10, 5, 2.5, 1.25 and 25%) of 10, 5, 2.5, 1.25 and 0.65 respectively0.65 respectively
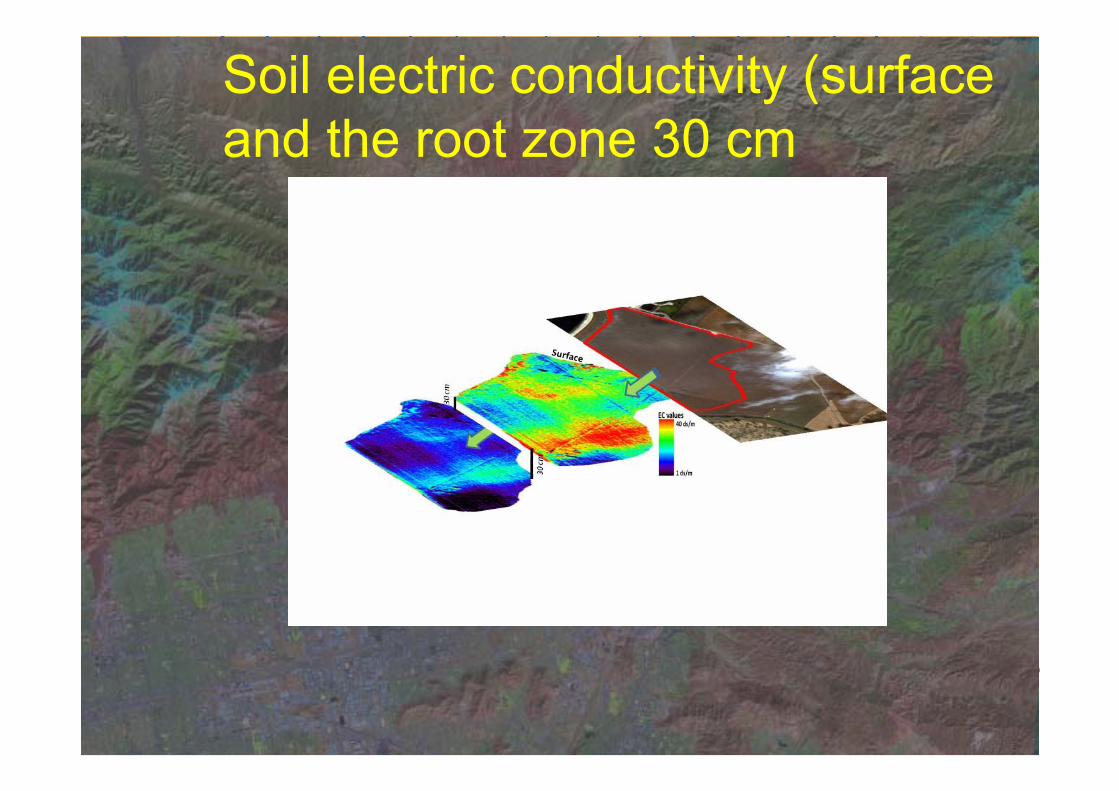
Soil electric conductivity (surface and the root zone 30 cm

487650 487700 487750 487800 487850 487900 487950 488000 4880504471500
4471550
4471600
4471650
4471700
4471750
4471800
4471850
4471900
4471950
050100150200250300350400450500550600650700750800850900950
environmental engineering geophysics
www.geo-sense.com
Area 1, EC @ 3,025 Hz

487650 487700 487750 487800 487850 487900 487950 488000 4880504471500
4471550
4471600
4471650
4471700
4471750
4471800
4471850
4471900
4471950
050100150200250300350400450500550600650700750800850900950
environmental engineering geophysics
www.geo-sense.com
Area 1, EC @ 93,025 Hz

FDEMFDEM

ResultsResultsResults
Spectroscopy is a sensitive field method that can be used to Spectroscopy is a sensitive field method that can be used to locate salinelocate saline--affected areas. We can used salt contamination affected areas. We can used salt contamination monitoring methods represented in this lecture as an example monitoring methods represented in this lecture as an example for monitoring other contamination for monitoring other contamination
Using soil surface information, Halite and Gypsum correlations Using soil surface information, Halite and Gypsum correlations can help in the assessment of salinity, to a depth of 60 cm.can help in the assessment of salinity, to a depth of 60 cm.
The GPR system can be used to map the subsurface regional The GPR system can be used to map the subsurface regional structure, and to point out anomalies which could indicate structure, and to point out anomalies which could indicate saline problems. These anomalies warrant further saline problems. These anomalies warrant further investigation.investigation.
The FDEM results doveThe FDEM results dove--tailed with the multitailed with the multi--sensor approach, sensor approach, for precise detection and mapping of soil salinity within similafor precise detection and mapping of soil salinity within similar r areas.areas.

ResultsResultsResults
A geoA geo--referenced database of soil salinity changes, enables referenced database of soil salinity changes, enables mapping and prediction of the salinization process. This mapping and prediction of the salinization process. This enables optimal management of soil degradation, especially enables optimal management of soil degradation, especially as it relates to the salinization process.as it relates to the salinization process.
It can be clearly seen (Uzbekistan results) that the soil It can be clearly seen (Uzbekistan results) that the soil salinity property can be effectively predicted from the salinity property can be effectively predicted from the reflectance information across specific wavelengths reflectance information across specific wavelengths (1750nm, 1940nm, and 1980nm).(1750nm, 1940nm, and 1980nm).
In the near future, we will be using hyperIn the near future, we will be using hyper-- spectral spectral imagery to indicate the severity of soil salinity. This will be imagery to indicate the severity of soil salinity. This will be accomplished by comparing the airborne and satellite accomplished by comparing the airborne and satellite images with fieldimages with field--collected spectral data. collected spectral data.

HyperSpectralHyperSpectral Identification OfIdentification OfFuel Contamination In SoilFuel Contamination In Soil

Contamination OriginsContamination Origins
In a society with an increasing In a society with an increasing demand for fuel, storing has become demand for fuel, storing has become an issue.an issue.When using old storage facilities When using old storage facilities either above or underground, time as either above or underground, time as well as poor handling has an well as poor handling has an immense impact on the containers immense impact on the containers which leads to inevitablewhich leads to inevitable leaks.leaks.

Contamination OriginsContamination Origins
Jet A Fuel – AirportHydraulic Oil - Metals Fabricator
Waste Oil - Concrete Plant Underground Rusted Tanks
DamageDamage
Contamination of Hydrocarbon in Contamination of Hydrocarbon in the ground caused environmental the ground caused environmental acute pressure acute pressure : : Pollution of sources Pollution of sources of bottom surface waterof bottom surface water. . Damage to Damage to ground ground ( ( agriculture agriculture ). ). Medical Medical damage damage ( ( BenzenBenzen, one of the , one of the components of the fuel causes the components of the fuel causes the
cancer of the bloodcancer of the blood.( .(

The ProblemThe Problem
While remedying a contaminated soil or While remedying a contaminated soil or monitoring potential areas of monitoring potential areas of contamination, many expensive and contamination, many expensive and complicated TPH (total Petroleum complicated TPH (total Petroleum hydrocarbon) measurements are needed.hydrocarbon) measurements are needed.These lab measurements are done by These lab measurements are done by experts, at a lab environment in a lengthy experts, at a lab environment in a lengthy and expensive process (100$ per sample) and expensive process (100$ per sample)

Suggested SolutionSuggested Solution
Generating a spectral model using Generating a spectral model using NIRS technology may be a tool to NIRS technology may be a tool to measure TPH measure TPH In SituIn Situ at a minimal at a minimal cost, by inexperienced personal. cost, by inexperienced personal. We propose to develop the We propose to develop the methodology in which submethodology in which sub--surface surface soil areas will be monitored by NIRS soil areas will be monitored by NIRS and and ““endoscopicendoscopic”” assembly assembly

MethodologyMethodology
Collection of fuel contaminated soil Collection of fuel contaminated soil samples from all of Israel, along side samples from all of Israel, along side with TPH lab tests.with TPH lab tests.measuring these samples with the measuring these samples with the ASD spectrometer and creating a ASD spectrometer and creating a mathematic prediction model.mathematic prediction model.Upgrade the 3SUpgrade the 3S--HeD sensor for subHeD sensor for sub--surface measurement of TPH surface measurement of TPH

Primary ResultsPrimary Results
Future ApplicationsFuture Applications
Creating a monitoring and analyzing Creating a monitoring and analyzing automatic equipment for analyzing automatic equipment for analyzing samples at the field with a simple samples at the field with a simple interface for inexperience personal.interface for inexperience personal.Expanding the model to determine Expanding the model to determine fuel type and quality.fuel type and quality.Coupling the model with 3SCoupling the model with 3S--HeD HeD sensorsensor
