interactive effects of salinity and n on … an-nuum. l.) salt tolerance based on water uptake...
TRANSCRIPT
Journal of Plant Nutrition, 37:595–610, 2014Copyright C© Taylor & Francis Group, LLCISSN: 0190-4167 print / 1532-4087 onlineDOI: 10.1080/01904167.2013.867985
INTERACTIVE EFFECTS OF SALINITY AND N ON PEPPER
(CAPSICUM ANNUUM L.) YIELD, WATER USE EFFICIENCY
AND ROOT ZONE AND DRAINAGE SALINITY
G. Duygu Semiz,1 Donald L. Suarez,2 Ali Unlukara,3 and Engin Yurtseven1
1Department of Farm Structures and Irrigation, Agricultural Faculty, Ankara University,Turkey2USDA-ARS, U.S. Salinity Laboratory, Riverside, California3Department of Biosystem Engineering, Agricultural Faculty, Erciyes University, Kayseri,Turkey
� The aim of this study was to determine the salt tolerance of pepper (Capsicum annuum L.)under greenhouse conditions and to examine the interactive effects of salinity and nitrogen (N)fertilizer levels on yield. The present study shows the effects of optimal and suboptimal N fertilizerlevels (270 kg ha−1 and 135 kg ha−1) in combination with five different irrigation waters of varyingelectrical conductivity (EC) (ECiw = 0.25, 1.0, 1.5, 2.0, 4.0, and 6.0 dS m−1) and three replicatesper treatment. At optimal N level, yield decreased when the irrigation water salinity was above ECiw
2 dS m−1. At the suboptimal N level, a significant decrease in yield occurred only above ECiw 4 dSm−1. At high salinity levels the salinity stress was dominant with respect to yield and response wassimilar for both N levels. Based on the results it can also be concluded that under saline conditions(higher than threshold salinity for a given crop) there is a lesser need for N fertilization relative tothe optimal levels established in the absence of other significant stresses.
Keywords: irrigation, water quality, soil salinity, pepper (Capsicum annuum L.), nitrogenfertilization, yield
INTRODUCTION
One of the most important inputs for agricultural production underarid climates is irrigation water. Increasing urban water demands in arid
Received 24 May 2011; accepted 2 January 2012.Address correspondence to G. Duygu Semiz, Department of Farm Structures and Irrigation, Agri-
cultural Faculty, Ankara University, Ziraat Fakultesi, Tarımsal Yapılar ve Sulama Bolumu, 06190 Ankara,Turkey. Email: [email protected]
Color versions of one or more of the figures in the article can be found online at www.tandfonline.com/lpla.
595
Dow
nloa
ded
by [
Uni
vers
ity o
f C
alif
orni
a, R
iver
side
Lib
rari
es],
[Pa
tric
ia G
onza
lez]
at 1
5:08
09
June
201
5
596 G. D. Semiz et al.
regions, due in part to increasing population, makes high quality waterless available for irrigation (Suarez, 2001). Competitive demand for wateramong urban, industrial, and agricultural sectors leads researchers to focuson using marginal waters for agricultural production. Alternative culturaltechniques are being developed to reduce the adverse effects of salinity oncrop production, such as breeding salinity resistant plants (Yang et al., 2005;Zhu et al., 2000; Singla-Pareek et al., 2003), utilizing grafting techniques onvegetables (Estan et al., 2005; Santa-Cruz et al., 2002; Edelstein et al., 2005),applying growth regulators (Abd El-Samad Hamdi et al., 2004; Abrahamet al., 2003; Sakamoto and Murata, 2001), and controlling soil salinity bymore uniform applications of water.
There are numerous studies on the salt tolerance of pepper but the man-ner in which the experiments were conducted makes comparisons difficult.Bernstein and Pearson (1954) in a solution culture study reported that yieldreduction of pepper occurred at a saturation extract electrical conductivity(ECe) value of 3 dS m−1, with the values calculated from the solution compo-sition and an assumed fixed relation between ECe and solution EC. Forges(1970) reported a yield decline for ECe above 2 dS m−1 and Fernandez et al.(1977) at a calculated EC of 1.3–2.9, depending on variety, however onlysodium chloride (NaCl) was added to the salinizing solution, the treatmentswere not replicated, and the ECe was reported based on measurement of ECin 1:5 extract taken from the top 25 cm of soil.
Akas et al. (2006) reported genotypic variation in the salt accumulationand leaf damage of peppers growth in 150 mM NaCl for 10 d, suggestingthat yield differences would likely occur as well. In a hydroponic study witha control EC of 2 dS m−1, Navarro et al. (2002) found reduced yield withaddition of salt at the first salt addition level (3 dS m−1) and with losses be-ing greater with addition of NaCl as compared to sodium sulfate (Na2SO4)salts. Using a generalized relation of solution to saturation extract, thesestudies suggest that yield declines when the EC of the saturation extractis less than 1.5 dS m−1. Similarly, Chartzoulakis and Klapaki (2000) ob-tained an intercept of EC = 1.8 dS m−1 in solution using the Maas andHoffman model (1977) in an experiment with two varieties of pepper in agreenhouse sand culture experiment with addition of NaCl salts. Convertingthese data to saturation extract values would result in an intercept of ECe =0.9 dS m−1.
These published data sets are almost always with NaCl salts and wereeither solution culture or soil data reported for average root zone salin-ity. Information is lacking on the response of pepper yield to a mixed saltsolution, mimicking natural systems, as well as determination of salinity ina soil system with response to salinity of the soil water weighted for plantwater uptake (rather than average soil root zone salinity or irrigation watersalinity).
Dow
nloa
ded
by [
Uni
vers
ity o
f C
alif
orni
a, R
iver
side
Lib
rari
es],
[Pa
tric
ia G
onza
lez]
at 1
5:08
09
June
201
5
Mutual Stress: Salinity and Nitrogen 597
There is an extensive number of plant nutrition studies from all over theworld, but the studies were mostly conducted to determine best managementpractices under non-saline conditions. Some studies have been conductedto determine if certain nutrients have alleviative effects on salinity tolerance(Bernstein et al., 1974; Kafkafi et al., 1982; El-Sidding and Ludders, 1994).Some studies indicated a positive effect of fertility on salt tolerance whilesome reported that there was no alleviative effect on salt tolerance. Evenstudies of the grain crops have resulted in opposite conclusions. Solimanet al. (1994) reported that in saline soil, nitrogen (N) and phosphorus (P)have a positive effect on growth of wheat. However, in another similar study,Esmaili et al. (2008) did not find any positive effects of these two fertilizerson sorghum. Gomez et al. (1996) found a positive yield response for pepperat all three salinity levels by increasing nutrient N from 2 to 15 mM in asolution culture. However the effect of N on relative yield was not clear. Thefirst salinity level above the control (25 mM NaCl) had a lower relative yieldat lower N and with subsequent increases in salinity it had a higher relativeyield.
Most salinity-fertilizer studies were conducted in soils that have insuf-ficient nutrition (Grattan and Grieve, 1999). Inadequate N is often thegrowth-limiting nutritional stress factor in field soils. Consequently, addi-tion of N usually improves plant growth and yield regardless of whether thecrop is salt-stressed or not (Grattan and Grieve, 1999). Hence a positive yieldresponse to addition of N to saline soils need not indicate an ameliorativeresponse of N to salinity.
The relations between salinity and mineral nutrition are extremely com-plex and not well understood. Several studies on salinity and N nutritionaimed at clarifying these relationships have been conducted using sand orsolution cultures which are simpler to interpret than soil salt systems (Irshadet al., 2002).
The objectives of this study are to; 1) Determine pepper (Capsicum an-nuum L.) salt tolerance based on water uptake weighted soil salinity data(rather than on irrigation water salinity or average soil salinity), 2) Evaluatethe response of pepper to optimal and a reduced, suboptimal N fertilizerlevel under increasing saline conditions and 3) Examine the water use effi-ciency of pepper as related to salt stress. We examine the effect of salinityand N on mineral content, fruit yield, biomass production, ion compositionin the plant, water consumption, and water use efficiency.
MATERIALS AND METHODS
Containers were filled with 9 kg of air-dried and sieved (4 mm) soil. Theexperimental soils were obtained from the fields of the Agricultural ResearchStation of Ankara University. The soil texture is as follows; 47.3% sand, 17.5%
Dow
nloa
ded
by [
Uni
vers
ity o
f C
alif
orni
a, R
iver
side
Lib
rari
es],
[Pa
tric
ia G
onza
lez]
at 1
5:08
09
June
201
5
598 G. D. Semiz et al.
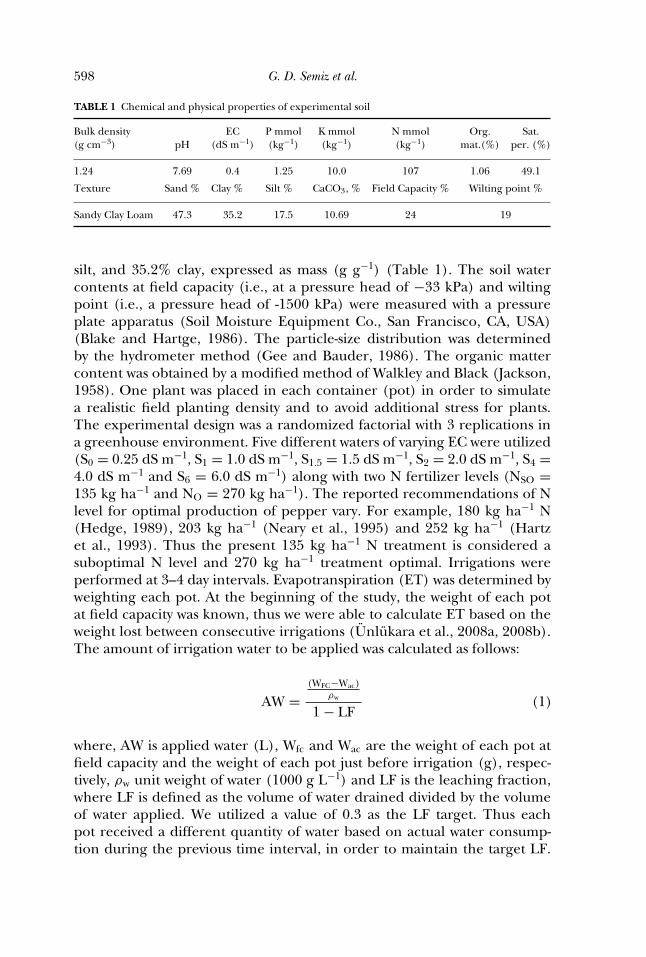
TABLE 1 Chemical and physical properties of experimental soil
Bulk density EC P mmol K mmol N mmol Org. Sat.(g cm−3) pH (dS m−1) (kg−1) (kg−1) (kg−1) mat.(%) per. (%)
1.24 7.69 0.4 1.25 10.0 107 1.06 49.1
Texture Sand % Clay % Silt % CaCO3, % Field Capacity % Wilting point %
Sandy Clay Loam 47.3 35.2 17.5 10.69 24 19
silt, and 35.2% clay, expressed as mass (g g−1) (Table 1). The soil watercontents at field capacity (i.e., at a pressure head of −33 kPa) and wiltingpoint (i.e., a pressure head of -1500 kPa) were measured with a pressureplate apparatus (Soil Moisture Equipment Co., San Francisco, CA, USA)(Blake and Hartge, 1986). The particle-size distribution was determinedby the hydrometer method (Gee and Bauder, 1986). The organic mattercontent was obtained by a modified method of Walkley and Black (Jackson,1958). One plant was placed in each container (pot) in order to simulatea realistic field planting density and to avoid additional stress for plants.The experimental design was a randomized factorial with 3 replications ina greenhouse environment. Five different waters of varying EC were utilized(S0 = 0.25 dS m−1, S1 = 1.0 dS m−1, S1.5 = 1.5 dS m−1, S2 = 2.0 dS m−1, S4 =4.0 dS m−1 and S6 = 6.0 dS m−1) along with two N fertilizer levels (NSO =135 kg ha−1 and NO = 270 kg ha−1). The reported recommendations of Nlevel for optimal production of pepper vary. For example, 180 kg ha−1 N(Hedge, 1989), 203 kg ha−1 (Neary et al., 1995) and 252 kg ha−1 (Hartzet al., 1993). Thus the present 135 kg ha−1 N treatment is considered asuboptimal N level and 270 kg ha−1 treatment optimal. Irrigations wereperformed at 3–4 day intervals. Evapotranspiration (ET) was determined byweighting each pot. At the beginning of the study, the weight of each potat field capacity was known, thus we were able to calculate ET based on theweight lost between consecutive irrigations (Unlukara et al., 2008a, 2008b).The amount of irrigation water to be applied was calculated as follows:
AW =(WFC−Wac)
ρw
1 − LF(1)
where, AW is applied water (L), Wfc and Wac are the weight of each pot atfield capacity and the weight of each pot just before irrigation (g), respec-tively, ρw unit weight of water (1000 g L−1) and LF is the leaching fraction,where LF is defined as the volume of water drained divided by the volumeof water applied. We utilized a value of 0.3 as the LF target. Thus eachpot received a different quantity of water based on actual water consump-tion during the previous time interval, in order to maintain the target LF.
Dow
nloa
ded
by [
Uni
vers
ity o
f C
alif
orni
a, R
iver
side
Lib
rari
es],
[Pa
tric
ia G
onza
lez]
at 1
5:08
09
June
201
5
Mutual Stress: Salinity and Nitrogen 599
Previous studies have demonstrated that the actual ET (ETa) is dependenton salinity (Yurtseven et al. 2005, Unlukara et al. 2008a, 2008b). Irrigationswere performed manually. Drainage waters were collected for measurementof volume and electrical conductivity (ECd).
Urea, potassium nitrate (KNO3)(75 kg ha−1), and triple-super-phosphate(37.5 kg ha−1) were applied to each pot. The N source from the KNO3 wastaken into consideration and applied urea N levels were adjusted accord-ingly. Consequently, N application consisted of 0.73 g pot−1 KNO3 and0.88 g pot−1 urea for 135 kg ha−1 (NSO) treatment and 0.73 g pot−1 KNO3
and 1.76 g pot−1 urea for 270 kg ha−1 (NO) treatment. Saline waters wereprepared by mixing calcium chloride (CaCl2) + NaCl with Ankara munic-ipal tap water such that calcium (Ca) = magnesium (Mg) on a mmolc L−1
basis. The sodium adsorption ratio {SAR; defined as Na/[(Ca + Mg)/2)]0.5
where concentrations are expressed in mmolc L−1} values of all treatmentswere less than 1.0. Irrigation waters were stored in 220 L containers. The‘Bagcı Carliston’ cultivar of pepper plant was used in this study. This is themost common pepper cultivar and is widely consumed as a fresh vegetablein Turkey.
At the end of the experiment fruit yield (fresh weight), total biomass andETa (actual ET) were measured and recorded and leaves analyzed for ashpercent, potassium (K), sodium (Na), chloride (Cl), Ca and Mg content.The ECe, the EC of the saturated extract (U.S. Salinity Laboratory Staff,1954) of the container soils, ECd the EC of the drainage water, and volumeof the drainage water were also determined.
Dry (oven-dried at 70◦C) weights were measured for harvested fruits.The dried fruit samples from each container were ground in a mill witha 0.5-mm sieve and then analyzed for mineral content. At the end of theexperiment, the plants were cut at 1 cm above the soil surface. Vegetativefresh and dry weights (oven-dried at 70◦C to a constant weight) were obtainedfor each replication. Soil samples taken from each pot were air dried andcrushed to pass through a 2-mm screen. Saturated soil pastes were prepared,equilibrated in the laboratory for 24 hours, and then saturation extracts weretaken and ECe measured. The EC of the drainage water was measured assoon as the drainage flow under the containers ceased.
To determine leaf ion composition, undamaged leaves were collected atharvest. These samples were washed first with tap water and then deionizedwater, then oven dried at 60◦C and ground. The 0.500 g ground sampleswere ashed by heating in a muffle furnace at 500◦C for 5 h, then dissolvedin 5 mL of 2 M nitric acid (HNO3), and finally diluted to 25 mL withdeionized water (Kacar and Inal, 2008). Extracts were filtered and storedin plastic containers until analyzed. Potassium and Na were analyzed byflame photometry, Ca and Mg by ethylenediaminetetraacetic acid (EDTA)titration, and Cl by silver nitrate (AgNO3) titration (US Salinity LaboratoryStaff, 1954). Statistical analyses of the results were carried out with SPSS 9.05
Dow
nloa
ded
by [
Uni
vers
ity o
f C
alif
orni
a, R
iver
side
Lib
rari
es],
[Pa
tric
ia G
onza
lez]
at 1
5:08
09
June
201
5
600 G. D. Semiz et al.
(IBM, Armonk, NY, USA). One way analysis of variance (ANOVA) test forvariance analyses and Duncan Multiple Range Test for testing of the means(Duncan, 1955).
RESULTS
Soil Water Salinity and Drainage Water
Plants respond to the salinity of the water taken up by the plant ratherthan irrigation water salinity. The soil water salinity depends on the irrigationwater volume and salinity, volume of rain, and crop water uptake. Calculationof the soil water salinity is thus most relevant to plant response to salinity andsalt tolerance data should be reported in these terms rather than irrigationwater salinity.
Soil salinity has been reported in different ways with various assumptions.The method proposed by Ayers and Westcot (1985) to calculate soil watersalinity consists of dividing the root zone into quarters and calculating thewater composition at the bottom of each quarter from the irrigation water ECand a concentration factor based on the overall leaching fraction (assumingthat the water uptake in the 4 quarters is 0.4, 0.3, 0.2, and 0.1, respectively,with depth) This method then utilizes the average of the estimated salinityin the 4 quarters to calculate an average root zone salinity, and assumes thatplants respond to the average root zone salinity.
The Ayers and Westcot (1985) method is considered to overestimatesalinity experienced by the plant since it considers average root zone salin-ity rather than the salinity of the water taken by the plant, and does notconsider the change in ET with increasing salinity (Suarez, 2010). Alterna-tively, it can be considered that the plant responds to the salinity of thewater extracted from the soil rather than average soil water salinity, so thesoil salinity can be weighed according to the corresponding water uptakefactors.
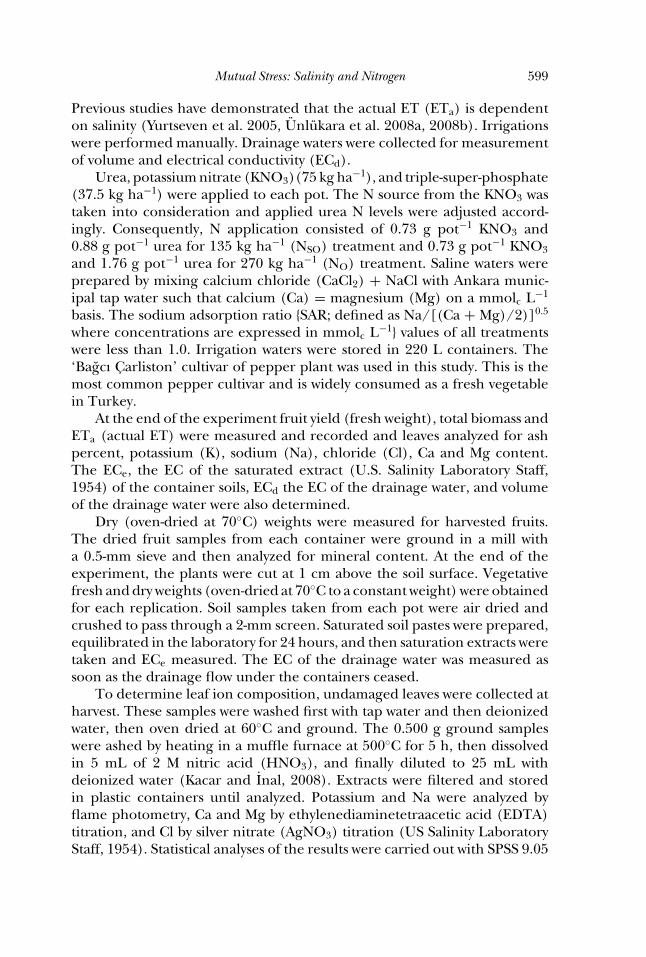
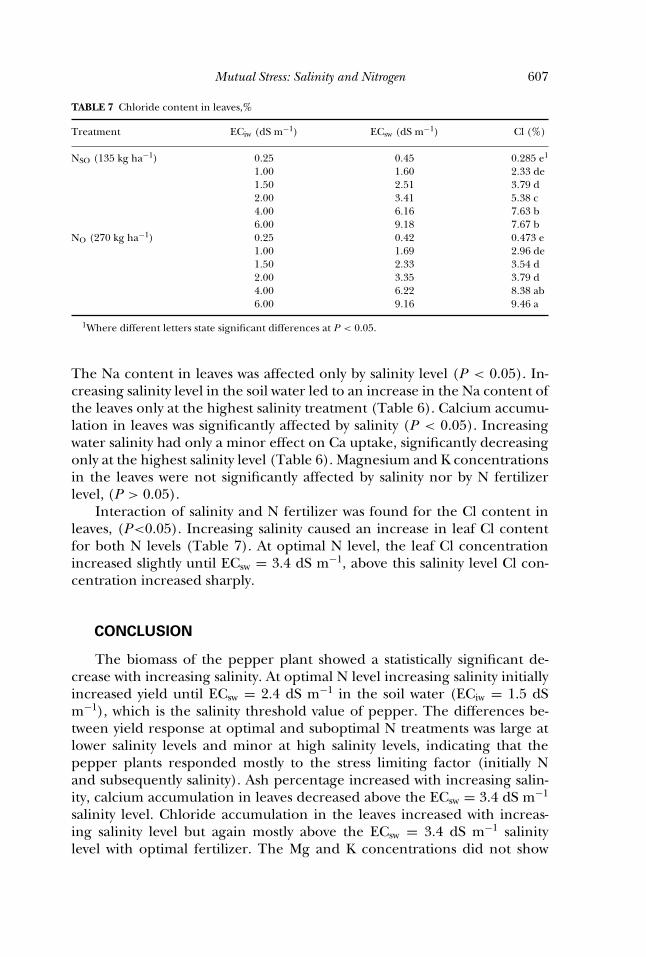
Figure 1 shows the EC of the soil water (ECsw), average EC of the soilextracts at the end of the experiment (ECe), and mean EC of the drainagewater (ECd) of the various treatments. The ECd is lower than ECsw, for alltreatments, suggesting that there was some macropore flow in the containers(in essence, the irrigation water flowing in large pores directly to the bottomof the container). It was considered be the most accurate representation ofEC experienced by the plants is that calculated from the soil water salin-ity, based on irrigation water composition, quantities of water applied, andmeasured water consumption.
Shown in Table 2 are the estimates of the salinity related to plant responseusing different calculation methods. The first calculation [Ayers and Westcot(A&W) assuming constant ET] is based on the ET of the non-stressed plantwater consumption and the actual water applications. We calculated the
Dow
nloa
ded
by [
Uni
vers
ity o
f C
alif
orni
a, R
iver
side
Lib
rari
es],
[Pa
tric
ia G
onza
lez]
at 1
5:08
09
June
201
5
Mutual Stress: Salinity and Nitrogen 601
0
2
4
6
8
10
12
N1T0 N2T0 N1T1 N2T1 N1T1.5 N2T1.5 N1T2 N2T2 N1T4 N2T4
EC, d
S/m
Treatment
EC of Saturation Extract (ECe), Drainage Water (ECdw) and Soil Water (ECsw)
ECe ave
ECd ave
ECsw
FIGURE 1 Electrical conductivity of saturation extract, drainage water and soil water.
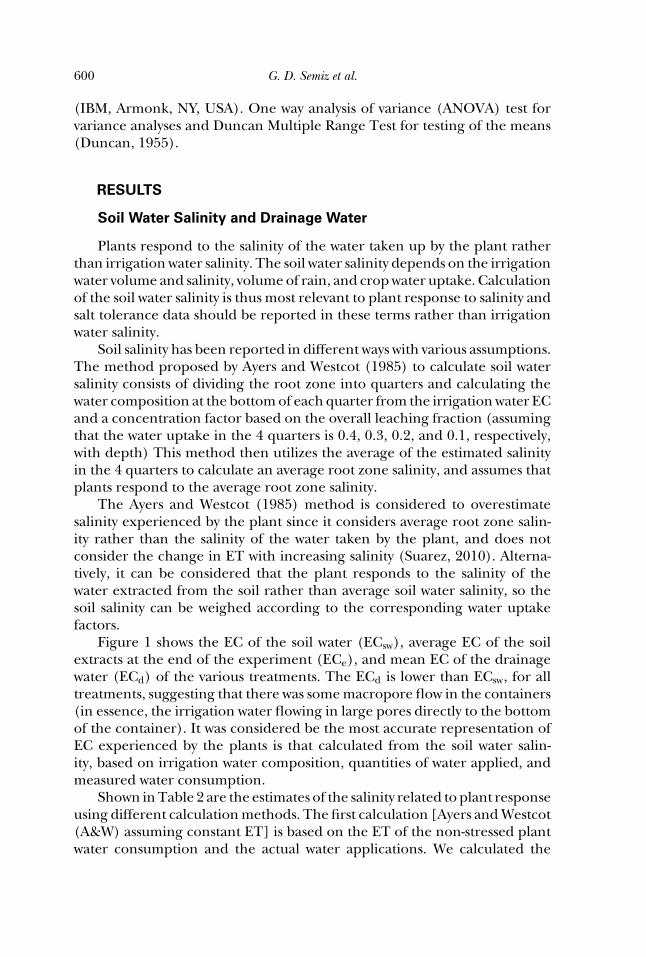
leaching fraction and average soil salinity using the method described byAyers and Westcot (1985). The next method, labeled ‘A&W with treatmentET’, differs from traditional calculations in that we utilized the actual waterbudget data for each container, thus the applied water was adjusted for thereduction in ET due to plant stress. In this manner, an essentially constantleaching fraction (LF) could be achieved. This method still calculates averageroot zone salinity, similarly to Ayers and Westcot (1985). As expected ‘A&Wwith treatment ET’ with average root zone salinity calculated from columnwater budget data gives lower salinity values than the traditional average rootzone method at higher salinity levels of irrigation water where reduction inET occurs.
The salinity calculated with ‘Water uptake weighted soil salinity withtreatment ET’ uses the actual water budget data and calculates a water uptakeweighted salinity. In this manner the water uptake factors (0.4, 0.3, 0.2, and0.1) are consistent with the values used to calculate the salinity with depth.
TABLE 2 Soil water salinity, dS m−1
TreatmentA&W assuming
constant ETA&W with
treatment ET
Water uptakeweighted soil salinitywith treatment ET
NSOS0 0.472 0.472 0.453NOS0 0.489 0.489 0.418NSOS1 1.80 1.83 1.60NOS1 1.96 1.98 1.69NSOS1.5 2.60 2.94 2.51NOS1.5 3.14 2.63 2.33NSOS2 3.76 4.00 3.41NOS2 4.76 3.91 3.35NSOS4 12.3 6.96 6.16NOS4 10.6 7.05 6.22NSOS6 ∞ 10.3 9.18NOS6 ∞ 10.3 9.16
Dow
nloa
ded
by [
Uni
vers
ity o
f C
alif
orni
a, R
iver
side
Lib
rari
es],
[Pa
tric
ia G
onza
lez]
at 1
5:08
09
June
201
5
602 G. D. Semiz et al.
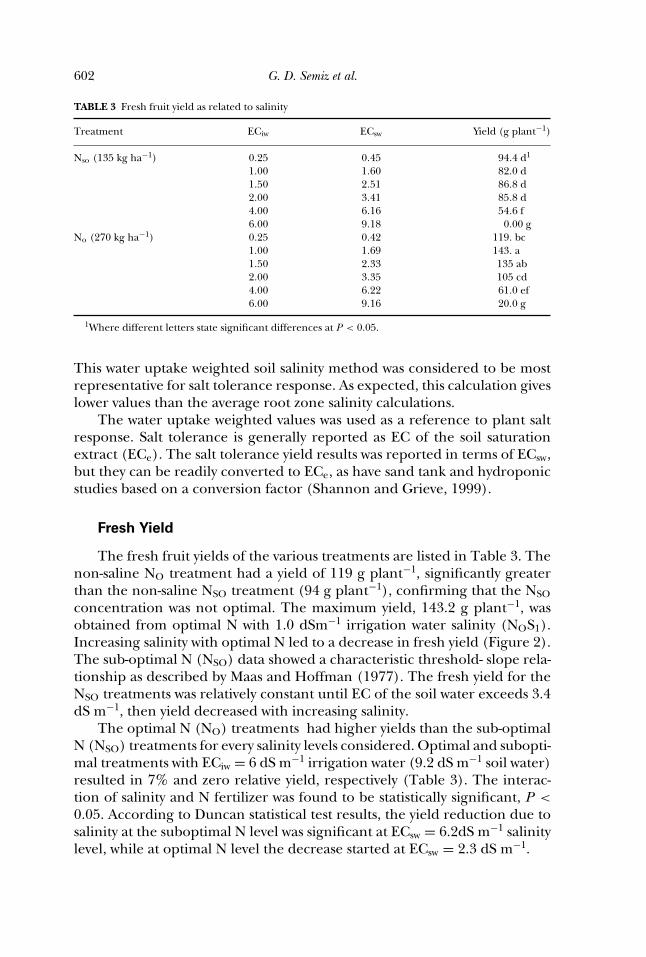
TABLE 3 Fresh fruit yield as related to salinity
Treatment ECiw ECsw Yield (g plant−1)
Nso (135 kg ha−1) 0.25 0.45 94.4 d1
1.00 1.60 82.0 d1.50 2.51 86.8 d2.00 3.41 85.8 d4.00 6.16 54.6 f6.00 9.18 0.00 g
No (270 kg ha−1) 0.25 0.42 119. bc1.00 1.69 143. a1.50 2.33 135 ab2.00 3.35 105 cd4.00 6.22 61.0 ef6.00 9.16 20.0 g
1Where different letters state significant differences at P < 0.05.
This water uptake weighted soil salinity method was considered to be mostrepresentative for salt tolerance response. As expected, this calculation giveslower values than the average root zone salinity calculations.
The water uptake weighted values was used as a reference to plant saltresponse. Salt tolerance is generally reported as EC of the soil saturationextract (ECe). The salt tolerance yield results was reported in terms of ECsw,but they can be readily converted to ECe, as have sand tank and hydroponicstudies based on a conversion factor (Shannon and Grieve, 1999).
Fresh Yield
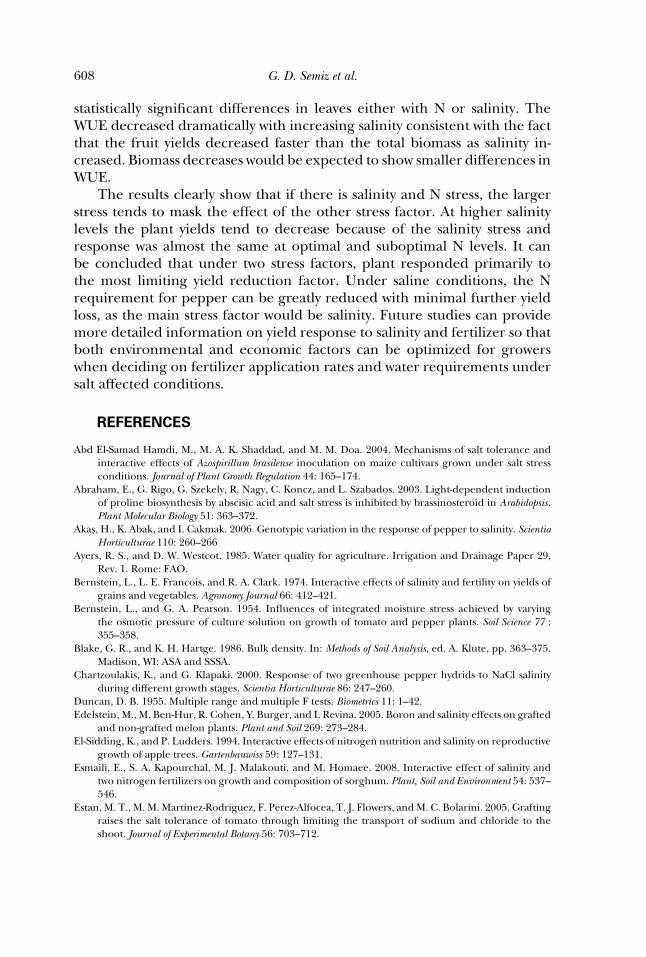
The fresh fruit yields of the various treatments are listed in Table 3. Thenon-saline NO treatment had a yield of 119 g plant−1, significantly greaterthan the non-saline NSO treatment (94 g plant−1), confirming that the NSO
concentration was not optimal. The maximum yield, 143.2 g plant−1, wasobtained from optimal N with 1.0 dSm−1 irrigation water salinity (NOS1).Increasing salinity with optimal N led to a decrease in fresh yield (Figure 2).The sub-optimal N (NSO) data showed a characteristic threshold- slope rela-tionship as described by Maas and Hoffman (1977). The fresh yield for theNSO treatments was relatively constant until EC of the soil water exceeds 3.4dS m−1, then yield decreased with increasing salinity.
The optimal N (NO) treatments had higher yields than the sub-optimalN (NSO) treatments for every salinity levels considered. Optimal and subopti-mal treatments with ECiw = 6 dS m−1 irrigation water (9.2 dS m−1 soil water)resulted in 7% and zero relative yield, respectively (Table 3). The interac-tion of salinity and N fertilizer was found to be statistically significant, P <
0.05. According to Duncan statistical test results, the yield reduction due tosalinity at the suboptimal N level was significant at ECsw = 6.2dS m−1 salinitylevel, while at optimal N level the decrease started at ECsw = 2.3 dS m−1.
Dow
nloa
ded
by [
Uni
vers
ity o
f C
alif
orni
a, R
iver
side
Lib
rari
es],
[Pa
tric
ia G
onza
lez]
at 1
5:08
09
June
201
5
Mutual Stress: Salinity and Nitrogen 603
0
20
40
60
80
100
120
140
160
0,00 2,00 4,00 6,00 8,00 10,00
Soil water salinity ECsw, dS/m
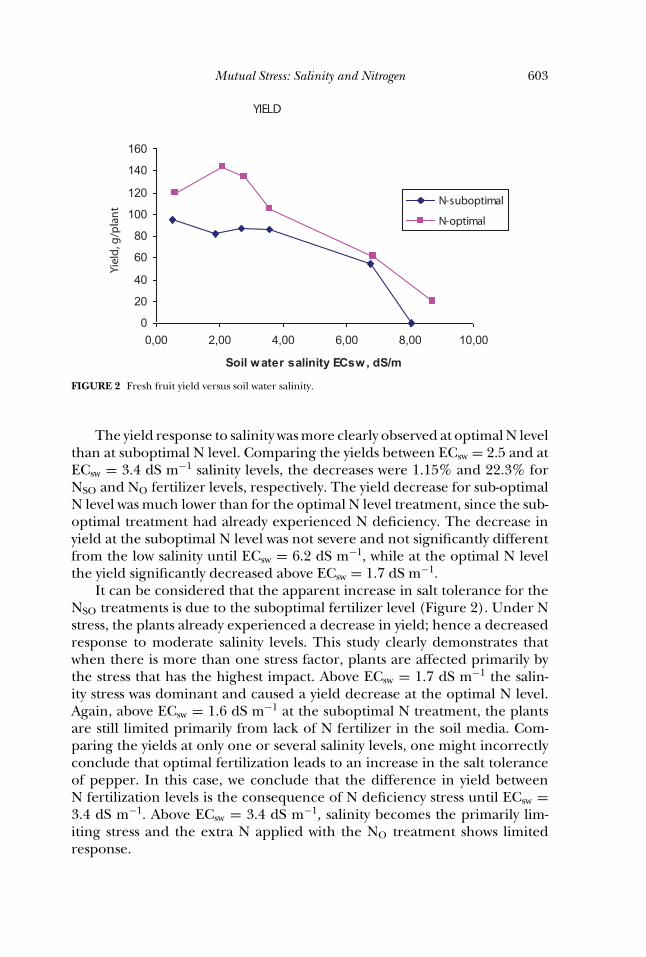
FIGURE 2 Fresh fruit yield versus soil water salinity.
The yield response to salinity was more clearly observed at optimal N levelthan at suboptimal N level. Comparing the yields between ECsw = 2.5 and atECsw = 3.4 dS m−1 salinity levels, the decreases were 1.15% and 22.3% forNSO and NO fertilizer levels, respectively. The yield decrease for sub-optimalN level was much lower than for the optimal N level treatment, since the sub-optimal treatment had already experienced N deficiency. The decrease inyield at the suboptimal N level was not severe and not significantly differentfrom the low salinity until ECsw = 6.2 dS m−1, while at the optimal N levelthe yield significantly decreased above ECsw = 1.7 dS m−1.
It can be considered that the apparent increase in salt tolerance for theNSO treatments is due to the suboptimal fertilizer level (Figure 2). Under Nstress, the plants already experienced a decrease in yield; hence a decreasedresponse to moderate salinity levels. This study clearly demonstrates thatwhen there is more than one stress factor, plants are affected primarily bythe stress that has the highest impact. Above ECsw = 1.7 dS m−1 the salin-ity stress was dominant and caused a yield decrease at the optimal N level.Again, above ECsw = 1.6 dS m−1 at the suboptimal N treatment, the plantsare still limited primarily from lack of N fertilizer in the soil media. Com-paring the yields at only one or several salinity levels, one might incorrectlyconclude that optimal fertilization leads to an increase in the salt toleranceof pepper. In this case, we conclude that the difference in yield betweenN fertilization levels is the consequence of N deficiency stress until ECsw =3.4 dS m−1. Above ECsw = 3.4 dS m−1, salinity becomes the primarily lim-iting stress and the extra N applied with the NO treatment shows limitedresponse.
Dow
nloa
ded
by [
Uni
vers
ity o
f C
alif
orni
a, R
iver
side
Lib
rari
es],
[Pa
tric
ia G
onza
lez]
at 1
5:08
09
June
201
5
604 G. D. Semiz et al.
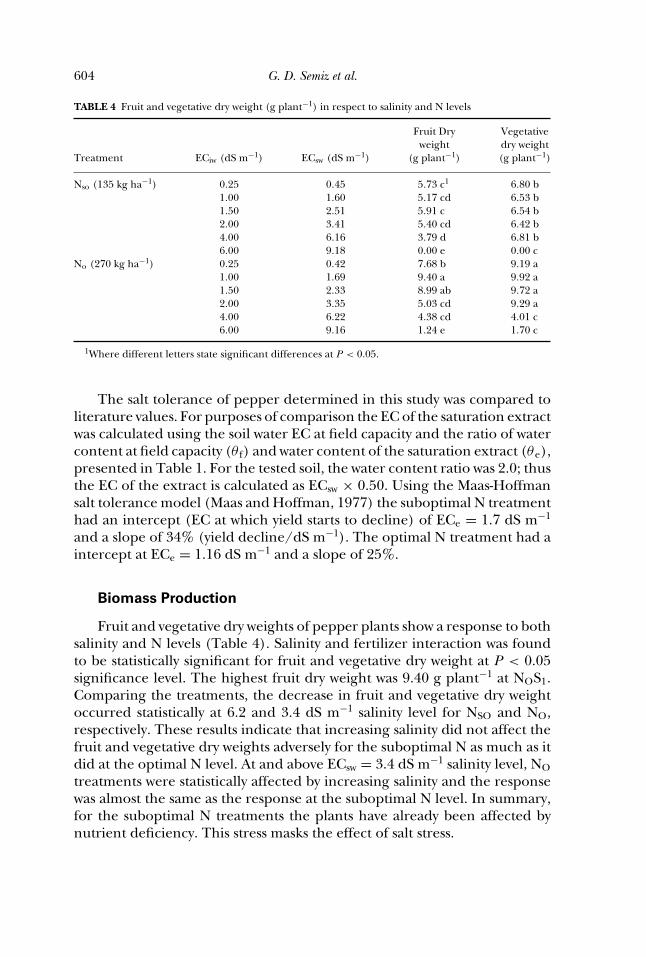
TABLE 4 Fruit and vegetative dry weight (g plant−1) in respect to salinity and N levels
Fruit Dry Vegetativeweight dry weight
Treatment ECiw (dS m−1) ECsw (dS m−1) (g plant−1) (g plant−1)
Nso (135 kg ha−1) 0.25 0.45 5.73 c1 6.80 b1.00 1.60 5.17 cd 6.53 b1.50 2.51 5.91 c 6.54 b2.00 3.41 5.40 cd 6.42 b4.00 6.16 3.79 d 6.81 b6.00 9.18 0.00 e 0.00 c
No (270 kg ha−1) 0.25 0.42 7.68 b 9.19 a1.00 1.69 9.40 a 9.92 a1.50 2.33 8.99 ab 9.72 a2.00 3.35 5.03 cd 9.29 a4.00 6.22 4.38 cd 4.01 c6.00 9.16 1.24 e 1.70 c
1Where different letters state significant differences at P < 0.05.
The salt tolerance of pepper determined in this study was compared toliterature values. For purposes of comparison the EC of the saturation extractwas calculated using the soil water EC at field capacity and the ratio of watercontent at field capacity (θ f) and water content of the saturation extract (θe),presented in Table 1. For the tested soil, the water content ratio was 2.0; thusthe EC of the extract is calculated as ECsw × 0.50. Using the Maas-Hoffmansalt tolerance model (Maas and Hoffman, 1977) the suboptimal N treatmenthad an intercept (EC at which yield starts to decline) of ECe = 1.7 dS m−1
and a slope of 34% (yield decline/dS m−1). The optimal N treatment had aintercept at ECe = 1.16 dS m−1 and a slope of 25%.
Biomass Production
Fruit and vegetative dry weights of pepper plants show a response to bothsalinity and N levels (Table 4). Salinity and fertilizer interaction was foundto be statistically significant for fruit and vegetative dry weight at P < 0.05significance level. The highest fruit dry weight was 9.40 g plant−1 at NOS1.Comparing the treatments, the decrease in fruit and vegetative dry weightoccurred statistically at 6.2 and 3.4 dS m−1 salinity level for NSO and NO,respectively. These results indicate that increasing salinity did not affect thefruit and vegetative dry weights adversely for the suboptimal N as much as itdid at the optimal N level. At and above ECsw = 3.4 dS m−1 salinity level, NO
treatments were statistically affected by increasing salinity and the responsewas almost the same as the response at the suboptimal N level. In summary,for the suboptimal N treatments the plants have already been affected bynutrient deficiency. This stress masks the effect of salt stress.
Dow
nloa
ded
by [
Uni
vers
ity o
f C
alif
orni
a, R
iver
side
Lib
rari
es],
[Pa
tric
ia G
onza
lez]
at 1
5:08
09
June
201
5
Mutual Stress: Salinity and Nitrogen 605
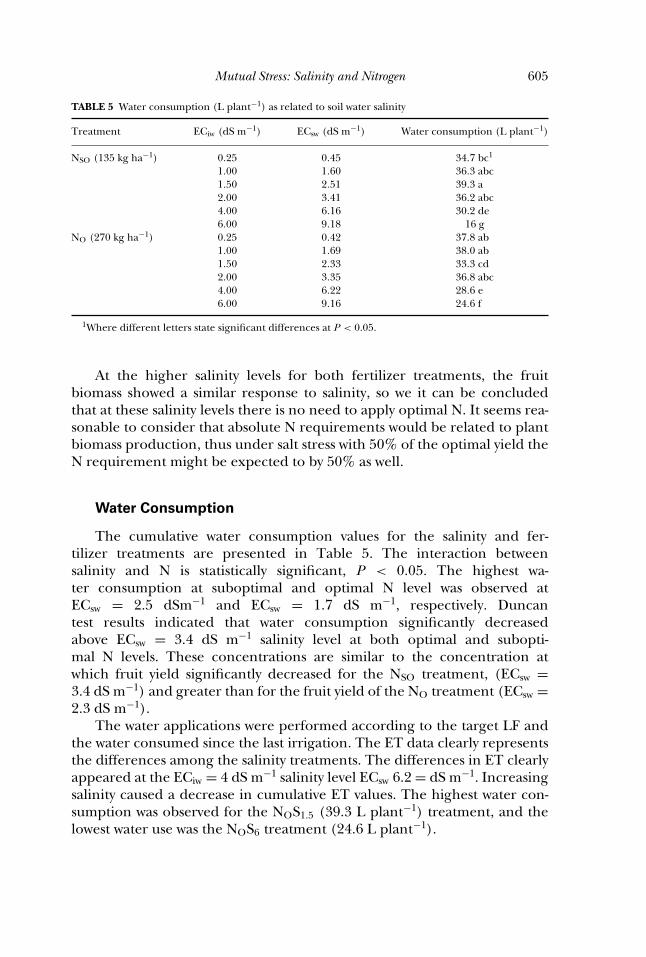
TABLE 5 Water consumption (L plant−1) as related to soil water salinity
Treatment ECiw (dS m−1) ECsw (dS m−1) Water consumption (L plant−1)
NSO (135 kg ha−1) 0.25 0.45 34.7 bc1
1.00 1.60 36.3 abc1.50 2.51 39.3 a2.00 3.41 36.2 abc4.00 6.16 30.2 de6.00 9.18 16 g
NO (270 kg ha−1) 0.25 0.42 37.8 ab1.00 1.69 38.0 ab1.50 2.33 33.3 cd2.00 3.35 36.8 abc4.00 6.22 28.6 e6.00 9.16 24.6 f
1Where different letters state significant differences at P < 0.05.
At the higher salinity levels for both fertilizer treatments, the fruitbiomass showed a similar response to salinity, so we it can be concludedthat at these salinity levels there is no need to apply optimal N. It seems rea-sonable to consider that absolute N requirements would be related to plantbiomass production, thus under salt stress with 50% of the optimal yield theN requirement might be expected to by 50% as well.
Water Consumption
The cumulative water consumption values for the salinity and fer-tilizer treatments are presented in Table 5. The interaction betweensalinity and N is statistically significant, P < 0.05. The highest wa-ter consumption at suboptimal and optimal N level was observed atECsw = 2.5 dSm−1 and ECsw = 1.7 dS m−1, respectively. Duncantest results indicated that water consumption significantly decreasedabove ECsw = 3.4 dS m−1 salinity level at both optimal and subopti-mal N levels. These concentrations are similar to the concentration atwhich fruit yield significantly decreased for the NSO treatment, (ECsw =3.4 dS m−1) and greater than for the fruit yield of the NO treatment (ECsw =2.3 dS m−1).
The water applications were performed according to the target LF andthe water consumed since the last irrigation. The ET data clearly representsthe differences among the salinity treatments. The differences in ET clearlyappeared at the ECiw = 4 dS m−1 salinity level ECsw 6.2 = dS m−1. Increasingsalinity caused a decrease in cumulative ET values. The highest water con-sumption was observed for the NOS1.5 (39.3 L plant−1) treatment, and thelowest water use was the NOS6 treatment (24.6 L plant−1).
Dow
nloa
ded
by [
Uni
vers
ity o
f C
alif
orni
a, R
iver
side
Lib
rari
es],
[Pa
tric
ia G
onza
lez]
at 1
5:08
09
June
201
5
606 G. D. Semiz et al.
Water Use Efficiency
00,51
1,52
2,53
3,54
4,5
0,00 2,00 4,00 6,00 8,00 10,00
Soil Water Salinity, ECsw dS/m
WUE
, kg/
m3
N-suboptimalN-optimal
FIGURE 3 Water use efficiency versus soil salinity.
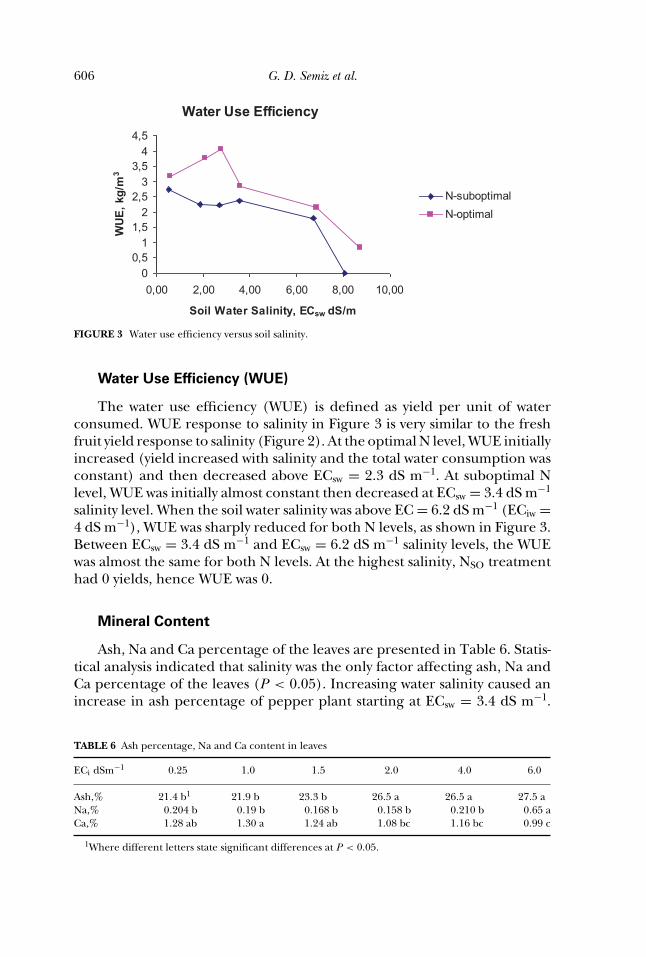
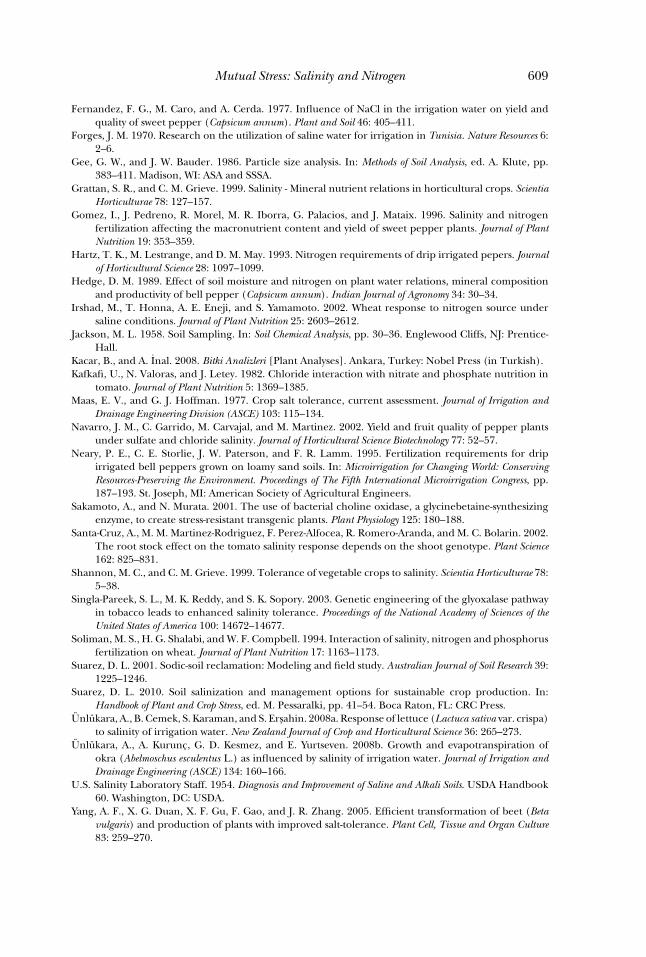
Water Use Efficiency (WUE)
The water use efficiency (WUE) is defined as yield per unit of waterconsumed. WUE response to salinity in Figure 3 is very similar to the freshfruit yield response to salinity (Figure 2). At the optimal N level, WUE initiallyincreased (yield increased with salinity and the total water consumption wasconstant) and then decreased above ECsw = 2.3 dS m−1. At suboptimal Nlevel, WUE was initially almost constant then decreased at ECsw = 3.4 dS m−1
salinity level. When the soil water salinity was above EC = 6.2 dS m−1 (ECiw =4 dS m−1), WUE was sharply reduced for both N levels, as shown in Figure 3.Between ECsw = 3.4 dS m−1 and ECsw = 6.2 dS m−1 salinity levels, the WUEwas almost the same for both N levels. At the highest salinity, NSO treatmenthad 0 yields, hence WUE was 0.
Mineral Content
Ash, Na and Ca percentage of the leaves are presented in Table 6. Statis-tical analysis indicated that salinity was the only factor affecting ash, Na andCa percentage of the leaves (P < 0.05). Increasing water salinity caused anincrease in ash percentage of pepper plant starting at ECsw = 3.4 dS m−1.
TABLE 6 Ash percentage, Na and Ca content in leaves
ECi dSm−1 0.25 1.0 1.5 2.0 4.0 6.0
Ash,% 21.4 b1 21.9 b 23.3 b 26.5 a 26.5 a 27.5 aNa,% 0.204 b 0.19 b 0.168 b 0.158 b 0.210 b 0.65 aCa,% 1.28 ab 1.30 a 1.24 ab 1.08 bc 1.16 bc 0.99 c
1Where different letters state significant differences at P < 0.05.
Dow
nloa
ded
by [
Uni
vers
ity o
f C
alif
orni
a, R
iver
side
Lib
rari
es],
[Pa
tric
ia G
onza
lez]
at 1
5:08
09
June
201
5
Mutual Stress: Salinity and Nitrogen 607
TABLE 7 Chloride content in leaves,%
Treatment ECiw (dS m−1) ECsw (dS m−1) Cl (%)
NSO (135 kg ha−1) 0.25 0.45 0.285 e1
1.00 1.60 2.33 de1.50 2.51 3.79 d2.00 3.41 5.38 c4.00 6.16 7.63 b6.00 9.18 7.67 b
NO (270 kg ha−1) 0.25 0.42 0.473 e1.00 1.69 2.96 de1.50 2.33 3.54 d2.00 3.35 3.79 d4.00 6.22 8.38 ab6.00 9.16 9.46 a
1Where different letters state significant differences at P < 0.05.
The Na content in leaves was affected only by salinity level (P < 0.05). In-creasing salinity level in the soil water led to an increase in the Na content ofthe leaves only at the highest salinity treatment (Table 6). Calcium accumu-lation in leaves was significantly affected by salinity (P < 0.05). Increasingwater salinity had only a minor effect on Ca uptake, significantly decreasingonly at the highest salinity level (Table 6). Magnesium and K concentrationsin the leaves were not significantly affected by salinity nor by N fertilizerlevel, (P > 0.05).
Interaction of salinity and N fertilizer was found for the Cl content inleaves, (P<0.05). Increasing salinity caused an increase in leaf Cl contentfor both N levels (Table 7). At optimal N level, the leaf Cl concentrationincreased slightly until ECsw = 3.4 dS m−1, above this salinity level Cl con-centration increased sharply.
CONCLUSION
The biomass of the pepper plant showed a statistically significant de-crease with increasing salinity. At optimal N level increasing salinity initiallyincreased yield until ECsw = 2.4 dS m−1 in the soil water (ECiw = 1.5 dSm−1), which is the salinity threshold value of pepper. The differences be-tween yield response at optimal and suboptimal N treatments was large atlower salinity levels and minor at high salinity levels, indicating that thepepper plants responded mostly to the stress limiting factor (initially Nand subsequently salinity). Ash percentage increased with increasing salin-ity, calcium accumulation in leaves decreased above the ECsw = 3.4 dS m−1
salinity level. Chloride accumulation in the leaves increased with increas-ing salinity level but again mostly above the ECsw = 3.4 dS m−1 salinitylevel with optimal fertilizer. The Mg and K concentrations did not show
Dow
nloa
ded
by [
Uni
vers
ity o
f C
alif
orni
a, R
iver
side
Lib
rari
es],
[Pa
tric
ia G
onza
lez]
at 1
5:08
09
June
201
5
608 G. D. Semiz et al.
statistically significant differences in leaves either with N or salinity. TheWUE decreased dramatically with increasing salinity consistent with the factthat the fruit yields decreased faster than the total biomass as salinity in-creased. Biomass decreases would be expected to show smaller differences inWUE.
The results clearly show that if there is salinity and N stress, the largerstress tends to mask the effect of the other stress factor. At higher salinitylevels the plant yields tend to decrease because of the salinity stress andresponse was almost the same at optimal and suboptimal N levels. It canbe concluded that under two stress factors, plant responded primarily tothe most limiting yield reduction factor. Under saline conditions, the Nrequirement for pepper can be greatly reduced with minimal further yieldloss, as the main stress factor would be salinity. Future studies can providemore detailed information on yield response to salinity and fertilizer so thatboth environmental and economic factors can be optimized for growerswhen deciding on fertilizer application rates and water requirements undersalt affected conditions.
REFERENCES
Abd El-Samad Hamdi, M., M. A. K. Shaddad, and M. M. Doa. 2004. Mechanisms of salt tolerance andinteractive effects of Azospirillum brasilense inoculation on maize cultivars grown under salt stressconditions. Journal of Plant Growth Regulation 44: 165–174.
Abraham, E., G. Rigo, G. Szekely, R. Nagy, C. Koncz, and L. Szabados. 2003. Light-dependent inductionof proline biosynthesis by abscisic acid and salt stress is inhibited by brassinosteroid in Arabidopsis.Plant Molecular Biology 51: 363–372.
Akas, H., K. Abak, and I. Cakmak. 2006. Genotypic variation in the response of pepper to salinity. ScientiaHorticulturae 110: 260–266
Ayers, R. S., and D. W. Westcot. 1985. Water quality for agriculture. Irrigation and Drainage Paper 29,Rev. 1. Rome: FAO.
Bernstein, L., L. E. Francois, and R. A. Clark. 1974. Interactive effects of salinity and fertility on yields ofgrains and vegetables. Agronomy Journal 66: 412–421.
Bernstein, L., and G. A. Pearson. 1954. Influences of integrated moisture stress achieved by varyingthe osmotic pressure of culture solution on growth of tomato and pepper plants. Soil Science 77 :355–358.
Blake, G. R., and K. H. Hartge. 1986. Bulk density. In: Methods of Soil Analysis, ed. A. Klute, pp. 363–375.Madison, WI: ASA and SSSA.
Chartzoulakis, K., and G. Klapaki. 2000. Response of two greenhouse pepper hydrids to NaCl salinityduring different growth stages. Scientia Horticulturae 86: 247–260.
Duncan, D. B. 1955. Multiple range and multiple F tests. Biometrics 11: 1–42.Edelstein, M., M. Ben-Hur, R. Cohen, Y. Burger, and I. Revina. 2005. Boron and salinity effects on grafted
and non-grafted melon plants. Plant and Soil 269: 273–284.El-Sidding, K., and P. Ludders. 1994. Interactive effects of nitrogen nutrition and salinity on reproductive
growth of apple trees. Gartenbauwiss 59: 127–131.Esmaili, E., S. A. Kapourchal, M. J. Malakouti, and M. Homaee. 2008. Interactive effect of salinity and
two nitrogen fertilizers on growth and composition of sorghum. Plant, Soil and Environment 54: 537–546.
Estan, M. T., M. M. Martinez-Rodriguez, F. Perez-Alfocea, T. J. Flowers, and M. C. Bolarini. 2005. Graftingraises the salt tolerance of tomato through limiting the transport of sodium and chloride to theshoot. Journal of Experimental Botany 56: 703–712.
Dow
nloa
ded
by [
Uni
vers
ity o
f C
alif
orni
a, R
iver
side
Lib
rari
es],
[Pa
tric
ia G
onza
lez]
at 1
5:08
09
June
201
5
Mutual Stress: Salinity and Nitrogen 609
Fernandez, F. G., M. Caro, and A. Cerda. 1977. Influence of NaCl in the irrigation water on yield andquality of sweet pepper (Capsicum annum). Plant and Soil 46: 405–411.
Forges, J. M. 1970. Research on the utilization of saline water for irrigation in Tunisia. Nature Resources 6:2–6.
Gee, G. W., and J. W. Bauder. 1986. Particle size analysis. In: Methods of Soil Analysis, ed. A. Klute, pp.383–411. Madison, WI: ASA and SSSA.
Grattan, S. R., and C. M. Grieve. 1999. Salinity - Mineral nutrient relations in horticultural crops. ScientiaHorticulturae 78: 127–157.
Gomez, I., J. Pedreno, R. Morel, M. R. Iborra, G. Palacios, and J. Mataix. 1996. Salinity and nitrogenfertilization affecting the macronutrient content and yield of sweet pepper plants. Journal of PlantNutrition 19: 353–359.
Hartz, T. K., M. Lestrange, and D. M. May. 1993. Nitrogen requirements of drip irrigated pepers. Journalof Horticultural Science 28: 1097–1099.
Hedge, D. M. 1989. Effect of soil moisture and nitrogen on plant water relations, mineral compositionand productivity of bell pepper (Capsicum annum). Indian Journal of Agronomy 34: 30–34.
Irshad, M., T. Honna, A. E. Eneji, and S. Yamamoto. 2002. Wheat response to nitrogen source undersaline conditions. Journal of Plant Nutrition 25: 2603–2612.
Jackson, M. L. 1958. Soil Sampling. In: Soil Chemical Analysis, pp. 30–36. Englewood Cliffs, NJ: Prentice-Hall.
Kacar, B., and A. Inal. 2008. Bitki Analizleri [Plant Analyses]. Ankara, Turkey: Nobel Press (in Turkish).Kafkafi, U., N. Valoras, and J. Letey. 1982. Chloride interaction with nitrate and phosphate nutrition in
tomato. Journal of Plant Nutrition 5: 1369–1385.Maas, E. V., and G. J. Hoffman. 1977. Crop salt tolerance, current assessment. Journal of Irrigation and
Drainage Engineering Division (ASCE) 103: 115–134.Navarro, J. M., C. Garrido, M. Carvajal, and M. Martinez. 2002. Yield and fruit quality of pepper plants
under sulfate and chloride salinity. Journal of Horticultural Science Biotechnology 77: 52–57.Neary, P. E., C. E. Storlie, J. W. Paterson, and F. R. Lamm. 1995. Fertilization requirements for drip
irrigated bell peppers grown on loamy sand soils. In: Microirrigation for Changing World: ConservingResources-Preserving the Environment. Proceedings of The Fifth International Microirrigation Congress, pp.187–193. St. Joseph, MI: American Society of Agricultural Engineers.
Sakamoto, A., and N. Murata. 2001. The use of bacterial choline oxidase, a glycinebetaine-synthesizingenzyme, to create stress-resistant transgenic plants. Plant Physiology 125: 180–188.
Santa-Cruz, A., M. M. Martinez-Rodriguez, F. Perez-Alfocea, R. Romero-Aranda, and M. C. Bolarin. 2002.The root stock effect on the tomato salinity response depends on the shoot genotype. Plant Science162: 825–831.
Shannon, M. C., and C. M. Grieve. 1999. Tolerance of vegetable crops to salinity. Scientia Horticulturae 78:5–38.
Singla-Pareek, S. L., M. K. Reddy, and S. K. Sopory. 2003. Genetic engineering of the glyoxalase pathwayin tobacco leads to enhanced salinity tolerance. Proceedings of the National Academy of Sciences of theUnited States of America 100: 14672–14677.
Soliman, M. S., H. G. Shalabi, and W. F. Compbell. 1994. Interaction of salinity, nitrogen and phosphorusfertilization on wheat. Journal of Plant Nutrition 17: 1163–1173.
Suarez, D. L. 2001. Sodic-soil reclamation: Modeling and field study. Australian Journal of Soil Research 39:1225–1246.
Suarez, D. L. 2010. Soil salinization and management options for sustainable crop production. In:Handbook of Plant and Crop Stress, ed. M. Pessaralki, pp. 41–54. Boca Raton, FL: CRC Press.
Unlukara, A., B. Cemek, S. Karaman, and S. Ersahin. 2008a. Response of lettuce (Lactuca sativa var. crispa)to salinity of irrigation water. New Zealand Journal of Crop and Horticultural Science 36: 265–273.
Unlukara, A., A. Kurunc, G. D. Kesmez, and E. Yurtseven. 2008b. Growth and evapotranspiration ofokra (Abelmoschus esculentus L.) as influenced by salinity of irrigation water. Journal of Irrigation andDrainage Engineering (ASCE) 134: 160–166.
U.S. Salinity Laboratory Staff. 1954. Diagnosis and Improvement of Saline and Alkali Soils. USDA Handbook60. Washington, DC: USDA.
Yang, A. F., X. G. Duan, X. F. Gu, F. Gao, and J. R. Zhang. 2005. Efficient transformation of beet (Betavulgaris) and production of plants with improved salt-tolerance. Plant Cell, Tissue and Organ Culture83: 259–270.
Dow
nloa
ded
by [
Uni
vers
ity o
f C
alif
orni
a, R
iver
side
Lib
rari
es],
[Pa
tric
ia G
onza
lez]
at 1
5:08
09
June
201
5

610 G. D. Semiz et al.
Yurtseven, E., G. D. Kesmez, and A. Unlukara. 2005. The effects of water salinity and potassium levels onyield, fruit quality and water consumption of a native central anatolian tomato species (Lycopersiconesculantum). Agricultural Water Management 78: 128–135.
Zhu, G. Y., J. M. Kinet, P. Bertin, J. Bouharmont and S. Lutts. 2000. Crosses between cultivars and tissueculture-selected plants for salt resistance improvement in rice, (Oryza sativa). Plant Breeding 119:497–504.
Dow
nloa
ded
by [
Uni
vers
ity o
f C
alif
orni
a, R
iver
side
Lib
rari
es],
[Pa
tric
ia G
onza
lez]
at 1
5:08
09
June
201
5