identification of geothermal potential based on fault
TRANSCRIPT

Identification of Geothermal Potential Based on Fault Fracture
Density (FFD), Geological Mapping and Geochemical Analysis,
Case Study : Bantarkawung, Brebes, Central Java
Oktoberimana*, Dimas Aji Ramadhan P
a, Fajar Rizki W
a, Rizal Tawakal A
a
aUniversity of Jenderal Soedirman. Jl, Mayjen Sungkono KM 5 Purbalingga, Indonesia
Abstract
Insufficient of conventional energy production today in Indonesia, encouraging all elements to discover an alternative energy.
Geothermal is one of big potential alternative energy in Indonesia regarding the conditon of geological setting in Indonesia
which has 129 active volcanoes. Bantarkawung is located in the western of Mount Slamet where hot spring occured as
geothermal manifestation. This indicate geothermal potential in that area. This research is aimed to identify geothermal potential
that lies in bantarkawung using Fault Fracture Density (FFD), Geological Mapping and Geochemical analysis. Based on FFD
analysis known that anomaly area is located at central and northeast of research area, and based on geological mapping known
that area composed by mudstone unit and sandstone unit, water temperature of research area is 43 °C to 62 °C, by using
geochemical analysis of major ions HCO3-,Cl-,S04
2- known that the type of hot water is bicarbonate water which characterized as
an outflow zone of geothermal system.
Keywords: Bantarkawung; FFD; geochemichal analysis; geothermal; hot springs
1. Introduction
Research area is located in Bantarkawung area with extens about 12 Km2 consist of four villages (Karangpari,
Waru, Pangebatan, and Telaga). Bantarkawung which located in Brebes region is interesting area to be researched
especially for geothermal study. This area has hot springs water which indicate surface of geothermal system,
interesting lithology and complex geological structures [1] Geothermal potential in this research area influenced by
Java tectonic which has well-organized patterns. In general there are three patterns of structures that develope in
Java namely Northeast-Southwest (NE-SW) called meratus pattern, North-south (N-S) direction or Sunda pattern
and East-West (E-W) direction or called Java pattern.
* Corresponding author. Tel.: +62 877 7143 0301
E-mail address: [email protected]
ISSN 2413-5453 Volume 2 (2015) 141-151New, Renewable Energy and Energy Conservation Conference and Exhibition
(The 3rd Indonesia EBTKE-ConEx, 2014)
ISSN 2413-5453 © 2015 The Authors.Published by KnowledgeE Publishing Services. This is an open access article under the CC BY-NC-ND license(http://creativecommons.org/licenses/by-nc-nd/4.0)Selection and peer-review under responsibility of the Scientific Committee of The 3rd Indonesia EBTKE ConEx 2014. DOI http://dx.doi.org/10.18502/ken.v2i2.369

Oktoberiman et al./ Proc. Indo EBTKE-ConEx 2014
Page | 142
Figure 1. Pattern Straightness of The Srtm and Roset Diagram.
Regional Strathigraphy of research area consist of Rambatan formation and Halang formation. The Bottom of
Rambatan formation consist of calcareous sandstone and conglomerate which alternate each other with thin layers
marl and shale,while on top consist of calcareous sandstone colored light gray until gray blue. Halang formation
consist of tuffaceous sandstone, conglomerate, marl, and claystone which alternate each other and well layered [1]
2. Methods
Identification of geothermal in this research conducted by using FFD analysis, geological mapping and
geochemical analysis of hot water as a surface manifestation in research area.
2.1. Fault Fracture Density (FFD)
FFD analysis is a method of remote sensing that aims to find zone or area of geothermal based on density of the
fractures that exist in the research area. FFD method is gained from lineaments of structure which illustrate
reflection of topography such as river lineaments, valley lineaments, fault or fracture structure, lithology contact,
and geothermal manifestations appearence, therefore known lineaments trend that classified on 4 × 3 km grid of
research area as characteristic of geothermal manifestations.[2]
2.2. Geological mapping
Geological mapping is done to make geological map. Geological map is a map that provides an overview of the
entire deployment and arrangement of rock layers and it can provide three-dimensional reflection of the composition
of the rocks in the subsurface. Geological mapping is a method by conducting research directly to the geological
aspects in field of research area such as lithology, stratigraphy, and structure that can explain the existence of hot
springs in the research area and also measuring the temperature of the hot springs and temperature of the river.
2.3. Geochemical analysis
The geochemical analysis consist of measuring and analysis the content of chemical composition so that it can be
determined that there is a relationship with the presence of hot springs and geothermal resource around the research
area. [3] Geochemical analysis is conducted to gain the contain of chemical element of the water such as HCO3- ,
SO42-
, Na, Ca, Mg, K, Cl, B and pH. The result of data will be put in trilinear pipper diagram to know the hot water
type.

Oktoberiman et al. / Proc. Indo EBTKE-ConEx 2014
Page | 143
3. Results and discussion
3.1. Fault Fracture Density (FFD)
Figure 2. Fault and Fracture Density Map of research area.
Based on the calculation of the distribution intensity of the structure by using FFD, Bantarkawung regions can be
divided into two structural intensity areas which are high intensity area and low intensity. High intensity area is
shown by yellow to red colors, while low intensity area is shown by green - blue colors (Figure 2). Areas with high
intensity are located on center and northeast of research area. Green areas are non-anomalous areas. Areas of high-
value associated with the heat source rock, because the intensity of the structure associated with the drainage of
fluid (steam heat). The appearance of some fault topography indicates the deformation control and fracture in this
area.
Fault and Fracture Density (FFD) map in Figure 1 show anomaly of density of structure (red area) which located
on center and northern of research area. The density of structure is related with geothermal manifestations because
higher density of structure is directly equal to higher potential of geothermal. [4].
3.2. Geological mapping
The Geological mapping show that the research area consist of two lithology units, which are mudstone unit and
sandstone unit. Geology map is shown in Figure 3.
Figure 3. Geology map Karangpari area and its nearby.

Oktoberiman et al./ Proc. Indo EBTKE-ConEx 2014
Page | 144
The geological structures which control the research area are Pangebatan left thrust slip fault, Karangpari left
thrust slip fault, Pangebatan right slip fault and Bisole right normal slip fault. The Mudstone unit is covered about
38.1 % from total of research area that consist of mudstone alternate with sandstone and intercalate with limestone
and breccia, the average thickness of mudstone is about 1.5 m, while the thickness of sandstone is about 30 cm to
100 cm. Mudstone is thinning upward while sandstone is thickening upward. Mudstone is dark gray, low carbonate
and compact. Sandstone is light gray-green in color, medium to coarse grain, carbonate, poor sorted, mineral
composition are quartz, feldspar, and mafic minerals, graded bedding structure. Limestone is light gray, very fine
grain, very compact, place on top in this unit. Breccia is gray-dark, gravel-pebble grain, sub angular – angular
fragment, carbonate, poor sorted, compact, matrix is composed by medium sandstone. Sandstone unit consist of
alternating of sandstone and mudstone with sandstone dominated. In the lower sandstone, the average thickness is
about 1 m to 1.5 m with coarser until fragmented in grain.
Figure 4. Sandstone-mudstone outcrop (a), graded bedding structure (b), paralel lamination and load structure (c), flute cast structure (d).
The sandstone’s layer pattern is fining and thinning upward while sediment structures are graded bedding, paralel
lamination, wavy lamination, convolute, load cast, and bioturbation. The mudstone is colored dark, carbonate,
compact, and fresh in outcrop. The sandstone is fine-coarse grain, well-poor sorted, open-closed fabric, igneous
rocks fragment, minerals are quartz, feldspar, and mafic minerals. The conglomerate colored gray-black, gravel-
pebble grain, rounded-subrounded fragment, open fabric, carbonate, poor sorted, compact, fragment igneous rocks,
sedimentary rocks, matrix : medium sandstone. The geological structures in research area are Pangebatan left thrust
slip fault, Karangpari left thrust slip fault, Pangebatan right slip fault and Bisole right normal slip fault.
b. a. N800E
d c. N1350E

Oktoberiman et al. / Proc. Indo EBTKE-ConEx 2014
Page | 145
Figure 5. Minor fault (a and b), brecciation (c), scratch line (d).
The manifestations of hot springs are located on the center and northern of research area, and have temperature
are 45 °C, 43
°C, and 62
°C. The hot spring manifestation lies on the sandstone unit. The presence of hot springs also
controlled by the characteristics of geological aspects which stand on the research area. Sandstone unit has better
permeability rather than Mudstone unit. The better permeability can be a good way and good media so that the hot
water can be passed. Furthermore, the amount of structures which lies on the standstone unit also create secondary
permeability so that it can be more effective media to the hot springs in flowing horizontally and vertically.
d. N1350E c.
b.N2500E a. N188
0E
Oktoberiman et al./ Proc. Indo EBTKE-ConEx 2014
Page | 146
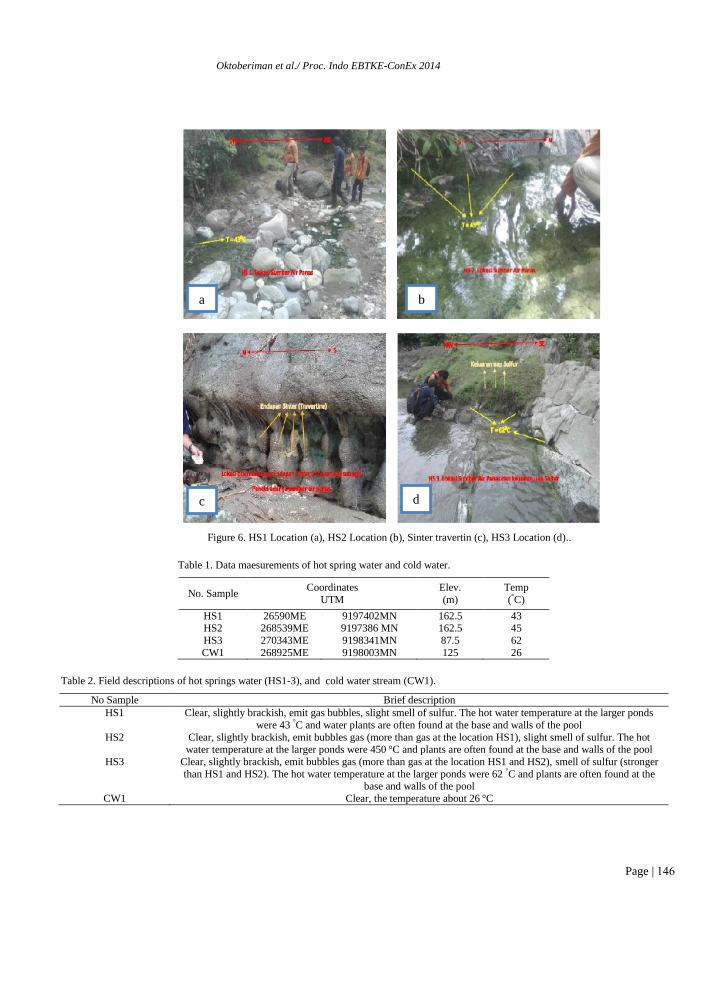
Figure 6. HS1 Location (a), HS2 Location (b), Sinter travertin (c), HS3 Location (d)..
Table 1. Data maesurements of hot spring water and cold water.
No. Sample Coordinates
UTM
Elev.
(m)
Temp
(°C)
HS1 26590ME 9197402MN 162.5 43 HS2 268539ME 9197386 MN 162.5 45
HS3 270343ME 9198341MN 87.5 62
CW1 268925ME 9198003MN 125 26
Table 2. Field descriptions of hot springs water (HS1-3), and cold water stream (CW1).
No Sample Brief description
HS1 Clear, slightly brackish, emit gas bubbles, slight smell of sulfur. The hot water temperature at the larger ponds
were 43 °C and water plants are often found at the base and walls of the pool
HS2 Clear, slightly brackish, emit bubbles gas (more than gas at the location HS1), slight smell of sulfur. The hot water temperature at the larger ponds were 450 °C and plants are often found at the base and walls of the pool
HS3 Clear, slightly brackish, emit bubbles gas (more than gas at the location HS1 and HS2), smell of sulfur (stronger
than HS1 and HS2). The hot water temperature at the larger ponds were 62 °C and plants are often found at the base and walls of the pool
CW1 Clear, the temperature about 26 °C
a b
c d
Oktoberiman et al. / Proc. Indo EBTKE-ConEx 2014
Page | 147
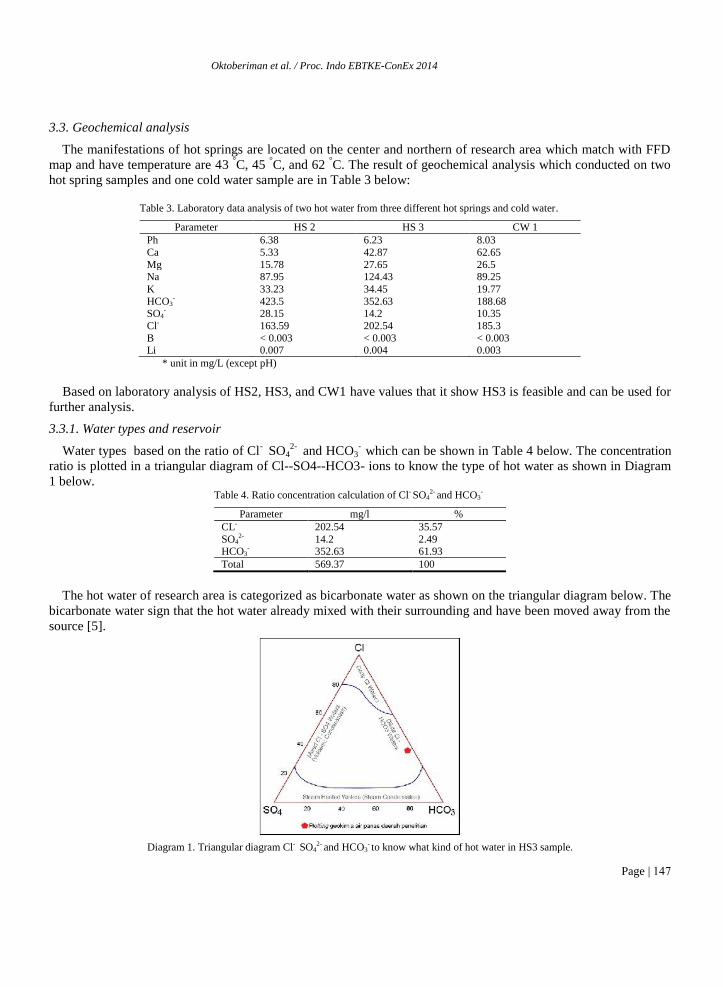
3.3. Geochemical analysis
The manifestations of hot springs are located on the center and northern of research area which match with FFD
map and have temperature are 43 °C, 45
°C, and 62
°C. The result of geochemical analysis which conducted on two
hot spring samples and one cold water sample are in Table 3 below:
Table 3. Laboratory data analysis of two hot water from three different hot springs and cold water.
Parameter HS 2 HS 3 CW 1
Ph 6.38 6.23 8.03
Ca 5.33 42.87 62.65
Mg 15.78 27.65 26.5 Na 87.95 124.43 89.25
K 33.23 34.45 19.77
HCO3- 423.5 352.63 188.68
SO4- 28.15 14.2 10.35
Cl- 163.59 202.54 185.3
B < 0.003 < 0.003 < 0.003 Li 0.007 0.004 0.003
* unit in mg/L (except pH)
Based on laboratory analysis of HS2, HS3, and CW1 have values that it show HS3 is feasible and can be used for
further analysis.
3.3.1. Water types and reservoir
Water types based on the ratio of Cl- SO4
2- and HCO3
- which can be shown in Table 4 below. The concentration
ratio is plotted in a triangular diagram of Cl--SO4--HCO3- ions to know the type of hot water as shown in Diagram
1 below. Table 4. Ratio concentration calculation of Cl- SO4
2- and HCO3-
Parameter mg/l %
CL- 202.54 35.57
SO42- 14.2 2.49
HCO3- 352.63 61.93
Total 569.37 100
The hot water of research area is categorized as bicarbonate water as shown on the triangular diagram below. The
bicarbonate water sign that the hot water already mixed with their surrounding and have been moved away from the
source [5].
Diagram 1. Triangular diagram Cl- SO42- and HCO3
- to know what kind of hot water in HS3 sample.

Oktoberiman et al./ Proc. Indo EBTKE-ConEx 2014
Page | 148
The higher content of HCO3 than SO42-
and Cl- show lateral flow mechanism which spread magmatic gas of H2S,
SO2 or CO2 from the source to another place. The data was also used to to analyze the condition of hot water
reservoir. Based on the ratio of Na+/1000, K
+/100 and √Mg
2+ , the hot water from HS3 is classified as an immature
water this also in line with the result of the triangular diagram Cl
- SO4
2- and HCO3
- where the hot water has been
interacted or mixing with ground water so the temperature of hot water reservoir is dificult to be determined.
Generally the amount of Mg in high temperature fluid is about (0.01 to 0.1) mg/L. Enhancement of Mg is caused by
the mixing of hot fluid to the groundwater which have high content of Mg about (1 to 40) mg/L. This cases are
occured in the area where HS2 and HS3 are 15.78 mg/L and 27.65 mg/L.
Tabel 5. Calculation of the concentraion ratio of Na/1000 – K/100 - √Mg of HS3 hot water.
Parameter mg/L %
Na+/1000 0.12 2.17
K+/100 0.34 6.02
√Mg2+ 5.26 91.81
Total 5.73 100
Diagram 2. Na/1000 – K/100 - √Mg chart to interprate the temperature of hot water reservoir of HS3 graphically.
Table 6. Calculation of the concentration ratio of Li-Cl/100-B/4 of HS3 water.
Parameter mg/L %
Cl-/100 1.635 9 99.71 Li+ 0.004 0.24
B/4 0.000 75 0.04
Total 1.640 65 100

Oktoberiman et al. / Proc. Indo EBTKE-ConEx 2014
Page | 149
Diagram 3. Graph Li-Cl/100-B/4 of HS3 hot water.
3.3.2. Hot water flow pattern
Based on the chemical content of all the hot spring in the research area, all the hot spring reflected the outflow
zone. The hot spring which have high number of Cl comparing B and Li represent that hot water is influenced by
vulcanomagmatic activity [6]. The ratio between Na/K and K/Mg enhancing the fact that the hot spring is occurred
in outflow zone. Therefore it can be concluded that there are interaction between hot water, ground water and the
rocks around the surface. Manifestation that occurred and influenced by vulcanomagmatic activity is depend on
relief and topography. The sulphate hot spring may be found at the top of the mountain or in upflow zone, while
chloride and bicarbonate hot spring type can be found in relatively flat relief topography or in outflow zone.
Figure 7. Conceptual model of geothermal system [6].

Oktoberiman et al./ Proc. Indo EBTKE-ConEx 2014
Page | 150
The conceptual model that describe the emergence of manifestation in research area can be used to understand the
geothermal system in Slamet Mountain. The research area is about +25 km far away from the top of Slamet
Mountain which identified as an outflow zone.
Figure 8. Schematic representation of the appearance of Bantarkawung hot springs manifestations.
Figure 9. Geological section of research area.
4. Conclusion
The research area consist of two lithology units which are Mudstone unit and sandstone unit. Geothermal
manifestation is hot spring water which appear on the center and northern research of area and accordance with
FFD. Geological aspect which control the occurence of those manifestation are sandstone unit and structures like
Pangebatan left thrust slip fault, Karangpari left thrust slip fault, Pangebatan right slip fault and Bisole right normal
slip fault which lies on the research area. The type of hot water is bicarbonate water which indicating outflow zone
of Slamet mountain geothermal system which is affected by vulcanomagmatic activity and have been interacted
with ground water.
Acknowledgements
The authors are thankful to Geological Engineering, Jenderal Soedirman University Purwokerto especially for
Mr. Sachrul Iswahyudi for support in this research.
References
[1] Kastowo (1975), “Peta Geologi, Lembar Majenang, Jawa, Skala 1:100.000”, Direktorat Geologi, Departemen Pertambangan Republik
Indonesia.
Geological Section A-B
Skala V:H = 1:1
Oktoberiman et al. / Proc. Indo EBTKE-ConEx 2014
Page | 151
[2] Bujung, A.N. Cyrke, S. Alamte, M. Dicky, H. Febri ,dan S. Adjat. 2011. Identifikasi prospek panas bumi berdasarkan Fault and
Fracture Density (FFD):Studi kasus Gunung Patuha, Jawa Barat, Jurnal Lingkungan dan Bencana Geologi, Vol. 2 No. 1 April 2011
2011: 67 – 75.
[3] Nicholson, K. (1993), “Geothermal Fluids, Chemistry and Exploration Techniques”, Springer Verlag, Berlin, 15.
[4] Siswono, Yupi. Y.Listiawan, and R. Sahri. Galunggung Geothermal Prospect Condition: An Assesment For Further
Development”Prosiding Seminar Kebumian Ke-6 Teknik Geologi Universitas Gadjah Mada, 11-12 Desember 2013.
[5] Iswahyudi, Sachrul. A. Widagdo, Subana, N. R. Herdianita (2013),“Outflow Zone Indication of Geothermal System In Paguyangan
Hotspring, Brebes, Central Java” PROCEEDINGS, 2nd ITB Geothermal Workshop 2013.
[6] Hochstein, M. P. dan Browne, P. R. L., 2000, Surface Manifestations of Geothermal Systems with Volcanic Heat Source.
In Encyclopedia of Volcanoes (editor: Sirgudsson, H., Houghton, B., McNutt, S. R., Rymer, H., Stix, J.), Academic Press, San
Diego.