identifi analytics portal - basic document functionality
TRANSCRIPT
Confidential – Do Not Distribute 1
Identifi Analytics Portal - Basic Document Functionality This guide provides an overview of the basic document functionality within the Identifi Analytics Portal to allow you to take full advantage of the analytic capabilities offered.
Table of Contents
Table of Contents .................................................................................................................. 1
Introduction to Documents..................................................................................................... 2
Navigation Tools ................................................................................................................... 5
Interactive features of documents in Presentation View ........................................................ 6
Group By ............................................................................................................................ 6
Quick View Icon .................................................................................................................. 7
Sorting the Content ............................................................................................................. 8
Presentation View Menu ..................................................................................................... 9
Selectors ............................................................................................................................. 12
Filter the data displayed .....................................................................................................12
Control which attributes or metrics are shown on a grid/graph ...........................................13
Flip through panels in a panel stack ...................................................................................15
Filter other selectors ..........................................................................................................15
Drilling to Different Levels ................................................................................................... 17
Using the History List .......................................................................................................... 18
Saving documents in your Personal Folder ......................................................................... 21
Additional Help .................................................................................................................... 21
Confidential – Do Not Distribute 2
Introduction to Documents
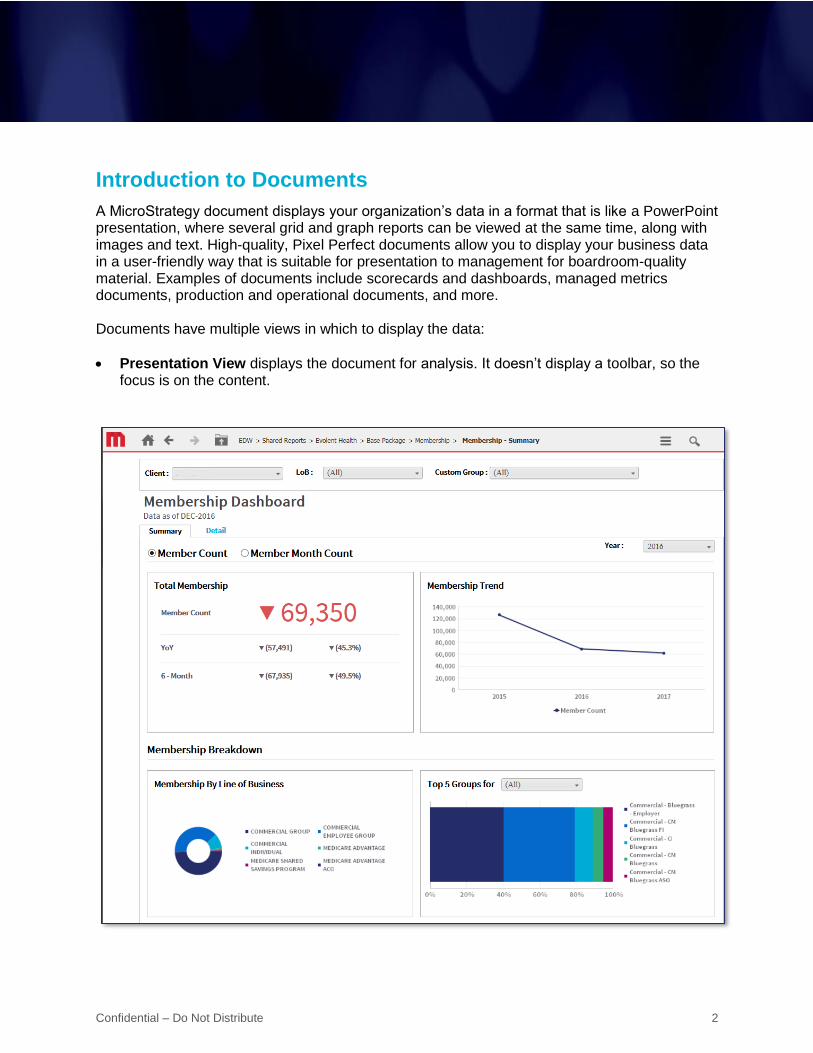
A MicroStrategy document displays your organization’s data in a format that is like a PowerPoint presentation, where several grid and graph reports can be viewed at the same time, along with images and text. High-quality, Pixel Perfect documents allow you to display your business data in a user-friendly way that is suitable for presentation to management for boardroom-quality material. Examples of documents include scorecards and dashboards, managed metrics documents, production and operational documents, and more. Documents have multiple views in which to display the data:
Presentation View displays the document for analysis. It doesn’t display a toolbar, so the focus is on the content.
Confidential – Do Not Distribute 3
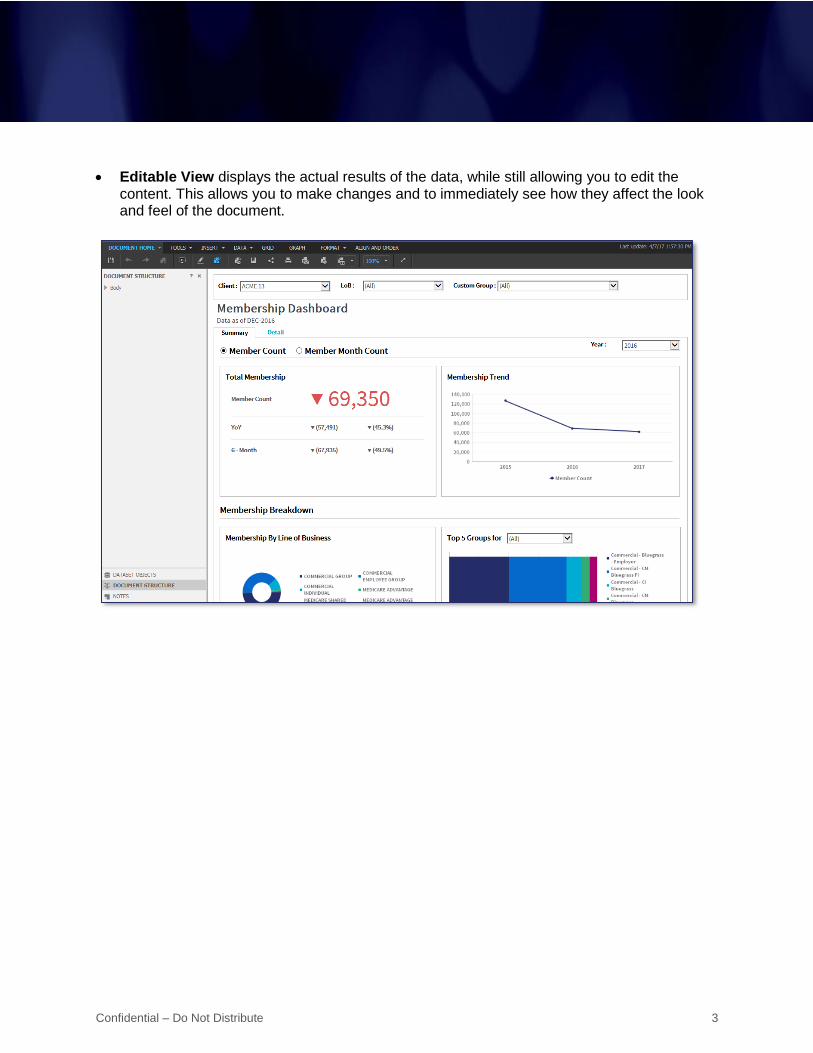
Editable View displays the actual results of the data, while still allowing you to edit the content. This allows you to make changes and to immediately see how they affect the look and feel of the document.
Confidential – Do Not Distribute 4
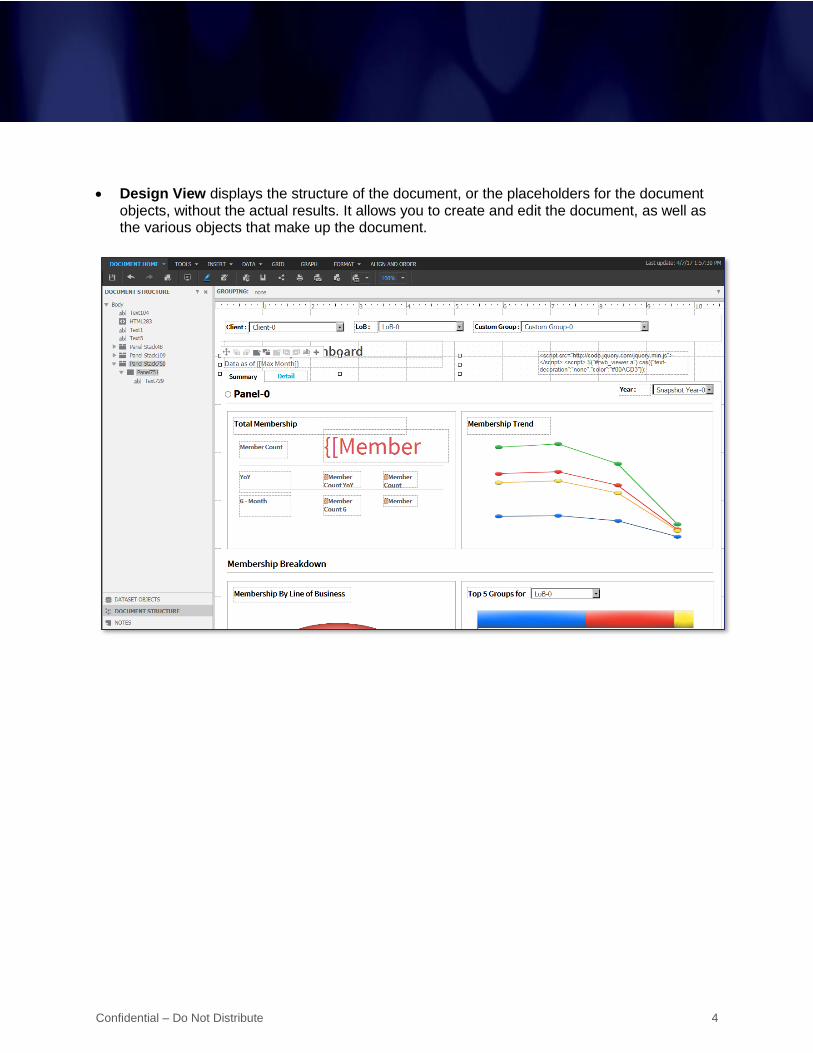
Design View displays the structure of the document, or the placeholders for the document objects, without the actual results. It allows you to create and edit the document, as well as the various objects that make up the document.
Confidential – Do Not Distribute 5
Navigation Tools
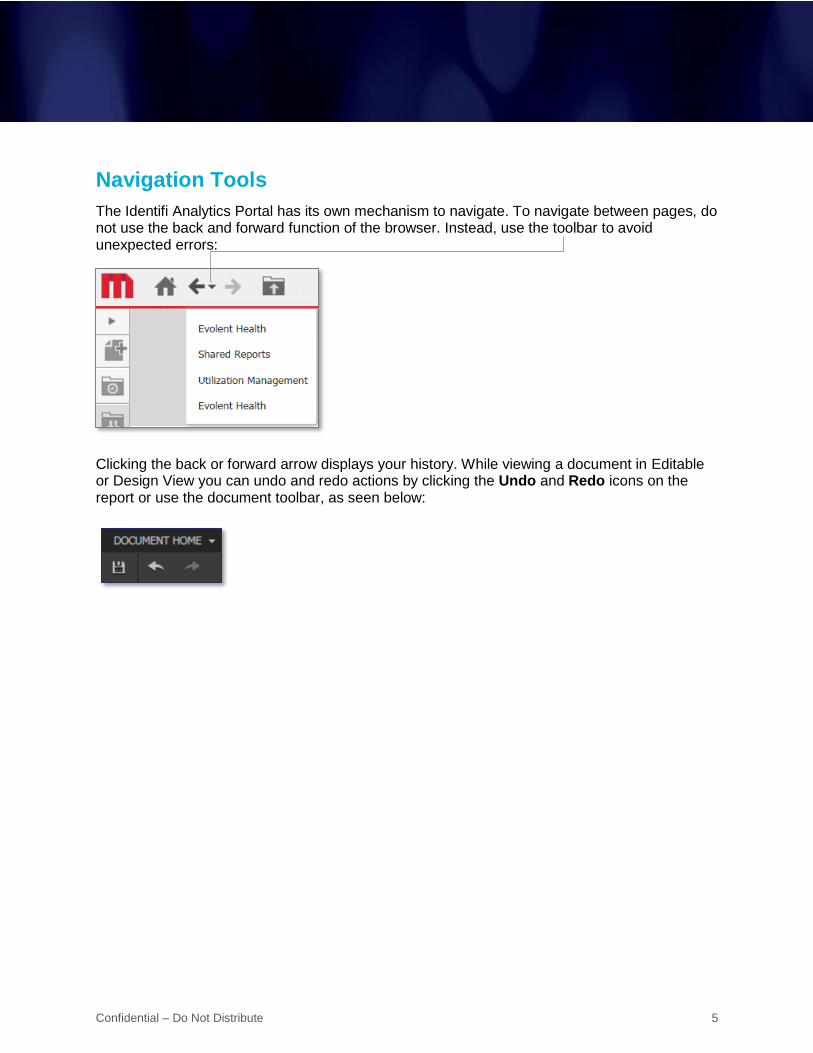
The Identifi Analytics Portal has its own mechanism to navigate. To navigate between pages, do not use the back and forward function of the browser. Instead, use the toolbar to avoid unexpected errors:
Clicking the back or forward arrow displays your history. While viewing a document in Editable or Design View you can undo and redo actions by clicking the Undo and Redo icons on the report or use the document toolbar, as seen below:
Confidential – Do Not Distribute 6
Interactive features of documents in Presentation View
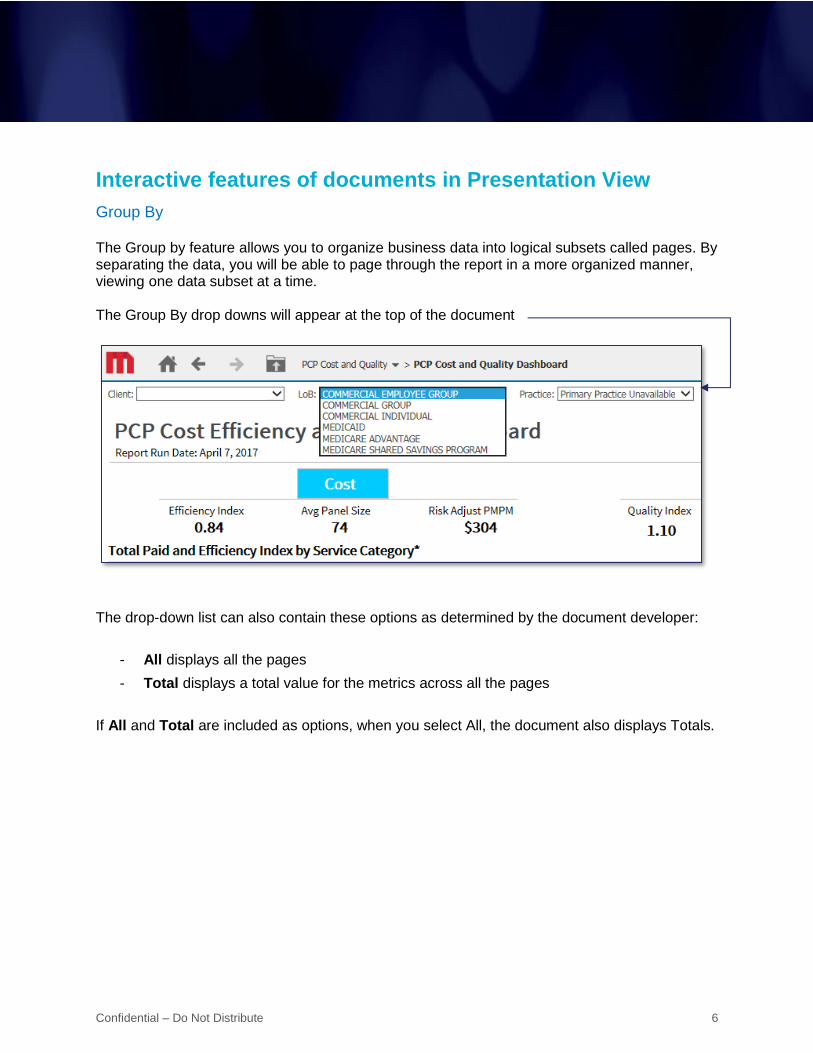
Group By The Group by feature allows you to organize business data into logical subsets called pages. By separating the data, you will be able to page through the report in a more organized manner, viewing one data subset at a time. The Group By drop downs will appear at the top of the document
The drop-down list can also contain these options as determined by the document developer:
- All displays all the pages
- Total displays a total value for the metrics across all the pages
If All and Total are included as options, when you select All, the document also displays Totals.
Confidential – Do Not Distribute 7
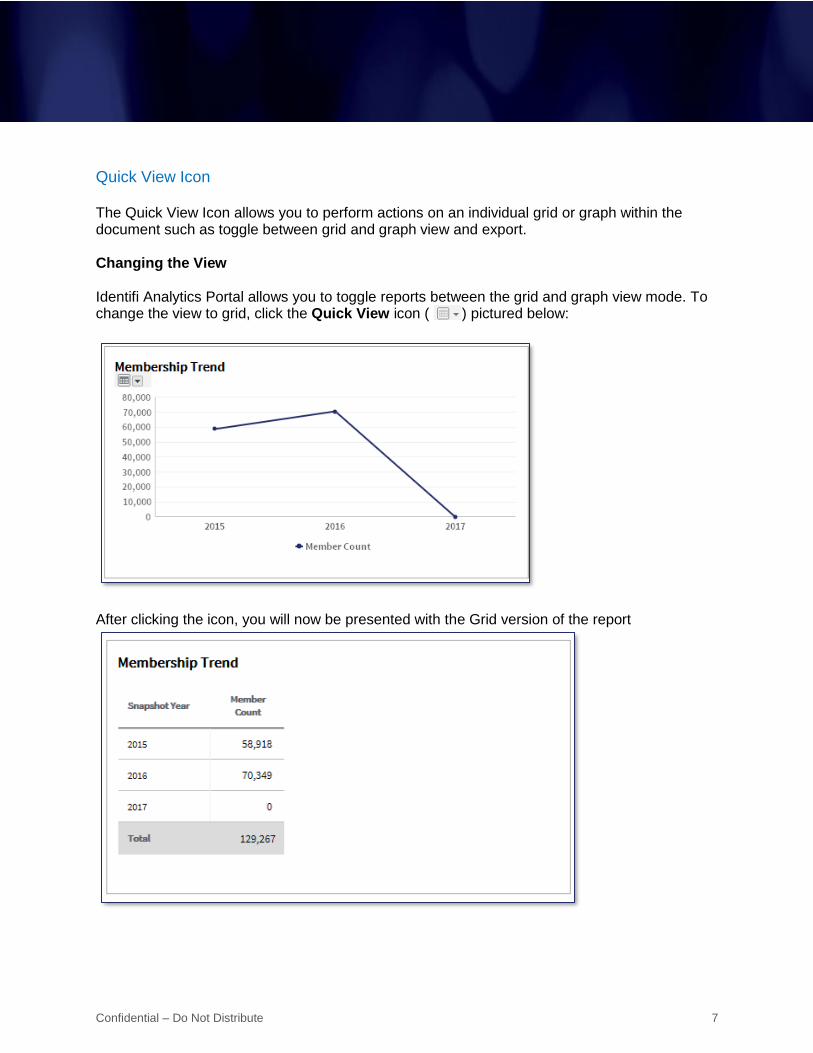
Quick View Icon The Quick View Icon allows you to perform actions on an individual grid or graph within the document such as toggle between grid and graph view and export. Changing the View Identifi Analytics Portal allows you to toggle reports between the grid and graph view mode. To change the view to grid, click the Quick View icon ( ) pictured below:
After clicking the icon, you will now be presented with the Grid version of the report
Confidential – Do Not Distribute 8
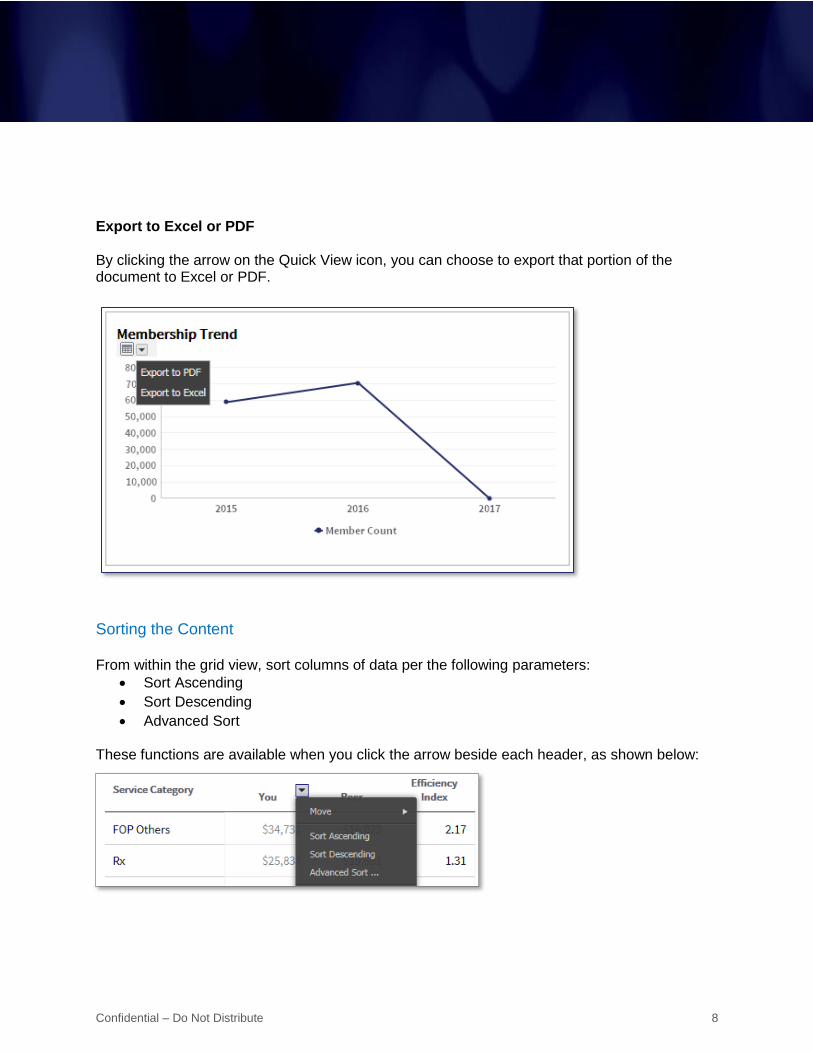
Export to Excel or PDF By clicking the arrow on the Quick View icon, you can choose to export that portion of the document to Excel or PDF.
Sorting the Content From within the grid view, sort columns of data per the following parameters:
Sort Ascending
Sort Descending
Advanced Sort These functions are available when you click the arrow beside each header, as shown below:
Confidential – Do Not Distribute 9
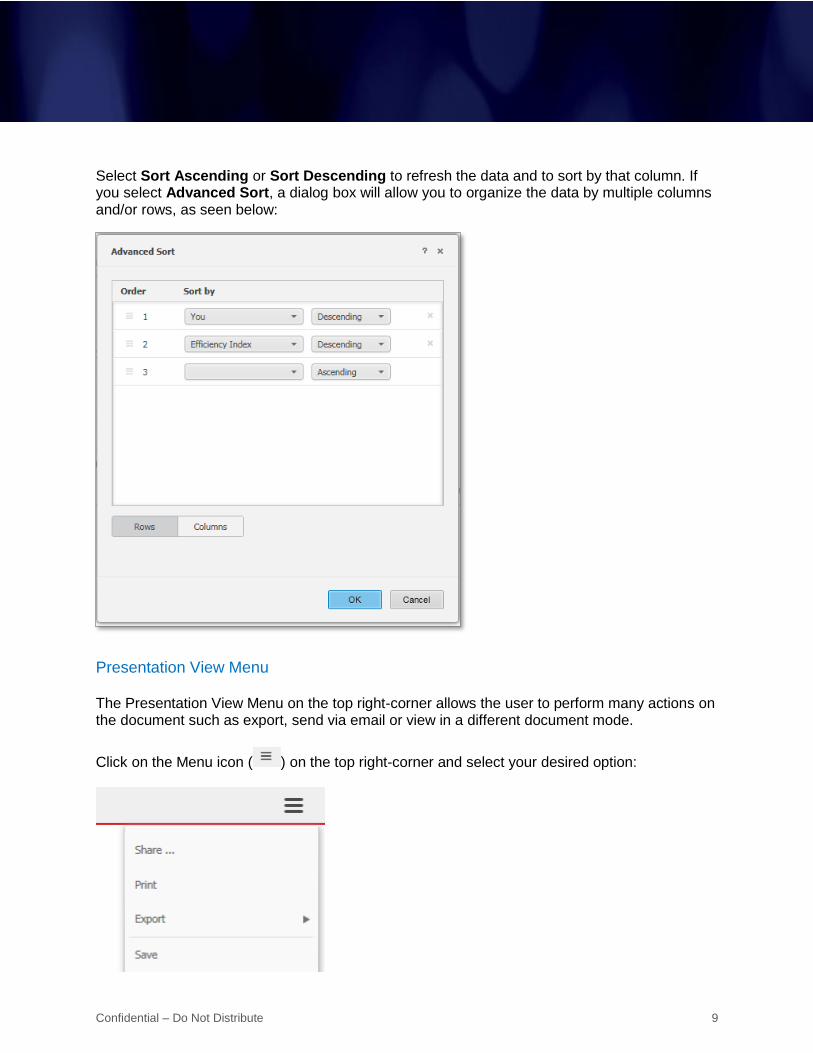
Select Sort Ascending or Sort Descending to refresh the data and to sort by that column. If you select Advanced Sort, a dialog box will allow you to organize the data by multiple columns and/or rows, as seen below:
Presentation View Menu The Presentation View Menu on the top right-corner allows the user to perform many actions on the document such as export, send via email or view in a different document mode.
Click on the Menu icon ( ) on the top right-corner and select your desired option:
Confidential – Do Not Distribute 10
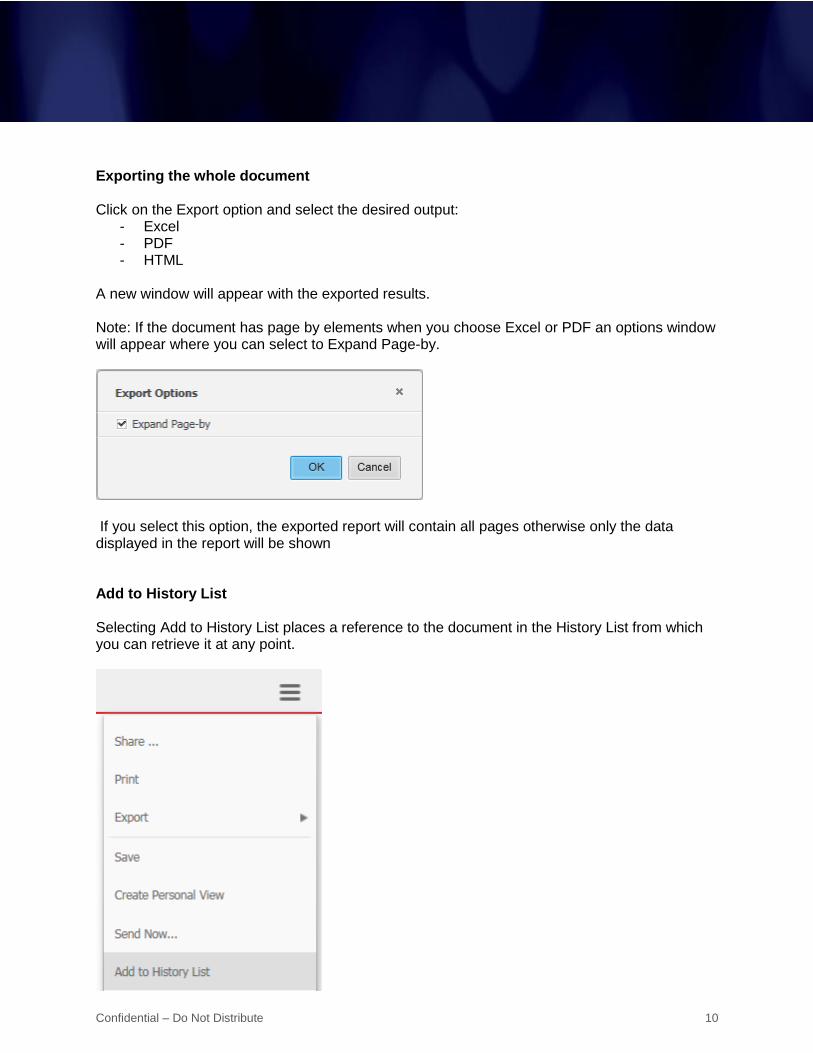
Exporting the whole document Click on the Export option and select the desired output:
- Excel - PDF - HTML
A new window will appear with the exported results. Note: If the document has page by elements when you choose Excel or PDF an options window will appear where you can select to Expand Page-by.
If you select this option, the exported report will contain all pages otherwise only the data displayed in the report will be shown Add to History List Selecting Add to History List places a reference to the document in the History List from which you can retrieve it at any point.
Confidential – Do Not Distribute 11
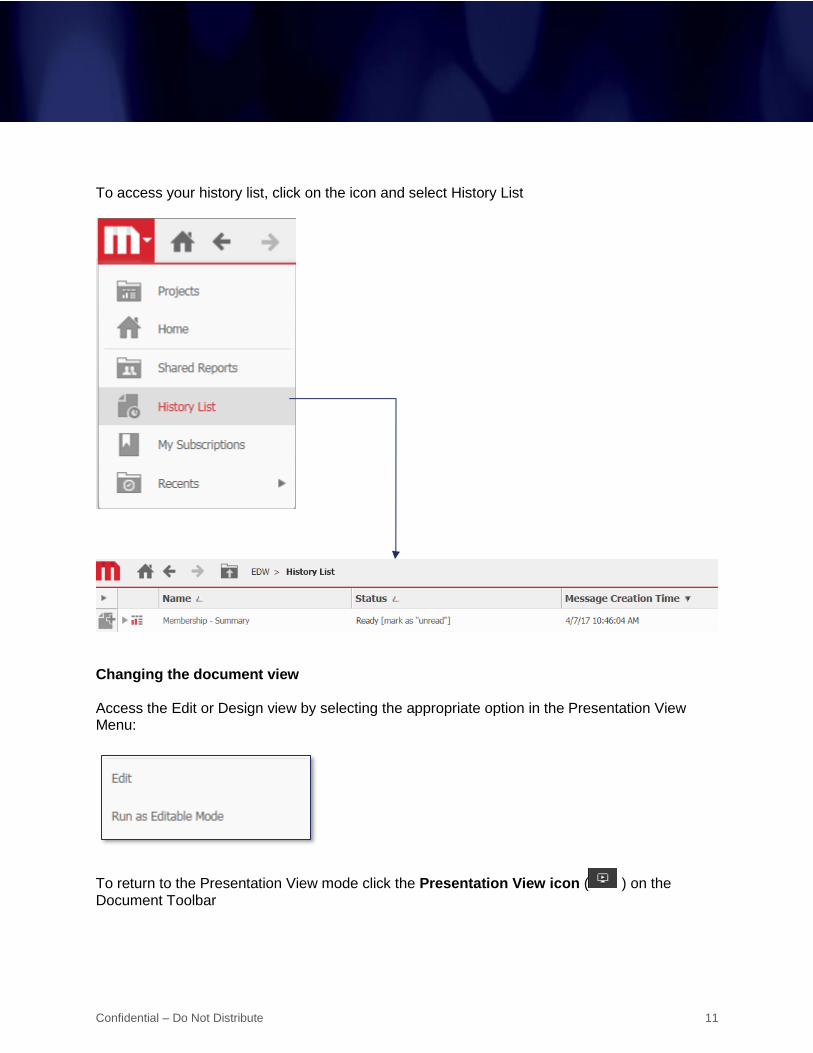
To access your history list, click on the icon and select History List
Changing the document view Access the Edit or Design view by selecting the appropriate option in the Presentation View Menu:
To return to the Presentation View mode click the Presentation View icon ( ) on the Document Toolbar
Confidential – Do Not Distribute 12
Selectors
Selectors allow users to change how they see the data. Selectors have different display types and appear as a button bar, list, calendar, checkboxes, radio buttons and others. In addition, a grid/graph can act as a selector. A selector can:
- Filter the data displayed on a grid/graph - Control which attributes or metrics are shown on a grid/graph - Flip between panels in a panel stack - Filter other selectors
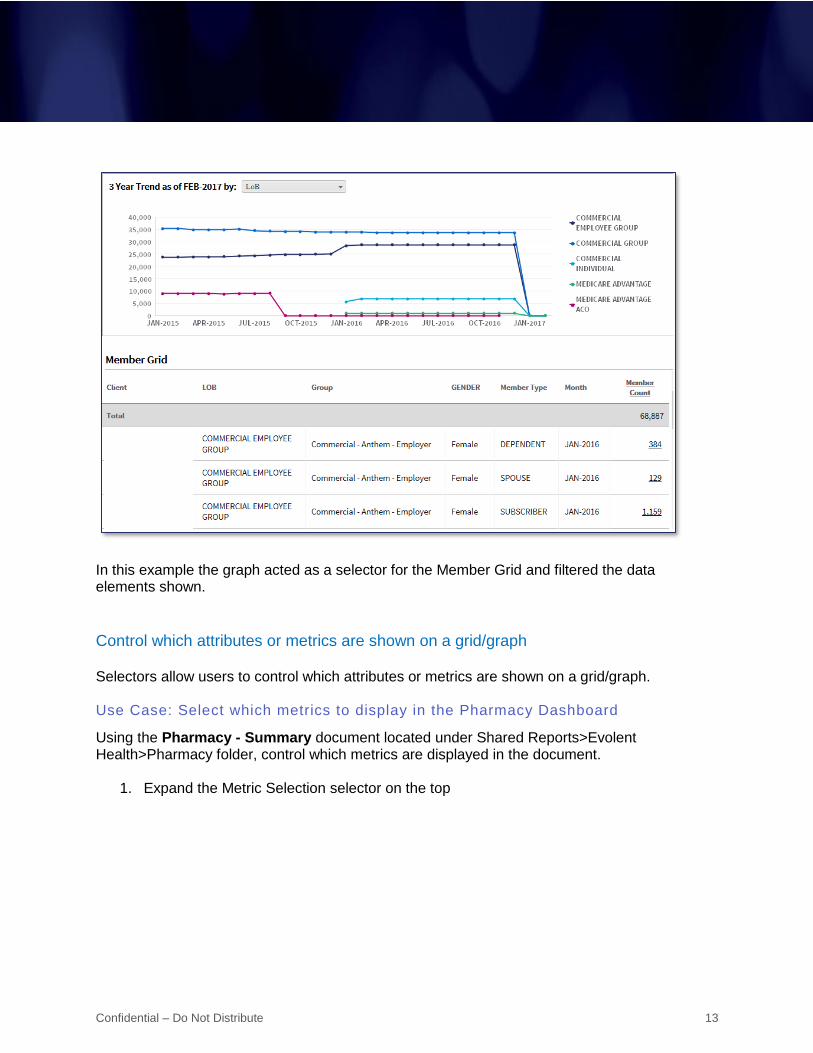
Filter the data displayed A selector can allow you to select which data elements to display on the grid/graph. For example, if you have a selector on LoB that targets a grid, when you select ‘Commercial Group’, the grid will update and show only values for that LoB. Use Case: Filter the Detail Grid on Membership Summary by month
Run the Membership Summary document located under Shared Reports>Evolent Health>Base Package>Membership folder.
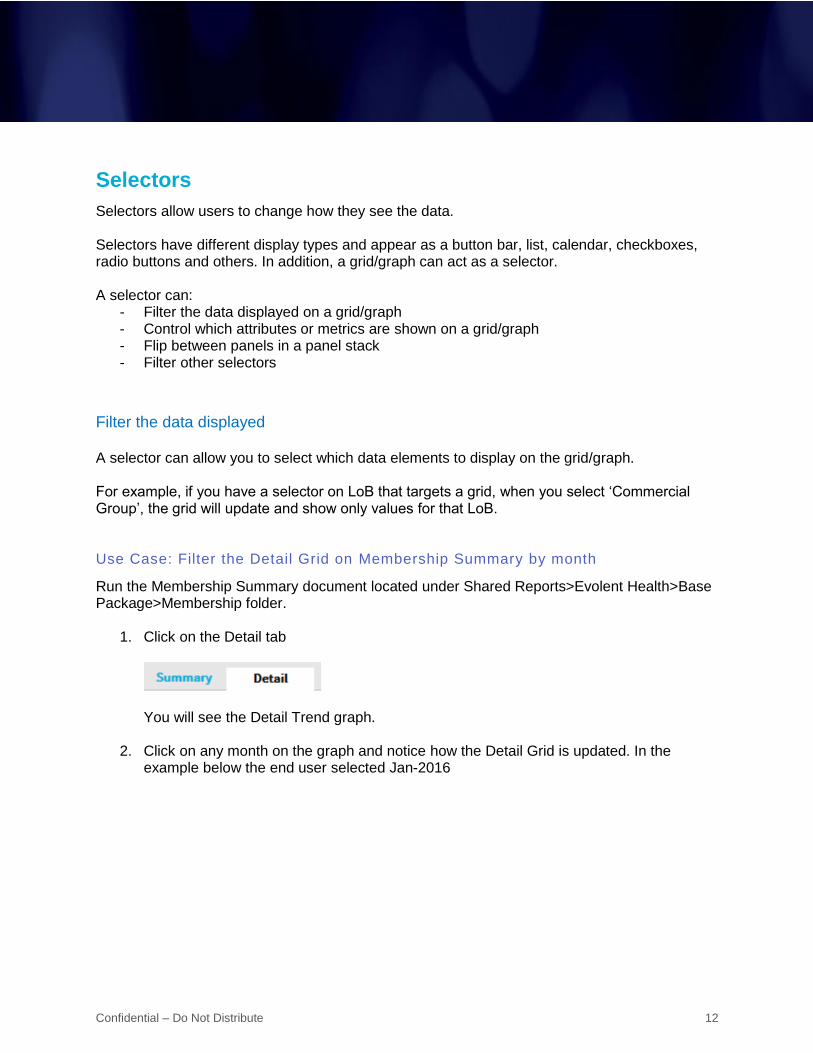
1. Click on the Detail tab
You will see the Detail Trend graph.
2. Click on any month on the graph and notice how the Detail Grid is updated. In the
example below the end user selected Jan-2016
Confidential – Do Not Distribute 13
In this example the graph acted as a selector for the Member Grid and filtered the data elements shown.
Control which attributes or metrics are shown on a grid/graph Selectors allow users to control which attributes or metrics are shown on a grid/graph. Use Case: Select which metrics to display in the Pharmacy Dashboard
Using the Pharmacy - Summary document located under Shared Reports>Evolent Health>Pharmacy folder, control which metrics are displayed in the document.
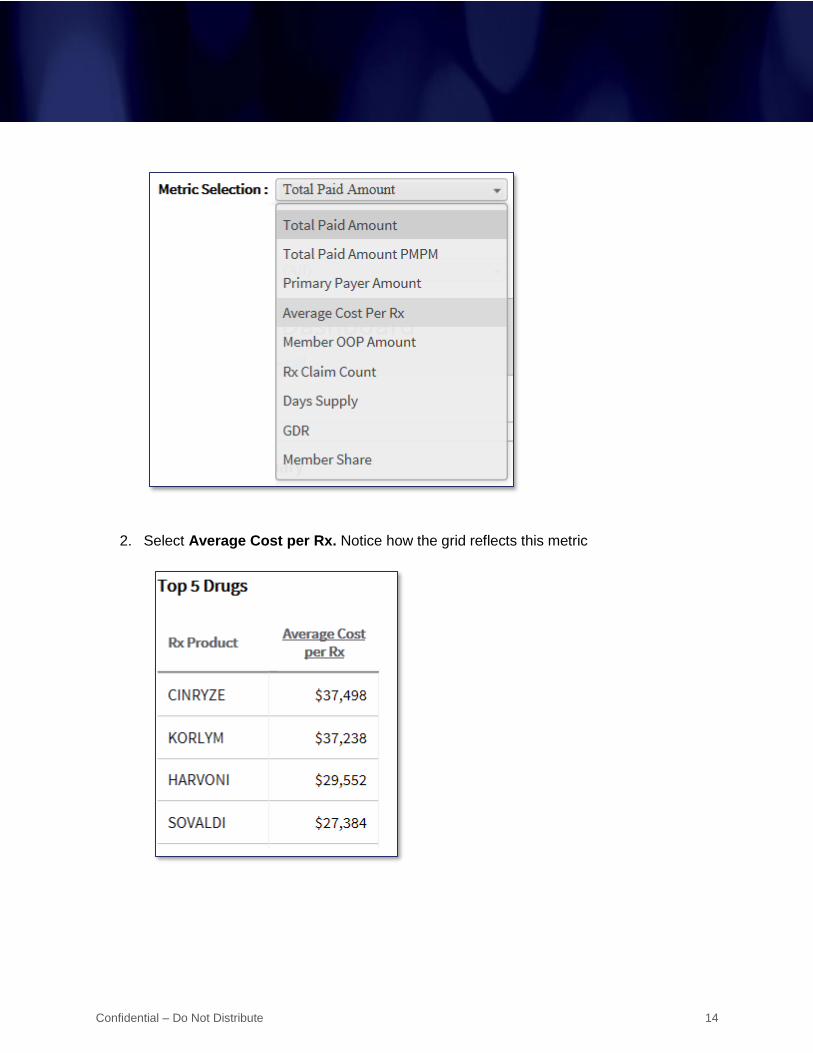
1. Expand the Metric Selection selector on the top
Confidential – Do Not Distribute 14
2. Select Average Cost per Rx. Notice how the grid reflects this metric
Confidential – Do Not Distribute 15
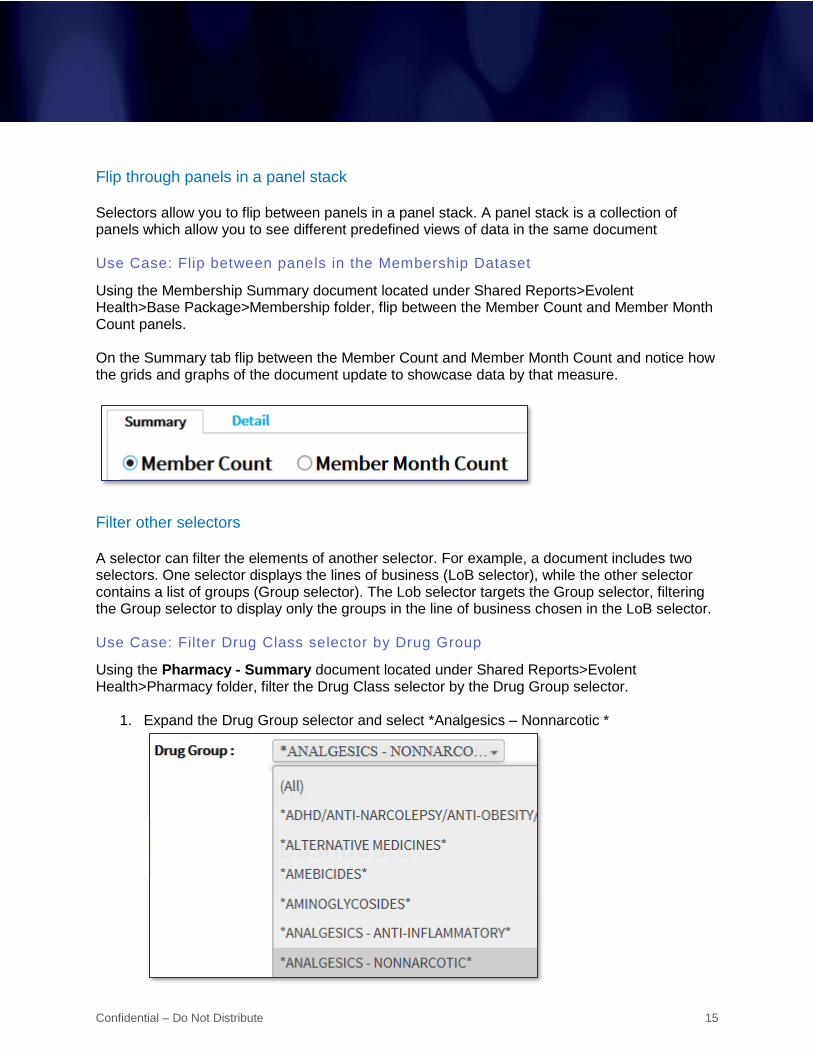
Flip through panels in a panel stack Selectors allow you to flip between panels in a panel stack. A panel stack is a collection of panels which allow you to see different predefined views of data in the same document Use Case: Flip between panels in the Membership Dataset
Using the Membership Summary document located under Shared Reports>Evolent Health>Base Package>Membership folder, flip between the Member Count and Member Month Count panels. On the Summary tab flip between the Member Count and Member Month Count and notice how the grids and graphs of the document update to showcase data by that measure.
Filter other selectors A selector can filter the elements of another selector. For example, a document includes two selectors. One selector displays the lines of business (LoB selector), while the other selector contains a list of groups (Group selector). The Lob selector targets the Group selector, filtering the Group selector to display only the groups in the line of business chosen in the LoB selector. Use Case: Filter Drug Class selector by Drug Group
Using the Pharmacy - Summary document located under Shared Reports>Evolent Health>Pharmacy folder, filter the Drug Class selector by the Drug Group selector.
1. Expand the Drug Group selector and select *Analgesics – Nonnarcotic *
Confidential – Do Not Distribute 16
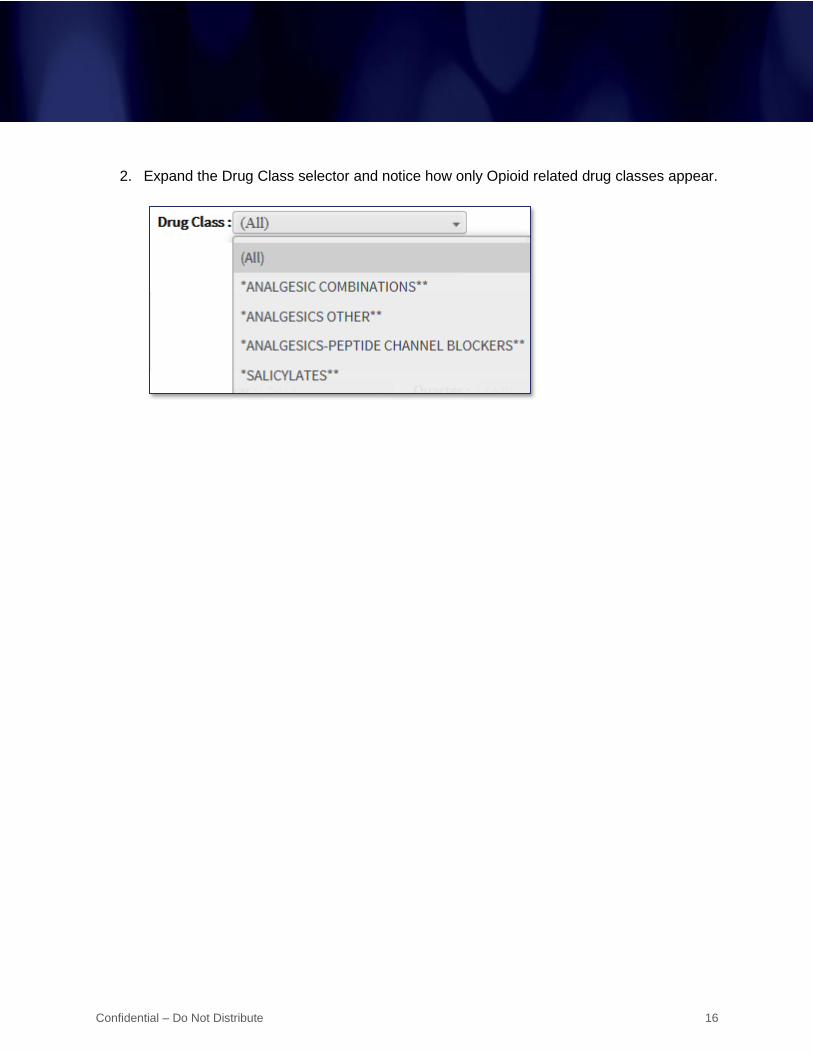
2. Expand the Drug Class selector and notice how only Opioid related drug classes appear.
Confidential – Do Not Distribute 17
Drilling to Different Levels
Drilling allows you to view data at levels other than the one displayed. You can drill down, up or across different attributes.
Drilling down allows access to data at progressively lower levels within a hierarchy. For example, if the attribute level displayed is Region, drilling down would allow you to see information at the State, City, or Store level.
Broaden the scope of information by drilling up to levels of data within a hierarchy. For example, if Time is shown at the date level, drilling up could display information at the Week, Month, or Quarter level.
Drill across one attribute to another, either within a hierarchy or across hierarchies. You can drill in any direction, which gives you the flexibility to find specific element values.
Drilling is configured and enabled by the document developer. If configured it will appear as a hyperlink. Hover over hyperlinks found in the document to view the defined drill paths.
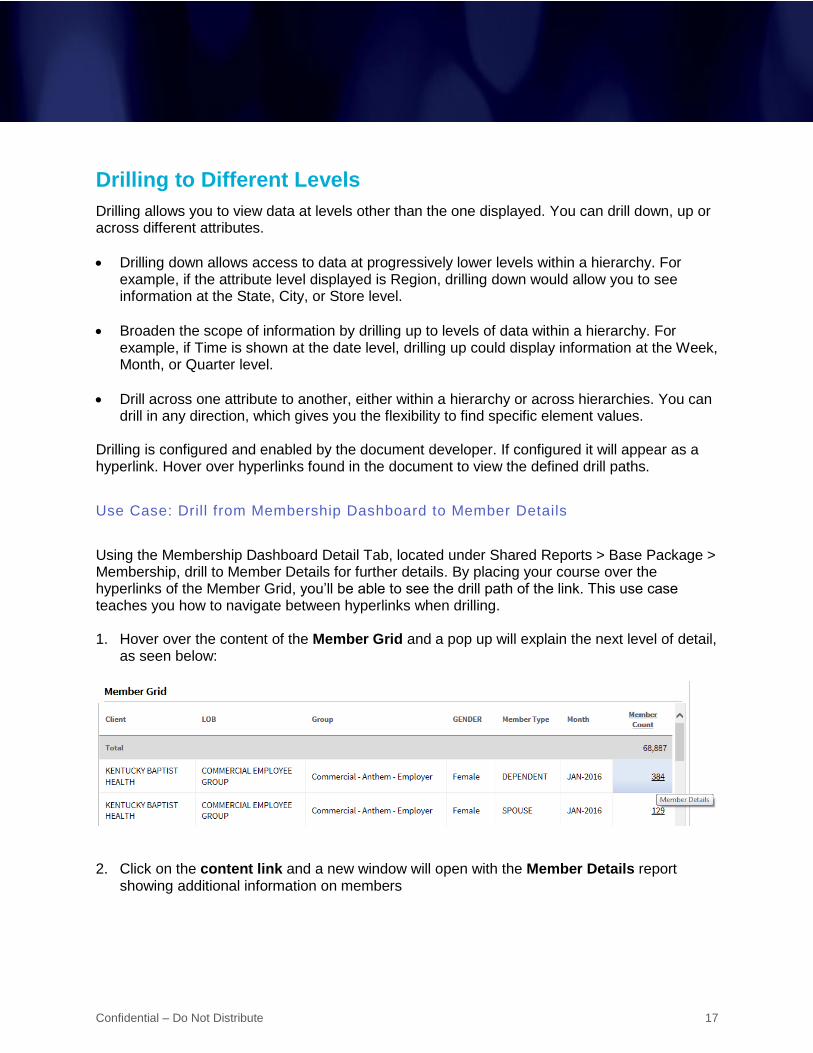
Use Case: Drill from Membership Dashboard to Member Details
Using the Membership Dashboard Detail Tab, located under Shared Reports > Base Package > Membership, drill to Member Details for further details. By placing your course over the hyperlinks of the Member Grid, you’ll be able to see the drill path of the link. This use case teaches you how to navigate between hyperlinks when drilling. 1. Hover over the content of the Member Grid and a pop up will explain the next level of detail,
as seen below:
2. Click on the content link and a new window will open with the Member Details report
showing additional information on members
Confidential – Do Not Distribute 18
Using the History List
Your history list is an area where you can store reports and documents for later retrieval. The History List is useful for:
Keeping shortcuts to previously run reports and documents
Performing asynchronous report and document execution For example, multiple reports can be run at the same time within one browser and retrieved via the History List.
Viewing the results of scheduled reports and documents Placing a report or document in the History List You can add reports or documents to the History List from three different environments:
While executing
While viewing
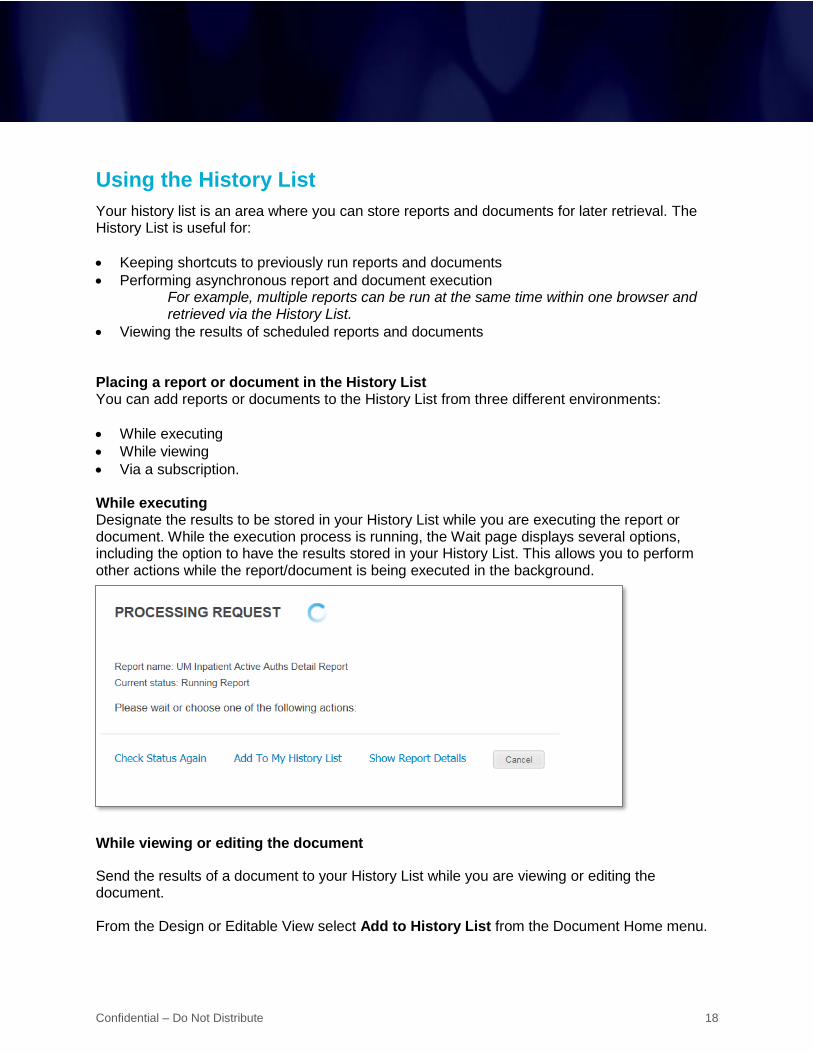
Via a subscription. While executing Designate the results to be stored in your History List while you are executing the report or document. While the execution process is running, the Wait page displays several options, including the option to have the results stored in your History List. This allows you to perform other actions while the report/document is being executed in the background.
While viewing or editing the document
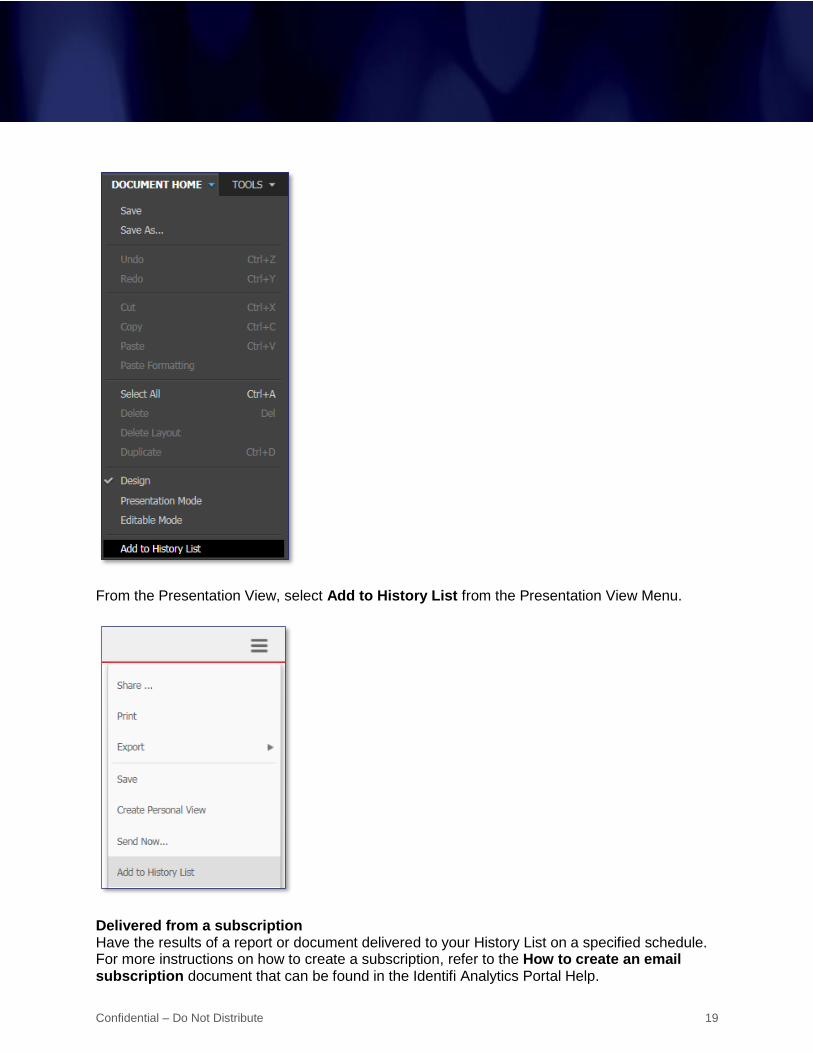
Send the results of a document to your History List while you are viewing or editing the document. From the Design or Editable View select Add to History List from the Document Home menu.
Confidential – Do Not Distribute 19
From the Presentation View, select Add to History List from the Presentation View Menu.
Delivered from a subscription Have the results of a report or document delivered to your History List on a specified schedule. For more instructions on how to create a subscription, refer to the How to create an email subscription document that can be found in the Identifi Analytics Portal Help.
Confidential – Do Not Distribute 20
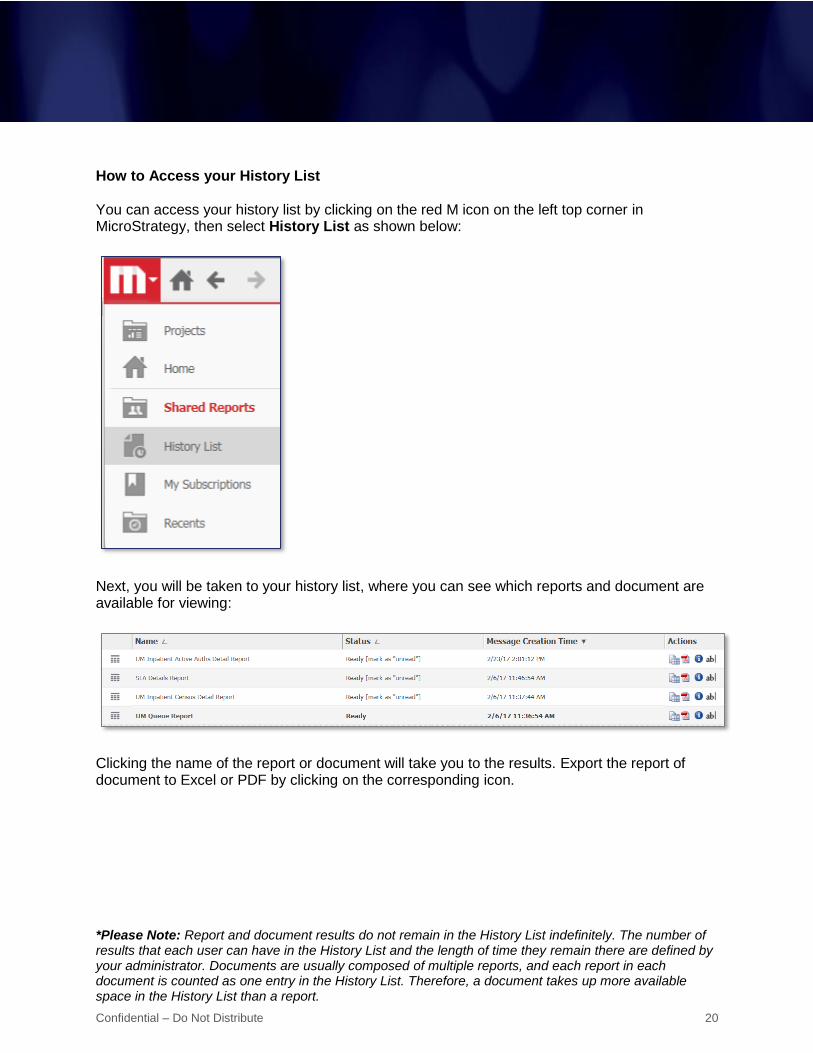
How to Access your History List You can access your history list by clicking on the red M icon on the left top corner in MicroStrategy, then select History List as shown below:
Next, you will be taken to your history list, where you can see which reports and document are available for viewing:
Clicking the name of the report or document will take you to the results. Export the report of document to Excel or PDF by clicking on the corresponding icon.
*Please Note: Report and document results do not remain in the History List indefinitely. The number of results that each user can have in the History List and the length of time they remain there are defined by your administrator. Documents are usually composed of multiple reports, and each report in each document is counted as one entry in the History List. Therefore, a document takes up more available space in the History List than a report.
Confidential – Do Not Distribute 21
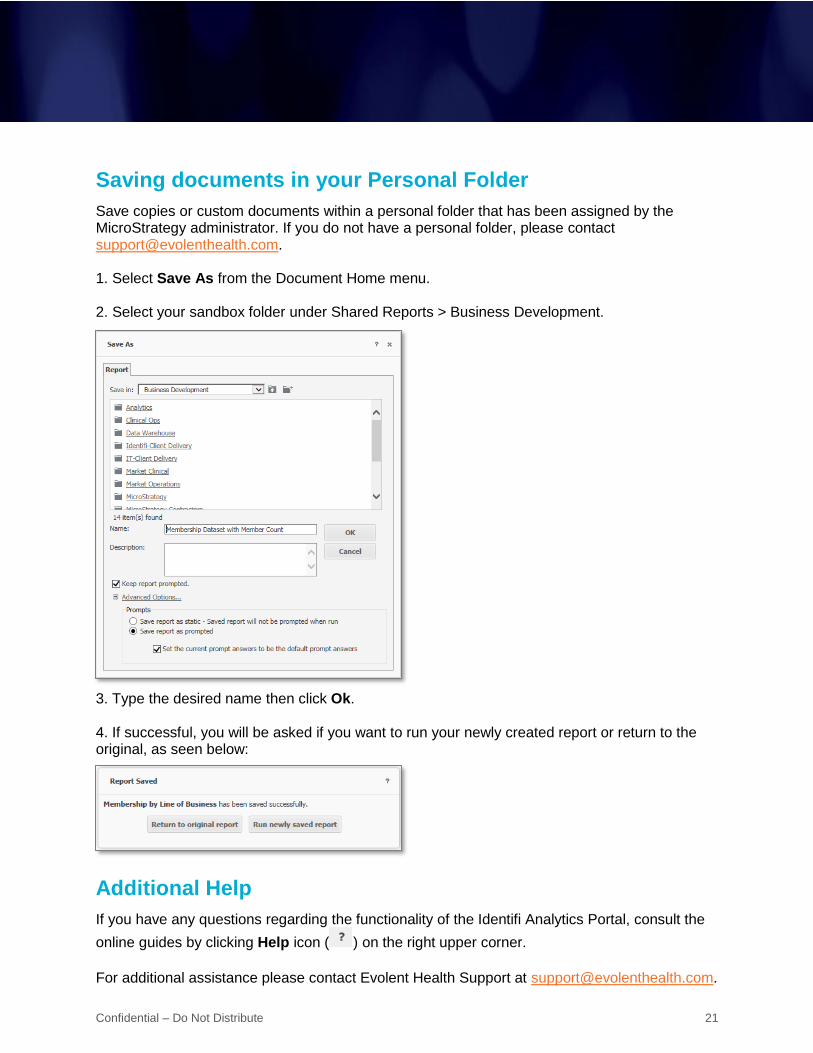
Saving documents in your Personal Folder
Save copies or custom documents within a personal folder that has been assigned by the MicroStrategy administrator. If you do not have a personal folder, please contact [email protected]. 1. Select Save As from the Document Home menu. 2. Select your sandbox folder under Shared Reports > Business Development.
3. Type the desired name then click Ok. 4. If successful, you will be asked if you want to run your newly created report or return to the original, as seen below:
Additional Help
If you have any questions regarding the functionality of the Identifi Analytics Portal, consult the
online guides by clicking Help icon ( ) on the right upper corner.
For additional assistance please contact Evolent Health Support at [email protected].