identification of plastic type and surface roughness of
TRANSCRIPT

chemosensors
Article
Identification of Plastic Type and Surface Roughnessof Film-Type Plastics in Water UsingKramers–Kronig Analysis
Boniphace Elphace Kanyathare 1,2,*, Benjamin Asamoah 1 , Muhammad Umair Ishaq 1,James Amoani 1 , Jukka Räty 3 and Kai-Erik Peiponen 1,*
1 Department of Physics and Mathematics, University of Eastern Finland, FI-80100 Joensuu, Finland;[email protected] (B.A.); [email protected] (M.U.I.); [email protected] (J.A.)
2 Department of Electronics and Telecommunication Engineering, Dar Es Salaam Institute of Technology,2958 Dar Es Salaam, Tanzania
3 MITY, University of Oulu, Technology Park, FI-87400 Kajaani, Finland; [email protected]* Correspondence: [email protected] (B.E.K.); [email protected] (K.-E.P.)
Received: 29 August 2020; Accepted: 21 September 2020; Published: 23 September 2020�����������������
Abstract: The knowledge of the plastic type, thickness, and the nature of the surface is importanttowards the monitoring of microplastic pollution in water bodies, especially when vis-NIR spectroscopyis utilized. Factors such as complex environment and surface roughness induced-light scattering ofthe probing light limit the optical detection of these parameters in in-situ measurements, however.In this paper, a novel application of Kramers–Kronig analysis was exploited to identify both smoothand rough film-type macroplastics with unknown thickness. This method is particularly useful inthe in-situ identification of unknown film-like macroplastics; although the sample is large, the ratiofunction is detected from an area that corresponds to the size of a MP. Therefore, it can be applied forthe case of large size MPs. The validity of the method was demonstrated using transmittance data forsmooth and roughened plastics given in Kanyathare et al., 2020.
Keywords: microplastic; Kramers–Kronig relation; surface roughness; transmittance; vis-NIR spectroscopy
1. Introduction
Microplastic (MP) pollution of water bodies enables, for example, the growth and transfer ofbacteria, especially when the MPs are rough, rendering it a substrate for toxic contaminants [1]. Sourcesof microplastic pollution include pristine transparent plastic films commonly used for food preservationand packaging. Unlike other plastic types, plastic films can decompose into film-type MPs, namelymacroplastics, that appear both in natural aquatic environments and municipal wastewaters. In water,the colorless and translucent plastic films turn transparent. On the other hand, colored plastic filmscan fade and become translucent in water, complicating the method of detection.
Microplastics pollution endangers the health of humans and water-inhabitant species [1,2].In addition to organism-related issues, microplastic pollution also threatens water quality, requiringan urgent need to develop techniques for the in-situ detection of MPs in natural water bodies andmunicipal water treatment systems.
Several optical methods have been developed for the detection of plastics. For example, remotesensing of floating microplastics by airborne hyperspectral imaging has been demonstrated [3].However, in the case of microplastic detection embedded in water, the same method will require furtherdevelopment. Typically, to detect these microplastics, they are harvested from aquatic environmentsand measured as dry samples to avoid the attenuation of radiation. This technique is performed tolimit water absorption [4] in the near infrared (NIR) spectral range. However, the existence of different
Chemosensors 2020, 8, 88; doi:10.3390/chemosensors8040088 www.mdpi.com/journal/chemosensors
Chemosensors 2020, 8, 88 2 of 13
second and third-order overtones for hydrocarbons of different plastic types in the vicinity of 1200nm [3–5], where water absorption is not so strong, can be exploited for plastic identification. Despitethe challenge of water absorption, Vázquez-Guardado et al. used a multispectral infrared spectroscopictechnique to successfully classify 12 plastic resins found in municipal waste by considering plasticsin the air [6]. Peiponen et al. have also demonstrated the possibility to detect and identify smoothplastics embedded in water by using the transmission spectrum in the NIR region, making use ofthe known sample thickness [7]. Recently, other interesting techniques, such as surface-enhancedRaman spectroscopy [8], laser-based photoluminescence [9], and integrated holography and Ramanspectroscopy [10], have been proposed for the detection of microplastics. These methods exploit thespectral properties of plastics in their detection.
In addition to the spectral properties of the plastics, physical properties, such as the size and surfacetexture, which are dependent on mechanical and chemical erosion in aquatic environments, also influencethe measured signal. The erosion causes, for example, surface roughening of the microplastic [11].Surface roughness is an indication of the aging of the microplastic and also serves as a substratefor bacterial and virus growth [12–14] and contamination by toxic materials such as metals [2] andantibiotics [15]. Hence, it is important to obtain information on the surface roughness of microplastics.Recently, we have suggested optical sensing techniques to monitor colorless flat or curved MPs withsurface roughness in water [16–18]. In [18], we used a priori known thickness of plastics for monitoringof the surface roughness of the plastics. However, for field measurement conditions, both the thicknessand the plastic type are unknown and an analytical method like Kramers–Kronig (K-K) is better suitedfor such a problem.
In this work, we apply a non-conventional K-K relation [19] on inverting transmittance forthe identification of smooth (pristine) and rough film-type macroplastics with unknown thickness.The macroplastics were prepared from common plastics that are commonly found in wastewater [20].Despite the dominance of secondary microplastics of these plastics with common morphologies suchas fiber, particles, and foam, film-type macroplastics pollution is also emerging [21]. We, therefore,consider such film-type macroplastics which can be easily probed with a spectrophotometer at an areathat corresponds to the size of a MP. Henceforth, we refer to all the film-type macroplastics in thisstudy as macroplastics for simplicity. Using the K-K relation and the measured transmittance of themacroplastics, we respectively calculate the change in the optical path and the attenuation lengths; anddetermine the ratio (curves) of the two parameters. We validate the method of ratio curves using thetransmittance data of smooth and rough macroplastics presented in [18].
The key point is to exploit a library of ratio curves obtained from the intrinsic optical properties ofthe plastics for the identification of plastic type and the determination of their surface roughness in theaquatic environment. A similar concept of the ratio curve was presented in [22] for a non-scatteringmedium, however, using the product of sample thickness and complex refractive index change. Here,the novel feature in the application of the ratio curves is that the sample thickness is irrelevant inthe frame of macroplastics. Additionally, the ratio curves are applied to screen both non-scatteringand diffuse samples. The diffuse samples scatter incident vis-NIR radiation due to the presence ofsurface roughness. We further remark that the K-K analysis, although in a different form than what ispresented in this study, has been previously applied in detecting concealed diffuse objects [23]. Thisstudy is useful towards the developing of optical sensors for the identification of smooth and roughMPs in wastewater and in other aquatic environments.
2. Theory
When light interacts with media such as microplastic, several phenomena such as reflection,refraction, absorption and transmission might be involved. The strength or weakness of these phenomenadepends on what is known as the wavelength-dependent complex refractive index of the medium.The complex refractive index is expressed as N = n + ik, where n and k denote the real refractive indexand the so-called absorption index of the medium, respectively. The imaginary unit, i, is defined as

Chemosensors 2020, 8, 88 3 of 13
√(−1). The complex refractive index is an intrinsic property of a medium and, therefore, holds both for
medium having either a smooth or rough surface.The inversion of transmittance data to obtain the real refractive index of an insulator is
straightforward for amorphous isotropic media. In the case of birefringent media, such as certainplastics, for example, polystyrene (PS) under mechanical tension, the non-conventional K-K relation isvalid [24]. The samples used in this study are not birefringent; hence, we exploit a non-conventionalK-K relation to determine the change in refractive index (optical path length). Here, we considerthe case where the transmission or absorption information is available, but the sample thickness isunknown. This situation is typical in spectroscopic and noncontact measurements such as in this study.
We apply the generalized Beer-Lambert intensity law, where the absorption coefficient maycontain both intrinsic absorption and scattering coefficients, to the measured transmittance of thesamples. For non-scattering samples, Beer-Lambert’s law is given by Equation (1). We emphasize thatthe use of the Beer-Lambert law is valid for an ideally flat film and intrinsically assumes the detectionto be within the sample. However, both assumptions cannot be satisfied in practical situations. In thecase of macroplastic samples with thickness nearly comparable to the wavelength of the probing light,one would observe periodic oscillations in the transmittance curve due to interference. The appearanceof such interference fringes would give information on the thickness of the plastic film. However, suchinterference was absent. The method described in this study presents a useful tool in the analysis of insitu optical detection of macroplastics and other larger microplastics in water.
I (λ) = I0(λ)exp[−α(λ)L (1)
where I0 is the incident intensity, I the transmitted intensity, α is the absorption coefficient, λ is thewavelength of the probe light, and L is the thickness of the sample. The relation in Equation (1) isformal and neglects the scattering of electromagnetic radiation. The absorption coefficient, α, is linkedto the extinction coefficient by k = cα/(2ω), where c is the speed of light in the vacuum and ω is theangular frequency of the probe light. If the experimental data on the transmittance, Ti(λ) = I(λ)/I0(λ),are available, one can obtain the product kL = −c/(2ω)lnTi(λ) without knowing the sample thicknessa priori; it is possible to calculate the inversion of kL data using the non-conventional K-K relation.The K-K relation is valid for non-scattering samples and it is given by [22] as:
∆n(ω′)L = (n(ω′) − 1)L =2π
P∫∞
0
ωk(ω)Ldωω2 −ω′2
(2)
where ∆n(w′) = n(w′) −1, ∆n denotes the frequency-dependent refractive index change and P is theCauchy principal value. Since the non-conventional K-K relation implicitly neglects the scatteringof EM radiation of the probe light, samples with volume or surface roughness will scatter incidentradiation, resulting in the difference in the calculated values of ∆n(ω′)L (∆nL) for smooth and roughsamples. It is, therefore, possible to form the ratio (σ) between the measured and calculated values of(kL) and (∆nL) as:
σ = kL/∆nL (3)
where kL is the attenuation length and ∆nL is the change in the optical path length. This ratio isuseful in many ways. As is evident, the thickness of the sample becomes irrelevant. The ratio curvescan also be used for the identification of plastic types especially in the vicinity of 1200 nm, wherethere exists different 2nd and 3rd overtones for different plastic types. Moreover, working in thevicinity of 1200 nm, one avoids strong water absorption in the vicinity of 1500 nm, which restricts thetransmittance measurement over a long detection distance. Additionally, the ratio also compensatesfor the temperature dependence of kL and ∆nL. This compensation comes from the fact that any changein kL results in a proportional change in ∆nL, which is a typical feature in the absorption–dispersionbehavior of light in a medium. This behavior is accurately predicted by the most general dispersionrelation of light, namely the K-K relation. The cancellation of the effect of temperature change in the

Chemosensors 2020, 8, 88 4 of 13
ratio curve is another practical advantage in designing a spectrophotometer and analyzing its data.In principle, such an inexpensive spectrophotometer [25] can be economical for the monitoring ofenvironmental pollution, such as macro and microplastics in aquatic environments.
3. Experiment
In this work, we have studied film samples having both faces smooth (smooth) and film sampleshaving both faces rough (rough) with a size bigger than a microplastic. The samples are commercialplastics: polypropylene (PP), polyethylene terephthalate (PET), polyamide nylon 6 (PA), polystyrene(PS), and low-density polyethylene (LDPE), which were purchased from Goodfellow, Cambridge,UK. Thin rectangular sheets with an approximate size of 55 × 7 mm were cut from the large pristineplastic samples to represent the smooth macroplastics. Next, a larger piece of the pristine samplewas roughened on both sides using different sandpaper grits in a circular pattern. A similar size tothat of the smooth macroplastics was then cut from the roughened larger piece to represent the largemacroplastics. The roughening was performed to simulate mechanical erosion of plastics in naturalwaterbodies. Tables 1 and 2 respectively show the thickness of the samples as purchased and theobtained average surface roughness, measured with a stylus profilometer (Mitutoyo SJ-210, Sakado,Japan), for the different sandpaper grits after roughening. The thickness of PET plastic is comparableto the thickness of plastic mineral water bottles. We, therefore, consider the special case of PET bottleshaving the same average surface roughness on both sides for different magnitudes to simulate of wearof plastics in water bodies.
Table 1. Plastic materials and thickness as purchased.
Sample Thickness (mm)
PP 0.55PET 0.25PA 0.50PS 0.19
LDPE 0.50
Table 2. Sandpaper grit size and the measured average surface roughness of the samples.
Samples Grit Average Surface Roughness Ra (µm)
1200 0.34 ± 0.04Rough 320 1.10 ± 0.17Pristine - <0.10
The smooth and rough macroplastics were immersed in a 1mm-thick cuvette, containing tapwater, to form a complex interface (air–glass–water–plastic–water–glass–air), and was measured with aspectrophotometer (Perkin-Elmer Lambda 9) in the vis–NIR spectral range under standard laboratoryconditions. The smaller cuvette was chosen to reduce the absorption in the measured spectral range.The recorded transmission spectra for the different samples are available in [18].
We remark that in Figure 4 in [18], it is shown that the sensitivity of the transmittance againstaverage surface roughness (at the spectral range starting from 500 to 1500 nm) is rather high becauseit can screen between a sample having average surface roughness magnitude 0.34 µm and a smoothplastic sample. Samples having higher magnitude of surface microroughness could be screened asshown in Figure 4 of [18].
4. Results and Discussion
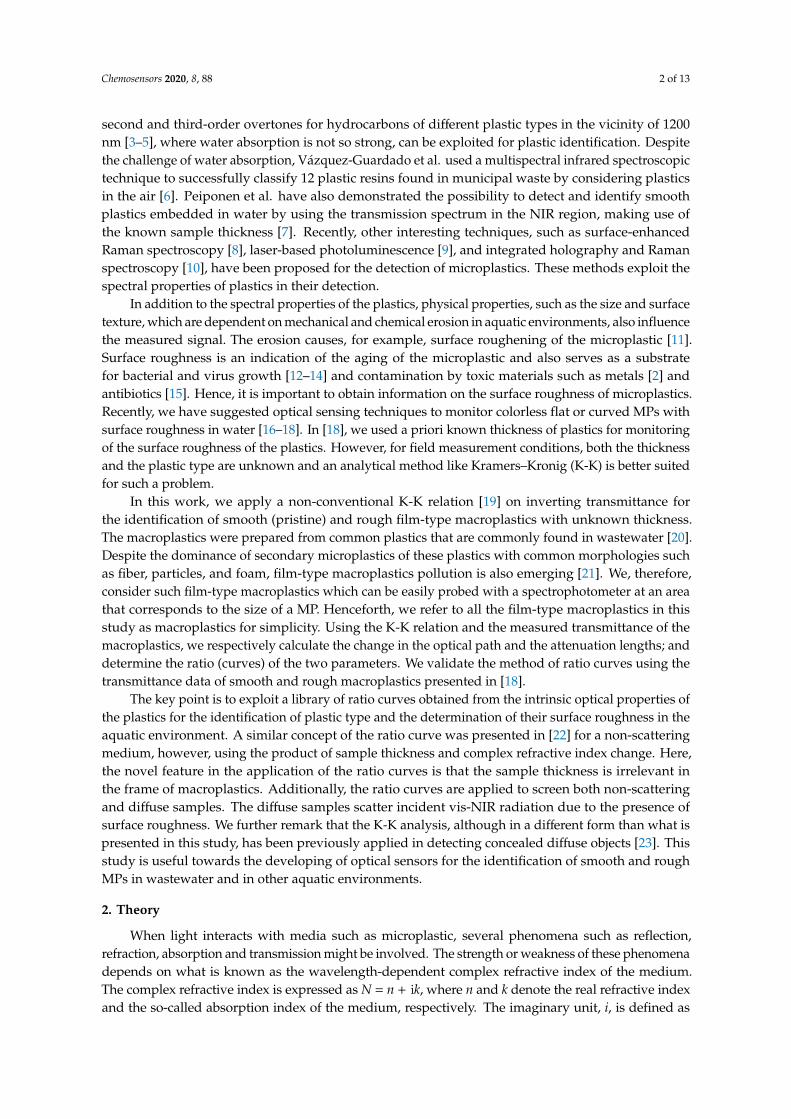
The transmission spectra of both smooth and rough LDPE samples are shown as an examplein Figure 1. The rough macroplastics clearly show the lowest transmittance than that of smoothmacroplastics and water over the measured spectra range, except at about 1450 nm. The fingerprints
Chemosensors 2020, 8, 88 5 of 13
that are present for smooth plastic, in the vicinity of 1200, 1730, and 1760 nm, are also preserved in thecase of the rough macroplastics, however. We also observe the dominant absorption band of water at1450 nm in all three curves. The transmission spectra for the smooth and rough sample of the othermacroplastics types, namely PA, PP, PS and PET, show similar characteristics; see [18]. These spectrawere used for calculating the attenuation length (kL) as presented in Figure 2.
Figure 1. Vis–NIR transmittance spectra for water, smooth and rough LDPE macroplastics immersedin water volume.
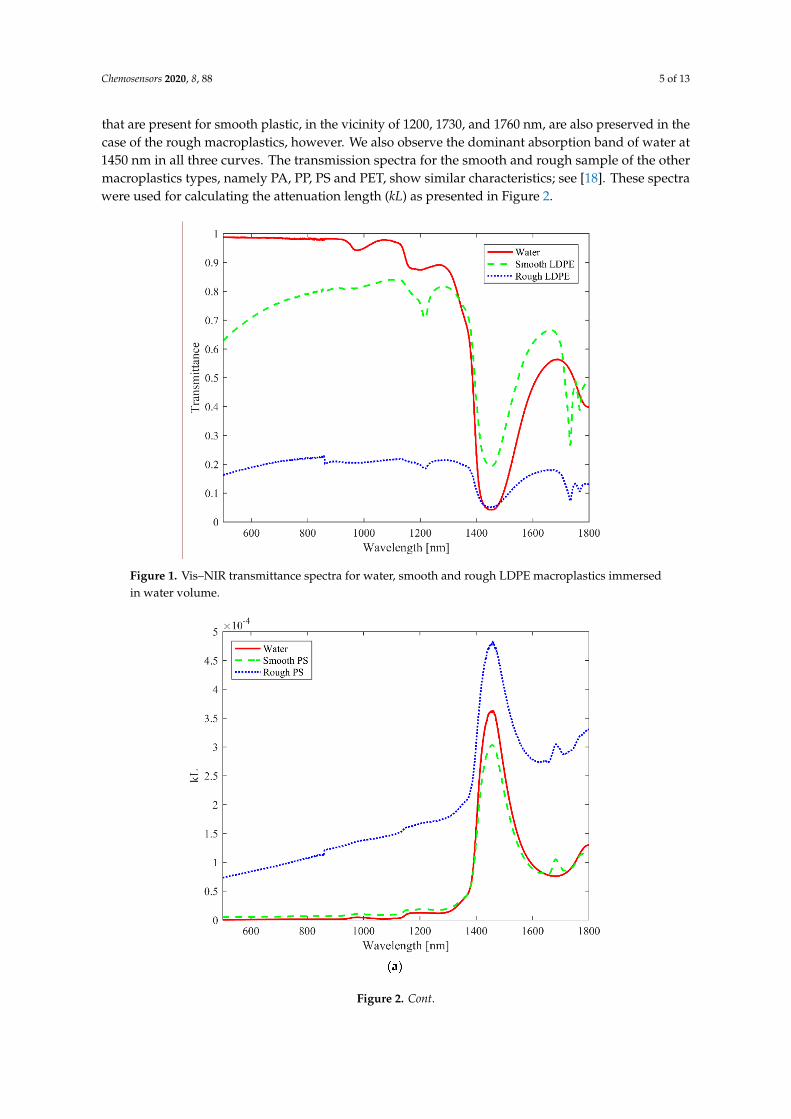
Figure 2. Cont.

Chemosensors 2020, 8, 88 6 of 13
Figure 2. Product of imaginary/real refractive index for smooth and rough macroplastics, and water.(a) attenuation length (kL); (b) Change in optical path length (∆nL).
As an example, Figure 2a shows the attenuation length (kL) curves for water and smooth andrough PA macroplastics embedded in water. The curves for water and the smooth macroplasticsoverlap at many points, while the curve for rough macroplastics is greatly separated from the othertwo. The wide separation of the KL curve for the rough macroplastics can be attributed to increasedscattering or reabsorption. The separation of the KL curves from each other alone, in Figure 2a, isnot sufficient for the differentiation of the smooth macroplastics from the rough as well as for theidentification of the presence of macroplastics in water. Figure 2b shows the corresponding ∆nL curvescalculated for all the samples using the MATLAB code available in [19]. Here, the curves are moretightly packed than in Figure 2a, which further complicates the discrimination and the identification ofthe macroplastics. We note that the curve in Figure 2b can be distorted in the vicinity of the initial andfinal wavelength due to the finite integration range of the measurement. To avoid any artificial dataextrapolation beyond the range of measurement, such data points were excluded.
The data in Figure 2a,b were utilized to calculate the ratio σ for water, smooth, and roughmacroplastics for the different plastic types in the spectral range of 900 to 1400 nm. All the smooth andrough macroplastics for the different plastics show higher ratio curves than water.
Figure 3a shows the ratio curves for PA macroplastics (rough and smooth) and water. The ratiocurves for the smooth and rough macroplastics are well separated and can be differentiated from eachother in the chosen spectral range. The spectral range was chosen to avoid the high absorption oflight by both the macroplastics and water beyond 1400 nm. The ratio curve for water has a broadand very weak peak around 1200 nm, unlike in the normal transmittance curve, where the peak isdominant. The curve for smooth macroplastics shows a faint peak at 1161 nm but a stronger peak at1211 nm, while the curve for rough macroplastics also shows similar peaks, but at 1166 and 1212 nm,respectively. We note the wavelength at which the smooth and rough macroplastics ratio curvesintersect is likely to vary with changing average surface roughness. This conclusion is based on thefact the local transmittance is expected to increase when the average surface roughness corresponds tothe wavelength in accordance with Mie scattering.
Figure 3b shows the ratio curves for the PP sample. The curves for the smooth and roughmacroplastics intersect at 1233 nm. The smooth macroplastics shows three distinctive peaks at 1158,

Chemosensors 2020, 8, 88 7 of 13
1199, and 1222 nm that are absent in the curve for the rough macroplastics. Unlike in the case of the PAmacroplastics, the trend of the ratio curve is relatively constant for the rough PP macroplastics over thespectral range considered, whereas that of the smooth decreases with increasing wavelength. Bothrough and smooth LDPE macroplastics, in Figure 3c, show a relatively constant trend in their ratiocurves with similar strong and weak peaks but no intersection points. The strong peaks are located at1221 and 1224 nm, whereas the weak and broad peaks are located at 1171 and 1173 nm, respectively,for the rough and smooth macroplastics. The LDPE sample, unlike the other (PA, PP, PET, and PS)samples, already has volume inhomogeneity even for the pristine sample.
Figure 3. Cont.

Chemosensors 2020, 8, 88 8 of 13
Figure 3. Ratio (σ) curves for smooth and rough macroplastics embedded in water. The short arrowsindicate the peaks (a) PA type; (b) PP type; (c) LDPE type; (d) PS type.
Figure 3d also shows similar ratio curves for the PS sample. In contrast to the rough macroplasticsthat show a higher magnitude, the ratio curve for the smooth PS macroplastics is barely separated fromthat of water. The smooth PS, on the other hand, has two broad peaks at 969 and 1156 nm, whereas therough PS macroplastic shows a single peak at 1157 nm. Besides these differences, both samples exhibita similar relatively constant trend in their curves with no intersection point. In conclusion, the presenceof macroplastics, either rough or smooth, in water can be detected based on the separation of their ratiocurves from that of water. Additionally, rough and smooth macroplastics can be also be differentiatedfrom each other based on the appearance and disappearance of the peaks, the intersection point aswell as the trends in their ratio curves depending on the plastic type, as shown in Figure 3a–d.
Chemosensors 2020, 8, 88 9 of 13
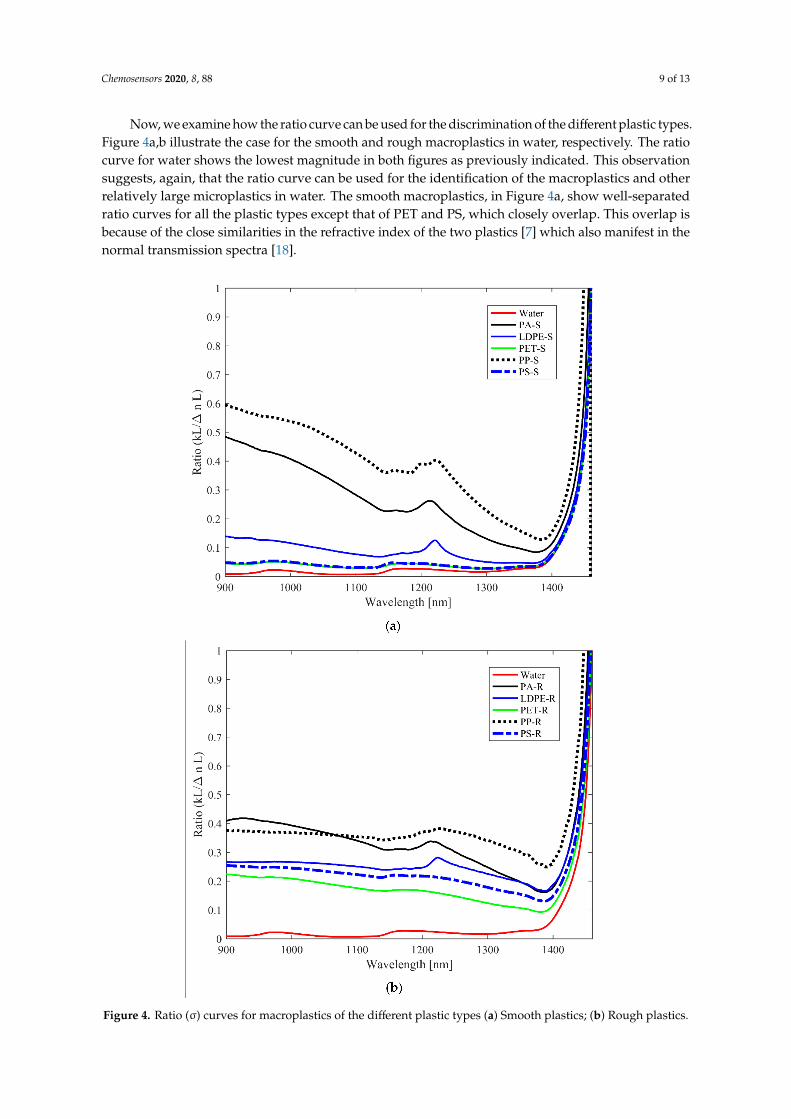
Now, we examine how the ratio curve can be used for the discrimination of the different plastic types.Figure 4a,b illustrate the case for the smooth and rough macroplastics in water, respectively. The ratiocurve for water shows the lowest magnitude in both figures as previously indicated. This observationsuggests, again, that the ratio curve can be used for the identification of the macroplastics and otherrelatively large microplastics in water. The smooth macroplastics, in Figure 4a, show well-separatedratio curves for all the plastic types except that of PET and PS, which closely overlap. This overlap isbecause of the close similarities in the refractive index of the two plastics [7] which also manifest in thenormal transmission spectra [18].
Figure 4. Ratio (σ) curves for macroplastics of the different plastic types (a) Smooth plastics; (b) Rough plastics.

Chemosensors 2020, 8, 88 10 of 13
The two overlapping curves are, however, well resolved. Moreover, we observe that the ratiocurves in the case of the rough macroplastics, in Figure 4b, for all plastic types, is separated from thatof water and the trend somewhat deviates from that of the smooth samples revealing the effect of thesurface roughness. These observations can be exploited for the identification of macroplastics in wateras well as the differentiation between rough and smooth macroplastics. The deviation in the ratiocurves for the rough macroplastics can be attributed to the formation of a complex effective mediumbetween the rough surface of the macroplastics and surrounding water [17].
A library of the ratio curves, therefore, presents a useful tool for the differentiation of (meso)plastics,different plastic types in the vis–NIR range, and to ascertain information on the surface roughness.
Lastly, we evaluate the suitability of the ratio curves for the discrimination of macroplastics withdifferent average surface roughness, as illustrated in Figure 5. Only the PET plastic type is consideredin this case for two average surface roughness, namely Ra = 1.10 µm and Ra = 0.34 µm. We observe apositive correlation of the magnitude of the ratio (curves) with increasing magnitude of average surfaceroughness of the plastics, indicating the sensitivity of former to the latter. As previously mentioned,the surface roughness creates a virtual layer at the top surface of the macroplastics as water infiltratesthe grooves. This virtual layer has an effective index which corresponds to the ratio of the refractiveindices of the PET plastic and water. The effect of such a layer on the reflection signal was examinedin [17], however, using a more relaxed form of the effective medium theory [26]. For a relatively thinlayer, a negative correlation was observed between the reflection signal and the magnitude of theaverage surface roughness, as one would expect, which agrees with the order of the ratio curves inFigure 5. In addition to the correlation and the separation of the curves, from that of water, with theincreasing magnitude of Ra, we also observe weak peaks in the curves. There are two peaks for eachof these curves in the vicinity of 960 and 1170 nm. Water has peaks at 973 and 1174 nm, and smoothmacroplastics have peaks at 967 and 1174 nm. The PET-320 (Ra = 1.10 µm) has its peaks at 967 and1168 nm, whereas PET-1200 (Ra = 0.34 µm) has one peak at 967 nm and the other shifted to 1170 nm.
Figure 5. Ratio (σ) curves for water, smooth, and rough PET macroplastics with different averagesurface roughness water. The average surface roughness of the PET-320 and PET-1200 samples is Ra =
1.10 µm and Ra = 0.34 µm, respectively. The short arrows indicate the positions of the peaks.
The results are like those of transmittance in [18]; the ratio curve shows sensitivity to differentaverage surface roughness, resulting in an increase in the magnitude of ratio and/or shift in peak

Chemosensors 2020, 8, 88 11 of 13
position. Such a sensitivity can be used for the differentiation among different macroplastics, withsurface roughness on either or both surfaces. Moreover, the exponential behavior of transmittance versusroughness was observed in [27] at a fixed wavelength. This can be used to estimate the sensitivity of thepresent method versus average surface roughness, because in the first place prior to the Kramers-Kroniganalysis, it is the transmittance that is measured. Sensitivity to find a change of at least of 300 nm ofaverage roughness is reasonable.
In summary, it is difficult to use the individual parameters of the ratio (σ), namely the attenuationlength (kL) and the change in optical length (∆nL), to differentiate among the plastics and also fromthat of water, especially for smooth samples as seen in Figure 2. On the contrary, for most of the plastictypes, as seen Figure 3, the ratio curves follow a specific order with the curve for rough macroplasticsbeing higher than that of the smooth macroplastics and the curve for water being the lowest. Moreover,the ratio (curve) enhances any spectral fingerprints in the vicinity of 1200 nm, which are suppressed inthe case of the individual parameters due to the presence of strong absorption of water. Thus, it is easierto distinguish the spectral features of the macroplastics using the ratio curves. This is an advantageof the ratio curves over the use of the attenuation length (kL), the absorption (α), and the extinctioncoefficients (k). The suppression of the spectral features comes from the anomalous dispersion that isstrongest in the vicinity of local absorption maximum. The influence of the anomalous dispersion onthe absorption maximum has been exploited to tune the absorption of dyes and the refractive index ofwater using K-K relations [28].
For certain (meso)plastics, the peaks observed around 1200 nm are subject to variations because ofthe different methods of production. The magnitude, trend, and the presence of peaks in the ratio curvesenable differentiation among different plastic types. Although the K-K relation assumes non-scatteringof photons, scattering distorts the obtained optical path length, ∆nL. Similar distortion also occurs inthe attenuation length, kL, but with an explicit dependence on L. In the case of both smooth and roughplastic, we can use the ratio curve to differentiate smooth from rough macroplastics of the same plasticand identify the type by the (dis)appearance or the shift of the peak positions in the spectral features ofthe ratio curve.
Once the plastic type has been identified using K-K analysis and the ratio curves, it is possible touse a library of extinction coefficient spectra for smooth (meso)plastics measured in the laboratory tocalculate the thickness of the identified sample by using Beer-Lambert’s law. In the case of a roughsample, Beer-Lambert’s law will fail to result in thickness values much larger than the ones obtainedfor the smooth sample. This failure is due to the breakdown of Beer-Lambert’s law for scatteringmedium, leading to the identification of rough samples.
5. Conclusions
In this paper, we have introduced a novel method for the screening and assessment of the surfacequality of macroplastics of different plastic types with unknown thickness in water. Usually, theknowledge of sample thickness is mandatory for the identification and screening of objects usingconventional methods. However, we exploit a non-conventional K-K relation and the spectral propertiesto detect these samples. The method is based on the calculation ratio (curves) of the attenuation lengthand the change in optical path length of incident radiation, which are obtained from the transmittanceand the K-K relation, respectively. This ratio calculation allows the possibility to circumvent thelimitation imposed by the sample thickness. Since the method is independent of sample thickness,and since the ratio function is detected from an area that corresponds to the size of a MP, it willbe a useful technique for in situ identification of relatively large microplastics that can be probedwith spectrophotometer.
Author Contributions: Conceptualization K.E.-P. and B.E.K.; Sample Preparation M.U.I., B.A., J.A., J.R.; DataCuration M.U.I., B.A., J.A., J.R.; Writing—Original draft preparation, B.E.K., K.E.-P. and B.A.; Supervision of theentire work, K.-E.P.; Writing-Review & Editing, B.E.K., K.-E.P. and B.A. All authors have read and agreed to thepublished version of the manuscript.

Chemosensors 2020, 8, 88 12 of 13
Funding: This research received no external funding.
Acknowledgments: This work is part of the Academy of Finland Flagship Programme, Photonics Research andInnovation (PREIN), decision 321066.
Conflicts of Interest: Authors declares no conflict of interest.
References
1. Imran, M.; Das, K.R.; Naik, M.M. Co-selection of multi-antibiotic resistance in bacterial pathogens in metaland microplastic contaminated environments: An emerging health threat. Chemosphere 2019, 215, 846–857.[CrossRef]
2. Wang, J.; Peng, J.; Tan, Z.; Gao, Y.; Zhan, Z.; Chen, Q.; Cai, L. Microplastics in the surface sediments from theBeijiang River littoral zone: Composition, abundance, surface textures and interaction with heavy metals.Chemosphere 2017, 171, 248–258. [CrossRef] [PubMed]
3. Garaba, S.P.; Aitken, J.; Slat, B.; Dierssen, H.M.; Lebreton, L.; Zielinski, O.; Reisser, J. Sensing ocean plasticswith an airborne hyperspectral shortwave infrared imager. Environ. Sci. Technol. 2018, 52, 11699–11707.[CrossRef] [PubMed]
4. Garaba, S.P.; Dierssen, H.M. An airborne remote sensing case study of synthetic hydrocarbon detectionusing short wave infrared absorption features identified from marine-harvested macro-and microplastics.Remote Sens. Environ. 2018, 205, 224–235. [CrossRef]
5. Huth-Fehre, T.; Feldhoff, R.; Kantimm, T.; Quick, L.; Winter, F.; Cammann, K.; Buydens, L. NIR-Remotesensing and artificial neural networks for rapid identification of postconsumer plastics. J. Mol. Struct. 1995,348, 143–146. [CrossRef]
6. Vázquez-Guardado, A.; Money, M.; McKinney, N.; Chanda, D. Multi-spectral infrared spectroscopy forrobust plastic identification. Appl. Opt. 2015, 54, 7396–7405. [CrossRef]
7. Peiponen, K.E.; Raty, J.; Ishaq, U.; Pelisset, S.; Ali, R. Outlook on optical identification of micro- andnanoplastics in aquatic environments. Chemosphere 2019, 214, 424–429. [CrossRef]
8. Lv, L.; He, L.; Jiang, S.; Chen, J.; Zhou, C.; Qu, J.; Lu, Y.; Hong, P.; Sun, S.; Li, C. In situ surface-enhancedRaman spectroscopy for detecting microplastics and nanoplastics in aquatic environments. Sci. Total Environ.2020, 728, 138449. [CrossRef]
9. Ornik, J.; Sommer, S.; Gies, S.; Weber, M.; Lott, C.; Balzer, J.C.; Koch, M. Could photoluminescencespectroscopy be an alternative technique for the detection of microplastics? First experiments using a 405nm laser for excitation. Appl. Phys. B Lasers O 2020, 126, 1–7. [CrossRef]
10. Takahashi, T.; Liu, Z.; Thevar, T.; Burns, N.; Mahajan, S.; Lindsay, D.; Watson, J.; Thornton, B. Identification ofmicroplastics in a large water volume by integrated holography and Raman spectroscopy. Appl. Opt. 2020,59, 5073–5078. [CrossRef]
11. Ioakeimidis, C.; Fotopoulou, K.N.; Karapanagioti, H.K.; Geraga, M.; Zeri, C.; Papathanassiou, E.; Galgani, F.;Papatheodorou, G. The degradation potential of PET bottles in the marine environment: An ATR-FTIR basedapproach. Sci. Rep. 2016, 6, 23501. [CrossRef] [PubMed]
12. Fei, Y.; Changfu, Y.; Zhilin, Z.; Xueting, B.; Jie, M. Adsorption behavior of organic pollutants and metals onmicro/nanoplastics in the aquatic environment. Sci. Total Environ. 2019, 694, 133643.
13. Pan, Z.; Guo, H.; Chen, H.; Wang, S.; Sun, X.; Zou, Q.; Zhang, Y.; Liu, H.; Cai, S.; Huang, J. Microplastics in thenorthwestern pacific: Abundance, distribution, and characteristic. Sci. Total Environ. 2019, 650, 1913–1922.[CrossRef] [PubMed]
14. Hossain, M.R.; Jiang, M.; Wei, Q.; Leff, L.G. Microplastic surface properties affect bacterial colonization infreshwater. J. Basic Microbiol. 2019, 59, 54–61. [CrossRef] [PubMed]
15. Li, J.; Zhang, K.; Zhang, H. Adsorption of antibiotics on microplastics. Environ. Pollut. 2018, 237, 460–467.[CrossRef]
16. Asamoah, B.O.; Kanyathare, B.; Roussey, M.; Peiponen, K.-E. A Prototype of a portable optical sensor forthe detection of transparent and translucent microplastics in freshwater. Chemosphere 2019, 231, 161–167.[CrossRef]
17. Asamoah, B.O.; Roussey, M.; Peiponen, K.E. Chemosphere on optical sensing of surface roughness of flatand curved microplastics in water. Chemosphere 2020, 254, 126789. [CrossRef]

Chemosensors 2020, 8, 88 13 of 13
18. Kanyathare, B.; Asamoah, B.O.; Ishaq, U.; Amoani, J.; Räty, J.; Peiponen, K.E. Optical transmission spectrastudy in visible and near-infrared spectral range for identification of rough transparent plastics in aquaticenvironments. Chemosphere 2020, 248, 126071. [CrossRef]
19. Lucarini, V.; Saarinen, J.J.; Peiponen, K.E.; Vartiainen, E.M. Kramers–Kronig Relations in Optical MaterialsResearch; Springer: Berlin/Heidelberg, Germany, 2005; p. 110.
20. Zhang, X.; Chen, J.; Li, J. The removal of microplastics in the wastewater treatment process and their potentialimpact on anaerobic digestion due to pollutants association. Chemosphere 2020, 251, 126360. [CrossRef]
21. Yin, L.; Jiang, C.; Wen, X.; Du, C.; Zhong, W.; Feng, Z.; Long, Y.; Ma, Y. Microplastic pollution in surfacewater of urban lakes in Changsha, China. Int. J. Environ. Res. Public Health 2019, 16, 1650. [CrossRef]
22. Peiponen, K.E.; Vartiainen, E.M.; Unuma, T.; Axel, Z.J.; Silfsten, P.; Venäläinen, T.; Kishida, H. Dispersionrelations for evaluating the complex refractive index of medium without the information of its thickness.Appl. Phys. Lett. 2013, 102, 181110. [CrossRef]
23. Ben-Aderet, Y.; Granot, E.; Sternklar, S.; Tal, T.; Kopeika, S.N. Optical imaging of hidden objects behindclothing. Appl. Opt. 2010, 49, 3926–3929. [CrossRef] [PubMed]
24. Peiponen, K.E.; Vartiainen, E.M.; Asakura, T. Dispersion, Complex Analysis, and Optical Spectroscopy: ClassicalTheory; Springer: Berlin/Heidelberg, Germany, 1999; Volume 147.
25. Lin, Z.; Zhuang, Z.; Luo, C.; Zhang, J.; Gu, H. The performance of consumer-grade near infrared spectrometerin traditional Chinese medicine. J. Eur. Opt. Soc. Rapid Publ. 2020, 16, 1–7. [CrossRef]
26. Tuck, C. Effective Medium Theory; Oxford University Press: Oxford, UK, 1999.27. Asamoah, B.O.; Amoani, J.; Roussey, M.; Peiponen, K.E. Laser beam scattering for the detection of flat,
curved, smooth, and rough microplastics in water. Opt. Rev. 2020, 27, 217–224. [CrossRef]28. Sai, T.; Saba, M.; Dufresne, E.; Steiner, U.; Wilts, B. Designing Refractive Index Fluids using the Kramers-Kronig
Relations. Faraday Discuss. 2020. Available online: https://pubs.rsc.org/en/content/articlehtml/2020/fd/
d0fd00027b (accessed on 22 September 2020).
© 2020 by the authors. Licensee MDPI, Basel, Switzerland. This article is an open accessarticle distributed under the terms and conditions of the Creative Commons Attribution(CC BY) license (http://creativecommons.org/licenses/by/4.0/).