icici bank notes maturity date
TRANSCRIPT

The Offering
Issuer . . . . . . . . . . . . . . . . . . . . . . . . . . . ICICI Bank Limited, a public limited company incorporated under thelaws of the Republic of India (“ICICI Bank”).
Notes Offered . . . . . . . . . . . . . . . . . . . . . 6.375% Fixed to Floating Rate Subordinated Notes due April 30,2022 issued by ICICI Bank in an aggregate principal amount of US$750,000,000 (the “notes”).
Maturity . . . . . . . . . . . . . . . . . . . . . . . . . The notes will mature on April 30, 2022 (the “Maturity Date”).
Trustee . . . . . . . . . . . . . . . . . . . . . . . . . . The Bank of New York
Interest . . . . . . . . . . . . . . . . . . . . . . . . . . Interest will be payable on the outstanding principal amount of thenotes from January 12, 2007 (the “Issue Date”) (i) semi-annually inarrears on April 30 and October 31 of each year, at a fixed rate perannum equal to 6.375%, during the period from (and including) theIssue Date to (but excluding) April 30, 2017, and (ii) thereafter semi-annually in arrears on April 30 and October 31 of each year, at avariable rate per annum equal to the 6-month LIBOR plus a margin of2.28%. The first payment of interest will be made on April 30, 2007in respect of the period from (and including) the Issue Date to (butexcluding) April 30, 2007. See “Description of the Notes—Interest”.Each such date is an “Interest Payment Date”.
Each period from and including an Interest Payment Date or the IssueDate, as applicable, to but excluding the next Interest Payment Dateuntil April 30, 2017 is called a “Fixed Interest Period”. The periodfrom and including April 30, 2017, to but excluding the nextfollowing Interest Payment Date, and each successive period fromand including an Interest Payment Date to, but excluding, theMaturity Date is called a “Floating Interest Period”. Each FixedInterest Period and Floating Interest Period is referred to as an“Interest Period”.
If and to the extent that, on any Interest Payment Date, ICICI Bankhas:
• a Capital Deficiency (as defined below), then ICICI Bank shallnot pay any principal or interest on such date and (i) with respectto any Interest Payment Date other than the Maturity Date, theinterest payable on such date shall be deferred until the nextsucceeding date on which interest is payable under the notes, and(ii) with respect to the Maturity Date, any interest (includingInterest Arrears and Additional Interest (each as defined below))and principal payable on such date shall be deferred until theCompulsory Payment Date (as defined below); or
• a Net Loss (as defined below) or increase in Net Loss without aCapital Deficiency, then ICICI Bank shall not pay any principalor interest on such date except that it may pay interest with theprior approval of the Reserve Bank of India (“RBI”) and, in theevent that the RBI does not grant approval for payment of interest(i) with respect to any Interest Payment Date other than the
3

Maturity Date, the interest payable on such date shall be deferreduntil the next succeeding date on which interest is payable underthe notes, and (ii) with respect to the Maturity Date, any interest(including Interest Arrears and Additional Interest (each asdefined below)) and principal payable on such date shall bedeferred until the Compulsory Payment Date (as defined below).
“Capital Deficiency” means, for any Interest Payment Date, thatICICI Bank determines that its capital to risk assets ratio (“CRAR”)has declined below the minimum regulatory requirement prescribedby the RBI from time to time, (i) as at the immediately precedingMarch 31 in the case of the Interest Payment Date in April and (ii) asat the immediately preceding September 30 in the case of the InterestPayment Date in October.
“Compulsory Payment Date” means, in the case of principal andinterest (including Interest Arrears and Additional Interest), a dateafter the Maturity Date following deferral of the payment of principaland interest which is one business day after the first date on whichICICI Bank determines that it has (i) neither a Capital Deficiency nora Net Loss or (ii) no Capital Deficiency, but a Net Loss or increase inNet Loss and has received approval from the Reserve Bank of India tomake the payment of principal and interest, provided that any suchpayment will not cause ICICI Bank to have a Capital Deficiency or inthe case of (i) a Net Loss.
“Net Loss” means, for any Interest Payment Date, a determinationmade by ICICI Bank as per (a) unconsolidated Indian GAAP financialstatements that it has either (i) a negative balance reported in thebalance in the profit and loss account line item in its Balance Sheet,or (ii) a net loss reported in its profit and loss account, as at and forthe 12 month period ended on the immediately preceding March 31 inthe case of the Interest Payment Date in April or as at and for the sixmonth period ended on the immediately preceding September 30 inthe case of the Interest Payment Date in October, or (b) regulations orguidelines prescribed by Reserve Bank of India from time to time inthis regard. In case of any conflict between the determination madeunder (a) and (b) hereinabove, the determination made under (b) shallprevail.
If, as a consequence of a Capital Deficiency or a Net Loss, ICICIBank shall not pay principal or interest on an Interest Payment Datethen, no later than the 5th day prior to the relevant Interest PaymentDate, it shall deliver to the Trustee a notice indicating the existence ofsuch Capital Deficiency or Net Loss and that it will as a consequencethereof not pay principal or interest on such Interest Payment Date (a“Payment Suspension Notice”). A Payment Suspension Notice willhave no force or effect unless ICICI Bank has delivered it to theTrustee in accordance herewith.
4

Interest on the notes will be cumulative. This means that, if interest isnot paid on the notes on any Interest Payment Date, holders of thenotes will have the right to receive those interest payments on thenext succeeding date on which interest is payable under the notes.
In the event that ICICI Bank determines there is a Net Loss without aCapital Deficiency for any Interest Payment Date, ICICI Bank shallapply to the RBI for permission to pay interest which wouldotherwise be due on such Interest Payment Date. If the RBI grantssuch permission, notwithstanding any prior delivery of a PaymentSuspension Notice in relation to such Interest Payment Date, ICICIBank shall, subject to compliance with such conditions as may bestipulated by the RBI while granting its approval, proceed to pay theinterest due on such Interest Payment Date, either (i) on such InterestPayment Date, if approval from the RBI is received in advancethereof, or (ii) within 1 business day of receipt of the approval fromthe RBI if such approval is received after the date which is 1 businessday prior to the relevant Interest Payment Date.
In the event that any interest in respect of the notes is not paid on anInterest Payment Date (any such amount, “Interest Arrears”), suchInterest Arrears shall bear interest (“Additional Interest”) from theInterest Payment Date on which the interest first became due to (andincluding) the actual date of payment. Additional Interest shall becalculated at the interest rate payable on the notes. Additional Interestaccrued to any Interest Payment Date shall be added, for the purposeonly of calculating the Additional Interest accruing thereafter, to theamount of Interest Arrears remaining unpaid on such InterestPayment Date.
Dividend and Capital Restriction . . . . So long as any Interest Arrears or Additional Interest thereon remainunpaid, ICICI Bank will not (i) other than to the holders of ExistingPreference Shares to the extent permissible and subject to prevailingIndian laws, declare or pay any dividend, distribution or otherpayment in respect of its Ordinary Shares, any other security orobligation of ICICI Bank ranking junior to the notes, or any OtherPari Passu Claims (other than as required under the terms of anypreference shares or other security or obligation ranking junior to thenotes (but not including Ordinary Shares) or Other Pari PassuClaims), or (ii) other than as required under the terms of such securityor obligation, effect any repurchase or redemption of any of itsOrdinary Shares, any other security or obligation of ICICI Bankranking junior to the notes or any Other Pari Passu Claims, (orcontribute any moneys to a sinking fund for the redemption of anysuch shares, securities or claims).
“Ordinary Shares” means ordinary shares of ICICI Bank.
“Existing Preference Shares” means the three hundred fifty 0.001%preference shares of Rs. 10,000,000 each of ICICI Bank allotted asfully paid preference shares to preference shareholders of erstwhileICICI Limited, redeemable at par on April 20, 2018.
5

Subordination . . . . . . . . . . . . . . . . . . . . The payment obligations of ICICI Bank under the notes constituteunsecured subordinated obligations of ICICI Bank and will rank(i) behind (junior to) the claims of holders of Senior Indebtedness,(ii) pari passu with Other Pari Passu Claims and (iii) before (seniorto) (x) the claims for payment of any obligation that, expressly or byapplicable law, is subordinated to the notes, (y) the claims of holdersof preference and equity shares of ICICI Bank and (z) the claims ofinvestors in instruments eligible for inclusion in Tier I capital ofICICI Bank, in accordance with the subordination provisions of theIndenture.
“Other Pari Passu Claims” means claims of creditors of ICICI Bankwhich are subordinated so as to rank pari passu with claims in respectof the notes.
“Senior Indebtedness” means all deposits and other senior liabilitiesof ICICI Bank (including those in respect of bonds, notes anddebentures), and debt instruments constituting “lower Tier II” capitalof ICICI Bank from time to time, other than liabilities of ICICI Bankunder the notes. For the avoidance of doubt, Senior Indebtedness shallnot include any other debt securities of ICICI Bank which qualify forUpper Tier II treatment under the RBI guidelines.
Additional Amounts . . . . . . . . . . . . . . . All payments of principal and interest in respect of the notes will bemade without withholding or deduction for any taxes or othergovernmental charges imposed by a Taxing Jurisdiction, unless suchwithholding or deduction is required by law. In the event ICICI Bankis required by law to withhold or deduct amounts for any such taxesor other governmental charges, ICICI Bank will pay such additionalamounts so that the holders of the notes will receive the sameamounts as they would have received without such withholding ordeduction, subject to certain exceptions. ICICI Bank will pay anystamp, administrative, court, documentary, excise or property taxesimposed on the initial issuance and delivery of the notes in a TaxingJurisdiction and will indemnify the holders of the notes for any suchtaxes paid by the holders of the notes, excluding any such duties ortaxes which may relate to any transfer or transmission of the notesfollowing their initial issuance and delivery by us. See “Descriptionof the Notes—Additional Amounts.”
“Taxing Jurisdiction” means India, or any political subdivisionthereof or any authority or agency therein or thereof having the powerto tax, or any other jurisdiction or any political subdivision or anyauthority or agency therein or thereof having the power to tax towhich ICICI Bank becomes subject in respect of payments made by itof principal or interest on the notes.
Optional Redemption . . . . . . . . . . . . . . The Notes are not redeemable at the option of the holders thereof atany time and are not redeemable at the option of ICICI Bank prior to
6

April 30, 2017 (the “First Call Date”), except in certaincircumstances in the event of certain changes in withholding taxes(see “Description of Notes—Optional Tax Redemption”) or upon theoccurrence of a Regulatory Event (see “Description of the Notes—Redemption Upon a Regulatory Event”).
The notes may be redeemed at the option of ICICI Bank, in whole(and not in part), on the First Call Date or on any subsequent InterestPayment Date; provided that ICICI Bank will give notice to holdersof notes not less than 15 business days but not more than 30 businessdays prior to any such redemption. This notice will be published inaccordance with the notice provisions described under “Descriptionof the Notes—Notices”.
The redemption price for any redemption of the notes will be 100% ofthe principal amount of the notes then outstanding, plus InterestArrears (if any) and Additional Interest (if any) on the principalamount being redeemed to (but excluding) the redemption date (the“Base Redemption Price”).
Any optional redemption of notes is subject to compliance withapplicable regulatory requirements, including the prior approval ofthe RBI. The RBI, whilst considering the request of ICICI Bank to soredeem the notes, may take into consideration, among other things,ICICI Bank’s CRAR position both at the time of the proposedredemption and thereafter.
Optional Tax Redemption . . . . . . . . . . In the event ICICI Bank determines that, as a result of certain changesin or amendments to the laws or regulations of a Taxing Jurisdiction(as defined above) ICICI Bank has been or will be required to payadditional amounts as described under “Description of the Notes—Additional Amounts,” ICICI Bank may, at its option, but subject toapproval by the Reserve Bank of India, redeem the notes at aredemption price equal to the Base Redemption Price. See“Description of the Notes—Optional Tax Redemption”.
Redemption Upon a RegulatoryEvent . . . . . . . . . . . . . . . . . . . . . . . . . . Upon the occurrence of a Regulatory Event, and subject to the
conditions (see “Description of the Notes”), ICICI Bank, upon thereceipt of prior permission from the RBI, will have the right toredeem the notes in whole (and not in part) at a redemption priceequal to (A) in the case of redemption prior to April 30, 2017, thehigher of the Base Redemption Price and the Make Whole Amount(as defined herein), or (B) in the case of a redemption on or afterApril 30, 2017, the Base Redemption Price.
“Regulatory Event” means the receipt by ICICI Bank of an opinion,declaration, rule or decree of the RBI or any other regulatory or
7

governmental authority succeeding to the authority of the RBI asregards monitoring of capital adequacy of Indian banks, to the effectthat there has been either (i) a change in the law or regulation or (ii) achange in the interpretation thereof, resulting in more than aninsubstantial risk that the notes (or any portion thereof) will not beeligible to be included in calculating the Upper Tier II capital ofICICI Bank, other than as a result of such notes exceeding thepermitted basket for notes eligible for inclusion as Upper Tier IIcapital.
Form and Denomination . . . . . . . . . . . The notes will be in fully registered form without interest couponsattached. The notes sold in reliance on Rule 144A under theSecurities Act (“Rule 144A”) will be issued in the form of a restrictedglobal note (the “Restricted Global Note”) and the notes sold inreliance on Regulation S under the Securities Act (“Regulation S”)will be issued in the form of a Regulation S global note (the“Regulation S Global Note”). The Restricted Global Note and theRegulation S Global Note will be registered in the name of Cede &Co. as nominee for, and deposited with the trustee as custodian for,DTC. The notes offered and sold in reliance on Rule 144A will beissued in minimum denominations of US$ 100,000 and integralmultiples of US$ 1,000 in excess thereof. Notes offered and sold inreliance on Regulation S will be issued in minimum denominations ofUS$ 100,000 and integral multiples of US$ 1,000 in excess thereof.See “Form, Denomination and Transfer.”
Use of Proceeds . . . . . . . . . . . . . . . . . . . ICICI Bank will use the proceeds of the issue and sale of the notes tosupport growth of ICICI Bank and its subsidiaries, to increase theUpper Tier II capital of ICICI Bank and for general corporatepurposes, including to pay certain expenses relating to the offering.
Resale Restrictions . . . . . . . . . . . . . . . . The notes have not been and will not be registered under theSecurities Act and may not be offered, sold, pledged or otherwisetransferred except in a transaction pursuant to the exemption providedby Regulation S, Rule 144A or such other available exemption fromthe registration requirements of the Securities Act. The notes may betransferred only as described under “Transfer Restrictions”.
Substitution of Entity or Branch . . . . . ICICI Bank may at any time, subject to any regulatory approvals asmay be required, elect to have the liability to pay the amounts dueunder the terms of the notes transferred, in whole or in part, to anentity controlled by ICICI Bank or a branch of ICICI Bank other thanthe Issuer. Any such transfer to an entity might be deemed for U.S.federal income tax purposes to be an exchange of the notes for newnotes by the holders thereof, resulting in the recognition of taxablegain or loss for such purposes and possibly certain other adverse taxconsequences.
Listing and Trading . . . . . . . . . . . . . . . Approval-in-principle has been obtained for listing of the notes on theSingapore Exchange. The approval-in-principle for the listing, and theadmission to the Official List of the Singapore Exchange, of the notes
8

is not to be taken as an indication of any of the merits of ICICI Bankor the merits of the notes. The notes will be traded on the SingaporeExchange in a minimum board lot size of US$ 200,000 for so long asthe notes are listed on the Singapore Exchange.
Clearance and Settlement . . . . . . . . . . The notes will be issued in book-entry form through the facilities ofDTC, on the one hand and Euroclear and Clearstream, Luxembourg,on the other, each with respect to their respective participants.Holders of beneficial interests in notes held in book-entry form willbe entitled to receive physical delivery of certificated notes onlyunder certain circumstances. For a description of certain factorsrelating to clearance and settlement, see “Form, Denomination andTransfer.”
Governing Law . . . . . . . . . . . . . . . . . . . The Indenture, the notes and the Calculation Agency Agreement aregoverned by the laws of the State of New York, United States ofAmerica, except that the subordination provisions of the Indentureand the notes are governed by the laws of India.
Security CodesRule 144A Regulation S
ISIN . . . . . . . . . . . . . . . . . . . . . . . . . . . . . . . . . . . . . . . . . . . . . . US45104GAE44 USY38575DE68CUSIP . . . . . . . . . . . . . . . . . . . . . . . . . . . . . . . . . . . . . . . . . . . . 45104GAE4 Y38575DE6Common Code . . . . . . . . . . . . . . . . . . . . . . . . . . . . . . . . . . . . . 028219539 028219628
9

RISK FACTORS
Prospective investors should carefully consider the risks described below, together with the risks describedin the other sections of this offering memorandum before making any investment decision relating to our notes.The occurrence of any of the following events could have a material adverse effect on our business including ourability to grow our asset portfolio, the quality of our assets, our liquidity, our financial performance, ourstockholders’ equity, our ability to implement our strategy and our ability to repay the interest or principal onthe note in a timely fashion or at all.
Before making an investment decision, prospective investors should carefully consider all of the informationcontained in this offering memorandum, including the financial statements included in this offeringmemorandum.
Risks Relating to India
A slowdown in economic growth or rise in interest rates in India could cause our business to suffer.
Any slowdown in the Indian economy or volatility of global commodity prices, in particular oil and steelprices, could adversely affect our borrowers and contractual counterparties. Because of the importance of ourcommercial banking operations for retail customers and the increasing importance of our agricultural loanportfolio to our business, any slowdown in the growth of the housing, automobiles and agricultural sectors couldadversely impact our business. Since 2004, interest rates in the Indian economy have increased significantly.Slowdown in demand for loans from corporate customers, retail customers and customers in the agriculturalsector, including due to higher interest rates, could adversely impact our business.
A significant increase in the price of crude oil could adversely affect the Indian economy, which couldadversely affect our business.
India imports approximately 70.0% of its requirements of crude oil, which were approximately 31.3% oftotal imports in fiscal 2006. For example, the sharp increase in global crude oil prices during fiscal 2001adversely affected the Indian economy in terms of volatile interest and exchange rates. This adversely affectedthe overall state of liquidity in the banking system leading to intervention by the Reserve Bank of India. Since2004, there has been a sharp increase in global crude oil prices due to both increased demand and pressure onproduction and refinery capacity, and political and military tensions in key oil-producing regions. The full burdenof the oil price increase has not been passed to Indian consumers and has been substantially absorbed by thegovernment and government-owned oil marketing companies. While global crude prices have moderatedrecently, sustained high levels, further increases or volatility of oil prices and the pass-through of increases toIndian consumers could have a material negative impact on the Indian economy and the Indian banking andfinancial system in particular, including through a rise in inflation and market interest rates and a higher tradedeficit.
A significant change in the Indian government’s economic liberalization and deregulation policies couldadversely affect our business and the price of our notes.
Our assets and customers are predominantly located in India. The Indian government has traditionallyexercised and continues to exercise a dominant influence over many aspects of the economy. Governmentpolicies could adversely affect business and economic conditions in India and our business.
Financial instability in other countries, particularly emerging market countries and countries where wehave established operations, could adversely affect our business and the price of our notes.
The Indian economy is influenced by economic and market conditions in other countries, particularlyemerging market countries in Asia. We have also established operations in several other countries. A loss of
17

investor confidence in the financial systems of other emerging markets and countries where we have establishedoperations or any worldwide financial instability may cause increased volatility in the Indian financial marketsand, directly or indirectly, adversely affect the Indian economy and financial sector and our business.
If regional hostilities, terrorist attacks or social unrest in some parts of the country increase, our businessand the price of our notes could be adversely affected.
India has from time to time experienced social and civil unrest and hostilities both internally and withneighboring countries. In the past, there have been military confrontations between India and Pakistan. India hasalso experienced terrorist attacks in some parts of the country. These hostilities and tensions could lead topolitical or economic instability in India and adversely affect our business.
Trade deficits could adversely affect our business and the price of our notes.
India’s trade relationships with other countries and its trade deficit, driven to a major extent by global crudeoil prices, may adversely affect Indian economic conditions. If trade deficits increase or are no longermanageable because of the rise in global crude oil prices or otherwise, the Indian economy, and therefore ourbusiness, could be adversely affected.
Natural calamities could adversely affect the Indian economy, our business and the price of our notes.
India has experienced natural calamities like earthquakes, floods and drought in the past few years. Theextent and severity of these natural disasters determine their impact on the Indian economy. For example, infiscal 2003, many parts of India received significantly less than normal rainfall. As a result of the droughtconditions in the economy during fiscal 2003, the agricultural sector recorded a negative growth of 7.0%. Also,the erratic progress of the monsoon in fiscal 2005 adversely affected sowing operations for certain crops andresulted in a decline in the growth rate of the agricultural sector from 9.6% in fiscal 2004 to 0.7% in fiscal 2005.The agricultural sector grew by 3.9% in fiscal 2006 and by 2.6% in the first half of fiscal 2007. Further prolongedspells of below or above normal rainfall or other natural calamities could adversely affect the Indian economyand our business, especially in view of our strategy of increasing our exposure to rural India.
Financial difficulty and other problems in certain financial institutions in India could adversely affect ourbusiness and the price of our notes.
As an Indian bank, we are exposed to the risks of the Indian financial system which may be affected by thefinancial difficulties faced by certain Indian financial institutions because the commercial soundness of manyfinancial institutions may be closely related as a result of credit, trading, clearing or other relationships. This risk,which is sometimes referred to as “systemic risk”, may adversely affect financial intermediaries, such as clearingagencies, banks, securities firms and exchanges with whom we interact on a daily basis. Any such difficulties orinstability of the Indian financial system in general could create an adverse market perception about Indianfinancial institutions and banks and adversely affect our business. See also “Overview of the Indian FinancialSector”. As the Indian financial system operates within an emerging market, it faces risks of a nature and extentnot typically faced in more developed economies, including the risk of deposit runs notwithstanding the existenceof a national deposit insurance scheme. For example, in April 2003, unsubstantiated rumors, believed to haveoriginated in Gujarat, a state in India, alleged that we were facing liquidity problems. Although our liquidityposition was sound, we witnessed higher than normal deposit withdrawals on account of these unsubstantiatedrumors for several days in April 2003. We successfully controlled the situation in this instance, but any failure tocontrol such situations in the future could result in high volumes of deposit withdrawals which would adverselyimpact our liquidity position.
A decline in India’s foreign exchange reserves may affect liquidity and interest rates in the Indian economywhich could adversely impact us.
A decline in India’s foreign exchange reserves could result in reduced liquidity and higher interest rates inthe Indian economy, which could adversely affect our business. See also “—Risks Relating to Our Business”.
18

Any downgrading of India’s debt rating by an international rating agency could adversely affect ourbusiness and our liquidity.
Any adverse revisions to India’s credit ratings for domestic and international debt by international ratingagencies may adversely affect our business and limit our access to capital markets and decrease our liquidity.
Uncertain enforcement of civil liabilities.
We are incorporated under the laws of India and all of our directors and executive officers reside outside theUnited States. In addition, a substantial portion of our assets are located outside the United States. As a result,you may be unable to:
• effect service of process within the United States upon us and other persons or entities; or
• enforce in the U.S. courts judgments obtained in the U.S. courts against us and other persons orentities, including judgments predicated upon the civil liability provision of the federal securities lawsof the United States.
The United States and India do not currently have a treaty providing for reciprocal recognition andenforcement of judgments (other than arbitration awards) in civil and commercial matters. Therefore, a finaljudgment for the payment of money rendered by any federal or state court in the United States for civil liability,whether or not predicated solely upon the general securities laws of the United States, would not be enforceablein India.
However, the party in whose favor such final judgment is rendered may bring a new suit in a competentcourt in India based on a final judgment that has been obtained in the United States within three years ofobtaining such final judgment. If and to the extent that Indian courts were of the opinion that fairness and goodfaith so required, they would, under current practice, give binding effect to the final judgment which had beenrendered in the United States, unless such a judgment contravened principles of public policy of India. It isunlikely that an Indian court would award damages on the same basis as a foreign court if an action is brought inIndia. Moreover, it is unlikely that an Indian court would award damages to the extent awarded in a finaljudgment rendered in the United States if it believed that the amount of damages awarded were excessive orinconsistent with Indian practice. In addition, any person seeking to enforce a foreign judgment in India isrequired to obtain prior approval of the Reserve Bank of India to execute such a judgment or to repatriate anyamount recovered. For more information, see “Enforceability of Civil Liabilities” in this offering memorandum.
Risks Relating to Our Business
Our business is particularly vulnerable to interest rate risk and volatility in interest rates could adverselyaffect our net interest margin, the value of our fixed income portfolio, our income from treasury operationsand our financial performance.
As a result of certain reserve requirements of the Reserve Bank of India, we are more structurally exposed tointerest rate risk than banks in many other countries. See “Supervision and Regulation—Legal ReserveRequirements”. These requirements result in our maintaining a large portfolio of fixed income Government ofIndia securities, and we could be materially adversely impacted by a rise in interest rates, especially if the risewere sudden or sharp. These requirements also have a negative impact on our net interest income and net interestmargin because we earn interest on a portion of our assets at rates that are generally less favorable than thosetypically received on our other interest-earning assets. If the yield on our interest-earning assets does not increaseat the same time or to the same extent as our cost of funds, or if our cost of funds does not decline at the sametime or to the same extent as the yield on our interest-earning assets, our net interest income and net interestmargin would be adversely impacted. We are also exposed to interest rate risk through our treasury operationsand our subsidiary, ICICI Securities, which is a primary dealer in Government of India securities. A rise ininterest rates or greater interest rate volatility could adversely affect our income from treasury operations or the
19

value of our fixed income securities trading portfolio. Sharp and sustained increases in the rates of interestcharged on floating rate home loans, which are a material proportion of our loan portfolio, would result inextension of loan maturities and higher monthly installments due from borrowers, which could result in higherrates of default in this portfolio.
A large proportion of ICICI’s loans consisted of project finance assistance, a substantial portion of which isparticularly vulnerable to completion and other risks.
Long-term project finance assistance was a significant proportion of ICICI’s asset portfolio and continues tobe a part of our loan portfolio. The viability of these projects depends upon a number of factors, including marketdemand, government policies and the overall economic environment in India and the international markets.These projects are particularly vulnerable to a variety of risks, including completion risk and counterparty risk,which could adversely impact their ability to generate revenues. We cannot be sure that these projects willperform as anticipated. In the past, we experienced a high level of default and restructuring in our project financeloan portfolio as a result of the downturn in certain global commodity markets and increased competition inIndia. Future project finance losses or high levels of loan restructuring could have a materially adverse effect onour profitability and the quality of our loan portfolio.
We have a high concentration of loans to certain customers and sectors and if a substantial portion of theseloans become non performing, the overall quality of our loan portfolio, our business and the price of ournotes could be adversely affected.
Our loan portfolio and non-performing asset portfolio have a high concentration in certain customers andsectors. See “Business—Asset Composition and Classification—Loan Concentration”. In the past, certain ofthese borrowers and sectors have been adversely affected by economic conditions in varying degrees. Creditlosses or financial difficulties of these borrowers and sectors in the future could adversely affect our business, ourfinancial performance, our shareholders’ equity and the price of our notes.
If we are not able to control the level of non-performing assets in our portfolio, our business will suffer.
We have experienced rapid growth in our retail loan portfolio. See “Business—Asset Composition andClassification—Loan Concentration”. Various factors, including a rise in unemployment, prolonged recessionaryconditions, a sharp and sustained rise in interest rates, developments in the Indian economy, movements in globalcommodity markets and exchange rates and global competition could cause an increase in the level ofnon-performing assets on account of these retail loans and have a material adverse impact on the quality of ourloan portfolio. In addition, under the directed lending norms of the Reserve Bank of India, we are required toextend 50.0% of our residual net bank credit (excluding the advances of ICICI at year-end fiscal 2002) to certaineligible sectors, which are categorized as “priority sectors”. See “Business—Asset Composition andClassification—Loan Concentration—Directed Lending”. We may experience a significant increase innon-performing assets in our directed lending portfolio, particularly loans to the agricultural sector and small-scale industries, where we are less able to control the portfolio quality and where economic difficulties are likelyto affect our borrowers more severely. Any change by the Reserve Bank of India in the directed lending normsmay result in our inability to meet the priority sector lending requirements as well as require us to increase ourlending to relatively riskier segments and may result in an increase in non-performing assets in the directedlending portfolio. We may not be able to control or reduce the level of non-performing assets in our project andcorporate finance portfolio. We may not be successful in our efforts to improve collections and foreclose onexisting non-performing assets. We also have investments in security receipts arising out of the sale ofnon-performing assets by us to Asset Reconstruction Company (India) Limited, a reconstruction companyregistered with the Reserve Bank of India. See “Business—Asset Composition and Classification”. There can beno assurance that Asset Reconstruction Company (India) Limited will be able to recover these assets and redeemour investments in security receipts and that there will be no reduction in the value of these investments.
20
If we are not able to control or reduce the level of non-performing assets, the overall quality of our loanportfolio may deteriorate and our business may be adversely affected.
Further deterioration of our non-performing asset portfolio and an inability to improve our provisioningcoverage as a percentage of gross non-performing assets could adversely affect the price of our notes.
Although we believe that our total provisions will be adequate to cover all known losses in our assetportfolio, there can be no assurance that there will be no deterioration in the provisioning coverage as apercentage of gross non-performing assets or otherwise or that the percentage of non-performing assets that wewill be able to recover will be similar to our and ICICI’s past experience of recoveries of non-performing assets.In the event of any further deterioration in our non-performing asset portfolio, there could be an adverse impacton our business, our future financial performance, our stockholders’ equity and the price of our notes.
The value of our collateral may decrease or we may experience delays in enforcing our collateral whenborrowers default on their obligations to us which may result in failure to recover the expected value ofcollateral security exposing us to a potential loss.
A substantial portion of our loans to corporate and retail customers are secured by collateral. See“Business—Asset Composition and Clarification—Classification of Assets—Non-Performing Asset Strategy”.We may not be able to realize the full value of our collateral as a result of delays in bankruptcy and foreclosureproceedings, defects in the perfection of collateral, fraudulent transfers by borrowers and other factors, includinglegislative changes and judicial pronouncements. Failure to recover the expected value of collateral could exposeus to potential losses, which could adversely affect our business.
The failure of our restructured loans to perform as expected or a significant increase in the level ofrestructured loans in our portfolio could affect our business.
Our standard assets include restructured standard loans. Our borrowers’ requirements to restructure theirloans can be attributed to several factors, including increased competition arising from economic liberalization inIndia, variable industrial growth, a sharp decline in commodity prices, the high level of debt in the financing ofprojects and capital structures of companies in India and the high interest rates in the Indian economy during theperiod in which a large number of projects contracted their borrowings. These factors reduced profitability forcertain of our borrowers and also resulted in the restructuring of certain Indian companies in sectors includingiron and steel, textiles and cement. The failure of these borrowers to perform as expected or a significant increasein the level of restructured assets in our portfolio could adversely affect our business, our future financialperformance, our shareholders’ equity and the price of our notes.
We face greater credit risks than banks in developed economies.
Our credit risk is higher because most of our borrowers are based in India. Unlike several developedeconomies, a nationwide credit bureau has become operational in India only recently. This may affect the qualityof information available to us about the credit history of our borrowers, especially individuals and smallbusinesses. In addition, the credit risk of our borrowers, particularly small and middle market companies, ishigher than borrowers in more developed economies due to the greater uncertainty in the Indian regulatory,political, economic and industrial environment and the difficulties of many of our corporate borrowers to adapt toglobal technological advances. Also, several of our corporate borrowers suffered from low profitability becauseof increased competition from economic liberalization, a sharp decline in commodity prices, a high debt burdenand high interest rates in the Indian economy at the time of their financing, and other factors. This may lead to anincrease in the level of our non-performing assets and there could be an adverse impact on our business, ourfuture financial performance, our shareholders’ equity and the price of our notes.
21

Our funding is primarily short-term and if depositors do not roll over deposited funds upon maturity, ourbusiness could be adversely affected.
Most of our incremental funding requirements, including replacement of maturing liabilities of ICICI(which generally had longer maturities), are met through short-term funding sources, primarily in the form ofdeposits including inter-bank deposits. Our customer deposits generally have a maturity of less than one year.However, a large portion of our assets, primarily the assets of ICICI and our home loan portfolio, have mediumor long-term maturities, creating the potential for funding mismatches. Our ability to raise fresh deposits andgrow our deposit base depends in part on our ability to expand our network of branches, which requires theapproval of the Reserve Bank of India. In September 2005, the Reserve Bank of India replaced the existingsystem of granting authorisations for opening individual branches with a system of giving aggregated approvalscovering both branches and existing non-branch channels like ATMs, on an annual basis. While we have recentlyreceived the Reserve Bank of India’s authorizations for establishing new branches and additional off-site ATMs,there can be no assurance that these authorizations or future authorizations granted by the Reserve Bank of Indiawill meet our requirements for branch expansion to achieve the desired growth in our deposit base. High volumesof deposit withdrawals or failure of a substantial number of our depositors to roll over deposited funds uponmaturity or to replace deposited funds with fresh deposits as well as our inability to grow our deposit base, couldhave an adverse effect on our liquidity position, our business, our future financial performance, our stockholders’equity and the price of our notes. See also “—Financial difficulty and other problems in certain financialinstitutions in India could adversely affect our business and the price of our notes”.
We are subject to legal and regulatory risk which may adversely affect our business.
We are subject to a wide variety of banking and financial services laws and regulations and a large numberof regulatory and enforcement authorities in each of the jurisdictions in which we operate. The laws andregulations governing the banking and financial services industry have become increasingly complex governing awide variety of issues, including interest rates, liquidity, capital adequacy, securitization, investments, ethicalissues, money laundering, privacy, record keeping, and marketing and selling practices, with sometimesoverlapping jurisdictional or enforcement authorities.
Failure to comply with applicable regulations in various jurisdictions, including unauthorized actions byemployees, representatives, agents and third parties, suspected or perceived failures and media reports, andensuing inquiries or investigations by regulatory and enforcement authorities, has resulted, and may result inregulatory action including financial penalties and restrictions on or suspension of the related businessoperations. For example, in fiscal 2006, the Reserve Bank of India imposed a penalty of Rs. 0.5 million(US$ 10,881) on us in connection with our role as collecting bankers in certain public offerings of equity bycompanies in India.
In addition, a failure to comply with the applicable regulations in various jurisdictions by our employees,representatives, agents and third party service providers, either in or outside the course of their services, orsuspected or perceived failures by them, may result in inquiries or investigations by regulatory and enforcementauthorities, in regulatory or enforcement action against either us or such employees, representatives, agents andthird party service providers or both and such actions may, amongst other consequences, impact our reputation,result in adverse media reports, lead to increased or enhanced regulatory or supervisory concerns, lead toadditional costs, penalties, claims and expenses being incurred by us or impact adversely on our ability toconduct business owing to implications on business continuity, possible distraction, lack of proper attention ortime by such employees, representatives, agents and third party service providers to their official roles and duties,or suspension or termination by us of their services and having to find suitable replacements apart from personalliability, financial or other penalties and restrictions that may be imposed on or suffered by them, includingpersonal liability for criminal violation.
If we fail to manage our legal and regulatory risk in the many jurisdictions in which we operate, includingsome or all of the compliance failures, our business could suffer, our reputation could be harmed and we would
22
be subject to additional legal risk. This could, in turn, increase the size and number of claims and damagesasserted against us or subject us to regulatory investigations, enforcement actions or other proceedings, or lead toincreased regulatory or supervisory concerns. We may also be required to spend additional time and resources onany remedial measures which could have an adverse effect on our business.
Despite our best efforts to comply with all applicable regulations, there are a number of risks that cannot becompletely controlled. Our rapid international expansion has led to increased risk in this respect. Regulators inevery jurisdiction in which we operate or have listed our notes have the power to bring administrative or judicialproceedings against us (or our employees, representatives, agents and third party service providers), which couldresult, among other things, in suspension or revocation of one or more of our licenses, cease and desist orders,fines, civil penalties, criminal penalties or other disciplinary action which could materially harm our results ofoperations and financial condition.
We cannot predict the timing or form of any current or future regulatory or law enforcement initiatives,which we note are increasingly common for international banks, but we would expect to cooperate with any suchregulatory investigation or proceeding.
Regulatory changes in India or other jurisdictions in which we operate could adversely affect our business.
The laws and regulations or the regulatory or enforcement environment in any of those jurisdictions inwhich we operate may change at any time and may have an adverse effect on the products or services we offer,the value of our assets or our business in general. In its mid-term review of the annual policy statement for fiscal2005, the Reserve Bank of India increased the risk weight for the computation of capital adequacy from 50% to75% in the case of housing loans and from 100% to 125% in the case of consumer credit (including personalloans and credit cards) as a temporary counter-cyclical measure. In July 2005, the Reserve Bank of Indiaincreased the risk weight for capital market exposure and exposure to commercial real estate from 100% to125%. In October 2005, in its mid-term review of the annual policy statement for fiscal 2005, the Reserve Bankof India increased the requirement of general provisioning for standard advances from 0.25% to 0.40% exceptdirect advances to agriculture and small and medium enterprise sectors. In February 2006, the Reserve Bank ofIndia issued its final guidelines on securitization of standard assets under which we are, in respect of transactionsafter February 1, 2006, required to maintain higher capital for credit enhancement and also amortize the profit onsecuritization over the life of the related loans. In April 2006, the Reserve Bank of India increased therequirement of general provisioning for certain categories of advances from 0.40% to 1.00% and also increasedthe risk weight on exposures to commercial real estate from 125.0% to 150.0%. In its mid term review of theannual policy statement announced in October 2006, the Reserve Bank of India increased the repo rate by 25basis points from 7.0% to 7.25%. In December 2006, the Reserve Bank of India increased the cash reserve ratioby 50 basis points from 5.0% to 5.5%. Similar changes in the future could have an adverse impact on our capitaladequacy and profitability. Pursuant to the recent amendment to the Reserve Bank of India Act, no interest ispayable on cash reserve ratio balances, on which interest was hitherto paid by the Reserve Bank of India. Anychange by the Reserve Bank of India in the directed lending norms may result in our inability to meet the prioritysector lending requirements as well as require us to increase our lending to relatively riskier segments and mayresult in an increase in non-performing assets in the directed lending portfolio.
We have experienced rapid international growth in the last three years which has increased the complexityof the risks that we face.
Until very recently, we operated only in India. Beginning in fiscal 2004, we began a rapid internationalexpansion opening banking subsidiaries in the United Kingdom, Canada and Russia and branches in Hong Kong,Bahrain, Singapore, Sri Lanka and Dubai and representative offices in several countries. As of the six monthsended September 30, 2006, the assets of these banking subsidiaries and branches constituted approximately 16%of the consolidated assets of ICICI Bank and its banking subsidiaries. In addition, we have substantiallyexpanded, in a number of jurisdictions, our services to non-resident Indians for the remittance of funds to India.
23

This rapid international expansion into banking in multiple jurisdictions exposes us to a new variety ofregulatory and business challenges and risks, including cross-cultural risk and has increased the complexity ofour risks in a number of areas including currency risks, interest rate risks, compliance risk, regulatory andreputational risk and operational risk. See also “We are subject to legal and regulatory risk which may adverselyaffect our business”. The skills required for this business could be different from those required for our Indianbusiness and we may not be able to attract the required talented professionals. If we are unable to manage theserisks, our business could be adversely affected.
A determination against us in respect of disputed tax assessments may adversely impact our financialperformance.
We have been assessed a significant amount in additional taxes by the Government of India’s tax authoritiesin excess of our provisions. See “Business—Legal and Regulatory Proceedings”. We have appealed all of thesedemands. While we expect that no additional liability will arise out of these disputed demands, there can be noassurance that these matters will be settled in our favor or that no further liability will arise out of these demands.Any additional tax liability may adversely impact our financial performance and shareholders’ equity.
We are involved in various litigations and any final judgment awarding material damages against us couldhave a material adverse impact on our future financial performance, our stockholders’ equity and the priceof our notes.
We are often involved in litigations for a variety of reasons, which generally arise because we seek torecover our dues from borrowers or because customers seek claims against us. The majority of these cases arisein the normal course and we believe, based on the facts of the cases and consultation with counsel, that thesecases generally do not involve the risk of a material adverse impact on our financial performance orshareholders’ equity. Where we assess that there is a probable risk of loss, it is our policy to make provisions forthe loss. However, we do not make provisions or disclosures in our financial statements where our assessment isthat the risk is insignificant. See “Business—Legal and Regulatory Proceedings”. We cannot guarantee that thejudgments in any of the litigation in which we are involved would be favorable to us. If our assessment of therisk changes, our view on provisions will also change.
Our rapid retail expansion in India, our rural initiative and our insurance ventures expose us to increasedrisk that may adversely affect our business.
We have experienced rapid growth in our retail loan portfolio. Our joint ventures in life insurance andgeneral insurance have experienced rapid growth in their business volumes. Our branch network has alsosignificantly expanded and we are entering into new, smaller second tier cities within India as part of this growthstrategy. In addition, we are now beginning a rural initiative designed to bring our products and services intomany rural areas. This rapid growth of the retail loan business and the insurance businesses as well as the ruralinitiative exposes us to increased risks within India including the risk that our impaired loans may grow fasterthan anticipated, the risk that we may not be able to raise the substantial capital required for these businesses,increased operational risk, increased fraud risk and increased regulatory and legal risk. See also “We are subjectto legal and regulatory risk which may adversely affect our business”.
If we are not able to integrate any future acquisitions, our business could be disrupted.
We may seek opportunities for growth through acquisitions or be required to undertake mergers mandatedby RBI. On December 9, 2006, our board of directors and the board of directors of The Sangli Bank Limited, orSangli Bank, an unlisted private sector bank, approved an all-stock amalgamation of Sangli Bank with us. Atyear-end fiscal 2006, Sangli Bank had total assets of Rs. 21.51 billion, total deposits of Rs. 20.04 billion, totalloans of Rs. 8.88 billion and total capital adequacy of only 1.6%. In fiscal 2006, it incurred a loss of Rs. 0.29billion. The amalgamation is subject to the approval of the shareholders of both banks and the Reserve Bank of
24

India and there can be no assurance that such approval will be received. This and any future acquisitions ormergers may involve a number of risks, including deterioration of asset quality, diversion of our management’sattention required to integrate the acquired business and the failure to retain key acquired personnel and clients,leverage synergies or rationalise operations, or develop the skills required for new businesses and markets, orunknown and known liabilities, some or all of which could have an adverse effect on our business.
We are exposed to fluctuations in foreign exchange rates.
As a financial intermediary we are exposed to exchange rate risk. See “Risk Management—Quantitative andQualitative Disclosures About Market Risk—Exchange Rate Risk”. Adverse movements and volatility in foreignexchange rates may adversely affect our borrowers, the quality of our exposure to our borrowers and ourbusiness.
Our business is very competitive and our growth strategy depends on our ability to compete effectively.
Within the Indian market, we face intense competition from Indian and foreign commercial banks in all ourproducts and services. Foreign banks also operate in India through non-banking finance companies. Furtherliberalization of the Indian financial sector could lead to a greater presence or new entries of foreign banksoffering a wider range of products and services, which would significantly toughen our competitive environment.In addition, the Indian financial sector may experience further consolidation, resulting in fewer banks andfinancial institutions, some of which may have greater resources than us. The Government of India has indicatedits support for consolidation among government-owned banks. The Reserve Bank of India has announced a roadmap for the presence of foreign banks in India that would, after a review in 2009, allow foreign banks to acquireup to a 74.0% shareholding in an Indian private sector bank. See “Business—Competition” and “Overview of theIndian Financial Sector—Commercial Banks—Foreign Banks”. Due to competitive pressures, we may be unableto successfully execute our growth strategy and offer products and services at reasonable returns and this mayadversely impact our business.
In our international operations we also face intense competition from the full range of competitors in thefinancial services industry, both banks and non-banks and both Indian and foreign banks. We remain a small tomid-size player in the international markets and many of our competitors have resources much greater than ourown.
Fraud and significant security breaches in our computer system and network infrastructure could adverselyimpact our business.
Our business operations are based on a high volume of transactions. Although we take adequate measures tosafeguard against system-related and other fraud, there can be no assurance that we would be able to preventfraud. Our reputation could be adversely affected by fraud committed by employees, customers or outsiders.Physical or electronic break-ins, security breaches, other disruptive problems caused by our increased use of theInternet or power disruptions could also affect the security of information stored in and transmitted through ourcomputer systems and network infrastructure. Although we have implemented security technology andoperational procedures to prevent such occurrences, there can be no assurance that these security measures willbe successful. A significant failure in security measures could have a material adverse effect on our business.
System failures could adversely impact our business.
Given the increasing share of retail products and services and transaction banking services in our totalbusiness, the importance of systems technology to our business has increased significantly. Our principaldelivery channels include ATMs, call centers and the Internet. Any failure in our systems, particularly for retailproducts and services and transaction banking, could significantly affect our operations and the quality of ourcustomer service and could result in business and financial losses.
25

There is operational risk associated with our industry which, when realized, may have an adverse impact onour business.
We, like all financial institutions, are exposed to many types of operational risk, including the risk of fraudor other misconduct by employees or outsiders, unauthorized transactions by employees and third parties(including violation of regulations for prevention of corrupt practices, and other regulations governing ourbusiness activities), or operational errors, including clerical or record keeping errors or errors resulting fromfaulty computer or telecommunications systems. We use direct marketing associates for marketing our retailcredit products. We also outsource some functions to other agencies. Given our high volume of transactions,certain errors may be repeated or compounded before they are discovered and successfully rectified. In addition,our dependence upon automated systems to record and process transactions may further increase the risk thattechnical system flaws or employee tampering or manipulation of those systems will result in losses that aredifficult to detect. We may also be subject to disruptions of our operating systems, arising from events that arewholly or partially beyond our control (including, for example, computer viruses or electrical ortelecommunication outages), which may give rise to a deterioration in customer service and to loss or liability tous. We are further exposed to the risk that external vendors may be unable to fulfill their contractual obligationsto us (or will be subject to the same risk of fraud or operational errors by their respective employees as are we),and to the risk that its (or its vendors’) business continuity and data security systems prove not to be sufficientlyadequate. We also face the risk that the design of our controls and procedures prove inadequate, or arecircumvented, thereby causing delays in detection or errors in information. Although we maintain a system ofcontrols designed to keep operational risk at appropriate levels, like all banks we have suffered losses fromoperational risk and there can be no assurance that we will not suffer losses from operational risks in the futurethat may be material in amount, and our reputation could be adversely affected by the occurrence of any suchevents involving our employees, customers or third parties. For a discussion of how operational risk is managed,see “Business—Risk Management—Operational Risk”.
We are subject to credit, market and liquidity risk which may have an adverse effect on our credit ratingsand our cost of funds.
To the extent any of the instruments and strategies we use to hedge or otherwise manage our exposure tomarket or credit risk are not effective, we may not be able to mitigate effectively our risk exposures in particularmarket environments or against particular types of risk. Our balance sheet growth will be dependent uponeconomic conditions, as well as upon our determination to securitize, sell, purchase or syndicate particular loansor loan portfolios. Securitization is an important element of our funding and capital management strategy. TheIndian securitization market is still evolving in terms of asset classes, participants and regulations and there canbe no assurance of our continuing ability to securitize loan portfolios. In November 2006, CRISIL, an Indiancredit rating agency, lowered the rating of a personal loan receivables pool, securitized by us, by two notches dueto higher than anticipated utilization of the cash collateral stipulated at the initiation of the transaction. Ourtrading revenues and interest rate risk are dependent upon our ability to properly identify, and mark to market,changes in the value of financial instruments caused by changes in market prices or rates. Our earnings aredependent upon the effectiveness of our management of migrations in credit quality and risk concentrations, theaccuracy of our valuation models and our critical accounting estimates and the adequacy of our allowances forloan losses. To the extent our assessments, assumptions or estimates prove inaccurate or not predictive of actualresults, we could suffer higher than anticipated losses. See also “—Further deterioration of our non-performingasset portfolio and an inability to improve our provisioning coverage as a percentage of gross non-performingassets, could adversely affect the price of our notes”. The successful management of credit, market andoperational risk is an important consideration in managing our liquidity risk because it affects the evaluation ofour credit ratings by rating agencies. Rating agencies may reduce or indicate their intention to reduce the ratingsat any time. See also “—Any downgrading of India’s debt rating by an international rating agency couldadversely affect our business and the price of our notes”. The rating agencies can also decide to withdraw theirratings altogether, which may have the same effect as a reduction in our ratings. Any reduction in our ratings (orwithdrawal of ratings) may increase our borrowing costs, limit our access to capital markets and adversely affectour ability to sell or market our products, engage in business transactions, particularly longer-term and
26

derivatives transactions, or retain our customers. This, in turn, could reduce our liquidity and negatively impactour operating results and financial condition. For more information relating to our ratings, see “Business—Quantitative and Qualitative Disclosures About Market Risk—Liquidity Risk”.
We depend on the accuracy and completeness of information about customers and counterparties.
In deciding whether to extend credit or enter into other transactions with customers and counterparties, wemay rely on information furnished to us by or on behalf of customers and counterparties, including financialstatements and other financial information. We may also rely on certain representations as to the accuracy andcompleteness of that information and, with respect to financial statements, on reports of independent auditors.For example, in deciding whether to extend credit, we may assume that a customer’s audited financial statementsconform with generally accepted accounting principles and present fairly, in all material respects, the financialcondition, results of operations and cash flows of the customer. Our financial condition and results of operationscould be negatively affected by relying on financial statements that do not comply with generally acceptedaccounting principles or other information that is materially misleading.
Any inability to attract and retain talented professionals may adversely impact our business.
Attracting and retaining talented professionals is a key element of our strategy and we believe it to be asignificant source of competitive advantage. See “Business—Employees”. Our inability to attract and retaintalented professionals or the loss of key management personnel could have an adverse impact on our business.
If we are required to change our accounting policies with respect to the expensing of stock options, ourearnings could be adversely affected.
We currently deduct the expense of employee stock option grants from our income based on the intrinsicvalue method and not on the fair value method. Had compensation costs for our employee stock options beendetermined in a manner consistent with the fair value approach, our profit after tax for the six months endedSeptember 30, 2006 as reported would have been reduced to the pro forma amount of Rs. 13.30 billion (US$ 289million) from Rs. 13.75 billion (US$ 300 million) and for fiscal 2006, to Rs. 24.88 billion (US$ 541 million)from Rs. 25.40 billion (US$ 553 million).
Risks Relating to the Notes
A public market may not develop for the notes.
Prior to this offering there has been no trading market in the notes. Approval-in-principle has been obtainedfor the listing of the notes on the Singapore Exchange, but we cannot assure you that the listing will be obtained.The Initial Purchasers have advised us that one or more of their affiliates currently intends to make a market inthe notes. However, the Initial Purchasers’ affiliates are not obligated to make markets in the notes and maydiscontinue this market-making activity at any time without notice. In addition, market-making activity by theInitial Purchasers’ affiliates may be subject to limits imposed by applicable law. As a result, we cannot assureyou that any market in the notes will develop or, if it does develop, it will be maintained. If an active market inthe notes fails to develop or be sustained, you may not be able to sell the notes or may have to sell them at alower price.
The notes will be unsecured and deeply subordinated obligations.
The notes will be unsecured and deeply subordinated obligations. The notes are not deposits and are notinsured by any regulatory agency and they may not be used as collateral for any loan made by us. In the event ofa winding up of our operations, your claims will be subordinated in right of payment to the prior payment in fullof all of our other liabilities (whether actual or contingent, present or future) including all deposit liabilities andother liabilities and all of our offices and branches, except those liabilities which by their terms rank equal withor junior to the notes.
27

As a consequence of the subordination provisions, in the event of a winding up of our operations, you mayrecover less rateably than the holders of deposit liabilities or the holders of our other liabilities that rank senior tothe notes. The notes, the Indenture and the Calculation Agency Agreement do not limit the amount of theliabilities ranking senior to the notes which may be hereafter incurred or assumed by us.
You will have limited rights of acceleration if amounts are due but not paid on the notes.
In the event of a default in payment on the notes, you will have no right to accelerate payments on the notes,except if a court order is made or an effective resolution is passed for our winding-up.
The notes may not qualify as Upper Tier II capital.
There is no guarantee that the notes will qualify as Upper Tier II capital under the regulations published bythe Reserve Bank of India. See “Supervision and Regulation—Capital Adequacy Requirements”. The failure ofthe notes to qualify as Upper Tier II capital due to any reason (including changes in laws, regulations orinterpretations of the Reserve Bank of India or other government authorities) would adversely affect our capitaladequacy ratio.
The rating of the notes may be lowered or withdrawn depending on some factors, including the ratingagency’s assessment of our financial strength and Indian sovereign risk.
It is a condition to the issuance of the notes that they be rated at least “Baa2” by Moody’s or “BB-” by S&P.The rating addresses the likelihood of payment of principal on redemption and the timely payment of interest oneach payment date. The rating of the notes is not a recommendation to purchase, hold or sell the notes, and therating does not comment on market price or suitability for a particular investor. We cannot assure you that therating of the notes will remain for any given period of time or that the rating will not be lowered or withdrawn. Adowngrade in the rating of the notes will not be an event of default under the indenture. The assigned rating maybe raised or lowered depending, among other factors, on the rating agency’s assessment of our financial strengthas well as its assessment of Indian sovereign risk generally.
28

USE OF PROCEEDS
The net proceeds from the sale of the notes is approximately US$ 746,500,000 (after deducting fees,commissions and expenses) which we intend to use for general corporate purposes in accordance with anyapplicable rules or regulations.
29

CAPITALIZATION
The following table sets out our capitalization at September 30, 2006 derived from our auditedunconsolidated financial statements prepared in accordance with Indian GAAP. For additional information, seeour financial statements and accompanying schedules included elsewhere in this offering memorandum.
As of September 30, 2006
(Rs. inbillions)
(US$ inmillions)
Borrowings(1):Short-term debt(2) . . . . . . . . . . . . . . . . . . . . . . . . . . . . . . . . . . . . . . . . . . . . . . . . . . . . . 183.63 3,996Long-term debt(3) . . . . . . . . . . . . . . . . . . . . . . . . . . . . . . . . . . . . . . . . . . . . . . . . . . . . . 332.38 7,234
Total debts (A) . . . . . . . . . . . . . . . . . . . . . . . . . . . . . . . . . . . . . . . . . . . . . . . . . . . . . . . 516.01 11,230
Shareholders’ funds:Share capital(4) . . . . . . . . . . . . . . . . . . . . . . . . . . . . . . . . . . . . . . . . . . . . . . . . . . . . . . . . . . . . 12.43 270Reserves . . . . . . . . . . . . . . . . . . . . . . . . . . . . . . . . . . . . . . . . . . . . . . . . . . . . . . . . . . . . . . . . 226.57 4,931Less : Unamortized deferred revenue expenditure(5) . . . . . . . . . . . . . . . . . . . . . . . . . . . . . . 0.69 15
Total shareholders’ funds (B) . . . . . . . . . . . . . . . . . . . . . . . . . . . . . . . . . . . . . . . . . . . . . . 238.31 5,186
Total capitalization (A) + (B) . . . . . . . . . . . . . . . . . . . . . . . . . . . . . . . . . . . . . . . . . . . . . . . 754.32 16,416Capital adequacy:Tier I (%) . . . . . . . . . . . . . . . . . . . . . . . . . . . . . . . . . . . . . . . . . . . . . . . . . . . . . . . . . . . . . . . 9.38%Tier II (%) . . . . . . . . . . . . . . . . . . . . . . . . . . . . . . . . . . . . . . . . . . . . . . . . . . . . . . . . . . . . . . . 4.96%
Total (%) . . . . . . . . . . . . . . . . . . . . . . . . . . . . . . . . . . . . . . . . . . . . . . . . . . . . . . . . . . . . . . . 14.34%
(1) Borrowings do not include deposits.(2) Short-term debt is debt maturing within the next one year from the date of above statement, which includes
bonds in the nature of subordinated debt (excluded from Tier II capital) of Rs. 5.56 billion.(3) Includes Rs. 150.39 billion of unsecured redeemable debentures and bonds in the nature of subordinated
debt eligible for inclusion in Tier II capital.(4) Includes preference share capital of Rs. 3.50 billion.(5) Unamortized expenses on account of the early retirement option scheme offered to the employees.(6) We are raising funds simultaneously with this issue via a two-tranche bond issue out of our Bahrain branch
in an aggregate amount of USD 1,250,000,000.
30

SELECTED FINANCIAL DATA
Our financial and other data for fiscal 2002 through fiscal 2006 and the six months ended September 30,2005 and 2006 included in this offering memorandum have been derived from our unconsolidated financialstatements prepared in accordance with generally accepted accounting principles in India, or Indian GAAP,guidelines issued by the Reserve Bank of India from time to time and practices generally prevailing in thebanking industry in India. These financial statements do not include the results of operations of our subsidiariesand other consolidating entities. The principal subsidiaries whose results are not included are: ICICI SecuritiesLimited, ICICI Prudential Life Insurance Company Limited, ICICI Lombard General Insurance CompanyLimited, ICICI Venture Funds Management Company Limited, ICICI Home Finance Company Limited,Prudential ICICI Asset Management Company Limited, ICICI Bank UK Limited, ICICI Bank Canada Limitedand ICICI Bank Eurasia Limited Liability Company.
The financial statements for fiscal 2002 were audited by S. B. Billimoria & Co., Chartered Accountants, forfiscal 2003 jointly by N. M. Raiji & Co., Chartered Accountants and S. R. Batliboi & Co., Chartered Accountantsand for fiscal 2004, 2005 and 2006 and the six months ended September 30, 2005 by S. R. Batliboi & Co.,Chartered Accountants and for the six months ended September 30, 2006 by BSR & Co., Chartered Accountants.You should read the following discussion and analysis of our selected financial and operating data with the moredetailed information contained in our audited unconsolidated financial statements. The following discussion isbased on our audited unconsolidated financial statements and accompanying notes prepared in accordance withIndian GAAP, while the financial information in our annual reports on Form 20-F for the fiscal year 2006 isbased on our audited consolidated financial statements and accompanying notes prepared in accordance withIndian GAAP with the net income and stockholders’ equity reconciled to US GAAP. Financial information in ourannual report on Form 20-F for the fiscal years 2000 to 2005 filed with the SEC was prepared in accordance withUS GAAP. US GAAP requires consolidation as a fundamental basis of accounting. For a discussion of thesignificant differences between Indian GAAP and US GAAP, see “Description of Certain Differences betweenIndian GAAP and US GAAP”.
The amalgamation of ICICI, ICICI Personal Financial Services and ICICI Capital Services with us wasaccounted for using the purchase method of accounting. The effective date of the amalgamation was May 3,2002. However, the date of the amalgamation for accounting purposes under Indian GAAP was the AppointedDate under the Scheme of Amalgamation approved by the High Courts of Bombay and Gujarat and the ReserveBank of India, which was March 30, 2002. Accordingly, our profit and loss account (hereinafter referred to asincome statement) for fiscal 2002 includes the results of operations of ICICI, ICICI Personal Financial Servicesand ICICI Capital Services for only two days, i.e., March 30 and 31, 2002, although our balance sheet for fiscal2002 reflects the full impact of the amalgamation. As a result of the above, the income statement for fiscal 2003is not comparable with the income statements for fiscal 2002 and prior years.
31

Operating Results Data
The operating results data for the fiscal years 2003, 2004, 2005 and 2006 and the six months endedSeptember 30, 2005 and September 30, 2006 are not comparable with the operating results data for fiscal 2002due to the amalgamation.
Year ended March 31, Six months ended September 30,
2002 2003 2004 2005 2006 2005 2006 2006
(Rupees in billions, except per share data)
(US$ in millions,except per share
data)Interest income
Interest on advances(1) . . . . . . . . . . Rs. 7.74 Rs. 61.73 Rs. 63.80 Rs. 71.22 Rs.102.07 Rs. 45.54 Rs. 72.27 US$ 1,573Income on investments(2) . . . . . . . . 12.34 29.10 25.40 22.29 36.93 16.86 28.27 615Interest on balances with Reserve
Bank of India and other inter-bank funds and others . . . . . . . . . 1.46 4.42 3.88 4.28 4.06 2.05 4.54 99
Total interest income . . . . . . . . . . . . Rs. 21.54 Rs. 95.25 Rs. 93.08 Rs. 97.79 Rs.143.06 Rs. 64.45 Rs.105.08 US$ 2,287Interest expense
Interest on deposits . . . . . . . . . . . . . Rs.(13.89) Rs.(24.80) Rs.(30.23) Rs.(32.52) Rs. (58.37) Rs.(26.29) Rs. (53.38) (1,162)Interest on Reserve Bank of India/
inter-bank borrowings . . . . . . . . (0.48) (1.83) (2.29) (2.53) (9.25) (3.87) (5.92) (129)Others (including interest on
borrowings of ICICI)(3) . . . . . . . . (1.22) (52.81) (37.63) (30.66) (28.35) (13.90) (15.26) (332)
Total interest expense . . . . . . . . . . . . Rs.(15.59) Rs.(79.44) Rs.(70.15) Rs.(65.71) Rs. (95.97) Rs.(44.06) Rs. (74.56) US$ 1,623
Net interest income . . . . . . . . . . . . . . Rs. 5.95 Rs. 15.81 Rs. 22.93 Rs. 32.08 Rs. 47.09 Rs. 20.39 Rs. 30.52 US$ 664Non-interest income
Commission, exchange andbrokerage . . . . . . . . . . . . . . . . . . Rs 2.30 Rs. 7.92 Rs. 10.72 Rs. 19.21 Rs. 30.02 Rs.12.52 Rs. 19.45 US$ 423
Profit/(loss) on sale of investments(net) . . . . . . . . . . . . . . . . . . . . . . 3.06 4.92 12.25 5.46 7.50 3.65 3.10 67
Profit/(loss) on foreign exchangetransactions (net) . . . . . . . . . . . . 0.37 0.10 1.93 3.15 4.73 1.83 1.60 35
Profit/(loss) on revaluation ofinvestments (net) . . . . . . . . . . . . (0.15) — — — (0.54) (0.07) 0.40 9
Lease income . . . . . . . . . . . . . . . . . 0.11 5.37 4.21 4.08 3.61 1.74 1.30 28Profit on sale of shares of ICICI
Bank held by ICICI . . . . . . . . . . — 11.91 — — — — — —Miscellaneous income(4) . . . . . . . 0.06 1.37 1.54 2.26 4.51 2.35 2.63 58
Total non-interest income . . . . . . . . Rs. 5.75 Rs. 31.59 Rs. 30.65 Rs. 34.16 Rs. 49.83 Rs. 22.02 Rs. 28.48 US$ 620
Total income . . . . . . . . . . . . . . . . . . . Rs. 11.70 Rs. 47.40 Rs. 53.58 Rs. 66.24 Rs. 96.92 Rs. 42.41 Rs. 59.00 US$ 1,284Non-interest expenseOperating expenses(5)(6) . . . . . . . . . . . (5.97) (15.35) (19.98) (25.17) (35.47) (15.87) (22.37) (487)Direct marketing agency
expense(1)(7) . . . . . . . . . . . . . . . . . . . (0.15) (3.19) (5.99) (8.55) (11.77) (5.11) (7.18) (156)Depreciation on leased assets . . . . . . . (0.12) (3.15) (2.79) (2.97) (2.77) (1.28) (1.02) (22)
Total non-interest expense . . . . . . . . Rs. (6.24) Rs.(21.69) Rs.(28.76) Rs.(36.69) Rs. (50.01) Rs.(22.26) Rs. (30.57) US$ 665
Operating profit beforeprovisions . . . . . . . . . . . . . . . . . . . Rs. 5.45 Rs. 25.71 Rs. 24.81 Rs. 29.56 Rs. 46.91 Rs. 20.15 Rs. 28.43 US$ 619
Provisions and contingencies . . . . . . . (2.55) (17.91) (5.79) (4.29) (15.94) (6.02) (11.92) (259)
Profit before tax . . . . . . . . . . . . . . . . Rs. 2.90 Rs. 7.80 Rs. 19.02 Rs. 25.27 Rs. 30.97 Rs. 14.13 Rs. 16.51 US$ 360Tax . . . . . . . . . . . . . . . . . . . . . . . . . . . (0.32) 4.26 (2.65) (5.22) (5.57) (3.03) (2.76) (60)
Profit after tax . . . . . . . . . . . . . . . . . Rs. 2.58 Rs. 12.06 Rs. 16.37 Rs. 20.05 Rs. 25.40 Rs. 11.10 Rs. 13.75 US$ 300
Dividend per share . . . . . . . . . . . . . . . Rs. 2.00 Rs. 7.50 Rs. 7.50 Rs. 8.50 Rs. 8.50 — — —Dividend tax per share . . . . . . . . . . . . 0.20 0.96 0.96 1.19 2.08 — — —Earnings per share(basic)(8) . . . . . . . . 11.61 19.68 26.66 27.55 32.49 Rs. 15.02 Rs. 15.42 US$ 0.34Earnings per share (diluted)(8) . . . . . . 11.61 19.65 26.44 27.33 32.15 14.87 15.30 0.33
32

(1) Interest on advances represents interest on rupee and foreign currency loans and advances (including bills) and hire purchase activity andgains on sell-down of loans. Effective April 1, 2006, the commissions paid to direct marketing agency expenses or associates inconnection with sourcing our automobile loans accounted for on an upfront basis have been included under non-interest expense. Thedirect marketing agency expenses include Rs. 0.01 billion for fiscal 2002, Rs. 1.57 billion for fiscal 2003, Rs. 3.06 billion for fiscal 2004,Rs. 3.69 billion for fiscal 2005, Rs. 5.22 billion for fiscal 2006 and Rs. 2.34 billion for the six months ended September 30, 2005 onaccount of commissions paid to direct marketing agency expenses or associates in connection with sourcing our automobile loans.Figures for the previous periods/years have been regrouped and accordingly are different to that extent from our audited unconsolidatedfinancial statements included elsewhere in the offering memorandum.
(2) Interest income from investments represents interest income on government securities investments, debentures, bonds and dividendincome from equity and other investments in companies other than our subsidiaries.
(3) Other interest expense includes interest expense on fixed deposits taken over from ICICI, bonds and debentures, subordinated debt, billsrediscounted and borrowings outside India.
(4) Miscellaneous income primarily includes dividend income from subsidiaries and affiliates, unrealized gain/loss on certain derivatives andprofit/loss on sale of properties.
(5) With effect from fiscal 2002, consequent to the amalgamation, the useful lives of certain categories of fixed assets were reviewed to alignthe depreciation rates previously used by ICICI and us. Accordingly, the rates of depreciation on certain categories of fixed assets werechanged from fiscal 2002.
(6) Operating expense for the six months ended September 30, 2005 and September 30, 2006 also includes Rs. 192 million on account ofamortization of expenses related to our early retirement option scheme over a period of five years as approved by the Reserve Bank ofIndia.
(7) Includes commissions paid to direct marketing agents or associates (including reclassification of direct market agency expenses forsourcing automobile loans from interest income) in connection with sourcing our retail assets.
(8) Earnings per share is computed based on weighted average number of shares. Earnings per share is not annualized for the six monthsended September 30, 2005 and 2006.
(9) Figures of the previous year/period have been regrouped to conform to the current year presentation.
For other notes to accounts please refer to the audited unconsolidated financial statements includedelsewhere in this offering memorandum.
33

Balance Sheet Data
At March 31, At September 30,
2002 2003 2004 2005 2006 2005 2006 2006
(Rupees in billions, except per share data)
(US$in millions,except pershare data)
Assets:Cash in hand and balance with Reserve
Bank of India . . . . . . . . . . . . . . . . . . . . . . Rs. 17.74 Rs. 48.86 Rs. 54.08 Rs. 63.45 Rs. 89.34 Rs. 79.32 Rs. 145.10 US$ 3,158Balance with banks and money at call and
short notice . . . . . . . . . . . . . . . . . . . . . . . . 110.12 16.03 30.63 65.85 81.06 50.56 93.16 2,027Investments (net of provisions)
Government and other approvedsecurities . . . . . . . . . . . . . . . . . . . . . . . 227.93 255.83 299.18 344.82 510.74 415.67 607.14 13,213
Debentures and bonds . . . . . . . . . . . . . . . 64.36 56.90 55.49 28.54 18.04 15.81 24.00 522Others(1) . . . . . . . . . . . . . . . . . . . . . . . . . . 66.62 41.89 79.69 131.51 186.69 121.69 198.78 4,326
Total investments . . . . . . . . . . . . . . . . . . . . 358.91 354.62 434.36 504.87 715.47 553.17 829.92 18,061Advances(2) . . . . . . . . . . . . . . . . . . . . . . . . . 470.35 532.79 626.48 914.05 1,461.63 1,070.71 1,554.04 33,820Fixed and leased assets . . . . . . . . . . . . . . . . 42.39 40.61 40.56 40.38 39.81 39.60 39.23 854Others assets(1)(3) . . . . . . . . . . . . . . . . . . . . . 41.55 75.21 66.18 87.99 126.58 98.82 162.28 3,532
Total assets . . . . . . . . . . . . . . . . . . . . . . . . . Rs.1,041.06 Rs.1,068.12 Rs.1,252.29 Rs.1,676.59 Rs.2,513.89 Rs.1,892.18 Rs.2,823.73 US$ 61,452
Liabilities and capital DepositsOther demand deposits . . . . . . . . . . . . . . Rs. 27.36 Rs. 36.89 Rs. 72.59 Rs. 128.37 Rs. 165.73 Rs. 125.84 Rs. 148.20 US$ 3,225Saving deposits . . . . . . . . . . . . . . . . . . . . 24.97 37.93 83.72 113.92 209.37 145.33 271.77 5,914Term deposits . . . . . . . . . . . . . . . . . . . . . . 268.52 406.87 524.78 755.90 1,275.73 933.35 1,475.03 32,101
Total deposits . . . . . . . . . . . . . . . . . . . . . . . 320.85 481.69 681.09 998.19 1,650.83 1,204.52 1,895.00 41,240Borrowings(4) . . . . . . . . . . . . . . . . . . . . . . . . 492.19 343.02 307.40 335.44 385.22 341.19 360.06 7,836Unsecured redeemable debenture/bonds
(subordinated debt)(5) . . . . . . . . . . . . . . . . 97.51 97.50 91.06 82.09 101.44 80.52 155.95 3,394Other liabilities and provisions(6) . . . . . . . . . 64.55 73.07 89.14 131.87 150.84 125.28 173.72 3,781Preference share capital suspense(7) . . . . . . . 3.50 — — — — — — —Preference share capital(7) . . . . . . . . . . . . . . — 3.50 3.50 3.50 3.50 3.50 3.50 76Equity capital(8) . . . . . . . . . . . . . . . . . . . . . . 6.13 6.13 6.16 7.37 8.90 7.41 8.93 194Reserves and surplus
Statutory reserves . . . . . . . . . . . . . . . . . . . 2.50 5.52 9.61 14.63 20.99 14.63 20.99 457Debenture redemption reserve . . . . . . . . . 0.10 — — — — — — —Special reserve . . . . . . . . . . . . . . . . . . . . . 10.94 11.44 11.69 11.94 14.69 11.94 14.69 320Capital reserves . . . . . . . . . . . . . . . . . . . . — 2.00 4.65 4.85 5.53 4.85 5.53 120Share premium . . . . . . . . . . . . . . . . . . . . . 8.01 8.02 8.52 39.89 118.18 40.49 118.76 2,585Investment fluctuation reserve . . . . . . . . . 0.27 1.27 7.30 5.16 — 7.30 — —Foreign currency translation reserve . . . . — — — — — (0.04) 0.16 3Revenue & other reserves . . . . . . . . . . . . 34.31 34.91 31.64 39.78 50.84 37.64 49.78 1,083Balance in profit & loss account . . . . . . . 0.20 0.05 0.53 1.88 2.93 12.95 16.66 363
Total reserves and surplus . . . . . . . . . . . . 56.33 63.21 73.94 118.13 213.16 129.76 226.57 4,931
Total liabilities and capital . . . . . . . . . . . . Rs.1,041.06 Rs.1,068.12 Rs.1,252.29 Rs.1,676.59 Rs.2,513.89 Rs.1,892.18 Rs.2,823.73 US$ 61,452
Contingent liabilitiesClaims against bank not acknowledged
as debts . . . . . . . . . . . . . . . . . . . . . . . . Rs. 10.23 Rs. 20.25 Rs. 25.02 Rs. 27.46 Rs. 29.78 Rs. 26.46 Rs. 36.89 US$ 803Liability for partly paid investments . . . . 2.62 1.80 1.24 0.17 0.17 0.17 0.17 4Liability on account of outstanding
forward exchange contracts . . . . . . . . . 152.55 251.03 557.04 714.85 918.32 797.88 1,081.25 23,531Guarantees given on behalf of
constituents . . . . . . . . . . . . . . . . . . . . . 93.52 106.35 120.29 156.41 191.03 169.08 213.44 4,645Acceptances, endorsements & other
obligations . . . . . . . . . . . . . . . . . . . . . . 17.39 43.25 65.14 74.12 106.87 73.52 138.36 3,011Currency swaps . . . . . . . . . . . . . . . . . . . . 20.41 29.01 44.49 112.96 172.42 139.27 230.78 5,022Interest rate swaps & currency options
(9) . . . . . . . . . . . . . . . . . . . . . . . . . . . . . 78.54 413.54 1,177.64 1,519.22 2,471.92 1,854.05 2,859.58 62,232Other items for which ICICI Bank is
contingently liable . . . . . . . . . . . . . . . . 19.21 29.14 38.56 76.35 59.84 49.42 93.11 2,026
Total . . . . . . . . . . . . . . . . . . . . . . . . . . . . . . Rs. 394.47 Rs. 894.37 Rs.2,029.42 Rs.2,681.54 Rs.3,950.34 Rs.3,109.85 Rs.4,653.58 US$101,274
Bills for collection . . . . . . . . . . . . . . . . . . . 13.23 13.37 15.11 23.92 43.38 32.43 35.58 774
34

(1) Includes investment in government securities issued outside India.(2) Includes rupee/foreign currency loans, assistance by way of securitization, loans under retail finance operations and receivables under
finance leases.(3) Primarily includes interest accrued but not due at period-end, advances paid for capital assets, advance taxes paid, deposits for utilities,
fees and other income receivable, exchange fluctuation suspense with Government of India, inter-office adjustments (net), non-bankingassets acquired in satisfaction of claims and deferred tax assets.
(4) Borrowings include call borrowings and refinance from the Reserve Bank India, banks and other financial institutions, fixed depositstaken over from ICICI, bonds and debentures, commercial paper, borrowings outside India from multilateral and bilateral credit agencies,international banks, institutions and consortiums.
(5) Represents unsecured borrowings eligible for inclusion in upper tier II and lower tier I capital for capital adequacy purposes.(6) Other liabilities primarily include bills payable, interest payable, creditors for expenses, unclaimed refunds, brokerage and interest,
deferred tax liabilities, proposed dividend, dividend tax thereon, inter-office adjustments (net), prudential provision on standard assets asper the Reserve Bank of India guidelines and security deposits from clients.
(7) At year-end fiscal 2002, preference share capital suspense represents the face value of 350 preference shares to be issued to preferenceshareholders of ICICI on amalgamation redeemable at par on April 20, 2018. The notification from the Ministry of Finance has currentlyexempted us from the restriction of section 12(1) of the Banking Regulation Act, 1949, which prohibits issue of preference shares bybanks. These shares were subsequently issued on June 11, 2002.
(8) At March 31, 2002, equity capital includes Rs. 3.93 billion to be allotted to the equity shareholders of ICICI pursuant to theamalgamation, effective March 30, 2002. These shares were subsequently issued on June 11, 2002.
(9) Represents notional principal amount.
Average Balance Sheet
For fiscal years 2004, 2005 and 2006 the average balances are the averages of quarterly balancesoutstanding at the end of March of the previous fiscal year and June, September, December and March of thatfiscal year and for the six months ended September 30, 2005 the average balances are the averages of quarterlybalances outstanding at the end of March of the previous fiscal year and June and September of the six monthsperiod. For the six months ended September 30, 2006 the average balances are the averages of daily balances.The following table sets forth, for the periods indicated, the average balances of the assets and liabilitiesoutstanding, along with the related interest income (including dividend income) and interest expense. Theaverage balances of assets include non-performing assets and are net of loan loss provisions.
Year ended March 31,
2004 2005 2006
Averagebalance
Interestincome/expense
Averageyield/cost
Averagebalance
Interestincome/expense
Averageyield/cost
Averagebalance
Interestincome/expense
Averageyield/cost
(in billions, except percentages)Advances . . . . . . . . . . . . . . . . . . . Rs. 567.51 Rs.63.80 11.2% Rs. 720.26 Rs.71.22 9.9% Rs.1,120.38 Rs.102.07 9.1%Investments . . . . . . . . . . . . . . . . . 335.71 25.40 7.6 347.66 22.29 6.4 472.66 36.93 7.8Others . . . . . . . . . . . . . . . . . . . . . 81.71 3.88 4.7 95.22 4.28 4.5 127.53 4.06 3.2
Total interest-earning assets . . 984.93 93.08 9.5% 1,163.14 97.79 8.4% 1,720.57 143.06 8.3%Fixed assets . . . . . . . . . . . . . . . . . 23.98 — — 24.26 — — 26.99 — —Other assets . . . . . . . . . . . . . . . . . 129.45 — — 159.09 — — 225.46 — —
Total assets . . . . . . . . . . . . . . . . . Rs.1,138.36 Rs.93.08 Rs.1,346.49 Rs.97.79 Rs.1,973.02 Rs.143.06
Deposits . . . . . . . . . . . . . . . . . . . Rs. 559.96 Rs.30.23 5.4% Rs. 728.90 Rs.32.52 4.5% Rs.1,166.07 Rs. 58.37 5.0%Saving deposits . . . . . . . . . . . . . . 52.21 1.35 2.6 92.64 2.18 2.4 148.79 3.95 2.7Other demand deposits . . . . . . . . 52.11 — — 78.51 — — 120.86 — —Term deposits . . . . . . . . . . . . . . . 455.64 28.88 6.3 557.75 30.34 5.4 896.42 54.42 6.1Borrowings . . . . . . . . . . . . . . . . . 429.70 39.92 9.3 409.35 33.19 8.1 492.66 37.60 7.6
Total interest-bearingliabilities . . . . . . . . . . . . . . . . . 989.66 70.15 7.1% 1,138.25 65.71 5.8% 1,658.73 95.97 5.8%
Capital and reserves(1) . . . . . . . . . 82.35 — — 119.82 — — 179.71 — —Other liabilities . . . . . . . . . . . . . . 66.35 — — 88.42 — — 134.58 — —
Total liabilities . . . . . . . . . . . . . . Rs. 1138.36 Rs.70.15 Rs 1,346.49 Rs.65.71 Rs.1,973.02 Rs. 95.97
35

Six months ended September 30,
2005 2006
Averagebalance
Interest income/expense
Avg.yield/cost(2)
Averagebalance
Interest income/expense
Avg.yield/cost(2)
(in billions, except percentages)Advances . . . . . . . . . . . . . . . . . . . . . . . . . . Rs. 983.38 Rs.45.54 9.2% Rs.1,502.37 Rs. 72.27 9.6%Investments . . . . . . . . . . . . . . . . . . . . . . . . 449.72 16.86 7.5 702.81 28.27 8.0Others . . . . . . . . . . . . . . . . . . . . . . . . . . . . 107.29 2.05 3.8 236.24 4.54 3.8
Total interest-earning assets . . . . . . . . . 1,540.39 64.45 8.4% 2,441.42 105.08 8.6%Fixed assets . . . . . . . . . . . . . . . . . . . . . . . . 26.36 — — 39.18 — —Other assets . . . . . . . . . . . . . . . . . . . . . . . . 202.26 — — 212.75 — —
Total assets . . . . . . . . . . . . . . . . . . . . . . . . Rs.1,769.01 Rs.64.45 — Rs.2,693.35 Rs.105.08 —
Deposits . . . . . . . . . . . . . . . . . . . . . . . . . . . Rs.1,054.29 Rs.26.29 5.0% Rs.1,790.74 Rs. 53.38 6.0%Saving deposits . . . . . . . . . . . . . . . . . . . . . 118.78 1.58 2.7 234.08 3.09 2.6Other demand deposits . . . . . . . . . . . . . . . 103.61 — — 170.07 — —Term deposits . . . . . . . . . . . . . . . . . . . . . . 831.90 24.71 5.9 1,386.58 50.29 7.2Borrowings . . . . . . . . . . . . . . . . . . . . . . . . 456.97 17.77 7.8 554.99 21.18 7.6
Total interest-bearing liabilities . . . . . . . 1,511.26 44.06 5.8% 2,345.73 74.56 6.3%Capital and reserves(1) . . . . . . . . . . . . . . . . 129.22 — — 226.66 — —Other liabilities . . . . . . . . . . . . . . . . . . . . . 128.53 — — 120.96 — —
Total liabilities . . . . . . . . . . . . . . . . . . . . . Rs.1,769.01 Rs.44.06 Rs.2,693.35 Rs. 74.56
(1) Excludes preference share capital.(2) Average yield and average cost for the six months ended September 30, 2005 and 2006 are annualized.
Yields, Spreads and Margins
The following table sets forth, for the periods indicated, the yields, spreads and net interest margins oninterest-earning assets.
Year ended March 31, Six months ended September 30,
2002 2003 2004 2005 2006 2005 2006 2006
(in billions, except percentages)
(US$ inmillions,except
percentages)Average interest-earning assets . . . . Rs.222.39 Rs. 912.99 Rs. 984.93 Rs.1,163.14 Rs.1,720.57 Rs.1,540.39 Rs.2,441.42 US$53,132Average interest-bearing
liabilities . . . . . . . . . . . . . . . . . . . 207.37 891.62 989.66 1,138.25 1,658.73 1,511.26 2,345.73 51,050Average total assets . . . . . . . . . . . . . 233.93 1,050.28 1,138.36 1,346.49 1,973.02 1,769.01 2,693.35 58,615Average interest-earning assets as a
percentage of average totalassets (%) . . . . . . . . . . . . . . . . . . . 95.1 86.9 86.5 86.4 86.5 87.1 90.6
Average interest-bearing liabilitiesas a percentage of average totalassets (%) . . . . . . . . . . . . . . . . . . . 88.7 84.9 86.9 84.5 84.1 85.4 87.1
Average interest-earning assets as apercentage of average interest-bearing liabilities (%) . . . . . . . . . 107.2 102.4 99.5 102.2 103.7 101.9 104.1
Yield(1) (%) . . . . . . . . . . . . . . . . . . . 9.7 10.4 9.5 8.4 8.3 8.4 8.6Cost of funds(1) (%) . . . . . . . . . . . . . 7.5 8.9 7.1 5.8 5.8 5.8 6.3Spread (1)(2) (%) . . . . . . . . . . . . . . . . 2.16 1.52 2.36 2.63 2.47 2.53 2.24Net interest margin(1)(3) (%) . . . . . . . 2.70 1.73 2.33 2.76 2.74 2.64 2.49
(1) Yield, cost of funds, spread and net interest margin are annualized for the six months ended September 30, 2005 and 2006.(2) Spread is the difference between yield on average interest-earning assets and cost of average interest-bearing liabilities. Yield on average
interest-earning assets is the ratio of interest income to average interest-earning assets. Cost of average interest-bearing liabilities is theratio of interest expense to average interest-bearing liabilities.
(3) Net interest margin is the ratio of net interest income to average interest-earning assets. The difference in net interest margin and spreadarises due to the difference in amount of average interest-earning assets and average interest-bearing liabilities. If average interest-earning assets exceed average interest-bearing liabilities, net interest margin is greater than spread and if average interest-bearingliabilities exceed average interest-earning assets, net interest margin is less than spread.
36

Financial Ratios
Fiscal Year,Six months ended
September 30,
2002 2003 2004 2005 2006 2005 2006
(in percentages)
Return on average equity(1)(2) . . . . . . . . . 17.8% 18.3% 21.8% 17.9% 16.4% 17.0% 12.0%Return on average assets(1)(3) . . . . . . . . . 1.10 1.15 1.44 1.49 1.29 1.26 1.02Dividend payout ratio(4) . . . . . . . . . . . . . 17.2 38.1 33.2 31.6 29.8 — —Cost to average assets(1)(5) . . . . . . . . . . . 2.6 1.5 1.8 1.9 1.8 1.8 1.7Tier I capital adequacy ratio . . . . . . . . . 7.5 7.1 6.1 7.6 9.2 7.2 9.38Tier II capital adequacy ratio . . . . . . . . . 3.9 4.0 4.3 4.2 4.2 4.3 4.96Total capital adequacy ratio . . . . . . . . . . 11.4 11.1 10.4 11.8 13.4 11.5 14.34Net non-performing assets ratio(6) . . . . . 4.73 4.92 2.87 2.03 0.71 0.97 0.94Allowance as a percentage of gross
non-performing assets(7) . . . . . . . . . . . 63.6 62.6 69.7 61.4 63.7 73.3 58.3Average net worth to total average
assets . . . . . . . . . . . . . . . . . . . . . . . . . 6.22 6.27 6.59 8.34 7.83 7.36 8.46
(1) Annualized for the six months ended September 30, 2005 and 2006.(2) Return on average equity is the ratio of the net profit after tax to the average net worth.(3) Return on average assets is the ratio of the net profit after tax to the average assets.(4) Dividend payout ratio is the ratio of total dividend payouts (excluding dividend distribution tax) to profit
after tax.(5) Cost to average assets is the ratio of the non-interest expense, excluding direct marketing agency expenses
and lease depreciation, to the average assets.(6) Net non-performing assets ratio is the ratio of net non-performing assets to the net customer assets.(7) Allowance as a percentage of gross non-performing assets is the ratio of provisions and write-offs made to
the gross non-performing assets (gross of provisions and write-offs).
37
MANAGEMENT’S DISCUSSION AND ANALYSIS OF FINANCIAL CONDITIONAND RESULTS OF OPERATIONS
You should read the following discussion and analysis of our financial condition and results of operationstogether with our audited unconsolidated financial statements. The following discussion is based on our auditedunconsolidated financial statements and accompanying notes, which have been prepared in accordance withIndian GAAP.
Introduction
The financial information contained in this offering memorandum is unconsolidated and prepared inaccordance with Indian GAAP, while the financial information in our annual reports on Form 20-F for the fiscalyear 2006 is based on our audited consolidated financial statements and accompanying notes prepared inaccordance with Indian GAAP with the net income and stockholders’ equity reconciled to US GAAP. Financialinformation in our annual report on Form 20-F for the fiscal years 2000 to 2005 filed with the SEC was preparedin accordance with US GAAP. US GAAP requires consolidation as a fundamental basis of accounting. UnderIndian GAAP, the amalgamation of ICICI, ICICI Personal Financial Services and ICICI Capital Services withand into ICICI Bank was accounted for on March 30, 2002, with ICICI Bank recognized as the accountingacquirer. Under US GAAP, we were required to reflect the amalgamation in the financial statements for fiscal2003 and fiscal 2004 as it was consummated in April 2002. Under US GAAP, the amalgamation was accountedfor as a reverse acquisition. This means that, under US GAAP, ICICI was recognized as the accounting acquirerin the amalgamation, although ICICI Bank was the legal acquirer. For further discussion of the significantdifferences between Indian GAAP and US GAAP, see “Summary of Significant Differences Between IndianGAAP and US GAAP”.
Our loan portfolio, financial condition and results of operations have been, and in the future, are expected tobe influenced by economic conditions in India, expected growth in retail credit in India and certain globaldevelopments, particularly in commodity prices relating to the business activities of our corporate customers. Forease of understanding of the discussion of our results of operations that follows, you should consider theintroductory discussion of these macroeconomic factors.
Indian Economy
The rate of growth of India’s gross domestic product, or GDP, was 8.5% in fiscal 2004, 7.5% in fiscal 2005and 8.4% in fiscal 2006. During the first half of fiscal 2007 GDP growth was 9.1%. The agriculture sector,posted a growth of 9.6% in fiscal 2004. In fiscal 2005, the growth of the agriculture sector declined to 0.7%,because of insufficient rainfall in many parts of the country. However agricultural growth recovered in fiscal2006 due to normal monsoons to post a growth of 3.9%. In the first half of fiscal 2007 agricultural growth was2.6%. The industrial sector grew by 6.5% in fiscal 2004, 8.3% in fiscal 2005 and 7.6% in fiscal 2006 and by10.5% during the first half of fiscal 2007. The services sector grew by 8.9% in fiscal 2004, 8.6% in fiscal 2005and 10.3% in fiscal 2006. The services sector grew by 10.7% during the first half of fiscal 2007.
During the first half of fiscal 2005, there was an increase in inflationary trends in India, primarily due to theincrease in oil prices as well as prices of certain commodities. The full burden of the oil price increase has not yetbeen passed to the Indian consumers and has been substantially absorbed by the government and government-owned oil marketing companies. See also “Risk Factors—Risks Relating to India—A significant increase in theprice of crude oil could adversely affect the Indian economy, which could adversely affect our business”. Thegrowth trends were accompanied by continued macro-economic stability, despite a sharp increase in global oilprices, concerns over global imbalances and rising interest rates globally and in India. The average annual rate ofinflation as measured by the Wholesale Price Index was 4.5% for fiscal 2006 as compared to 6.4% for fiscal 2005and remained at comfortable levels largely due to policy interventions by the Reserve Bank of India. The rate ofinflation was 5.3% in fiscal 2007 (through November 25, 2006), as compared to 4.5% during the correspondingperiod in the previous year. Inflation based on the consumer price index was 7.3% (through October 2006)compared to 4.2% during the corresponding period last year mainly due to the increase in the price of food articles
38

that have a higher weight in the consumer price index. The Indian rupee depreciated by 2.0% against the US dollarin fiscal 2006 from Rs. 43.62 per US$ 1.00 at year-end fiscal 2005 to Rs 44.48 per US$ 1.00 at year end fiscal 2006.It depreciated by 0.5% against the US dollar in fiscal 2007 (through December 11, 2006) moving from Rs 44.48 perUS$ 1.00 to Rs 44.69 per US$ 1.00. It also depreciated against the pound sterling and the euro and appreciatedagainst the Japanese yen. India’s foreign exchange reserves were US$ 175.49 billion at December 1, 2006.
The impact of these and other factors and the anticipated overall growth in industry, agriculture and servicesin fiscal 2007 and in future years will influence the performance of the banking sector as it will affect the level ofcredit disbursed by banks, and the overall growth prospects of our business, including our ability to grow, thequality of our assets, the value of our investment portfolio and our ability to implement our strategy.
Banking Sector
According to the Reserve Bank of India’s data, total deposits of all scheduled commercial banks increasedby 17.7% in fiscal 2004, 14.4% in fiscal 2005 and 17.6% in fiscal 2006. In the first half of fiscal 2007 depositsgrew by 20.2% on an annualized basis and 19.9% on an year-on year basis. Bank credit of scheduled commercialbanks grew by 15.3% in fiscal 2004, 30.9% in fiscal 2005 and 36.0% in fiscal 2006. In the first half of fiscal2007 bank credit rose by 19.6% on an annualized basis and by 29.7% on a year-on-year basis. The increase incredit growth in fiscal 2005 was driven by the continued growth in retail credit as well as credit to the industrialand agricultural sectors. Further the Industrial Development Bank of India Limited’s credit was included in totalbanking sector credit at year-end fiscal 2005 after its conversion into a scheduled commercial bank with effectfrom October 11, 2004. Excluding Industrial Development Bank of India Limited’s credit, bank credit ofscheduled commercial banks grew at 26.0% in fiscal 2005. In fiscal 2006 growth in credit was driven by thecontinued demand from the industrial and agriculture sectors and robust credit flow to retail segment.
Until fiscal 2005, India experienced a downward movement in interest rates, barring intra-year periods wheninterest rates were higher temporarily due to extraneous circumstances. This movement was principally due tothe Reserve Bank of India’s policy of assuring adequate liquidity in the banking system and generally loweringthe rate at which it would lend to Indian banks to ensure that borrowers had access to funding at competitiverates. Banks generally followed the direction of interest rates set by the Reserve Bank of India and adjusted boththeir deposit rates and lending rates downwards until fiscal 2005. The inflationary trends in fiscal 2005 resultedin an increase in benchmark secondary market yields on government securities. Between October 2004 and July2006, the Reserve Bank of India increased the reverse repo rate (i.e., the annualized interest earned by the lenderin a repurchase transaction between a bank and the Reserve Bank of India) six times by 25 basis points each timeresulting in the reverse repo rate increasing from 4.5% to 6.0%. The Reserve Bank of India also increased thecash reserve ratio to 5.0% effective October 2, 2004. As a result of these increases, banks have also raised theirdeposit and lending rates. In October 2006 the Reserve Bank of India increased the repo rate by 25 basis points to7.25% on concerns of rising inflation. To address rising inflationary expectations and prevent a liquidityoverhang the Reserve Bank of India has increased the cash reserve ratio by 50 basis points to 5.5% from 5.0% inDecember 2006. The increase will be implemented in two stages, effective from the fortnight beginningDecember 23, 2006 and the fortnight beginning January 6, 2007. The following table sets forth the bank rate,reverse repo rate and average prime lending rates of five major public sector banks for the last six fiscal years.
Fiscal year Bank rate Reverse repo rate
Average primelending rate
(range)
2001 . . . . . . . . . . . . . . . . . . . . . . . . . . . . . . . . . . . . . . . . . . . . . . . . . . . . 7.0% 7.0% 11.0-12.0%2002 . . . . . . . . . . . . . . . . . . . . . . . . . . . . . . . . . . . . . . . . . . . . . . . . . . . . 6.50 6.0 11.00-12.002003 . . . . . . . . . . . . . . . . . . . . . . . . . . . . . . . . . . . . . . . . . . . . . . . . . . . . 6.25 5.0 10.75-12.002004 . . . . . . . . . . . . . . . . . . . . . . . . . . . . . . . . . . . . . . . . . . . . . . . . . . . . 6.0 4.5 10.50-11.502005 . . . . . . . . . . . . . . . . . . . . . . . . . . . . . . . . . . . . . . . . . . . . . . . . . . . . 6.0 4.75 10.25-11.002006 . . . . . . . . . . . . . . . . . . . . . . . . . . . . . . . . . . . . . . . . . . . . . . . . . . . . 6.0 5.50 10.25-10.752007 (through December 11, 2006) . . . . . . . . . . . . . . . . . . . . . . . . . . . 6.0 6.00 10.25-10.75
Source: Reserve Bank of India: Handbook of Statistics on Indian Economy, 2005, and Weekly StatisticalSupplements and Annual Policy Statement 2006-07, Mid-term review of Annual Policy statement 2006-07.
39

Major Events Affecting Results and Financial Condition
Since 2002 we have experienced major changes and developments in our business and strategy. Anunderstanding of these events and developments is necessary for an understanding of the periods under reviewand the discussion and analysis which follows. These changes are reflected in our financial statements inconnection with or since the amalgamation. The first change reflects the impact of our history upon our averagecost of funds. Consequent to the amalgamation, the businesses formerly conducted by ICICI became subject forthe first time to various regulations applicable to banks. These include the statutory liquidity ratio, which isrequired to be maintained in the form of government of India securities and other approved securities, currently aminimum of 25.0% of our net demand and time liabilities, and the cash reserve ratio, currently a minimum of5.0% of our net demand and time liabilities excluding inter-bank deposits. While we have benefited from thelower cost of funding as a bank as compared to ICICI as a non-bank financial institution, the imposition of thestatutory liquidity ratio and the cash reserve ratio on the liabilities taken over from ICICI have impacted ourspread. As the average yield on investments in government of India securities and cash balances maintained withthe Reserve Bank of India is typically lower than the yield on other interest-earning assets, our net interestmargin has been adversely impacted. Further interest payments on balances held under the cash reserve ratiohave been discontinued with the passage of the Reserve Bank of India (amendment) bill on June 22, 2006. Thiswill adversely impact our net interest margin. Additionally our net interest margin has been and is expected tocontinue to be lower than other banks in India until we repay the borrowings of ICICI and increase the proportionof retail deposits in our funding. We are expanding our deposit base and changing the mix of our liabilities awayfrom the legacy ICICI liabilities towards the lower average cost retail liabilities. The increase in investment ingovernment securities has substantially increased our exposure to market risk. In a declining interest rateenvironment, we made gains on sale of government securities. A rise in interest rates would cause the value ofour fixed income portfolio to decline and adversely affect the income from our treasury operations. See also“Risk Factors—Risks Relating to Our Business—Our business is particularly vulnerable to interest rate risk andvolatility in interest rates could adversely affect our net interest margin, the value of our fixed income portfolio,our income from treasury operations and our financial performance.”
The second key change reflects the implementation of our strategy to grow our retail loan portfolio. Theresults of our implementation of this strategy can be seen in the rapid growth in the retail loan portfolio. Whilewe cannot guarantee that growth will continue at the same rate, we see continued significant demand for retailloans.
Third, in connection with the amalgamation, we recorded the loans and investments acquired from ICICI atfair values which represented a substantial write down of the value of those assets as compared to their value onthe balance sheet of ICICI. The fair values of the assets were determined based on our judgment which we madewith the assistance of independent valuers. The key areas of fair valuation included loans and all creditsubstitutes which were fair valued by valuation specialists and investments (including investments in venturecapital funds) which were marked to market in accordance with the Reserve Bank of India guidelines applicableto banks. The assets of ICICI were first reflected on our balance sheet at March 31, 2002 after taking into accountthese fair value write downs.
Fourth, since the amalgamation we have established operations outside India, with subsidiaries in the UnitedKingdom, Canada and Russia, branches in Singapore, Hong Kong, Dubai International Financial Center, SriLanka and Bahrain and representative offices in the United States, Dubai, Bangladesh, South Africa, Malaysia,Indonesia, Thailand and China. We have invested in the equity capital of our international banking subsidiaries tosupport their growth.
Fifth, since the amalgamation, our subsidiaries engaged in the insurance business, ICICI Prudential LifeInsurance Company Limited and ICICI Lombard General Insurance Company Limited, have experienced rapidgrowth in business. We have invested in the equity capital of our insurance subsidiaries to support their growth.Our life insurance subsidiary continues to report losses in its financial statements. See also “Business—Overviewof ICICI Bank’s Products and Services—Insurance.”
40

All of these changes or developments have had a major impact upon our results of operation and financialcondition and are critical to an understanding of the discussion, which follows.
Summary for the six-months ended September 30, 2006 compared to the six-months ended September 30,2005
Profit after tax increased by 23.9% to Rs. 13.75 billion (US$ 300 million) in the six months endedSeptember 30, 2006 from Rs. 11.10 billion (US$ 242 million) in the six months ended September 30, 2005. Profitbefore provisions and tax increased by 41.1% to Rs. 28.43 billion (US$ 619 million) in the six months endedSeptember 30, 2006 from Rs. 20.15 billion (US$ 439 million) in the six months ended September 30, 2005primarily due to a 49.7% increase in net interest income to Rs. 30.52 billion (US$ 664 million) in the six monthsended September 30, 2006 from Rs. 20.39 billion (US$ 444 million) in the six months ended September 30,2005, increase in non-interest income by 29.3% to Rs. 28.48 billion (US$ 620 million) in the six months endedSeptember 30, 2006 from Rs. 22.02 billion (US$ 479 million) in the six months ended September 30, 2005 offset,in part, by increase in non-interest expense by 37.3% to Rs. 30.57 billion (US$ 665 million) in the six monthsended September 30, 2006 from Rs. 22.26 billion (US$ 484 million) in the six months ended September 30,2005. Provisions and contingencies (excluding provision for tax) increased to Rs. 11.92 billion (US$ 259 million)in the six months ended September 30, 2006 from Rs. 6.02 billion (US$ 131 million) in the six months endedSeptember 30, 2005.
• Net interest income increased by 49.7% to Rs. 30.52 billion (US$ 664 million) in the six months endedSeptember 30, 2006 from Rs. 20.39 billion (US$ 444 million) in the six months ended September 30,2005, primarily reflecting an increase of 58.5% in the average volume of interest-earning assets.
• Non-interest income increased by 29.3% to Rs. 28.48 billion (US$ 620 million) in the six monthsended September 30, 2006 from Rs. 22.02 billion (US$ 479 million) primarily due to a 55.4% increasein commission, exchange and brokerage, offset, in part, by a decrease in treasury income.
• Non-interest expense increased by 37.3% to Rs. 30.57 billion (US$ 665 million) in the six monthsended September 30, 2006 from Rs. 22.26 billion (US$ 484 million) in the six months endedSeptember 30, 2005 primarily due to a 59.4% increase in employee expenses and a 38.1% increase inother administrative expenses.
• Provisions and contingencies (excluding provisions for tax) increased to Rs. 11.92 billion (US$ 259million) in the six months ended September 30, 2006 from Rs. 6.02 billion (US$ 131 million) in the sixmonths ended September 30, 2005 primarily due to an increase in net provision for non-performingassets, general provision for standard assets and provision for investments in the six months endedSeptember 30, 2006.
• Total assets increased 49.2% to Rs. 2,823.73 billion (US$ 61.5 billion) at September 30, 2006 fromRs. 1,892.18 billion (US$ 41.2 billion) at September 30, 2005 primarily due to an increase in loans by45.1% and an increase in investments by 50.0%.
Net Interest Income
Net interest income increased by 49.7% to Rs. 30.52 billion (US$ 664 million) in the six months endedSeptember 30, 2006, from Rs. 20.39 billion (US$ 444 million) in the six months ended September 30, 2005reflecting mainly the following:
• an increase of Rs. 901.03 billion (US$ 19.6 billion) or 58.5% in the average volume of interest-earningassets; and
• net interest margin of 2.5% for the six months ended September 30, 2006 compared to 2.6% for the sixmonths ended September 30, 2005.
In February 2006, the Reserve Bank of India issued guidelines for accounting for securitization of standardassets. In accordance with these guidelines with effect from February 1, 2006 we account for any loss arising on
41

securitization immediately at the time of sale and the profit/premium arising on account of securitization isamortized over the life of the asset. Prior to February 1, 2006, profit arising on account of securitization has beenrecorded upfront at the time of sale. Income from sell-down of loans, which was approximately 15.9% of netinterest income in the six months ended September 30, 2005, was negligible in the six months endedSeptember 30, 2006 due to the impact of the aforesaid guidelines requiring amortization of profit onsecuritization from February 1, 2006 and the prevailing liquidity and interest rate scenario.
We use marketing agents, called direct marketing agents or associates, for sourcing our automobile loans.Until the year ended March 31, 2006, we deducted commission paid to direct marketing agents of automobileloans from the interest income. For the six months ended September 30, 2006, we have reported all directmarketing agency expenses, on automobile loans and other retail loans separately under “non-interest expense”.These commissions are expensed upfront and not amortised over the life of the loan. The necessaryreclassifications have been made in the financial statements for the period ended September 30, 2005.
The average volume of interest-earning assets increased by Rs. 901.03 billion (US$ 19.6 billion) in the sixmonths ended September 30, 2006 primarily due to the increase in average advances by Rs. 518.99 billion(US$ 11.3 billion) and increase in average investments by Rs. 253.09 billion (US$ 5.5 billion). The increase inaverage advances was mainly due to increased disbursement of retail loans and increase in average investmentswas mainly due to increased investment in government securities. Retail advances, net of provisions and write-off, increased by 57.1% to Rs. 1,076.79 billion (US$ 23.4 billion) at September 30, 2006 from Rs. 685.37 billion(US$ 14.9 billion) at September 30, 2005.
Interest income increased by 63.0% to Rs. 105.08 billion (US$ 2.3 billion) in the six months endedSeptember 30, 2006 from Rs. 64.45 billion (US$ 1.4 billion) in the six months ended September 30, 2005primarily due to an increase of 58.5% in the average interest-earning assets to Rs. 2,441.4 billion(US$ 53.1 billion) in the six months ended September 30, 2006 from Rs. 1,540.39 billion (US$ 33.5 billion) inthe six months ended September 30, 2005. Yield on average interest-earning assets increased to 8.6% in the sixmonths ended September 30, 2006 from 8.4% in the six months ended September 30, 2005 primarily due to aincrease in the yield on advances portfolio by 0.4% to 9.6% in the six months ended September 30, 2006 from9.2% in the six months ended September 30, 2005. The yield on advances has increased despite the significantdecline in income from sell-down of loans due to an increase in lending rates in line with the general increase ininterest rates and an increase in the volumes of certain high yielding loans. Our prime lending rate (ICICI Bank’sbenchmark lending rate) has increased by 225 basis points in the period from September 30, 2005 toSeptember 30, 2006. Our benchmark rate for floating rate home loans has increased by 150 basis points in thesame period.
Total interest expense increased 69.2% to Rs. 74.56 billion (US$ 1.6 billion) in the six months endedSeptember 30, 2006 from Rs. 44.06 billion (US$ 1.0 billion) in the six months ended September 30, 2005,primarily due to an increase of 55.2% in average interest-bearing liabilities to Rs. 2,345.73 billion (US$ 51.0billion) in the six months ended September 30, 2006 from Rs. 1,511.26 billion (US$ 32.9 billion) in the sixmonths ended September 30, 2005 and an increase of 50 basis points in our cost of funds to 6.3% in the sixmonths ended September 30, 2006 from 5.8% in the six months ended September 30, 2005. Total deposits atSeptember 30, 2006 constituted 78.6% of our funding (comprising deposits, borrowings and subordinated debt)compared to 74.1% at September 30, 2005. Total deposits increased 57.3% to Rs. 1,894.99 billion (US$ 41.2billion) at September 30, 2006 from Rs. 1,204.52 billion (US$ 26.2 billion) at September 30, 2005. This iscommensurate with our focus of increasing funding through deposits. Our cost of deposits has increased by 1.0%to 6.0% in the six months ended September 30, 2006 from 5.0% in the six months ended September 30, 2005consequent to the general increase in interest rates reflecting a tight systemic liquidity scenario, particularly sinceFebruary 2006, and an increase in deposit rates for retail and other customers. The cost of borrowings declined to7.6% in the six months ended September 30, 2006 from 7.8% in the six months ended September 30, 2005primarily due to repayment of high cost borrowings of erstwhile ICICI Limited.
42

As a result of the decrease in the income from sell-down of loans, our net interest margin decreased to 2.5%in the six months ended September 30, 2006 from 2.6% in the six months ended September 30, 2005. Our netinterest margin is expected to continue to be lower than other banks in India until we repay the borrowings ofICICI and increase the proportion of retail deposits in our total funding. The net interest margin is also impactedby the relatively lower net interest margin earned by our overseas branches, which is offset by the higher feeincome that we are able to earn by leveraging our international presence and our ability to meet the foreigncurrency borrowing requirements of Indian companies.
Non-Interest Income
The following table sets forth, for the periods indicated, the principal components of our non-interestincome.
Six months ended September 30,
2005 2006 2006 % change
(in millions, except percentages)
Commission, exchange and brokerage . . . . . . . . . . . . . . . . . . . . . . . Rs.12,518 Rs.19,447 US$423 55.4Income from treasury-related activities(1) . . . . . . . . . . . . . . . . . . . . 5,417 5,089 111 (6.1)Lease income . . . . . . . . . . . . . . . . . . . . . . . . . . . . . . . . . . . . . . . . . . 1,736 1,298 28 (25.2)Other income . . . . . . . . . . . . . . . . . . . . . . . . . . . . . . . . . . . . . . . . . . 2,350 2,643 58 12.5
Total non-interest income . . . . . . . . . . . . . . . . . . . . . . . . . . . . . . . . Rs.22,021 Rs.28,477 US$620 29.3
(1) Includes profit/loss on sale of investments and revaluation of investments and foreign exchange gain/loss.
Non-interest income increased by 29.3% in the six months ended September 30, 2006 to Rs. 28.48 billion(US$ 620 million) from Rs. 22.02 billion (US$ 479 million) in the six months ended September 30, 2005primarily due to a 55.4% increase in commission, exchange and brokerage and a 12.5% increase in other income,offset, in part by a 25.2% decline in lease income.
Commission, exchange and brokerage increased by 55.4% to Rs. 19.45 billion (US$ 423 million) in the sixmonths ended September 30, 2006 from Rs. 12.52 billion (US$ 272 million) in the six months endedSeptember 30, 2005 primarily due to growth in retail banking fee income arising from retail assets like homeloans and credit cards and retail liability product income like account servicing charges, increase in transactionbanking fee income from corporate banking and increase in fee income from international banking operations.
Total income from treasury-related activities decreased to Rs. 5.09 billion (US$ 111 million) in the sixmonths ended September 30, 2006 from Rs. 5.42 billion (US$ 118 million) in the six months endedSeptember 30, 2005, due to lower capital gains as a result of the sharp fall in the equity markets in May 2006 andadverse conditions in the debt markets. Income from treasury-related activities includes income from derivativesreflecting primarily the transactions undertaken with customers by us and hedged internally or in the inter-bankmarket, and income from merchant foreign exchange transactions.
Lease income decreased by 25.2% to Rs. 1.30 billion (US$ 28 million) in the six months endedSeptember 30, 2006 from Rs. 1.74 billion (US$ 38 million) in the six months ended September 30, 2005 mainlydue to a reduction in lease assets since we are not entering into new lease transactions. Our total leased assetswere Rs. 10.53 billion (US$ 229 million) at September 30, 2006 compared to Rs. 12.66 billion (US$ 276 million)at September 30, 2005.
Other income increased by 12.5% to Rs. 2.64 billion (US$ 58 million) in the six months endedSeptember 30, 2006 compared to Rs. 2.35 billion (US$ 51 million) in the six months ended September 30, 2005.Other income includes the unrealized gain/loss on certain derivative transactions
43

Non-Interest Expense
The following table sets forth, for the periods indicated, the principal components of non-interest expense.
Six-months period ended September 30,
2005 2006 2006 % change
(in millions, except percentages)
Employee expenses . . . . . . . . . . . . . . . . . . . . . . . . . . . . . . . . . . . . . Rs. 4,702 Rs. 7,497 US$163 59.4Depreciation on own property (including non banking assets) . . . . 1,657 1,744 38 5.3Auditors’ fees and expenses . . . . . . . . . . . . . . . . . . . . . . . . . . . . . . . 9 10 — 11.1Other administrative expenditure . . . . . . . . . . . . . . . . . . . . . . . . . . . 9,497 13,112 286 38.1
Total non-interest expense (excluding lease depreciation anddirect marketing agency expenses) . . . . . . . . . . . . . . . . . . . . . . . 15,865 22,363 487 41.0
Depreciation (net of lease equalisation) on leased assets . . . . . . . . 1,282 1,024 22 (20.1)Direct marketing agency expenses . . . . . . . . . . . . . . . . . . . . . . . . . . 5,115 7,180 156 40.4
Total non-interest expenses . . . . . . . . . . . . . . . . . . . . . . . . . . . . . . . Rs.22,262 Rs.30,567 US$665 37.3
Total non-interest expense increased by 37.3% in the six months ended September 30, 2006 to Rs. 30.57billion (US$ 665 million) from Rs. 22.26 billion (US$ 484 million) in the six months ended September 30, 2005primarily due to a 59.4% increase in employee expenses and a 38.1% increase in other administrative expenses.
Employee expenses increased 59.4% to Rs. 7.50 billion (US$ 163 million) in the six months endedSeptember 30, 2006 from Rs. 4.70 billion (US$ 102 million) in the six months ended September 30, 2005primarily due to a 33.9% increase in the number of employees to 30,784 at September 30, 2006 from 22,992 atSeptember 30, 2005, annual increase in the salaries and higher cost due to monetization of benefits on loanfacilities available to employees at concessional rates of interests and other employee benefits. The increase inemployees was commensurate with the growth in our retail businesses.
Depreciation on fixed assets other than leased assets was Rs. 1.74 billion (US$ 38 million) in the six monthsended September 30, 2006 as compared to Rs. 1.66 billion (US$ 36 million) in the six months endedSeptember 30, 2005.
Other administrative expenses increased by 38.1% to Rs. 13.11 billion (US$ 285 million) from Rs. 9.50billion (US$ 207 million) primarily due to the increased volume of business, particularly in retail banking, andincludes maintenance of ATMs, credit card expenses and call centre expenses. The number of savings accountsincreased to about 8.6 million at September 30, 2006 from about 6.9 million at September 30, 2005. The volumeof credit cards in force has increased to about 6.2 million at September 30, 2006 from about 3.6 million atSeptember 30, 2005. The number of ATMs increased to 2,336 at September 30, 2006 from 2,030 atSeptember 30, 2005.
Depreciation (net of lease equalization) on leased assets has reduced by 20.1% to Rs. 1.02 billion (US$ 22million) in the six months ended September 30, 2006 from Rs. 1.28 billion (US$ 28 million) in the six monthsended September 30, 2005 primarily due to the reduction in leased assets to Rs. 10.53 billion (US$ 229 million)at September 30, 2006 from Rs. 12.66 billion (US$ 276 million) at September 30, 2005.
We use marketing agents, called direct marketing agents or associates, for sourcing our retail assets. Weinclude commissions paid to these direct marketing agents of our retail assets in non-interest expense. Thesecommissions are expensed upfront and not amortised over the life of the loan. We incurred direct marketingagency expenses of Rs. 7.18 billion (US$ 156 million) on the retail asset portfolio in the six months endedSeptember 30, 2006 compared to Rs. 5.11 billion (US$ 111 million) in the six months ended September 30, 2005.The growth in direct marketing expenses was commensurate with growth in business volumes.
44

Provisions and contingencies
The following table sets forth, for the periods indicated, the components of provisions and contingencies.
Six months ended September 30,
2005 2006 2006 % change
(in millions, except percentages)
Provisions for investments (including credit substitutes) (net) . . . . . Rs.3,306 Rs. 5,334 US$116 61.3Provision for non-performing assets and for standard assets(1) . . . . . 2,482 5,992 130 141.4Others . . . . . . . . . . . . . . . . . . . . . . . . . . . . . . . . . . . . . . . . . . . . . . . . . 229 595 13 159.8
Total provisions and contingencies (excluding tax) . . . . . . . . . . . . . Rs.6,017 Rs.11,921 US$259 98.1
(1) We do not distinguish between provisions and write-offs while assessing the adequacy of our loan losscoverage, as both provisions and write-offs represent a reduction of the principal amount of anon-performing asset. In compliance with regulations governing the presentation of financial information bybanks, gross non-performing assets are reported gross of provisions net of cumulative write-offs in ourfinancial statements.
We classify our loans in accordance with the Reserve Bank of India guidelines. Provisions andcontingencies (excluding provision for tax) increased to Rs. 11.92 billion (US$ 259 million) in the six monthsended September 30, 2006 from Rs. 6.02 billion (US$ 131 million) in the six months ended September 30, 2005primarily due to higher provisions created on standard assets, in accordance with the revised guidelines issued bythe Reserve Bank of India, a higher level of amortization of premium on government securities (resulting in alarger provision for investments) and a lower level of write-backs.
Under the Reserve Bank of India’s guidelines issued in September 2005, banks were required to makegeneral provision at 0.4% on standard loans (excluding loans to the agricultural sector and to small and mediumenterprises). Under the Reserve Bank of India’s guidelines issued in May 2006, the general provisioningrequirement for personal loans, loans and advances qualifying as capital market exposure, residential housingloans beyond Rs. 2 million and commercial real estate was further increased to 1.0% from the 0.4%. The ReserveBank of India has allowed banks to create the above additional provision of 0.6% in a phased manner in fiscal2007.
In accordance with the above guidelines, the standard asset provision in the six months ended September 30,2006 was Rs. 1.3 billion (US$ 28 million) as compared to Rs. 0.4 billion (US$ 9 million) in the six months endedSeptember 30, 2005. The amortization of premium on government securities in the six months endedSeptember 30, 2006 was Rs. 5.1 billion (US$ 111 million) as compared to Rs. 3.4 billion (US$ 74 million) in thesix months ended September 30, 2005 primarily reflecting an increase of 44.0% in investments in governmentsecurities.
45

Tax Expense
The following table sets forth, for the periods indicated, details of tax expense computation.
Six months ended September 30,
2005 2006 2006
(in millions)
Tax at marginal rate on income . . . . . . . . . . . . . . . . . . . . . . . . . . . . . . . . . Rs. 4751.7 Rs. 5,552.6 US$ 121Adjustments
Difference in book and tax depreciation . . . . . . . . . . . . . . . . . . . . . . 1,366.9 (842.8) (18)Bad debts written off . . . . . . . . . . . . . . . . . . . . . . . . . . . . . . . . . . . . . (587.0) 3,663.9 80Special Reserve under section 36(1)(viii) . . . . . . . . . . . . . . . . . . . . . (400.0) (700.0) (15)Surplus on sale of property/assets . . . . . . . . . . . . . . . . . . . . . . . . . . . (34.3) (410.5) (9)Dividend, Exempt Interest & Other Income . . . . . . . . . . . . . . . . . . . (3,380.0) (3,693.0) (80)Capital gains on sale of shares . . . . . . . . . . . . . . . . . . . . . . . . . . . . . . (2,440.0) (5,092.6) (111)Fair value utilization . . . . . . . . . . . . . . . . . . . . . . . . . . . . . . . . . . . . . — —Other adjustments . . . . . . . . . . . . . . . . . . . . . . . . . . . . . . . . . . . . . . . 602.3 81.6 2
Net adjustments . . . . . . . . . . . . . . . . . . . . . . . . . . . . . . . . . . . . . . . . . . . . . (4,872.1) (6993.4) (151)Tax (savings)/outgo thereon-other than capital gains . . . . . . . . . . . . . . . . (1,639.9) (2,354.0) (51)Capital gains on sale of shares . . . . . . . . . . . . . . . . . . . . . . . . . . . . . . . . . . 67.3 221.7 5Tax (savings)/outgo thereon and deferred tax adjustments . . . . . . . . . . . . (1,572.6) (2,132.3) (46)Deferred taxes and other tax provisions . . . . . . . . . . . . . . . . . . . . . . . . . . (163.0) (674.3) (15)
Total income tax . . . . . . . . . . . . . . . . . . . . . . . . . . . . . . . . . . . . . . . . . . . . Rs. 3,016.0 Rs. 2,746 US$ 60Wealth tax . . . . . . . . . . . . . . . . . . . . . . . . . . . . . . . . . . . . . . . . . . . . . . . . . 15.0 15.0 0.3
Total taxation . . . . . . . . . . . . . . . . . . . . . . . . . . . . . . . . . . . . . . . . . . . . . . Rs. 3,031.0 Rs. 2,761.0 US$ 60
Notes:Adjusted profit before taxation . . . . . . . . . . . . . . . . . . . . . . . . . . . . . . . . . Rs.14,116.6 Rs.16,496.2 US$ 359Marginal rates of tax-other than long term capital gains . . . . . . . . . . . . . . 33.66% 33.66%Long term capital gains . . . . . . . . . . . . . . . . . . . . . . . . . . . . . . . . . . . . . . . 11.22% 11.22%
Income tax expense (including wealth tax) decreased by 8.9% to Rs. 2.76 billion (US$ 60 million) in the sixmonths ended September 30, 2006 from Rs. 3.03 billion (US$ 66 million) in the six months ended September 30,2006, as the effective tax rate decreased to 16.7% in the six months ended September 30, 2006 from 21.4% in thesix months ended September 30, 2005.
The effective tax rate of 16.7% for the six months ended September 30, 2006 was lower compared to thestatutory tax rate of 33.66% primarily due to exemption of dividend income, deduction of income of offshorebanking unit, deduction towards special reserve and the concessional rate of tax on capital gains and deferred taxasset on carry forward capital losses.
The Indian Finance Act, 2005 imposes an additional income tax on companies called “fringe benefit tax”.Pursuant to this Act, companies are deemed to have provided fringe benefits to the employees if certain definedexpenses are incurred. This tax is effective from April 1, 2005. The fringe benefit tax expense amounted to Rs.0.22 billion (US$ 5 million) in the six months ended September 30, 2006 as compared to Rs. 0.11 billion(US$ 2 million) in the six months ended September 30, 2005.
Financial Condition
Our total assets increased 49.2% to Rs. 2,823.72 billion (US$ 61.5 billion) at September 30, 2006 fromRs. 1,892.18 billion (US$ 41.2 billion) at September 30, 2005 primarily due to an increase in advances andinvestments. Net advances increased 45.1% to Rs. 1,554.04 billion (US$ 33.8 billion) at September 30, 2006
46

from Rs. 1,070.71 billion (US$ 23.3 billion) at September 30, 2005 primarily due to increase in retail advances inaccordance with our strategy of growth in our retail portfolio, offset, in part by reduction in advances due torepayments and securitizations. Total investments at September 30, 2006 increased 50.0% to Rs. 829.92 billion(US$ 18.1 billion) from Rs. 553.17 billion (US$ 12.0 billion) at September 30, 2005 primarily due to a 46.1%increase in investments in government and other approved securities to Rs. 607.14 billion (US$ 13.2 billion) atSeptember 30, 2006 from Rs. 415.67 billion (US$ 9.0 billion) at September 30, 2005. Other investments(including debentures and bonds) increased by 62.0% to Rs. 222.8 billion (US$ 4.8 billion) at September 30,2006 from Rs. 137.5 billion (US$ 3.0 billion) at September 30, 2005, reflecting an increase in investments ininsurance and international subsidiaries, pass through certificates and credit linked notes. Total assets (gross) ofoverseas branches (including overseas banking unit in Mumbai) were Rs. 319.8 billion (US$ 7.0 billion) atSeptember 30, 2006. Other assets increased to Rs. 162.28 billion (US$ 3.5 billion) at September 30, 2006 fromRs. 98.82 billion (US$ 2.2 billion) at September 30, 2005.
Our equity share capital and reserves at September 30, 2006 was Rs. 235.5 billion (US$ 5.1 billion) ascompared to Rs. 137.2 billion (US$ 3.0 billion) at September 30, 2005 primarily due to additional equity capitalof Rs. 80.0 billion (US$ 1.7 billion) issued in fiscal 2006, the retained profits for the year and exercise ofemployee stock options. Total deposits increased 57.3% to Rs. 1,895.00 billion (US$ 41.2 billion) atSeptember 30, 2006 from Rs. 1,204.52 billion (US$ 26.2 billion) at September 30, 2005. Our savings accountdeposits increased 87.0% to Rs. 271.77 billion (US$ 6.0 billion) at September 30, 2006 from Rs. 145.33 billion(US$ 3.2 billion) at September 30, 2005, while other demand deposits increased 17.8% to Rs. 148.20 billion(US$ 3.2 billion) at September 30, 2006 from Rs. 125.84 billion (US$ 2.7 billion) at September 30, 2005. Termdeposits increased by 58.0% to Rs. 1,475.03 billion (US$ 32.1 billion) at September 30, 2006 from Rs. 933.35billion (US$ 20.3 billion) at September 30, 2005. Total deposits at September 30, 2006 constituted 78.6% of ourfunding (i.e. deposit, borrowings and subordinated debts) compared to 74.1% at September 30, 2005. Borrowings(including subordinated debt) increased to Rs. 516.01 billion (US$ 11.2 billion) at September 30, 2006 fromRs. 421.71 billion (US$ 9.2 billion) at September 30, 2005. During the six months ended September 30, 2006, weraised 7.25% perpetual non-cumulative subordinated debt amounting to Rs. 15.51 billion (US$ 340 million) anddomestic debt of Rs. 7.83 billion (US$ 170 million) under Tier I capital, Rs. 12.55 billion (US$ 273 million)under upper Tier II capital and Rs. 20.72 billion (US$ 451 million) under lower Tier II capital.
Summary Fiscal 2006 Compared to Fiscal 2005
Profit after tax increased by 26.7% to Rs. 25.40 billion (US$ 553 million) in fiscal 2006 from Rs. 20.05billion (US$ 436 million) in fiscal 2005. Profit before provisions and tax increased by 58.7% to Rs. 46.91 billion(US$ 1.0 billion) in fiscal 2006 from Rs. 29.56 billion (US$ 643 million) in fiscal 2005 primarily due to a 46.8%increase in net interest income to Rs. 47.09 billion (US$ 1,025 million) in fiscal 2006 from Rs. 32.08 billion(US$ 698 million) in fiscal 2005, a 56.3% increase in commission, exchange and brokerage to Rs. 30.02 billion(US$ 653 million) in fiscal 2006 from Rs. 19.21 billion (US$ 418 million) in fiscal 2005 and a 35.8% increase intreasury-related income to Rs. 11.69 billion (US$ 254 million) in fiscal 2006 from Rs. 8.61 billion (US$ 187million) in fiscal 2005 offset, in part, by an increase in non-interest expense (excluding depreciation on leasedassets and commission paid to direct marketing agents) by Rs. 10.30 billion (US$ 224 million) to Rs. 35.47billion (US$ 772 million) in fiscal 2006 from Rs. 25.17 billion (US$ 548 million) in fiscal 2005. Provisions andcontingencies (excluding provision for tax) increased to Rs. 15.94 billion (US$ 347 million) in fiscal 2006 fromRs. 4.29 billion (US$ 93 million) in fiscal 2005.
Net interest income increased by 46.8% to Rs. 47.09 billion (US$ 1,025 million) in fiscal 2006 fromRs. 32.08 billion (US$ 698 million) in fiscal 2005, primarily reflecting an increase of 47.9% in the averagevolume of interest-earning assets.
Commission, exchange and brokerage increased by 56.3% to Rs. 30.02 billion (US$ 653 million) in fiscal2006 from Rs. 19.21 billion (US$ 418 million) in fiscal 2005, primarily due to growth in credit card fees andthird-party product distribution fees, an increase in income from remittances and other fees from internationalbanking business and growth in corporate banking fees.
47

Income from treasury-related activities increased by 35.8% to Rs. 11.69 billion (US$ 254 million) in fiscal2006 from Rs. 8.61 billion (US$ 187 million) in fiscal 2005 primarily due to an increase in the profit on sale ofequity investments and income from derivatives reflecting primarily the transactions undertaken with customersby us and hedged internally, or in the inter-bank market and merchant foreign exchange income.
Non-interest expense increased (excluding depreciation on leased assets and commission paid to directmarketing agents) by 40.9% to Rs. 35.47 billion (US$ 772 million) in fiscal 2006 from Rs. 25.17 billion(US$ 548 million) in fiscal 2005 primarily due to a 46.8% increase in employee expenses.
Provisions and contingencies (excluding provision for tax) increased to Rs. 15.94 billion (US$ 347 million)in fiscal 2006 from Rs. 4.29 billion (US$ 93 million) in fiscal 2005 primarily due to the significantly higher levelof amortization of premium on government securities in fiscal 2006, which was Rs. 8.02 billion (US$ 175million), compared to Rs. 2.76 billion (US$ 60 million) in fiscal 2005 primarily due to an increase in theinvestments in government securities, transfer of a substantial portion of the investments in governmentsecurities from “available for sale” to “held to maturity category” in the second half of fiscal 2005 and a lowerlevel of write-backs in fiscal 2006.
Total assets increased by 49.9% to Rs. 2,513.89 billion (US$ 54.7 billion) at year-end fiscal 2006 fromRs. 1,676.59 billion (US$ 36.5 billion) at year-end fiscal 2005 primarily due to growth in net advances by 59.9%,and in investments by 41.7%.
Net Interest Income
Net interest income increased by 46.8% to Rs. 47.09 billion (US$ 1,025 million) in fiscal 2006 fromRs. 32.08 billion (US$ 698 million) in fiscal 2005, reflecting mainly the following:
• an increase of Rs. 557.43 billion (US$ 12.1 billion) or 47.9% in the average volume of interest-earningassets; and
• net interest margin of 2.74% for fiscal 2006 as compared to 2.76% for fiscal 2005.
The average volume of interest-earning assets increased by Rs. 557.43 billion (US$ 12.1 billion) duringfiscal 2006 primarily due to the increase in average advances by Rs. 400.12 billion (US$ 8.7 billion), and anincrease in average investments and average other interest-earning assets by Rs. 157.31 billion (US$ 3.4 billion).The increase in the average advances was mainly due to increased disbursements of retail finance loans, offset, inpart, by securitization of loans and repayment of existing loans. Net retail advances increased by 64.2% toRs. 921.98 billion (US$ 20.1 billion) at year-end fiscal 2006 from Rs. 561.34 billion (US$ 12.2 billion) atyear-end fiscal 2005.
Interest income increased by 46.3% to Rs. 143.06 billion (US$ 3,113 million) in fiscal 2006 from Rs. 97.79billion (US$ 2,128 million) in fiscal 2005 primarily due to an increase of 47.9% in the average interest-earningassets to Rs. 1,720.57 billion (US$ 37.4 billion), offset, in part, by a decline in the yield on average advances by0.8% to 9.1% in fiscal 2006. In February 2006, the Reserve Bank of India issued guidelines for accounting forsecuritization of standard assets. In accordance with these guidelines, with effect from February 1, 2006, weaccount for any loss arising on securitization immediately at the time of sale and the profit/premium arising onaccount of securitization is amortized over the life of the asset. Prior to February 1, 2006, profit arising onaccount of securitization has been recorded at the time of sale. The yield on average interest-earning assets infiscal 2006 was at 8.3%.
We use marketing agents, called direct marketing agents or associates, for sourcing retail loans. Thecommissions paid to these marketing agents are expensed upfront and not amortized over the life of the loan.Effective April 1, 2006, the commissions paid to direct marketing agents or associates in connection withsourcing of our automobile loans, accounted for on an upfront basis, which were earlier deducted from interestincome, have been included in non-interest expense. The interest income and operating expense for fiscal 2005and fiscal 2006 have also been regrouped accordingly.
48

Total interest expense increased by 46.1% to Rs. 95.97 billion (US$ 2,089 million) in fiscal 2006 fromRs. 65.71 billion (US$ 1,430 million) in fiscal 2005, due to a 45.7% increase in average interest-bearingliabilities to Rs. 1,658.73 billion (US$ 36.1 billion). Cost of funds for fiscal 2006 remained at the same levels asin fiscal 2005, at 5.8%. Cost of deposits increased to 5.0% in fiscal 2006 from 4.5% in fiscal 2005 consequent tothe general increase in interest rates in India, in particular the increase in short-term interest rates in the secondhalf of fiscal 2006. Deposits increased by 65.4% to Rs. 1,650.83 billion (US$ 36.0 billion) at year-end fiscal2006, constituting 77.2% of our total funding (comprising deposits, borrowings and subordinated debt) comparedto 70.5% at year-end fiscal 2005.
Net interest margin for fiscal 2006 was 2.7% as the positive impact of equity capital raising was offset byincreased cost of deposits and lower contribution of securitization gains.
Non-Interest Income
The following table sets forth, for the periods indicated, the principal components of our non-interestincome.
Year ended March 31,
2005 2006 2006 % change
(in millions, except percentages)
Commission, exchange and brokerage . . . . . . . . . . . . . . . . . . Rs.19,210.0 Rs.30,019.6 US$ 653 56.3Income from treasury-related activities . . . . . . . . . . . . . . . . . 8,606.8 11,693.5 255 35.8Lease income . . . . . . . . . . . . . . . . . . . . . . . . . . . . . . . . . . . . . 4,077.6 3,606.4 79 (11.5)Other income . . . . . . . . . . . . . . . . . . . . . . . . . . . . . . . . . . . . . 2,267.0 4,511.9 98 99.0
Total non-interest income . . . . . . . . . . . . . . . . . . . . . . . . . . Rs.34,161.4 Rs.49,831.4 US$1,085 45.9
Non-interest income increased by 45.9% to Rs. 49.83 billion (US$ 1,084 million) in fiscal 2006 fromRs. 34.16 billion (US$ 743 million) in fiscal 2005 primarily due to a 56.3% increase in commission, exchangeand brokerage to Rs. 30.02 billion (US$ 653 million) in fiscal 2006 from Rs. 19.21 billion (US$ 418 million) infiscal 2005 and a 35.8% increase in income from treasury-related activities to Rs. 11.69 billion (US$ 254 million)in fiscal 2006 from Rs. 8.61 billion (US$ 187 million) in fiscal 2005.
Commission, exchange and brokerage increased by 56.3% primarily due to growth in credit card fees andthird-party product distribution fees, increase in income from remittances and other fees from internationalbanking business and growth in corporate banking fees. During fiscal 2006, retail products and servicescontributed about 58% of total fee income, corporate products and services contributed about 30% andinternational products and services contributed the balance of 12%.
Total income from treasury-related activities increased by 35.8% to Rs. 11.69 billion (US$ 255 million) infiscal 2006 from Rs. 8.61 billion (US$ 187 million) in fiscal 2005 primarily due to an increase in the profit onsale of equity investments. Capital gains on shares were Rs. 6.77 billion (US$ 147 million) for fiscal 2006compared to Rs. 4.61 billion (US$ 100 million) for fiscal 2005, as we continued to capitalize on the opportunitiescreated by the buoyant equity markets through divestment of certain of our non-core investments and throughproprietary trading operations. Income from treasury-related activities includes income from derivativesreflecting primarily the transactions undertaken with customers by us and hedged internally or in the inter-bankmarket, and income from merchant foreign exchange transactions.
Lease income decreased by 11.5% to Rs. 3.61 billion (US$ 79 million) in fiscal 2006 from Rs. 4.08 billion(US$ 89 million) in fiscal 2005 primarily due to a reduction in lease assets since we are not entering into newlease transactions. Total leased assets were Rs. 11.74 billion (US$ 0.3 billion) at year-end fiscal 2006 comparedto Rs. 14.53 billion (US$ 0.3 billion) at year-end fiscal 2005.
49

Other income increased by 99.0% to Rs. 4.51 billion (US$ 98 million) for fiscal 2006 compared to Rs. 2.27billion (US$ 49 million) for fiscal 2005 primarily due to an increase in dividend from subsidiaries and gains frombuyback of shares by subsidiaries services. Other income includes the unrealized gain/loss on certain derivativetransactions.
Non-Interest Expense
The following table sets forth, for the periods indicated, the principal components of non-interest expense.
Year ended March 31,
2005 2006 2006 % change
(in millions, except percentages)
Employee expenses . . . . . . . . . . . . . . . . . . . . . . . . . . . . . . . . . Rs. 7,374.1 Rs.10,822.9 US$ 235 46.8Depreciation on fixed assets other than leased assets
(including non-banking assets) . . . . . . . . . . . . . . . . . . . . . . 2,933.7 3,471.7 76 18.3Rent, taxes & lighting . . . . . . . . . . . . . . . . . . . . . . . . . . . . . . . 1,853.4 2,348.0 51 26.7Printing & stationery . . . . . . . . . . . . . . . . . . . . . . . . . . . . . . . 876.6 1,110.4 24 26.7Postage, telephone & courier . . . . . . . . . . . . . . . . . . . . . . . . . 1,736.3 2,157.6 47 24.3Repairs & maintenance . . . . . . . . . . . . . . . . . . . . . . . . . . . . . . 2,159.5 2,580.7 56 19.5Insurance . . . . . . . . . . . . . . . . . . . . . . . . . . . . . . . . . . . . . . . . . 597.2 1,080.3 24 80.9Advertisement . . . . . . . . . . . . . . . . . . . . . . . . . . . . . . . . . . . . . 1,162.6 1,855.5 40 59.6Others . . . . . . . . . . . . . . . . . . . . . . . . . . . . . . . . . . . . . . . . . . . 6,473.7 10,047.6 219 55.2
Total non-interest expense (excluding lease depreciationand direct marketing agency expenses) . . . . . . . . . . . . . Rs.25,167.1 Rs.35,474.7 US$ 772 40.9
Depreciation (net of lease equalization) on leased assets . . . . 2,969.9 2,766.3 60 (6.9)Direct marketing agency expenses . . . . . . . . . . . . . . . . . . . . . 8,545.7 11,770.6 256 37.7
Total non-interest expense . . . . . . . . . . . . . . . . . . . . . . . . . . Rs.36,682.7 Rs.50,011.5 US$1,088 36.3
Non-interest expense (excluding direct marketing agency expense and lease depreciation) increased by40.9% for fiscal 2006 to Rs. 35.47 billion (US$ 772 million) from Rs. 25.17 billion (US$ 548 million) for fiscal2005 primarily due to 46.8% increase in employee expenses.
Employee expenses increased by 46.8% to Rs. 10.82 billion (US$ 235 million) in fiscal 2006 from Rs. 7.37billion (US$ 160 million) in fiscal 2005 primarily due to a 40.8% increase in the number of employees to 25,384at year-end fiscal 2006 from 18,029 at year-end fiscal 2005. The increase in the number of employees wascommensurate with the growth in business.
Depreciation on fixed assets other than leased assets, increased by 18.3% to Rs. 3.47 billion (US$ 76million) from Rs. 2.93 billion (US$ 64 million) primarily due to additions to premises of Rs. 1.45 billion(US$ 32 million) and other fixed assets of Rs. 4.36 billion (US$ 95 million) during fiscal 2006.
Other operating expenses increased primarily due to the increased volume of business, particularly in retailbanking and includes maintenance of ATMs, credit card related expenses, call centre expenses and technologyexpenses. The number of savings accounts increased to about 8.9 million at year-end fiscal 2006 from about7.5 million at year-end fiscal 2005. The number of credit cards issued increased to about 5.2 million at year-endfiscal 2006 from about 3.3 million at year-end fiscal 2005. The number of branches (excluding foreign branchesand OBUs) and extension counters increased to 614 at year-end fiscal 2006 from 562 at year-end fiscal 2005.ATMs increased to 2,200 at year-end fiscal 2006 from 1,910 at year-end fiscal 2005.
Depreciation (net of lease equalization) on leased assets decreased 6.9% to Rs. 2.77 billion (US$ 60 million)in fiscal 2006 from Rs. 2.97 billion (US$ 65 million) in fiscal 2005.
50

We use marketing agents, called direct marketing agents or associates, for sourcing retail assets. Thesecommissions are expensed upfront and not amortized over the life of the loan. Commissions paid to these directmarketing agents for retail assets are included in non-interest expense. Effective April 1, 2006, the commissionspaid to direct marketing agents or associates in connection with sourcing our automobile loans accounted for onan upfront basis, which were earlier deducted from interest income, have been included under non-interestexpense. The interest income and operating expense for fiscal 2005 and fiscal 2006 have also been regroupedaccordingly. We incurred direct marketing agency expenses of Rs. 11.77 billion (US$ 256 million) on the retailasset portfolio in fiscal 2006 compared to Rs. 8.54 billion (US$ 186 million) in fiscal 2005, with the increasebeing commensurate with growth in business volumes.
Provisions and Contingencies
The following table sets forth, for the periods indicated, the components of provisions and contingencies.
Year ended March 31,
2005 2006 2006 % change
(in millions, except percentages)
Provision for investments (including credit substitutes)(net) . . Rs. 5,415.6 Rs. 7,766.6 US$169 43.4Provision for non-performing assets (including provision for
standard assets)(1) . . . . . . . . . . . . . . . . . . . . . . . . . . . . . . . . . . (1,213.6) 7,947.3 173 (754.9)Others . . . . . . . . . . . . . . . . . . . . . . . . . . . . . . . . . . . . . . . . . . . . . 86.0 226.8 5 163.7
Total provisions . . . . . . . . . . . . . . . . . . . . . . . . . . . . . . . . . . . . Rs. 4,288.0 Rs.15,940.7 US$347 271.8
(1) We do not distinguish between provisions and write-offs while assessing the adequacy of our loan losscoverage, as both provisions and write-offs represent a reduction of the principal amount of anon-performing asset. In compliance with regulations governing the presentation of financial information bybanks, gross non-performing assets are reported gross of provisions net of cumulative write-offs in ourfinancial statements.
Provisions and contingencies (excluding provisions for tax) increased to Rs. 15.94 billion (US$ 347 million)in fiscal 2006 from Rs. 4.29 billion (US$ 93 million) in fiscal 2005 primarily due to the significantly higher levelof amortization of premium on government securities in fiscal 2006 (Rs. 8.02 billion (US$ 175 million),compared to Rs. 2.76 billion (US$ 60 million) in fiscal 2005) primarily due to an increase in the investments ingovernment securities, transfer of a substantial portion of the investments in government securities from“available for sale” to “held to maturity category” in the second half of fiscal 2005 and lower level of write-backsin fiscal 2006. With effect from the quarter ended December 31, 2005, the Reserve Bank of India increased therequirement of general provisioning on standard loans (excluding loans to the agricultural sector and small andmedium enterprises) to 0.40% compared to 0.25% applicable until September 30, 2005. In accordance with theseguidelines we made general provision of Rs. 3.39 billion (US$ 74 million) in fiscal 2006. During fiscal 2006, wereassessed our provision requirement on performing loans and non-performing loans on a portfolio basis andwrote back an amount of Rs. 1.69 billion (US$ 37 million) from the provisions against non-performing loans,which were in excess of the regulatory requirement.
51

Tax Expense
The following table sets forth, for the periods indicated, details of tax expense computation.
Year ended March 31,
2005 2006 2006
(in millions)
Tax at marginal rate on income . . . . . . . . . . . . . . . . . . . . . . . . . . . . . Rs. 9,236.7 Rs. 10,423.2 US$ 227Adjustments
Difference in book and tax depreciation . . . . . . . . . . . . . . . . . . . . 1,800.0 2,351.8 51Bad debts written off . . . . . . . . . . . . . . . . . . . . . . . . . . . . . . . . . . . (13,839.5) (1,454.2) (32)Special reserve under section 36(1)(viii) . . . . . . . . . . . . . . . . . . . — (2,500.0) (54)Surplus on sale of property/assets . . . . . . . . . . . . . . . . . . . . . . . . . 20.8 (71.2) (2)Dividend exempt interest and other income . . . . . . . . . . . . . . . . . (2,660.0) (4,620.0) (101)Tax-free Income exempt under Section 10(15)(iv)(h) &
10(23G) . . . . . . . . . . . . . . . . . . . . . . . . . . . . . . . . . . . . . . . . . . . (580.0) (230.0) (5)Capital gains on sale of shares . . . . . . . . . . . . . . . . . . . . . . . . . . . (3,940.0) (5,961.6) (130)Fair value utilization . . . . . . . . . . . . . . . . . . . . . . . . . . . . . . . . . . . (2,510.0) — —Other adjustments . . . . . . . . . . . . . . . . . . . . . . . . . . . . . . . . . . . . . 1,728.0 715.5 16
Net adjustments . . . . . . . . . . . . . . . . . . . . . . . . . . . . . . . . . . . . . . . . . . . (19,980.80) (11,769.7) (257)Tax (savings)/outgo thereon—other than capital gains . . . . . . . . . . . . (7,311.5) (3,961.7) (86)Capital gains on sale of shares . . . . . . . . . . . . . . . . . . . . . . . . . . . . . . . 204.9 96.5 2Tax (savings)/outgo thereon . . . . . . . . . . . . . . . . . . . . . . . . . . . . . . . . . (7,106.5) (3,865.2) (84)Add/(less): Deferred taxes and other tax provisions . . . . . . . . . . . . . . . 3,059.9 (1,023.0) (22)
Total income tax . . . . . . . . . . . . . . . . . . . . . . . . . . . . . . . . . . . . . . . . . Rs. 5,190.0 Rs. 5,535.0 US$ 120
Wealth tax . . . . . . . . . . . . . . . . . . . . . . . . . . . . . . . . . . . . . . . . . . . . . . . 30.0 30.0 1
Total taxation . . . . . . . . . . . . . . . . . . . . . . . . . . . . . . . . . . . . . . . . . . . Rs. 5,220.0 Rs. 5,565.0 US$ 121
Notes:Adjusted profit before taxation . . . . . . . . . . . . . . . . . . . . . . . . . . . . . . . Rs. 25,242.0 Rs. 30,966.1 US$ 674Marginal rates of tax-other than long term capital gains . . . . . . . . . . . 36.59% 33.66%Long-term capital gains . . . . . . . . . . . . . . . . . . . . . . . . . . . . . . . . . . . . . 10.46% 11.22%
Income tax expense (including wealth tax) increased by 6.7% to Rs. 5.57 billion (US$ 121 million) in fiscal2006 from Rs. 5.22 billion (US$ 114 million) in fiscal 2005 as effective income tax rate decreased to 18.0% infiscal 2006 from 20.7% in fiscal 2005. The effective income tax rate continued to be lower than the statutoryrates for fiscal 2006 primarily due to exempt interest and dividend income and the charging of certain income atrates other than the statutory rate, off-set in part, by the disallowance of certain expenses for tax purposes.Further, during fiscal 2006, we created a deferred tax asset on carried forward capital losses based on our firmplans that sufficient taxable capital gains will be available in future against which the losses can be set off.
Financial Condition
Our total assets increased by 49.9% to Rs. 2,513.89 billion (US$ 54.7 billion) at year-end fiscal 2006 fromRs. 1,676.59 billion (US$ 36.5 billion) at year-end fiscal 2005. Net advances increased by 59.9% to Rs. 1,461.63billion (US$ 31.8 billion) at year-end fiscal 2006 from Rs. 914.05 billion (US$ 19.9 billion) at year-end fiscal2005 primarily due to an increase in retail advances in accordance with our strategy of growth in its retailportfolio, offset, in part by a reduction in advances due to repayments and securitization. Retail advancesincreased by 64.2% to Rs. 921.98 billion (US$ 20.1 billion) at year-end fiscal 2006 from Rs. 561.34 billion(US$ 12.2 billion) at year-end fiscal 2005. Total investments at year-end fiscal 2005 increased by 41.7% toRs. 715.47 billion (US$ 15.6 billion) from Rs. 504.87 billion (US$ 11.0 billion) at year-end fiscal 2005. SLRinvestments (represents Indian government securities considered towards meeting the statutory liquidity ratio
52

requirement) at year-end fiscal 2006 increased by 48.1% to Rs. 510.74 billion (US$ 11.1 billion) from Rs. 344.82billion (US$ 7.5 billion) at year-end fiscal 2005, in line with the growth in the balance sheet. Other investments(including debentures & bonds) at year-end fiscal 2006 increased by 27.9% to Rs. 204.73 billion (US$ 4.5billion) from Rs. 160.06 billion (US$ 3.5 million) at year-end fiscal 2005, reflecting increase in investments ininsurance and international subsidiaries, pass-through certificates and credit-linked notes. Total assets (gross) ofoverseas branches (including overseas banking unit in Mumbai) increased by 117.3% to Rs. 275.86 billion(US$ 6.0 billion) at year-end fiscal 2006 from Rs. 126.96 billion (US$ 2.8 billion) at year-end fiscal 2005.
Our equity share capital and reserves at year-end fiscal 2006 increased by 76.9% to Rs. 222.06 billion(US$ 4.8 billion) from Rs. 125.50 billion (US$ 2.7 billion) at year-end fiscal 2005, as a result of the equitycapital of Rs. 80.01 billion (US$ 1.7 billion) raised during the year and the retained profit for the year. Totaldeposits increased by 65.4% to Rs. 1,650.83 billion (US$ 35.9 billion) at year-end fiscal 2006 from Rs. 998.19billion (US$ 21.7 billion) at year-end fiscal 2005. Our savings account deposits increased by 83.8% to Rs. 209.37billion (US$ 4.6 billion) at year-end fiscal 2006 from Rs. 113.92 billion (US$ 2.5 billion) at year-end fiscal 2005,while other demand deposits increased by 29.1% to Rs. 165.73 billion (US$ 3.6 billion) at year-end fiscal 2006from Rs. 128.37 billion (US$ 2.8 billion) at year-end fiscal 2005. Term deposits increased by 68.8% toRs. 1,275.73 billion (US$ 27.8 billion) at year-end fiscal 2006 from Rs. 755.90 billion (US$ 16.5 billion) atyear-end fiscal 2005. Total borrowings increased by 14.8% to Rs. 385.22 billion (US$ 8.4 billion) at year-endfiscal 2006 from Rs. 335.44 billion (US$ 7.3 billion) at year-end fiscal 2005.
Summary Fiscal 2005 Compared to Fiscal 2004
Profit after tax increased by 22.5% to Rs. 20.05 billion for fiscal 2005 from Rs. 16.37 billion in fiscal 2004.Profit before provisions and tax increased by 19.2% to Rs. 29.56 billion in fiscal 2005 from Rs. 24.81 billion infiscal 2004 primarily due to a 39.9% increase in net interest income to Rs. 32.08 billion in fiscal 2005 fromRs. 22.93 billion in fiscal 2004, a 79.2% increase in commission, exchange and brokerage to Rs. 19.21 billion infiscal 2005 from Rs. 10.72 billion in fiscal 2004 offset, in part, by a decrease in the income from treasury-relatedactivities by Rs. 5.57 billion to Rs. 8.61 billion in fiscal 2005 from Rs. 14.18 billion in fiscal 2004 and anincrease in non-interest expenses by Rs. 7.92 billion to Rs. 36.69 billion in fiscal 2005 from Rs. 28.77 billion infiscal 2004. Provisions and contingencies (excluding tax provisions) decreased by 25.9% to Rs. 4.29 billion infiscal 2005 from Rs. 5.79 billion in fiscal 2004.
Net interest income increased by 39.9% to Rs. 32.08 billion in fiscal 2005 from Rs. 22.93 billion in fiscal2004, reflecting an increase of 18.1% in the average volume of interest-earning assets. Effective April 1, 2006,the commissions paid to direct marketing agency expenses or associates in connection with sourcing ourautomobile loans accounted for on an upfront basis have been included under non-interest expense. The interestincome in fiscal 2005 and fiscal 2004 does not include these commissions as it has been regrouped asnon-interest expense.
Commission, exchange and brokerage increased by 79.2% to Rs. 19.21 billion in fiscal 2005 from Rs. 10.72billion in fiscal 2004, primarily due to growth in retail liability product income such as account servicingcharges, and transaction banking fee income from small enterprises, as well as an increase in transaction bankingand other fee income from corporate banking.
Income from treasury-related activities decreased by Rs. 5.57 billion to Rs. 8.61 billion in fiscal 2005 fromRs. 14.18 billion in fiscal 2004 primarily due to a decrease in profit on the sale of investments to Rs. 5.46 billionin fiscal 2005 from Rs. 12.25 billion in fiscal 2004.
Non-interest expenses (including direct marketing agency expenses) increased by 27.5% to Rs. 36.69 billionin fiscal 2005 from Rs. 28.76 billion in fiscal 2004 primarily due to a 35.0% increase in employee expenses and a24.7% increase in other administrative expenses.
53

Provisions and contingencies (excluding tax provisions) decreased by 25.9% to Rs. 4.29 billion in fiscal2005 from Rs. 5.79 billion in fiscal 2004 primarily due to lower additions to non-performing assets.
Total assets increased by 33.9% to Rs. 1,676.59 billion at year-end fiscal 2005 from Rs. 1,252.29 billion atyear-end fiscal 2004.
Net Interest Income
Net interest income increased by 39.9% to Rs. 32.08 billion in fiscal 2005 from Rs. 22.93 billion in fiscal2004, reflecting mainly the following:
• an increase of Rs. 178.21 billion or 18.1% in the average volume of interest-earning assets; and
• an increase in the net interest margin by 0.5% to 2.8% in fiscal 2005 from 2.3% in fiscal 2004.
The average volume of interest-earning assets increased to Rs. 178.21 billion during fiscal 2005 primarilydue to the increase in average advances of Rs. 152.75 billion, and an increase in average investments and otheraverage interest-earning assets of Rs. 25.46 billion. The increase in the average advances was mainly due toincreased disbursements of retail finance loans, offset, in part, by securitization of loans and repayment ofexisting loans.
Interest income increased by 5.1% to Rs. 97.79 billion in fiscal 2005 from Rs. 93.08 billion in fiscal 2004primarily due to an increase of 18.1% in average interest-earning assets, offset, in part, by a 1.1% decrease inyield on average interest-earning assets. Yield on average interest-earning assets decreased by 1.1% to 8.4% infiscal 2005 compared to 9.5% in fiscal 2004, primarily due to a decline in the yield on advances to 9.9% in fiscal2005 from 11.2% in fiscal 2004 and a decline in the yield on average investments from 7.6% in fiscal 2004 to6.4% in fiscal 2005. Effective April 1, 2006, the commissions paid to direct marketing agency expenses orassociates in connection with sourcing our automobile loans accounted for on an upfront basis have beenincluded under non-interest expense. The interest income in fiscal 2005 and fiscal 2004 does not include thesecommissions as it has been regrouped as non-interest expense.
Total interest expense decreased 6.3% to Rs. 65.71 billion in fiscal 2005 from Rs. 70.15 billion in fiscal2004, primarily due to a decline in the cost of funds to 5.8% in fiscal 2005 from 7.1% in fiscal 2004, offset, inpart by an increase of 15.0% in the volume of average interest-bearing liabilities to Rs. 1,138.25 billion for fiscal2005. Cost of funds decreased primarily due to the impact of repayment of the higher cost borrowings of ICICIacquired on amalgamation, lower interest rates on new borrowings as well as a reduction in cost of deposit to4.5% in fiscal 2005 from 5.4% in fiscal 2004.
As a result of the 1.3% decline in the cost of funds, offset, in part, by a 1.1% decline in yield on averageinterest-earning assets, net interest margin increased to 2.8% in fiscal 2005 from 2.3% in fiscal 2004.
Non-Interest Income
The following table sets forth, for the periods indicated, the principal components of our non-interestincome.
Year ended March 31,
2004 2005 % change
(in millions, except percentages)
Commission, exchange and brokerage . . . . . . . . . . . . . . . . . . . . . . . . . . . Rs. 10,718.0 Rs. 19,210.0 79.2Income from treasury-related activities . . . . . . . . . . . . . . . . . . . . . . . . . . 14,172.6 8,606.8 (39.3)Lease income . . . . . . . . . . . . . . . . . . . . . . . . . . . . . . . . . . . . . . . . . . . . . . 4,210.7 4,077.6 (3.2)Other income . . . . . . . . . . . . . . . . . . . . . . . . . . . . . . . . . . . . . . . . . . . . . . . 1,547.9 2,267.0 46.5
Total non-interest income . . . . . . . . . . . . . . . . . . . . . . . . . . . . . . . . . . . Rs. 30,649.2 Rs. 34,161.4 11.5
54

Non-interest income increased by 11.5% to Rs. 34.16 billion in fiscal 2005 from Rs. 30.65 billion in fiscal2004 primarily due to a 79.2% increase in commission, exchange and brokerage to Rs. 19.21 billion in fiscal2005 from Rs. 10.72 billion in fiscal 2004 offset, in part, by a decrease in income from treasury-related activitiesby 39.3% to Rs. 8.61 billion in fiscal 2005 from Rs. 14.18 billion in fiscal 2004.
Commission, exchange and brokerage increased by 79.2% primarily due to growth in fee income from retailproducts and services, including fees arising from retail asset products like home loans and credit cards and retailliability-related income like account servicing charges, and an increase in transaction banking fee income fromsmall enterprises, as well as an increase in transaction banking and other fee income from corporate banking.During this period we increased charges and introduced fresh charges for some of the services that we offer toour deposit customers. During this period there was also a significant increase in the business volumes oftransaction banking services such as bankers acceptances, bank guarantees and cash management services.
Total income from treasury-related activities decreased to Rs. 8.61 billion in fiscal 2005 from Rs. 14.18billion due to the decrease in trading profits on government securities and corporate debt securities as a result ofthe increasing interest rates in the fixed income market. During fiscal 2005 the yield on 10-year Government ofIndia securities increased by 1.52% to 6.68%. During fiscal 2004, the yield on 10-year Government of Indiasecurities had declined by 1.05% and we had capitalized on this decline to realize a high level of trading profitson fixed income securities. The level of trading profits is volatile as it depends on specific market conditions,which may or may not be favorable. Income from treasury related activity includes income from derivativesreflecting primarily the transactions undertaken with customers by us and income from merchant foreignexchange transactions.
Lease income decreased by 3.5% to Rs. 4.08 billion in fiscal 2005 from Rs. 4.21 billion in fiscal 2004primarily due to a reduction in leased assets since we are not entering into new lease transactions. Our totalleased assets were Rs. 14.53 billion at year-end fiscal 2005 compared to Rs. 16.63 billion at year-end fiscal 2004.
Other income increased by 47.7% to Rs. 2.26 billion in fiscal 2005 compared to Rs. 1.54 billion in fiscal2004 primarily due to a 49.1% increase in income earned by way of dividends from subsidiaries to Rs. 1.88billion in fiscal 2005 from Rs. 1.26 billion in fiscal 2004. Other income includes the unrealized gain/loss oncertain derivative transactions.
Non-Interest Expense
The following table sets forth, for the periods indicated, the principal components of non-interest expense.
Year ended March 31,
2004 2005 % change
(in millions, except percentages)
Employee expenses . . . . . . . . . . . . . . . . . . . . . . . . . . . . . . . . . . . . . . . . . . . Rs. 5,460.6 Rs. 7,374.1 35.0Depreciation on own property (including non-banking assets) . . . . . . . . . 2,609.3 2,933.7 12.4Auditors’ fees and expenses . . . . . . . . . . . . . . . . . . . . . . . . . . . . . . . . . . . . 16.8 17.6 4.8Other administrative expenditure . . . . . . . . . . . . . . . . . . . . . . . . . . . . . . . . 11,903.5 14,841.7 24.7
Total non-interest expense (excluding lease depreciation and directmarketing agency expenses) . . . . . . . . . . . . . . . . . . . . . . . . . . . . . . . . Rs.19,990.2 Rs.25,167.1 25.9
Depreciation (including lease equalization) on leased assets . . . . . . . . . . . 2,785.1 2,969.9 6.6Direct marketing agency expenses . . . . . . . . . . . . . . . . . . . . . . . . . . . . . . . 5,999.5 8,545.7 42.4
Total non-interest expense . . . . . . . . . . . . . . . . . . . . . . . . . . . . . . . . . . . Rs.28,774.8 Rs.36,682.7 27.5
Non-interest expense increased by 27.5% to Rs. 36.69 billion in fiscal 2005 from Rs. 28.76 billion in fiscal2004 primarily due to a 35.0% increase in employee expenses and a 24.7% increase in other administrativeexpenses.
55
Employee expenses increased by 35.0% to Rs. 7.37 billion in fiscal 2005 from Rs. 5.46 billion in fiscal 2004primarily due to a 32.5% increase in the number of employees to 18,029 at year-end fiscal 2005 from 13,609 atyear-end fiscal 2004. The increase in number of employees was commensurate with the growth in our retailbusiness operations. We implemented an Early Retirement Option Scheme for employees in July 2003. Inaccordance with the treatment approved by the Reserve Bank of India, the ex-gratia payments under the EarlyRetirement Option Scheme, termination benefits and leave encashment in excess of the provisions made (net oftax benefits), aggregating to Rs. 1.91 billion, are being amortized over a period of five years commencingAugust 1, 2003 (the date of retirement of employees exercising the option being July 31, 2003). An amount ofRs. 384.0 million was expensed in fiscal 2005 compared to Rs. 256.0 million in fiscal 2004 on account of theEarly Retirement Option Scheme.
Other administrative expenses increased by 24.7% to Rs. 14.84 billion in fiscal 2005 from Rs. 11.90 billionin fiscal 2004 primarily due to the increased volume of business, particularly in retail banking, includingmaintenance of ATMs, credit card expenses, call centre expenses and technology expenses. The volume of creditcards issued increased to approximately 3.3 million at year-end fiscal 2005 from approximately 2.2 million atyear-end fiscal 2004. The number of ATMs increased to 1,910 at year-end fiscal 2005 from 1,790 at year-endfiscal 2004. The number of branches and extension counters increased to 562 at year-end fiscal 2005 from 469 atyear-end fiscal 2004.
We incurred direct marketing agency expenses of Rs. 8.55 billion on the retail asset portfolio in fiscal 2005compared to Rs. 6.00 billion in fiscal 2004, in commensuration with the growth in retail business volumes.Effective April 1, 2006, the commissions paid to direct marketing agents or associates in connection withsourcing our automobile loans accounted for on an upfront basis have been included under non-interest expense.The interest income in fiscal 2005 and fiscal 2004 does not include these commissions as it has been regroupedas non-interest expense.
Provisions and contingencies
The following table sets forth, for the periods indicated, the components of provisions and contingencies.
Year ended March 31,
2004 2005 % change
(in millions, except percentages)
Provision for investments (including credit substitutes) (net) . . . . . . . . . . . Rs. 987.1 Rs. 5,415.6 448.6Provision for non-performing assets (including provision for standard
assets)(1) . . . . . . . . . . . . . . . . . . . . . . . . . . . . . . . . . . . . . . . . . . . . . . . . . . . 4,591.2 (1,213.6) (126.4)Others . . . . . . . . . . . . . . . . . . . . . . . . . . . . . . . . . . . . . . . . . . . . . . . . . . . . . . 207.9 86.0 (58.6)
Total provisions . . . . . . . . . . . . . . . . . . . . . . . . . . . . . . . . . . . . . . . . . . . . . Rs.5,786.2 Rs. 4,288.0 (25.9)
(1) We do not distinguish between provisions and write-offs while assessing the adequacy of our loan losscoverage, as both provisions and write-offs represent a reduction of the principal amount of anon-performing asset. In compliance with regulations governing the presentation of financial information bybanks, gross non-performing assets are reported gross of provisions and net of cumulative write-offs in ourfinancial statements.
Total provisions decreased by 25.9% to Rs. 4.29 billion in fiscal 2005 from Rs. 5.79 billion in fiscal 2004.During fiscal 2005, we had transferred investments amounting to Rs. 213.5 billion from available for salecategory to held to maturity category in accordance with the Reserve Bank of India guidelines. The differencebetween the book value of each investment and the lower of its acquisition cost and market value on the date oftransfer, amounting to Rs. 1.83 billion is included in the provision on investments. In addition, provision oninvestments was high in fiscal 2005 on account of higher amount of amortization of premium on governmentsecurities classified in the held to maturity category. We wrote back a provision on loan losses of Rs. 1.21 billionin fiscal 2005 as compared to a provision of Rs. 4.59 billion in fiscal 2004 primarily due to lower additions tonon-performing assets and release of excess provisions in fiscal 2005.
56

Tax Expense
The following table sets forth, for the periods indicated, details of tax expense computation.
Year ended March 31,
2004 2005
(in millions)
Tax at marginal rate on income . . . . . . . . . . . . . . . . . . . . . . . . . . . . . . . . . . . . . . . Rs. 6,815.6 Rs. 9,326.7Adjustments
Difference in book and tax depreciation . . . . . . . . . . . . . . . . . . . . . . . . . . . . . . 495.8 1,800.0Bad debts written off . . . . . . . . . . . . . . . . . . . . . . . . . . . . . . . . . . . . . . . . . . . . . 1,241.9 (13,839.5)Surplus on sale of property/assets . . . . . . . . . . . . . . . . . . . . . . . . . . . . . . . . . . . 18.5 20.8Dividend, exempt interest and other income . . . . . . . . . . . . . . . . . . . . . . . . . . . (2,876.6) (3,240.0)Capital gains on sale of shares . . . . . . . . . . . . . . . . . . . . . . . . . . . . . . . . . . . . . . (4,013.4) (3,940.0)Fair value utilization . . . . . . . . . . . . . . . . . . . . . . . . . . . . . . . . . . . . . . . . . . . . . (8,663.8) (2,510.0)Other adjustments . . . . . . . . . . . . . . . . . . . . . . . . . . . . . . . . . . . . . . . . . . . . . . . 1,152.2 1,728.0
Net adjustments . . . . . . . . . . . . . . . . . . . . . . . . . . . . . . . . . . . . . . . . . . . . . . . . . . . . . (12,645.4) (19,980.8)Tax (savings)/outgo thereon—other than capital gains . . . . . . . . . . . . . . . . . . . . . . . (4,536.5) (7,311.5)Capital gains on sale of shares . . . . . . . . . . . . . . . . . . . . . . . . . . . . . . . . . . . . . . . . . . 211.4 204.9Tax (savings)/outgo thereon . . . . . . . . . . . . . . . . . . . . . . . . . . . . . . . . . . . . . . . . . . . (4,325.1) (7,106.6)Add/(less): Deferred taxes and other tax provisions . . . . . . . . . . . . . . . . . . . . . . . . . 136.7 3,059.9
Total income tax . . . . . . . . . . . . . . . . . . . . . . . . . . . . . . . . . . . . . . . . . . . . . . . . . . . . Rs. 2,627.2 5,190.0
Wealth tax . . . . . . . . . . . . . . . . . . . . . . . . . . . . . . . . . . . . . . . . . . . . . . . . . . . . . . . . . 24.0 30.0
Total taxation . . . . . . . . . . . . . . . . . . . . . . . . . . . . . . . . . . . . . . . . . . . . . . . . . . . . . . Rs. 2,651.2 Rs. 5,220.0
Notes:Adjusted profit before taxation . . . . . . . . . . . . . . . . . . . . . . . . . . . . . . . . . . . . . . . . . Rs. 18,998.2 Rs. 25,242.0Marginal rates of tax—other than long-term capital gains . . . . . . . . . . . . . . . . . . . . 35.88% 36.59%Long-term capital gains . . . . . . . . . . . . . . . . . . . . . . . . . . . . . . . . . . . . . . . . . . . . . . . 10.25% 10.46%
Income tax expense (including wealth tax) amounted to Rs. 5.22 billion in fiscal 2005 from Rs. 2.65 billionin fiscal 2004 as the effective tax expense rate increased to 20.7% in fiscal 2005 from 13.9% in fiscal 2004. Theeffective tax expense rate has increased primarily due to higher utilization of fair value provisions againstICICI’s portfolio in fiscal 2004 compared to fiscal 2005.
Financial Condition
Our total assets increased by 33.9% to Rs. 1,676.59 billion at year-end fiscal 2005 from Rs. 1,252.29 billionat year-end fiscal 2004 primarily due to an increase in advances and investments. Net advances increased by45.9% to Rs. 914.05 billion at year-end fiscal 2005 from Rs. 626.48 billion at year-end fiscal 2004 primarily dueto an increase in retail advances in accordance with our strategy to increase our retail asset portfolio, offset, inpart, by a reduction due to repayments and securitization of loans. Total investments at year-end fiscal 2005increased by 16.2% to Rs. 504.87 billion from Rs. 434.36 billion at year-end fiscal 2004 primarily due to a 15.3%increase in investments in government and other approved securities in India to Rs. 344.82 billion at year-endfiscal 2005 from Rs. 299.18 billion at year-end fiscal 2004. Other assets increased by 32.9% to Rs. 87.99 billionat year-end fiscal 2005 from Rs. 66.18 billion at year-end fiscal 2004.
During April 2004, we made a Rs. 32.46 billion offering of equity shares. Our equity share capital andreserves at year-end fiscal 2005 increased by 56.7% to Rs. 125.50 billion from Rs. 80.10 billion (US$ 1.8 billion)at year-end fiscal 2004. Total deposits increased by 46.6% to Rs. 998.19 billion at year-end fiscal 2005 fromRs. 681.09 billion at year-end fiscal 2004. Our savings account deposits increased by 36.1% to Rs. 113.92 billionat year-end fiscal 2005 from Rs. 83.72 billion at year-end fiscal 2004, while other demand deposits increased by
57

76.8% to Rs. 128.37 billion at year-end fiscal 2005 from Rs. 72.59 billion at year-end fiscal 2004. Term depositsincreased by 44.0% to Rs. 755.90 billion at year-end fiscal 2005 from Rs. 524.78 billion at year-end fiscal 2004.Total deposits at year-end fiscal 2005 constituted 70.5% of our funding (i.e., deposits, borrowings andsubordinated debt) compared to 63.1% at year-end fiscal 2004. Borrowings (including subordinated debt)increased to Rs. 417.53 billion at year-end fiscal 2005 from Rs. 398.46 billion at year-end fiscal 2004.
Summary Fiscal 2004 compared to Fiscal 2003
Profit before provisions and tax increased by 79.8% to Rs. 24.81 billion in fiscal 2004 from Rs. 13.80 billion(excluding capital gains on sale of our shares held by ICICI) in fiscal 2003 primarily due to a sharp increase inthe income from treasury related activities by 181.9% to Rs. 14.18 billion in fiscal 2004 from Rs. 5.02 billion infiscal 2003, an increase in net interest income by 45.0% to Rs. 22.93 billion in fiscal 2004 from Rs. 15.81 billionin fiscal 2003 and an increase in commission, exchange and brokerage by 35.4% to Rs. 10.72 billion in fiscal2004 from Rs. 7.92 billion in fiscal 2003, offset, in part, by an increase in non-interest expenses by 32.6% toRs. 28.76 billion in fiscal 2004 from Rs. 21.69 billion in fiscal 2003. After considering provisions and tax, profitafter tax increased by 35.7% to Rs. 16.37 billion in fiscal 2004 from Rs. 12.06 billion in fiscal 2003.
In accordance with the Scheme of Amalgamation, 101.4 million of our shares held by ICICI had beentransferred to the ICICI Bank Shares Trust. During fiscal 2003, the ICICI Bank Shares Trust divested itsshareholding in us at an average price of approximately Rs. 130 per share (the average acquisition cost of ICICIbeing approximately Rs. 12.27 per share), resulting in capital gains of Rs. 11.91 billion.
Net interest income increased by 45.0% to Rs. 22.93 billion in fiscal 2004 from Rs. 15.81 billion in fiscal2003, reflecting an increase of 7.9% in the average volume of interest-earning assets and an increase in spread by0.9% to 2.4%. Effective April 1, 2006, the commissions paid to direct marketing agency expenses or associatesin connection with sourcing our automobile loans accounted for on an upfront basis have been included undernon-interest expense. The interest income in fiscal 2004 and fiscal 2003 does not include these commissions as ithas been regrouped as non-interest expense.
Commission, exchange and brokerage increased by 35.4% to Rs. 10.72 billion in fiscal 2004 from Rs. 7.92billion in fiscal 2003, primarily due to growth in retail banking fee income arising from retail asset products likehome loans and credit cards and retail liability related income such as account servicing charges as well as anincrease in transaction banking fee income from corporate clients.
Income from treasury-related activities increased sharply by 181.9% to Rs. 14.18 billion in fiscal 2004 fromRs. 5.02 billion in fiscal 2003 primarily due to an increase in the profit on sale of investments to Rs. 12.25 billionin fiscal 2004 from Rs. 4.92 billion in fiscal 2003.
Non-interest expenses increased by 32.6% to Rs. 28.76 billion in fiscal 2004 from Rs. 21.69 billion in fiscal2003 primarily due to a 35.5% increase in employee expenses.
Provisions and contingencies (excluding tax provisions) decreased by 67.7% to Rs. 5.79 billion in fiscal2004 from Rs. 17.91 billion in fiscal 2003 primarily due to higher additional/accelerated provisions made onICICI’s portfolio in fiscal 2003.
Total assets increased by 17.2% to Rs. 1,252.29 billion at year-end fiscal 2004 from Rs. 1,068.12 billion atyear-end fiscal 2003.
58

Net Interest Income
Net interest income increased by 45.0% to Rs. 22.93 billion in fiscal 2004 from Rs. 15.81 billion in fiscal2003, reflecting mainly the following:
• an increase of Rs. 71.94 billion or 7.9% in the average volume of interest-earning assets; and
• an increase in the spread by 0.9% to 2.4% in fiscal 2004 from 1.5% in fiscal 2003.
The average volume of interest-earning assets increased by Rs. 71.94 billion in fiscal 2004 primarily due tothe increase in average advances by Rs. 65.14 billion, and an increase in average investments and other averageinterest-earning assets by Rs. 6.80 billion. The increase in the average advances was mainly due to increaseddisbursements of retail finance loans, offset, in part, by securitization of loans and repayment of existing loans.
While both interest income and interest expense declined in line with the declining interest rate trend in themarket, interest expense declined more sharply than interest income. Effective April 1, 2006, the commissionspaid to direct marketing agents or associates in connection with sourcing of our automobile loans accounted foron an upfront basis have been included under non-interest expense. The interest income in fiscal 2004 and fiscal2003 does not include these commissions as it has been regrouped as non-interest expense. Total interest incomedecreased by 2.3% to Rs. 93.08 billion in fiscal 2004 from Rs. 95.25 billion in fiscal 2003 primarily due to adecline in the yield on average interest-earning assets. Yield on average interest-earning assets decreased by0.9% to 9.5% in fiscal 2004 compared to 10.4% in fiscal 2003, primarily due to the decline in the yield oninvestments and advances. While the yield on average advances declined by 1.1% to 11.2% in fiscal 2004, theyield on average investments declined by 1.4% to 7.6% in fiscal 2004.
Total interest expense decreased by 11.7% to Rs. 70.15 billion in fiscal 2004 from Rs. 79.44 billion in fiscal2003, primarily due to a decline in the cost of funds to 7.1% for fiscal 2004 from 8.9% in fiscal 2003, offset, inpart by an increase of 11.0% in the volume of average interest-bearing liabilities to Rs. 989.66 billion for fiscal2004. Cost of funds decreased primarily due to the impact of repayment of the higher cost borrowings of ICICIacquired on amalgamation and due to the reduction in the cost of deposits to 5.4% in fiscal 2004 from 6.8% infiscal 2003. Total deposits at year-end fiscal 2004 constituted 63.1% of our funding (i.e., deposits, borrowingsand subordinated debts) compared to 52.2% at year-end fiscal 2003.
As a result of the 1.8% decline in the cost of funds, offset, in part by a 0.9% decline in yield on averageinterest-earning assets, net interest margin increased to 2.3% for fiscal 2004 from 1.7% for fiscal 2003.
Non-Interest Income
The following table sets forth, for the periods indicated, the principal components of our non-interestincome.
Year ended March 31,
2003 2004 % change
(in millions, except percentages)
Commission, exchange and brokerage . . . . . . . . . . . . . . . . . . . . . . . . . . . . Rs. 7,917.9 Rs.10,718.0 35.4Income from treasury-related activities . . . . . . . . . . . . . . . . . . . . . . . . . . . 5,026.8 14,172.6 181.9Lease income . . . . . . . . . . . . . . . . . . . . . . . . . . . . . . . . . . . . . . . . . . . . . . . 5,374.2 4,210.7 (21.6)Other income(1) . . . . . . . . . . . . . . . . . . . . . . . . . . . . . . . . . . . . . . . . . . . . . . 1,358.8 1,547.9 13.9
Total non-interest income . . . . . . . . . . . . . . . . . . . . . . . . . . . . . . . . . . . . Rs.19,677.7 Rs.30,649.2 55.8
(1) Excludes capital gains of Rs. 11.91 billion realized during fiscal 2003 on our sale of shares held by ICICI,which were transferred to the ICICI Bank Shares Trust pursuant to the Scheme of Amalgamation.
For the purpose of analysis below, total non-interest income excludes capital gains of Rs. 11.91 billion infiscal 2003 realized on the sale of our shares held by ICICI which were transferred to a trust at the time ofamalgamation.
59

Non-interest income increased by 55.8% to Rs. 30.65 billion in fiscal 2004 from Rs. 19.68 billion in fiscal2003 primarily due to an increase of 35.4% in commission, exchange and brokerage, a 181.9% increase inincome from treasury-related activities and an increase of 13.0% in other income.
The increase in commission, exchange and brokerage by 35.4% to Rs. 10.72 billion in fiscal 2004 fromRs. 7.92 billion in fiscal 2003 was primarily due to growth in retail banking fee income arising from retail assetproducts such as home loans and credit cards and retail liability related income such as account servicingcharges.
The total income from treasury-related activities increased to Rs. 14.18 billion in fiscal 2004 from Rs. 5.02billion in fiscal 2003 was due to the increase in trading profits on government securities and corporate debtsecurities as a result of the declining interest rate environment. Income from treasury related activity includesincome from derivatives reflecting primarily the transactions undertaken with customers by us and income fromthe merchant foreign exchange transactions.
Lease income decreased by 21.6% to Rs. 4.21 billion in fiscal 2004 from Rs. 5.37 billion in fiscal 2003primarily because of a decrease in leased assets to Rs. 16.63 billion at year-end fiscal 2004 compared toRs. 17.70 billion at year-end fiscal 2003.
Other income increased by 13.9% to Rs. 1.54 billion for fiscal 2004 compared to Rs. 1.37 billion for fiscal2003. Other income includes loss of Rs. 19.1 million on sale of land, buildings and other assets for fiscal 2004compared to loss of Rs. 65.0 million for fiscal 2003. It also includes income earned by way of dividend fromsubsidiaries of Rs. 1.26 billion for fiscal 2004 compared to Rs. 1.09 billion for fiscal 2003.
Non-interest Expense
The following table sets forth, for the periods indicated, the principal components of non-interest expense.
Year ended March 31,
2003 2004 % change
(in millions, except percentages)
Employee expenses . . . . . . . . . . . . . . . . . . . . . . . . . . . . . . . . . . . . . . . . . . . Rs. 4,030.3 Rs. 5,460.6 35.5Depreciation on own property (including non-banking assets) . . . . . . . . . 1,914.7 2,609.3 36.3Auditors’ fees and expenses . . . . . . . . . . . . . . . . . . . . . . . . . . . . . . . . . . . . 15.0 16.8 12.0Other administrative expenditure . . . . . . . . . . . . . . . . . . . . . . . . . . . . . . . . 9,389.1 11,903.5 26.8
Total non-interest expense (excluding lease depreciation and directmarketing agency expenses) . . . . . . . . . . . . . . . . . . . . . . . . . . . . . . . . 15,349.1 19,990.2 30.2
Depreciation (including lease equalization ) on leased assets . . . . . . . . . . 3,144.7 2,785.1 (11.4)Direct marketing agency expenses . . . . . . . . . . . . . . . . . . . . . . . . . . . . . . . 3,192.1 5,999.5 87.9
Total non-interest expense . . . . . . . . . . . . . . . . . . . . . . . . . . . . . . . . . . . Rs.21,685.9 Rs.28,774.8 32.7
Non-interest expense (excluding direct marketing agency expense and lease depreciation) increased by30.2% to Rs. 19.98 billion in fiscal 2004 from Rs. 15.35 billion in fiscal 2003, primarily due to an increase inemployee expenses by 35.5% to Rs. 5.46 billion in fiscal 2004 from Rs. 4.03 billion for fiscal 2003 as a result ofan increase in the number of employees. Depreciation on owned property increased by 36.3% to Rs. 2.61 billionfrom Rs. 1.91 billion. There was an increase in premises and other fixed assets to Rs. 23.93 billion at year-endfiscal 2004 from Rs. 22.91 billion at year-end fiscal 2003. Depreciation on leased assets decreased to Rs. 2.79billion for fiscal 2004 from Rs. 3.15 billion for fiscal 2003.
Other administrative expenses increased by 26.8% to Rs. 11.90 billion in fiscal 2004 from Rs. 9.39 billion infiscal 2003 primarily due to the increased cost of business, particularly in retail including the maintenance ofATMs, credit card expenses, call centre expenses and technology expenses.
60

Direct marketing agency expenses increased by 87.9% to Rs. 6.00 billion in fiscal 2004 from Rs. 3.19billion in fiscal 2003 primarily due to growth in our retail business. Effective April 1, 2006, the commissionspaid to direct marketing agent or associates in connection with sourcing our automobile loans accounted for onan upfront basis have been included under non-interest expense. The interest income in fiscal 2004 and fiscal2003 does not include these commissions as it has been regrouped as non-interest expense.
Provisions and contingencies
The following table sets forth, for the periods indicated, the components of provisions and contingencies.
Year ended March 31,
2003 2004 % change
(in millions, except percentages)Provision for investments (including credit substitutes (net) . . . . . . . . . . . . Rs. 3,094.3 Rs. 987.1 (68.1)Provision for non-performing assets (including provision for standard
assets) . . . . . . . . . . . . . . . . . . . . . . . . . . . . . . . . . . . . . . . . . . . . . . . . . . . . 14,749.8 4,591.2 (68.9)Others . . . . . . . . . . . . . . . . . . . . . . . . . . . . . . . . . . . . . . . . . . . . . . . . . . . . . . 63.9 207.9 225.4
Total provisions . . . . . . . . . . . . . . . . . . . . . . . . . . . . . . . . . . . . . . . . . . . . . Rs.17,908.0 Rs.5,786.2 (67.7)
Depreciation of investments and provision for non-performing assets in fiscal 2003 included additional/accelerated provisions and write-offs against loans and investments of erstwhile ICICI. As a result, the totalprovisions including provisions on non-performing assets and depreciation on investments decreased by 67.7% toRs. 5.79 billion in fiscal 2004 compared to Rs. 17.91 billion in fiscal 2003.
Income Tax Expense
The following table sets forth, for the periods indicated, details of our tax expense computation.
Year ended March 31,
2003 2004
(in millions)Tax at marginal rate on income . . . . . . . . . . . . . . . . . . . . . . . . . . . . . . . . . . . . . . Rs. 2,859.7 Rs. 6,815.6
AdjustmentsDifference in book and tax depreciation . . . . . . . . . . . . . . . . . . . . . . . . . . (170.0) 495.8Bad debts written off . . . . . . . . . . . . . . . . . . . . . . . . . . . . . . . . . . . . . . . . . 16,824.0 1,241.9Surplus on sale of property/assets . . . . . . . . . . . . . . . . . . . . . . . . . . . . . . . 70.0 18.5Dividend, exempt interest and other income . . . . . . . . . . . . . . . . . . . . . . . (710.0) (2,876.6)Dividend exempt under Section 80M . . . . . . . . . . . . . . . . . . . . . . . . . . . . (1,830.0) —Capital gains on sale of shares . . . . . . . . . . . . . . . . . . . . . . . . . . . . . . . . . . (12,910.0) (4,013.4)Fair value utilization . . . . . . . . . . . . . . . . . . . . . . . . . . . . . . . . . . . . . . . . . (11,830.0) (8,663.8)Other adjustments . . . . . . . . . . . . . . . . . . . . . . . . . . . . . . . . . . . . . . . . . . . 5,010.0 1,152.2
Net adjustments . . . . . . . . . . . . . . . . . . . . . . . . . . . . . . . . . . . . . . . . . . . . . . . . . . . . . (5,546.0) (12,645.4)Tax (savings)/outgo thereon—other than capital gains . . . . . . . . . . . . . . . . . . . . . . . (2,038.2) (4,536.5)Capital gains on sale of shares . . . . . . . . . . . . . . . . . . . . . . . . . . . . . . . . . . . . . . . . . . 910.0 211.4
Tax (savings)/outgo thereon . . . . . . . . . . . . . . . . . . . . . . . . . . . . . . . . . . . . . . . . . . . (1,128.2) (4,325.1)Deferred taxes and other tax provisions . . . . . . . . . . . . . . . . . . . . . . . . . . . . . . . . . . (6,011.4) 136.7
Total income tax . . . . . . . . . . . . . . . . . . . . . . . . . . . . . . . . . . . . . . . . . . . . . . . . . . . Rs. (4,279.9) Rs. 2,627.2Wealth tax . . . . . . . . . . . . . . . . . . . . . . . . . . . . . . . . . . . . . . . . . . . . . . . . . . . . . . . . . 22.5 24.0Total taxation . . . . . . . . . . . . . . . . . . . . . . . . . . . . . . . . . . . . . . . . . . . . . . . . . . . . . Rs. (4,257.4) Rs. 2,651.2
Notes:Adjusted profit before taxation . . . . . . . . . . . . . . . . . . . . . . . . . . . . . . . . . . . . . . . . . Rs. 7,781.4 Rs. 18,998.2Marginal rates of tax—other than long-term capital gains . . . . . . . . . . . . . . . . . . . . 36.75% 35.88%Long-term capital gains . . . . . . . . . . . . . . . . . . . . . . . . . . . . . . . . . . . . . . . . . . . . . . . 10.50% 10.25%
61

Income tax expense (including wealth tax) was Rs. 2.65 billion for fiscal 2004. We had an effective income taxbenefit for fiscal 2003 due to a deferred tax asset created on additional/accelerated provisions made during the year.Accordingly, income tax expense (including wealth tax) was a net credit of Rs. 4.26 billion for fiscal 2003. The netcredit in fiscal 2003 was on account of a deferred tax asset of Rs. 6.43 billion for fiscal 2003 compared to Rs.68.8 million for fiscal 2004, arising primarily out of provisions for loan losses made in fiscal 2003.
Financial Condition
Our total assets increased by 17.2% to Rs. 1,252.29 billion at year-end fiscal 2004 from Rs. 1,068.12 billionat year-end fiscal 2003. Net advances increased by 17.6% to Rs. 626.48 billion at year-end fiscal 2004 fromRs. 532.79 billion at year-end fiscal 2003 primarily due to an increase in retail advances, offset, in part by areduction in advances due to repayments and securitization of loans. Cash, balances with the Reserve Bank ofIndia and banks and money at call and short notice at year-end fiscal 2004 were Rs. 84.71 billion compared toRs. 64.89 billion at year-end fiscal 2003. Total investments at year-end fiscal 2004 increased to Rs. 434.36billion compared to Rs. 354.62 billion at year-end fiscal 2003. Other assets decreased to Rs. 66.18 billion atyear-end fiscal 2004 from Rs. 75.21 billion at year-end fiscal 2003.
Our equity share capital and reserves at year-end fiscal 2004 increased by 15.5% to Rs. 80.10 billion fromRs. 69.34 billion at year-end fiscal 2003. Total deposits increased by 41.4% to Rs. 681.09 billion at year-endfiscal 2004 from Rs. 481.69 billion at year-end fiscal 2003. Our savings account deposits increased to Rs. 83.72billion at year-end fiscal 2004 from Rs. 37.93 billion at year-end fiscal 2003, while other demand depositsincreased to Rs. 72.59 billion at year-end fiscal 2004 from Rs. 36.89 billion at year-end fiscal 2003. Termdeposits increased by 29.0% to Rs. 524.78 billion at year-end fiscal 2004 from Rs. 406.87 billion at year-endfiscal 2003. Total deposits at year-end fiscal 2004 constituted 63.1% of our funding (i.e., deposit, borrowings andsubordinated debts). Borrowings (including subordinated debt) decreased to Rs. 398.46 billion at year-end fiscal2004 from Rs. 440.52 billion at year-end fiscal 2003.
Off Balance Sheet Items
The table below sets forth, for the periods indicated, the principal components of contingent liabilities.
At March 31, At September 30,
2002 2003 2004 2005 2006 2006 2006
(Rupees in billions)(US$ inbillions)
Contingent liabilitiesClaims against bank not
acknowledged as debts . . . . . . Rs. 10.23 Rs. 20.25 Rs. 25.02 Rs. 27.46 Rs. 29.78 Rs. 36.89 US$ 0.8Liability for partly paid
investments . . . . . . . . . . . . . . . 2.62 1.80 1.24 0.17 0.17 0.17 —Liability on account of
outstanding forward exchangecontracts . . . . . . . . . . . . . . . . . 152.55 251.03 557.04 714.85 918.32 1,081.25 23.6
Guarantees given on behalf ofconstituents . . . . . . . . . . . . . . . 93.52 106.35 120.29 156.41 191.03 213.44 4.7
Acceptances, endorsements &other obligations . . . . . . . . . . . 17.39 43.25 65.14 74.12 106.87 138.36 3.0
Currency swaps . . . . . . . . . . . . . . 20.41 29.01 44.49 112.96 172.42 230.78 5.0Interest rate swaps and currency
options(1) . . . . . . . . . . . . . . . . . 78.54 413.54 1,177.64 1,519.22 2,471.92 2,859.58 62.2Other items for which bank is
contingently liable . . . . . . . . . . 19.21 29.14 38.56 76.35 59.84 93.11 2.0
Total . . . . . . . . . . . . . . . . . . . . . . Rs.394.47 Rs.894.37 Rs.2,029.42 Rs.2,681.54 Rs.3,950.35 Rs.4,653.58 US$101.3
(1) Represents notional principal amount.
62

Contingent liabilities increased by 49.6% or Rs. 1,543.73 billion (US$ 33.6 billion) to Rs. 4,653.58 billion(US$ 101.3 billion) at September 30, 2006 from Rs. 3,109.85 billion (US$ 67.7 billion) at September 30, 2005primarily due to a 54.2% increase in interest rate swaps and currency options. Contingent liabilities increased by47.3% to Rs. 3,950.34 billion (US$ 86.0 billion) at year-end fiscal 2006 from Rs. 2,681.54 billion (US$ 58.4billion) at year-end fiscal 2005 primarily due to a 62.7% increase in interest rate swaps and currency options. Thecredit exposure on currency derivatives as on March 31, 2006 amounts to Rs. 21.46 billion (US$ 467 million)and on interest rate derivatives amounts to Rs. 28.17 billion (US$ 613 million), and as on September 30, 2006amounts to Rs 30.58 billion (US$ 666 million) for currency derivatives and to Rs. 27.56 billion (US$ 600million) for interest rate derivatives.
Our contingent liabilities have been steadily increasing over the period from fiscal 2002. This increase isprimarily due to the increase in foreign exchange and derivative transactions. The swap and forward exchangecontract market in India is a developing market. Market volumes have increased significantly in recent years. Asan active player and market-maker in swap and forward exchange contract markets and due to the fact thatreduction in positions is generally achieved by entering into offsetting transactions rather than termination/cancellation of existing transactions, we have seen substantial increase in notional principal of our swap portfolioin recent years.
An interest rate swap does not entail exchange of notional principal and the cash flow arises on account of thedifference between interest rate pay and receive legs of the swaps which is generally much smaller than the notionalprincipal of the swap. A large proportion of interest rate swap, currency swap and forward exchange contracts is onaccount of market making which involves providing regular two-way prices to customers or inter-bank counterparties. The exposure due to these transactions is normally reduced by entering into an off-setting transaction withanother counter-party. This results in generation of a higher number of outstanding transactions, and hence a largevalue of gross notional principal of the portfolio. For example, if a transaction entered into with a customer iscovered by an exactly opposite transaction entered into with another counter-party, the net market risk of the twotransactions will be zero whereas, the notional principal of the portfolio will be sum of both the transactions.
Claims against the Bank not acknowledged as debts represent demands made by the government of India’stax authorities in excess of the provisions made in our accounts, in respect of income tax, interest tax, wealth taxand sales tax related matters.
Capital Resources
At March 31 At September 30
2005 2006 2005 2006 2006
(Rupees in millions, except percentages)(US$ in
millions)Tier I . . . . . . . . . . . . . . . . . . . . Rs. 102,463.2 Rs. 191,815.3 Rs. 108,317.5 Rs. 219,203.3 US$ 4,770Tier II . . . . . . . . . . . . . . . . . . . 56,566.1 86,610.9 64,120.2 115,824.9 2,521
Total Capital . . . . . . . . . . . . . . 159,029.3 278,426.2 172,437.7 335,028.2 7,291
On-balance sheet riskweighted assets . . . . . . . . . . 1,080,527.9 1,557,235.6 1,251,430.7 1,721,165.1 37,457
Off-balance sheet riskweighted . . . . . . . . . . . . . . . 269,640.2 528,700.3 244,985.5 615,833.1 13,402
Total risk weighted assets . . . Rs.1,350,168.1 Rs.2,085,935.9 Rs.1,496,416.2 Rs.2,336,998.2 US$50,859
Tier I capital adequacyratio . . . . . . . . . . . . . . . . . . . 7.59% 9.20% 7.24% 9.38%
Tier II capital adequacyratio . . . . . . . . . . . . . . . . . . . 4.19% 4.15% 4.28% 4.96%
Total capital adequacyratio . . . . . . . . . . . . . . . . . . . 11.78% 13.35% 11.52% 14.34%
63

Our total capital adequacy at September 30, 2006 was 14.34%, including Tier-I capital adequacy of 9.38%and Tier-II capital adequacy of 4.96%. In accordance with the Reserve Bank of India guidelines, the risk-weighted assets at September 30, 2006 include home loans to individuals at a risk weightage of 75%, otherconsumer loans and capital market exposure at a risk weightage of 125%. Commercial real estate exposure andinvestments in venture capital funds have been considered at a risk weightage of 150%. The risk-weighted assetsat March 31, 2006 and September 30, 2006 also include the impact of capital requirement for market risk on theheld for trading and available for sale portfolio.
Reserve Bank of India issued guidelines in October, 2005 permitting banks that have maintained capital ofat least 9.0% of the risk-weighted assets for credit risk and market risk for held for trading and available for salecategories of investments at September 30, 2006, to transfer the balance in the investment fluctuation reserve‘below the line’ in the profit and loss appropriation account to statutory reserve, general reserve or balance ofprofit & loss account. Pursuant to the above, the entire balance in investment fluctuation reserve at year-endfiscal, 2006, of Rs. 13.20 billion (US$ 287 million) was transferred to revenue and other reserves and henceconsidered in the Tier-I capital.
For all securitization deals executed subsequent to February 1, 2006, capital requirement has beenconsidered in accordance with the Reserve Bank of India guidelines issued in this regard on February 1, 2006.Deferred tax asset of Rs. 2.29 billion (US$ 49.8 million) and unamortized expense of Rs. 0.69 billion (US$ 15.0million) on account of the early retirement option in 2003 has also been reduced from Tier-I capital. Inaccordance with Reserve Bank of India guidelines, Tier-I capital includes Rs. 1.45 billion out of the face value ofRs. 3.50 billion of 20 year non-cumulative preference shares issued to ITC Limited as a part of the scheme formerger of ITC Classic Finance Limited with ICICI. In January 2006, the Reserve Bank of India issued guidelinespermitting banks to issue perpetual debt with a call option after not less than 10 years, to be exercised with itsprior approval, for inclusion in Tier I capital up to a maximum of 15% of total Tier I capital, The Reserve Bankof India also permitted banks to issue debt instruments with a minimum maturity of 15 years and a call optionafter not less than 10 years, to be exercised with its prior approval, for inclusion in Tier II capital.
In February 2005, the Reserve Bank of India issued draft guidelines for the implementation of the revisedcapital adequacy framework of the Basel Committee. These draft guidelines, which are proposed to be effectivefrom April 1, 2006, specify that all banks in India will adopt the standardized approach for credit risk and thebasic indicator approach for operational risk. These guidelines will be effective from March 31, 2008. Afteradequate expertise has been developed, both at the banks and at the supervisory levels, some banks may beallowed to migrate to the internal ratings based approach after obtaining the approval of the Reserve Bank ofIndia. The guidelines also prescribe a 75.0% risk weight for retail credit exposures, differential risk weights forother credit exposures linked to their credit rating, and a capital charge for operational risk based on a factor of15.0% of the sum of a bank’s net interest income and non-interest income (excluding extraordinary income).
Capital Commitments
We are obligated under a number of capital contracts. Capital contracts are job orders of a capital naturewhich have been committed. As of the balance sheet date, work had not been completed to this extent. Estimatedamounts of contracts remaining to be executed on capital account aggregated Rs. 1.13 billion (US$ 25 million) atSeptember 30, 2006 as compared to Rs. 1.64 billion (US$ 36 million) at September 30, 2005.
Guarantees
As a part of our project financing and commercial banking activities, we have issued guarantees to enhancethe credit standing of our customers. These generally represent irrevocable assurances that we will makepayments in the event that the customer fails to fulfill its financial or performance obligations. Financialguarantees are obligations to pay a third party beneficiary where a customer fails to make payment towards aspecified financial obligation. Performance guarantees are obligations to pay a third party beneficiary where acustomer fails to perform a non-financial contractual obligation. The guarantees are generally for a period not
64

exceeding 10 years. The credit risks associated with these products, as well as the operating risks, are similar tothose relating to other types of financial instruments. We have collateral available to reimburse potential losseson the guarantees. Margins available to reimburse losses realized under guarantees amounted to Rs. 25.08 billion(US$ 546 million) at September 30, 2006, Rs. 7.32 billion (US$ 159 million) at September 30, 2005, Rs. 10.29billion (US$ 224 million) at year-end fiscal 2006 and Rs. 4.06 billion (US$ 88 million) at year-end fiscal 2005.Other property or security may also be available to us to cover losses under guarantees.
2005At September 30,
2006 2006
(Rupees in billions, except percentages) (US$ in billions)
Financial guarantees . . . . . . . . . . . . . . . . . . . . . . . . . . . . . . . . Rs. 54.73 Rs. 68.77 US$1.5Performance guarantees . . . . . . . . . . . . . . . . . . . . . . . . . . . . . . 114.34 144.67 3.2
Total guarantees . . . . . . . . . . . . . . . . . . . . . . . . . . . . . . . . . . Rs.169.07 Rs.213.44 US$4.7
2005At March 31,
2006 2006
(Rupees in billions, except percentages) (US$ in billions)
Financial guarantees . . . . . . . . . . . . . . . . . . . . . . . . . . . . . . . . Rs. 58.00 Rs. 61.65 US$1.3Performance guarantees . . . . . . . . . . . . . . . . . . . . . . . . . . . . . . 98.41 129.38 2.8
Total guarantees . . . . . . . . . . . . . . . . . . . . . . . . . . . . . . . . . . . Rs.156.41 Rs.191.03 US$4.1
Significant changes in accounting policies
There has been no significant change in our accounting policies in the last years except the following:
• During fiscal 2003, we changed our method of accounting for repurchase transactions and reverserepurchase transactions. These transactions have been accounted for as a sale and forward purchase orpurchase and a forward sale transactions in fiscal 2003.
• Effective April 1, 2004, we account for unrealized gains on rupee derivatives (net of provisions) ascompared to our earlier policy of ignoring such unrealized gains.
• Effective April 1, 2005, we have aligned our accounting policy for subvention income with ouraccounting policy for direct marketing agency/associate expenses. Accordingly, subvention income hasbeen accounted for in the period in which it is received instead of over the period of the loan.
We follow guidelines on accounting issued by the Reserve Bank of India from time to time.
Capital Expenditure
The following tables set forth, for the periods indicated, certain information related to capital expenditure bycategory of fixed assets.
Cost atApril 1, 2006 Additions Deletion
Accumulateddepreciation
Net assets atSeptember 30, 2006
(Rupees in billions) (US$ in millions)
Premises . . . . . . . . . . . . . . . . . . . . . . . . . . . Rs.20.20 Rs.0.47 Rs.0.10 Rs. 2.34 Rs.18.23 US$397Other fixed assets . . . . . . . . . . . . . . . . . . . . 20.53 2.05 0.31 11.80 10.47 228Assets on lease . . . . . . . . . . . . . . . . . . . . . . 18.95 0.00 0.75 7.67 10.53 229
Total . . . . . . . . . . . . . . . . . . . . . . . . . . . . . Rs.59.68 Rs.2.52 Rs.1.16 Rs.21.81 Rs.39.23 US$854
65
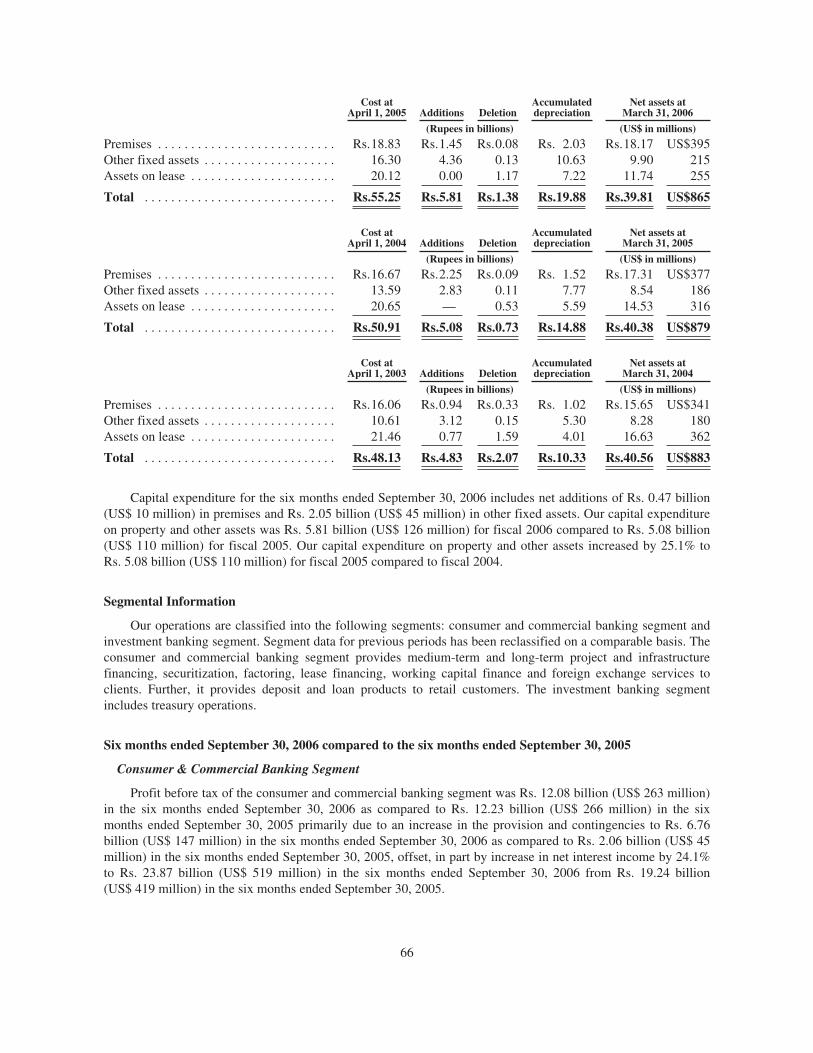
Cost atApril 1, 2005 Additions Deletion
Accumulateddepreciation
Net assets atMarch 31, 2006
(Rupees in billions) (US$ in millions)
Premises . . . . . . . . . . . . . . . . . . . . . . . . . . . Rs.18.83 Rs.1.45 Rs.0.08 Rs. 2.03 Rs.18.17 US$395Other fixed assets . . . . . . . . . . . . . . . . . . . . 16.30 4.36 0.13 10.63 9.90 215Assets on lease . . . . . . . . . . . . . . . . . . . . . . 20.12 0.00 1.17 7.22 11.74 255
Total . . . . . . . . . . . . . . . . . . . . . . . . . . . . . Rs.55.25 Rs.5.81 Rs.1.38 Rs.19.88 Rs.39.81 US$865
Cost atApril 1, 2004 Additions Deletion
Accumulateddepreciation
Net assets atMarch 31, 2005
(Rupees in billions) (US$ in millions)
Premises . . . . . . . . . . . . . . . . . . . . . . . . . . . Rs.16.67 Rs.2.25 Rs.0.09 Rs. 1.52 Rs.17.31 US$377Other fixed assets . . . . . . . . . . . . . . . . . . . . 13.59 2.83 0.11 7.77 8.54 186Assets on lease . . . . . . . . . . . . . . . . . . . . . . 20.65 — 0.53 5.59 14.53 316
Total . . . . . . . . . . . . . . . . . . . . . . . . . . . . . Rs.50.91 Rs.5.08 Rs.0.73 Rs.14.88 Rs.40.38 US$879
Cost atApril 1, 2003 Additions Deletion
Accumulateddepreciation
Net assets atMarch 31, 2004
(Rupees in billions) (US$ in millions)
Premises . . . . . . . . . . . . . . . . . . . . . . . . . . . Rs.16.06 Rs.0.94 Rs.0.33 Rs. 1.02 Rs.15.65 US$341Other fixed assets . . . . . . . . . . . . . . . . . . . . 10.61 3.12 0.15 5.30 8.28 180Assets on lease . . . . . . . . . . . . . . . . . . . . . . 21.46 0.77 1.59 4.01 16.63 362
Total . . . . . . . . . . . . . . . . . . . . . . . . . . . . . Rs.48.13 Rs.4.83 Rs.2.07 Rs.10.33 Rs.40.56 US$883
Capital expenditure for the six months ended September 30, 2006 includes net additions of Rs. 0.47 billion(US$ 10 million) in premises and Rs. 2.05 billion (US$ 45 million) in other fixed assets. Our capital expenditureon property and other assets was Rs. 5.81 billion (US$ 126 million) for fiscal 2006 compared to Rs. 5.08 billion(US$ 110 million) for fiscal 2005. Our capital expenditure on property and other assets increased by 25.1% toRs. 5.08 billion (US$ 110 million) for fiscal 2005 compared to fiscal 2004.
Segmental Information
Our operations are classified into the following segments: consumer and commercial banking segment andinvestment banking segment. Segment data for previous periods has been reclassified on a comparable basis. Theconsumer and commercial banking segment provides medium-term and long-term project and infrastructurefinancing, securitization, factoring, lease financing, working capital finance and foreign exchange services toclients. Further, it provides deposit and loan products to retail customers. The investment banking segmentincludes treasury operations.
Six months ended September 30, 2006 compared to the six months ended September 30, 2005
Consumer & Commercial Banking Segment
Profit before tax of the consumer and commercial banking segment was Rs. 12.08 billion (US$ 263 million)in the six months ended September 30, 2006 as compared to Rs. 12.23 billion (US$ 266 million) in the sixmonths ended September 30, 2005 primarily due to an increase in the provision and contingencies to Rs. 6.76billion (US$ 147 million) in the six months ended September 30, 2006 as compared to Rs. 2.06 billion (US$ 45million) in the six months ended September 30, 2005, offset, in part by increase in net interest income by 24.1%to Rs. 23.87 billion (US$ 519 million) in the six months ended September 30, 2006 from Rs. 19.24 billion(US$ 419 million) in the six months ended September 30, 2005.
66

Net interest income, increased by 24.1% to Rs. 23.87 billion (US$ 519 million) in the six months endedSeptember 30, 2006 from Rs. 19.24 billion (US$ 419 million) in the six months ended September 30, 2005,primarily due to an increase in the interest income on advances and investments, offset, in part, by an increase inthe interest expense on deposits.
We use marketing agents, called direct marketing agents or associates, for sourcing our automobile loans.Until the year ended March 31, 2006, we deducted commission paid to direct marketing agents of automobileloans from the interest income. For the period ended September 30, 2006, we reported all direct marketingagency expenses, on automobile loans and other retail loans, separately under “Non-interest expense”. Thesecommissions are expensed upfront and not amortised over the life of the loan. The necessary reclassificationshave been made in the income statement for the period ended September 30, 2005.
Non-interest income increased by 49.7% to Rs. 23.28 billion (US$ 507 million) in the six months endedSeptember 30, 2006 from Rs. 15.55 billion (US$ 338 million) in the six months ended September 30, 2005primarily due to growth in commission exchange and brokerage income. Commission exchange and brokerageincome increased primarily due to growth in income from retail products and services, including fees arisingfrom retail assets products such as home loans and credit cards and retail liability related income such as accountservicing charges and third party distribution fees. Fees from international business also witnessed a stronggrowth.
Non-interest expense increased by 38.1% to Rs. 28.31 billion (US$ 616 million) in the six months endedSeptember 30, 2006 from Rs. 20.50 billion (US$ 446 million) in the six months ended September 30, 2005,primarily due to an increase in employee expenses enhanced operations and the growth in the retail franchise,including maintenance of ATMs, credit card expenses, call center expenses and technology expenses. Employeeexpenses increased primarily due to an increase in the number of employees, the annual increase in the salariesand to higher costs due to monetization of benefits on loan facilities available to employees at concessional ratesof interests and other employee benefits. The increase in employees was commensurate with the growth in ourretail businesses.
Provisions and contingencies (excluding provisions for tax) in the six months ended September 30, 2006increased to Rs. 6.76 billion (US$ 147 million) compared to Rs. 2.06 billion (US$ 45 million) in the six monthsended September 30, 2005 primarily due to higher provisions created on standard assets, in accordance with therevised guidelines issued by the Reserve Bank of India, higher provision on non performing assets and to a lowerlevel of write-backs.
Under the Reserve Bank of India’s guidelines issued in September 2005, banks were required to makegeneral provisions of 0.4% on standard loans (excluding loans to the agricultural sector and to small and mediumenterprises). Under the Reserve Bank of India’s guidelines issued in May 2006, the general provisioningrequirement for personal loans, loans and advances qualifying as capital market exposure, residential housingloans beyond Rs. 2 million and commercial real estate loans was further increased to 1.0% from the 0.4%. TheReserve Bank of India has allowed banks to create the above additional provisions of 0.6% in a phased manner infiscal 2007.
In accordance with the above guidelines, the standard asset provision in the six months ended September 30,2006 was Rs. 1.3 billion (US$ 28 million) as compared to Rs. 0.4 billion (US$ 9 million) in the six months endedSeptember 30, 2005.
Investment Banking Segment
Profit before tax of the investment banking segment was Rs. 4.63 billion (US$ 101 million) in the sixmonths ended September 30, 2006 compared to Rs. 2.10 billion (US$ 46 million) in the six months endedSeptember 30, 2005 primarily due to an increase in net interest income to Rs. 6.66 billion (US$ 145 million) inthe six months ended September 30, 2006 as compared to Rs. 1.15 billion (US$ 25 million) in the six monthsended September 30, 2005.
67
Net interest income increased to Rs. 6.66 billion (US$ 145 million) in the six months ended September 30,2006 as compared to Rs. 1.15 billion (US$ 25 million) in the six months ended September 30, 2005 primarily dueto an increase in interest earned on investments to Rs. 25.47 billion (US$ 554 million) in the six months endedSeptember 30, 2006 compared to Rs. 15.15 billion (US$ 330 million) in the six months ended September 30,2005, and an increase in interest on inter bank deposits and other interest, offset in part by an increase in intereston inter-bank borrowings.
Non-interest income declined to Rs. 5.20 billion (US$ 113 million) in the six months ended September 30,2006 from Rs. 6.47 billion (US$ 141 million) in the six months ended September 30, 2005 primarily due to lowercapital gains due to the sharp decline in the equity markets in May 2006 and adverse conditions in the debtmarkets.
Non-interest expense increased by 31.2% to Rs. 2.06 billion (US$ 45 million) in the six months endedSeptember 30, 2006 from Rs. 1.57 billion (US$ 34 million) in the six months ended September 30, 2005primarily due to an increase in employee expenses and other administrative expenses.
Provisions increased to Rs. 5.16 billion (US$ 112 million) in the six months ended September 30, 2006compared to Rs. 3.96 billion (US$ 86 million) in the six months ended September 30, 2005. The increase inprovisions reflects the increase in the amount of amortisation of premium on government securities classified inthe held to maturity category.
The amortization of premium on government securities in the six months ended September 30, 2006 wasRs. 5.09 billion (US$ 111 million) as compared to Rs. 3.39 billion (US$ 74 million) in the six months endedSeptember 30, 2005 primarily reflecting an increase of 44.0% in investments in government securities.
Fiscal 2006 compared to Fiscal 2005
Consumer & Commercial Banking Segment
Profit before tax of the consumer and commercial banking segment increased to Rs. 26.55 billion (US$ 578million) in fiscal 2006 from Rs. 18.95 billion (US$ 412 million) in fiscal 2005 primarily due to an increase of50.3% in net interest income.
Net interest income, increased by 50.3% to Rs. 42.73 billion (US$ 930 million) in fiscal 2006 fromRs. 28.43 billion (US$ 619 million) in fiscal 2005, primarily due to an increase in the interest income onadvances and investments and a reduction in the interest expense on borrowings, offset, in part, by an increase inthe interest expense on deposits.
Non-interest income increased by 46.7% to Rs. 37.17 billion (US$ 809 million) in fiscal 2006 fromRs. 25.34 billion (US$ 551 million) in fiscal 2005 primarily due to growth in commission and brokerage income.Commission and brokerage income increased mainly due to growth in credit card related fees and third-partyproduct distribution fees, increase in income from remittances and other fees from international products andservices and growth in fees from corporate customers.
Non-interest expense increased by 35.3% to Rs. 46.03 billion (US$ 1,002 million) in fiscal 2006 fromRs. 34.01 billion (US$ 740 million) in fiscal 2005, primarily due to an increase in employee expenses andenhanced operations and the growth in the retail franchise, including maintenance of ATMs, credit cardexpenses, call centre expenses and technology expenses.
Provisions for contingencies (excluding provisions for tax) in fiscal 2006 was Rs. 7.32 billion (US$ 159 million)compared to Rs. 0.81 billion (US$ 18 million) in fiscal 2005 primarily due to increased provisions on standard assets asper Reserve Bank of India guidelines in fiscal 2006 and a higher level of write-backs in fiscal 2005.
68

Investment Banking Segment
Profit before tax of investment banking segment was Rs. 4.80 billion (US$ 104 million) in fiscal 2006 ascompared to Rs. 6.71 billion (US$ 146 million) in fiscal 2005 primarily due to an increase of 19.2% in netinterest income.
Net interest income increased by 19.2% to Rs. 4.35 billion (US$ 95 million) in fiscal 2006 compared toRs. 3.65 billion (US$ 79 million) in fiscal 2005 mainly due to an 80.4% rise in interest income from governmentsecurities, offset in part by an increase in interest on inter-bank borrowings.
Non-interest income increased by 43.5% to Rs. 12.66 billion (US$ 275 million) in fiscal 2006 from Rs. 8.82billion (US$ 192 million) in fiscal 2005 primarily due to higher capital gains realized on the sale of equityinvestments.
Non-interest expense increased by 57.2% to Rs. 3.60 billion (US$ 78 million) in fiscal 2006 from Rs. 2.29billion (US$ 50 million) in fiscal 2005 primarily due to an increase in employee expenses and otheradministrative expenses.
Provisions increased to Rs. 8.62 billion (US$ 188 million) in fiscal 2006 compared to Rs. 3.47 billion(US$ 75 million) in fiscal 2005. The sharp increase in provisions reflects the increase in the amount ofamortization of premium on government securities.
Consolidated Financials As Per Indian GAAP
The consolidated profit after tax for the six months ended September 30, 2006 was Rs. 13.19 billion(US$ 287 million) and for fiscal 2006 was Rs. 24.20 billion (US$ 527 million) including the results of operationsof our subsidiaries and other consolidating entities. Future bonus provisions and non-amortization of expenses byICICI Prudential Life Insurance Company in line with the insurance company accounting norms had a negativeimpact on the our consolidated profits. Life insurance companies worldwide require five to seven years toachieve break-even, in view of the business set-up and customer acquisition costs in the initial years as well asreserving for actuarial liability. The deficit in the initial years is usually higher for faster growing companies; theprofit streams, after break-even is achieved, are expected to be correspondingly higher.
The following table sets forth, for the periods indicated, the profit/(loss) of the principal subsidiaries ofICICI Bank.
Year ended March 31,
2005 2006 2006
(in billions) (US$ in millions)
ICICI Securities Limited and its subsidiaries . . . . . . . . . . . . . . . . . . . . . . . . Rs. 0.64 Rs. 1.57 US$ 34ICICI Prudential Life Insurance Company Limited . . . . . . . . . . . . . . . . . . . (2.12) (1.88) (41)ICICI Lombard General Insurance Company Limited . . . . . . . . . . . . . . . . . 0.48 0.50 11ICICI Venture Funds Management Company Limited . . . . . . . . . . . . . . . . . 0.32 0.50 11ICICI Home Finance Company Limited . . . . . . . . . . . . . . . . . . . . . . . . . . . . 0.10 0.12 3Prudential ICICI Asset Management Company Limited . . . . . . . . . . . . . . . 0.17 0.31 7ICICI Bank UK Limited . . . . . . . . . . . . . . . . . . . . . . . . . . . . . . . . . . . . . . . . 0.10 0.64 14ICICI Bank Eurasia Limited Liability Company . . . . . . . . . . . . . . . . . . . . . — 0.01 —ICICI Bank Canada . . . . . . . . . . . . . . . . . . . . . . . . . . . . . . . . . . . . . . . . . . . . Rs.(0.25) Rs.(0.25) US$ (5)
69

Six months ended September 30,
2005 2006 2006
(in billions) (US$ in millions)
ICICI Securities Limited and its subsidiaries . . . . . . . . . . . . . . . . . . . . . . . . Rs. 0.88 Rs. 0.60 US$ 13ICICI Prudential Life Insurance Company Limited . . . . . . . . . . . . . . . . . . . (1.29) (2.22) (48)ICICI Lombard General Insurance Company Limited . . . . . . . . . . . . . . . . . 0.29 0.33 7ICICI Venture Funds Management Company Limited . . . . . . . . . . . . . . . . . 0.27 0.30 7ICICI Home Finance Company Limited . . . . . . . . . . . . . . . . . . . . . . . . . . . . 0.09 0.23 5Prudential ICICI Asset Management Company Limited . . . . . . . . . . . . . . . 0.09 0.31 7ICICI Bank UK Limited . . . . . . . . . . . . . . . . . . . . . . . . . . . . . . . . . . . . . . . . 0.20 0.78 17ICICI Bank Eurasia Limited Liability Company . . . . . . . . . . . . . . . . . . . . . — 0.01 —ICICI Bank Canada . . . . . . . . . . . . . . . . . . . . . . . . . . . . . . . . . . . . . . . . . . . . Rs.(0.14) Rs. 0.06 US$ 1
Critical Accounting Policies
In order to understand our financial condition and the results of operations, it is important to understand oursignificant accounting policies and the extent to which we use judgments and estimates in applying thosepolicies. Our accounting and reporting policies are in accordance with Indian GAAP and confirm to standardaccounting practices relevant to our products and services and businesses in which we operate. Indian GAAPrequires us to make estimates and assumptions that affect the reported amounts of assets and liabilities as of thedate of the financial statements and the reported income and expenses during the reported period. Accordingly,we use a significant amount of judgment and estimates based on assumptions for which the actual results areuncertain when we make the estimation.
We have identified three critical accounting policies, based on the judgments and estimates required in theapplication of these policies. These include accounting for investments, provisions/write offs on loans and othercredit facilities and transfer and servicing of assets.
Accounting for Investments
We account for investments in accordance with the guidelines on investment classification and valuationissued by the Reserve Bank of India. We classify all our investments into Held to Maturity, Available for Saleand ‘Held for Trading. Under each classification, we further categorize investments in to (a) governmentsecurities (b) other approved securities (c) shares (d) bonds and debentures, (e) subsidiaries and joint venturesand (f) others.
‘Held to Maturity’ securities are carried at their acquisition cost or at amortized cost, if acquired at apremium over the face value. Any premium over the face value of the notes acquired is amortized over itsremaining period to maturity on a constant effective yield basis. We also evaluate our investments for any otherthan temporary diminution in its value.
We compute the market value of our notes classified as Available for Sale and Held for Trading inaccordance with the guidelines issued by the Reserve Bank of India. We amortize the premium, if any, over theface value of our investments in government securities classified as available for sale over the remaining periodto maturity on a constant effective yield basis. We compute the market value our quoted investments based onthe trades/quotes on the recognized stock exchanges, SGL account transactions, price list of Reserve Bank ofIndia or prices declared by Primary Dealers Association of India jointly with Fixed Income Money Market andDerivatives Association (“FIMMDA”), periodically.
We compute the market value our unquoted government securities included in the Available for Sale andHeld for Trading categories as per the rates published by FIMMDA.
We compute the market value of non-government securities, other than those quoted on the stockexchanges, wherever linked to the Yield-to-Maturity (“YTM”) rates, with a mark-up (reflecting associated creditrisk) over the yield to maturity rates for government securities published by FIMMDA.
70

We compute the market value of our unquoted equity shares at the book value, if the latest balance sheet isavailable or at Re. 1.
We compute the market value of our notes scrip-wise and depreciation/appreciation aggregated for eachcategory. Net appreciation in each category, if any, being unrealized, is ignored, while net depreciation isprovided for.
Provisions/write-offs on loans and other credit facilities
We classify our loans into standard, substandard, and doubtful assets based on the number of days anaccount is overdue. We create provisions on our secured and unsecured corporate loans classified as sub-standardand doubtful assets at rates prescribed by the Reserve Bank of India. Subject to the minimum provisioning levelsprescribed by the Reserve Bank of India, provision on homogeneous loans relating to retails assets is assessed ona portfolio level, on the basis of days past due.
We create provisions for our restructured/rescheduled loans based on the present value of the interestsacrifice provided at the time of restructuring.
We upgrade a restructured non performing loan to a standard account only after the specified period i.e., aperiod of one year after the date on which the first payment of interest or of principal, whichever is earlier, fallsdue, subject to satisfactory performance of the account during the period. We upgrade all other non-performingloans to a standard account if arrears of interest and principal are fully paid by the borrower.
We also create general provisions on our standard loans based on the guidelines issued by the Reserve Bankof India.
Additionally we also create provisions on individual country exposures (other than for home countryexposures). The countries are categorized into seven risk categories namely insignificant, low, moderate, high,very high, restricted and off-credit and provisioning is made on the exposures exceeding 90 days on a gradedscale ranging from 0.25% to 100%. For exposures with contractual maturity of less than 90 days, 25% of theprovision requirement is held. We do not create provisions if the country exposure (net) in respect of eachcountry does not exceed 1% of our total funded assets.
Transfer and servicing of assets
We transfer commercial and consumer loans through securitization transactions. The transferred loans arede-recognized and gains/losses, net of provisions, are accounted for only if we surrender the rights to benefitsspecified in the loan contract. Recourse and servicing obligations are reduced from proceeds of the sale. Wemeasure the retained beneficial interests in the loans by allocating the carrying value of the loans between theassets sold and the retained interest, based on the relative fair value at the date of the securitization.
Effective February 1, 2006, we account for any loss arising on sale immediately at the time of sale and theprofit/premium arising on account of sale is amortized over the life of the notes issued or to be issued by theentity (special purpose vehicle) to which the assets are sold.
71

BUSINESS
Overview
We offer a wide range of banking products and services to corporate and retail customers through a varietyof delivery channels. In the six months ended September 30, 2006, we made a net profit of Rs. 13.75 billion (US$300 million) compared to a net profit of Rs. 11.10 billion (US$ 242 million) in the six months endedSeptember 30, 2005. In fiscal 2006, we made a net profit of Rs. 25.40 billion (US$ 553 million) compared to anet profit of Rs. 20.05 billion (US$ 436 million) in fiscal 2005. At September 30, 2006, we had assets ofRs. 2,823.73 billion (US$ 61.5 billion) and a net worth of Rs. 234.81 billion (US$ 5.1 billion). At year-end fiscal2006, ICICI Bank was the second-largest bank in India and the largest bank in the private sector in terms of totalassets.
Our commercial banking operations for retail customers consist of retail lending and deposits, privatebanking, distribution of third party investment products and other fee-based products and services, as well asissuance of unsecured redeemable bonds. We provide a range of commercial banking and project financeproducts and services to India’s leading corporations, growth-oriented middle market companies and small andmedium enterprises, including loan products, fee and commission-based products and services, deposits andforeign exchange and derivatives products. We also offer agricultural and rural banking products. We offerinvestment banking services through our subsidiary, ICICI Securities, including corporate advisory services,primary dealership in government securities and equity underwriting and brokerage. In addition, we provideventure capital funding to start-up companies and private equity to a range of companies through our venturecapital and private equity fund management subsidiary ICICI Venture Funds Management Company. We providea wide range of life and general insurance and asset management products and services, respectively, through oursubsidiaries ICICI Prudential Life Insurance Company, ICICI Lombard General Insurance Company andPrudential ICICI Asset Management Company. ICICI Prudential Life Insurance had a retail market share ofabout 30% in new business written (on weighted received premium basis) by private sector life insurancecompanies and about 9% in new business written (on weighted received premium basis) by all life insurancecompanies in India, during April-September 2006. ICICI Lombard General Insurance had a market share of over35% among the private sector general insurance companies and about 12% among all general insurancecompanies in India, during April-September 2006. Prudential ICICI Asset Management Company was the secondlargest player in terms of total funds under management in the Indian mutual fund industry at September 30,2006 with a market share of over 10%. We cross-sell the products of our insurance and asset managementsubsidiaries to our corporate and retail customers.
We believe that the international markets present a major growth opportunity and have, therefore, expandedthe range of our commercial banking products to international customers in North America, the United Kingdom,Russia, the Middle East and South East Asia. We currently have banking subsidiaries in the United Kingdom,Canada and Russia, branches in Singapore, Dubai International Finance Centre, Sri Lanka, Hong Kong andBahrain and representative offices in the United States, China, United Arab Emirates, Bangladesh, South Africa,Malaysia, Thailand and Indonesia. Our subsidiary in the United Kingdom has established a branch in Antwerp,Belgium. We have received approval to establish a representative office in Kenya.
We deliver our products and services through a variety of channels, ranging from bank branches and ATMsto call centers and the Internet. At September 30, 2006, we had a network of 584 branches, 48 extension countersand 2,336 ATMS in 355 locations across several Indian states.
Our legal name is ICICI Bank Limited but we are known commercially as ICICI Bank. We wereincorporated on January 5, 1994 under the laws of India as a limited liability corporation. The duration of ICICIBank is unlimited. Our principal corporate office is located at ICICI Bank Towers, Bandra-Kurla Complex,Mumbai 400 051, India, our telephone number is +91 22 2653 1414 and our web site address iswww.icicibank.com. Our agent for service of process in the United States is Mr. G.V.S. Ramesh, Joint GeneralManager, ICICI Bank Limited, New York Representative Office, 500 Fifth Avenue, Suite 2830, New York,New York 10110.
72

History
ICICI was formed in 1955 at the initiative of the World Bank, the Government of India and Indian industryrepresentatives. The principal objective was to create a development financial institution for providing medium-term and long-term project financing to Indian businesses. Until the late 1980s, ICICI primarily focused itsactivities on project finance, providing long-term funds to a variety of industrial projects. With the liberalizationof the financial sector in India in the 1990s, ICICI transformed its business from a development financialinstitution offering only project finance to a diversified financial services provider that, along with itssubsidiaries and other group companies, offered a wide variety of products and services. As India’s economybecame more market-oriented and integrated with the world economy, ICICI capitalized on the new opportunitiesto provide a wider range of financial products and services to a broader spectrum of clients.
ICICI Bank was incorporated in 1994 as a part of the ICICI group. ICICI Bank’s initial equity capital wascontributed 75.0% by ICICI and 25.0% by SCICI Limited, a diversified finance and shipping finance lender ofwhich ICICI owned 19.9% at December 1996. Pursuant to the merger of SCICI into ICICI, ICICI Bank became awholly-owned subsidiary of ICICI. Effective March 10, 2001, ICICI Bank acquired Bank of Madura, an oldprivate sector bank, in an all-stock merger.
The issue of universal banking, which in the Indian context means conversion of long-term lendinginstitutions such as ICICI into commercial banks, had been discussed at length over the past few years.Conversion into a bank offered ICICI the ability to accept low-cost demand deposits and offer a wider range ofproducts and services, and greater opportunities for earning non-fund based income in the form of banking feesand commissions. ICICI Bank also considered various strategic alternatives in the context of the emergingcompetitive scenario in the Indian banking industry. ICICI Bank identified a large capital base and size and scaleof operations as key success factors in the Indian banking industry. In view of the benefits of transformation intoa bank and the Reserve Bank of India’s pronouncements on universal banking, ICICI and ICICI Bank decided tomerge.
At the time of the merger, both ICICI Bank and ICICI were publicly listed in India and on the New YorkStock Exchange. The amalgamation was approved by each of the boards of directors of ICICI, ICICI PersonalFinancial Services, ICICI Capital Services and ICICI Bank at their respective board meetings held onOctober 25, 2001. The amalgamation was approved by ICICI Bank’s and ICICI’s shareholders at theirextraordinary general meetings held on January 25, 2002 and January 30, 2002, respectively. The amalgamationwas sanctioned by the High Court of Gujarat at Ahmedabad on March 7, 2002 and by the High Court ofJudicature at Bombay on April 11, 2002. The amalgamation was approved by the Reserve Bank of India onApril 26, 2002. The amalgamation became effective on May 3, 2002. The date of the amalgamation foraccounting purposes under Indian GAAP was March 30, 2002 and under US GAAP was April 1, 2002.
73

Shareholding Structure and Relationship with the Government of India
The following table sets forth, at December 8, 2006, certain information regarding the ownership of ourequity shares.
Percentage of totalequity sharesoutstanding
Number of equityshares held
Government-controlled shareholders:Life Insurance Corporation of India . . . . . . . . . . . . . . . . . . . . . . . 7.9 70,562,321General Insurance Corporation of India and government-owned
general insurance companies . . . . . . . . . . . . . . . . . . . . . . . . . . . 4.0 36,230,526Unit Trust of India . . . . . . . . . . . . . . . . . . . . . . . . . . . . . . . . . . . . . 0.3 2,627,279Other government-controlled institutions, corporations and
banks . . . . . . . . . . . . . . . . . . . . . . . . . . . . . . . . . . . . . . . . . . . . . 0.3 2,249,832
Total government-controlled shareholders . . . . . . . . . . . . . . . . . . 12.5 111,669,958
Other Indian investors:Individual domestic investors(1)(2) . . . . . . . . . . . . . . . . . . . . . . . . . 5.9 52,567,099Bajaj Auto Limited . . . . . . . . . . . . . . . . . . . . . . . . . . . . . . . . . . . . 4.3 38,612,181Indian corporates and others (excluding Bajaj Auto Limited) . . . 0.8 6,863,955Mutual funds and banks (other than government-controlled
banks) . . . . . . . . . . . . . . . . . . . . . . . . . . . . . . . . . . . . . . . . . . . . . 4.6 41,076,878Total other Indian investors . . . . . . . . . . . . . . . . . . . . . . . . . . . . . . 15.6 139,120,113
Total Indian investors . . . . . . . . . . . . . . . . . . . . . . . . . . . . . . . . . . 28.1 250,790,071
Foreign investors:Deutsche Bank Trust Company Americas, as depositary . . . . . . . 26.7 238,530,478Allamanda Investments Pte. Limited . . . . . . . . . . . . . . . . . . . . . . 7.4 66,234,627CLSA Merchant Bankers Limited A/C CLSA (Mauritius)
Limited . . . . . . . . . . . . . . . . . . . . . . . . . . . . . . . . . . . . . . . . . . . 4.9 44,072,875Crown Capital Limited . . . . . . . . . . . . . . . . . . . . . . . . . . . . . . . . . 2.4 22,074,413Government of Singapore . . . . . . . . . . . . . . . . . . . . . . . . . . . . . . . 2.3 20,497,936Foreign institutional investors, foreign banks, overseas corporate
bodies and non-resident Indians (excluding AllamandaInvestments Pte. Limited, CLSA Merchant Bankers Limited,Crown Capital Limited and Government of Singapore)(1)(2) . . . 28.2 251,730,702
Total foreign investors . . . . . . . . . . . . . . . . . . . . . . . . . . . . . . . . . . 71.9 643,141,031
Total . . . . . . . . . . . . . . . . . . . . . . . . . . . . . . . . . . . . . . . . . . . . . . . 100.0 893,931,102
(1) Executive officers and directors as a group held around 0.5% of the equity shares as of this date.(2) No single shareholder in this group owned 5.0% or more of ICICI Bank’s equity shares as of this date.
In April 2004, we issued 115,920,758 equity shares to foreign and domestic institutional investors anddomestic retail investors at a price of Rs. 280 (US$ 6) per share, totaling Rs. 32.46 billion (US$ 706 million). InMarch 2005, we sponsored an offering of ADSs by our shareholders, resulting in the issuance of 20,685,750ADSs representing 41,371,500 equity shares sold by our equity shareholders, at a price of US$ 21.11 per ADS,aggregating approximately US$ 437 million. The proceeds of the offering, net of expenses, were distributed tothe selling shareholders. In fiscal 2006, we concluded a capital raising exercise issuing 148,204,556 equityshares, raising a total of Rs. 80.01 billion (US$ 1.7 billion) through the first simultaneous public issue in Indiaand ADS issue in the United States, with a Public Offering Without Listing of ADSs in Japan. The issue waspriced at Rs. 498.75 (US$ 11) per share for retail investors in India, Rs. 525 (US$ 11) per share for otherinvestors in the Indian offering and US$ 26.75 per ADS.
74

The holding of government-controlled shareholders was 12.5% at December 8, 2006 against 12.7% atSeptember 30, 2006 and 15.0% at September 30, 2005. The holding of Life Insurance Corporation of India was7.9% at December 8, 2006 against 8.0% at September 30, 2006 and 9.4% at September 30, 2005.
We operate as an autonomous and commercial enterprise, making decisions and pursuing strategies that aredesigned to maximize shareholder value, and the Indian government has never directly held any of our shares.There is no shareholders’ agreement or voting trust relating to the ownership of the shares held by thegovernment-controlled shareholders. We do not have any agreement with our government-controlledshareholders regarding management control, voting rights, anti-dilution or any other matter. The Government ofIndia has guaranteed certain of our domestic and multilateral borrowings. Under the terms of these loan andguarantee facilities provided by the Government of India to us, the Government of India is entitled to appoint andhas appointed one representative to our board. We invite a representative of each of the government-controlledinsurance companies that are among our principal institutional shareholders, Life Insurance Corporation of Indiaand General Insurance Corporation of India, onto our board. Mr. T. S. Vijayan, Chairman of Life InsuranceCorporation of India was appointed as a director effective April 30, 2005. Mr. R. K. Joshi,Chairman-cum-Managing Director of General Insurance Corporation of India was appointed as a directoreffective October 13, 2005. See “Management—Directors and Executive Officers” for a discussion of thecomposition of our board of directors.
The holding of other Indian investors was 15.6% at December 8, 2006 against 14.3% at September 30, 2006and 11.8% at September 30, 2005. The total holding of Indian investors was 28.1% at December 8, 2006 against26.9% at September 30, 2006 and 26.8% at September 30, 2005. The holding of foreign investors was 71.9% atDecember 8, 2006 against 73.1% at September 30, 2006 and 73.2% at September 30, 2005. See “Supervision andRegulation—Reserve Bank of India Regulations—Ownership Restrictions”.
Deutsche Bank Trust Company Americas holds the equity shares represented by 119.30 million ADSsoutstanding as depositary on behalf of the holders of the ADSs. The ADSs are listed on the New York StockExchange. Under the Indian Banking Regulation Act, no person holding shares in a banking company canexercise more than 10.0% of the total voting power. This means that Deutsche Bank Trust Company Americas(as depositary), which held of record approximately 26.7% of our equity shares as of December 8, 2006 against26.7%% as of September 30, 2006 and 27.2% at September 30, 2005, could only vote 10.0% of our equityshares, in accordance with the directions of our board of directors. See “Overview of the Indian FinancialSector—Recent Structural Reforms—Proposed Amendments to the Banking Regulation Act”. Except as statedabove, no shareholder has differential voting rights.
Strategy
Our objective is to enhance our position as a premier provider of banking and other financial services inIndia and to leverage our competencies in financial services and technology to develop an international businessfranchise.
The key elements of our business strategy are to:
• focus on quality growth opportunities by:
• maintaining and enhancing our strong retail and corporate franchise;
• building an international presence;
• strengthening our insurance and asset management businesses; and
• building a rural banking franchise.
• emphasize conservative risk management practices and enhance asset quality;
• use technology for competitive advantage; and
• attract and retain talented professionals.
75

Overview of ICICI Bank’s Products and Services
We offer products and services in the areas of commercial banking, investment banking and insurance.
Commercial Banking for Retail Customers
We believe that the Indian retail financial services market is likely to continue to experience sustainedgrowth in the future. With upward migration of household income levels, affordability and availability of retailfinance and acceptance of use of credit to finance purchases, retail credit has emerged as a rapidly growingopportunity for banks that have the necessary skills and infrastructure to succeed in this business. We havecapitalized on the growing retail opportunity in India and believe that we have emerged as a market leader inretail credit. The key dimensions of our retail strategy are innovative products, parity pricing, customerconvenience, wide distribution, strong processes, prudent risk management and customer focus. Cross-selling ofthe entire range of credit and investment products and banking services to our customers is a critical aspect of ourretail strategy.
Our commercial banking operations for retail customers consist of retail lending and deposits, credit cards,depositary share accounts, distribution of third-party investment and insurance products, other fee-based productsand services and issuance of unsecured redeemable bonds.
Retail Lending Activities
We offer a range of retail asset products, including home loans, automobile loans, commercial vehicle loans,two wheeler loans, personal loans, credit cards, loans against time deposits and loans against shares. We alsofund dealers who sell automobiles, two wheelers, consumer durables and commercial vehicles. We havecapitalized on the growing retail opportunity in India and believe that we have emerged as a market leader inretail credit, with an outstanding gross retail finance portfolio of Rs. 1,087.19 billion (US$ 23.7 billion) atSeptember 30, 2006. Our retail asset products are generally fixed rate products repayable in equated monthlyinstallments other than our floating rate home loan portfolio, where any change in the benchmark rate to whichthe rate of interest on the loan is referenced is passed on to the borrower on the first day of the succeeding quarteror succeeding month, as applicable. In general, any increase in the rate of interest payable on floating rate homeloans is effected by an elongation of the repayment schedule and/or by changing the monthly installment amount.We have during the period September 30, 2005 to September 30, 2006, based on the age of the borrower and theextended tenor of the loan, effected a part of the increase by an increase in the monthly installment amount. Seealso “Risk Factors—Risks Relating to Our Business—Our business is particularly vulnerable to interest rate riskand volatility in interest rates could adversely affect our net interest margin, the value of our fixed incomeportfolio, our income from treasury operations and our financial performance.”
Lending to small and medium enterprises
We are seeking to extend our reach to the small and medium enterprises sector through segmented offerings.We provide supply chain financing solutions to the channel partners of corporate clients and transaction bankingservices to small and medium enterprises. We also provide financing on a cluster-based approach, that isfinancing of small enterprises in specific sectors such as apparel manufacturers, auto ancillaries, pharmaceuticalsand gems & jewellery. We have recently launched small business loans to meet the working capital needs ofsmall businesses. The funding under this facility is unsecured and is restricted to a maximum of Rs. 2.5 million(US$ 54,407) per customer.
Retail Deposits
Our retail deposit products include time deposits and savings accounts. We also offer targeted products tospecific customer segments such as high net worth individuals, defense personnel, trusts and businessmen, andhave corporate salary account products. Further, we offer an international debit card in association with VISAInternational. At September 30, 2006, we had a debit card base of over 8.9 million cards. We offer currentaccount products to our small and medium enterprise customers.
76

For a description of the Reserve Bank of India’s regulations applicable to deposits in India and requireddeposit insurance, see “Supervision and Regulation—Reserve Bank of Indian Regulations—Regulations Relatingto Deposits” and “Supervision and Regulation—Deposit Insurance”. For more information on the type, cost andmaturity profile of our deposits, see “—Funding”.
Bond Issues
We offer retail liability products in the form of a variety of unsecured redeemable bonds. The Reserve Bankof India has prescribed limits for issuance of bonds by banks. During the six months ended September 30, 2006,we did not issue any bonds to retail investors. While we expect that deposits will continue to be our primarysource of funding, we may conduct bond issues in the future.
Other Fee-Based Products and Services
Through our distribution network, we offer government of India savings bonds, insurance policies fromICICI Prudential Life Insurance Company and ICICI Lombard General Insurance Company and distribute publicofferings of equity shares by Indian companies. We also offer a variety of mutual fund products from PrudentialICICI Asset Management Company and other select mutual funds. We also levy services charges on depositaccounts. We offer fee-based products and services including documentary credits and guarantees to small andmedium enterprises.
As a depositary participant of the National Securities Depository Limited and Central Depository Services(India) Limited, we offer depositary share accounts to settle securities transactions in a dematerialized mode.Further, we are one of the banks designated by the Reserve Bank of India for issuing approvals to non-residentIndians and overseas corporate bodies to trade in shares and convertible debentures on the Indian stockexchanges.
ICICI Web Trade Limited, a company that was owned by a private equity fund managed by ICICI VentureFunds Management Company Limited and provides web and telephone-based brokering services has beenamalgamated with ICICI Brokerage Services Limited, a subsidiary of ICICI Securities Limited providingbrokerage services to institutional clients, effective October 1, 2006.
Commercial Banking for Corporate Customers
We provide a range of commercial banking products and services to India’s leading corporations andgrowth-oriented middle market companies, including loan products, fee and commission-based products andservices, deposits and foreign exchange and derivatives products. We serve our corporate clients throughcorporate relationship groups such as the Corporate Banking Group and the Government Banking Group, andproduct groups such as the Product and Technology Group and the Global Markets Group.
Corporate Loan Portfolio
Our corporate loan portfolio consists of project and corporate finance, working capital financing andagricultural financing. For further details on our loan portfolio, see “—Asset Composition and Classification—Loan Concentration”. For a description of our credit rating and approval system, see “—Risk Management—Credit Risk—Credit Risk Assessment Procedures for Corporate Loans”.
Our project finance business consists principally of extending medium-term and long-term rupee loans tothe manufacturing sector.
Our working capital financing consists of cash credit facilities and bill discounting. For more details on ourcredit risk procedures, see “—Risk Management—Credit Risk”.
77

Fee and Commission-Based Activities
We generate fee income from our syndication, securitization and project financing activities. We seek toleverage our project financing and structuring skills and our relationships with companies and financialinstitutions and banks to earn fee incomes from structuring and syndication. We also seek to leverage ourinternational presence to earn fee income from structuring and financing of overseas acquisitions by Indiancompanies.
We offer our corporate customers a wide variety of fee and commission-based products and servicesincluding documentary credits and standby letters of credit (called guarantees in India).
We also offer cash management services (such as collection, payment and remittance services), escrow,trust and retention account facilities, online payment facilities, custodial services and tax collection services onbehalf of the Government of India and the governments of Indian states. We also offer custodial services toclients. At September 30, 2006, total assets held in custody on behalf of our clients (mainly foreign institutionalinvestors, offshore funds, overseas corporate bodies and depositary banks for GDR investors) was Rs. 1,342.94billion (US$ 29.2 billion). As a registered depositary participant of National Securities Depository Limited andCentral Depository Services (India) Limited, the two securities depositaries operating in India, we also provideelectronic depositary facilities to investors.
Corporate Deposits
We offer a variety of deposit products to our corporate customers including current accounts, time depositsand certificates of deposits. For more information on the type, cost and maturity profile of our deposits, see“—Funding”.
Customer Foreign Exchange
We provide customer specific products and services and risk hedging solutions in several currencies to meetthe trade and service-related requirements of our corporate clients. The products and services offered include:
• spot foreign exchange for the conversion of foreign currencies without any value restrictions;
• foreign exchange and interest rate derivatives.
We earn commissions on these products and services from our corporate customers.
We provide forward contracts to our customers for hedging their short-term exchange rate risk on foreigncurrency denominated receivables and payables. We generally provide this facility for a term of up to six monthsand occasionally up to 12 months. We also offer interest rate and currency swaps to our customers for hedgingtheir medium and long-term risks due to interest rate and currency exchange rate movements. We offer theseswaps for a period ranging from three to 10 years. Our customers pay a commission for this product that isincluded in the price of the product and is dependent upon market conditions. We also hedge our own exchangerate risk related to our foreign currency-trading portfolio with products from banking counter parties. Our riskmanagement products are currently limited to foreign currency forward transactions and currency and interestrate swaps for selected approved clients. We believe, however, that the demand for risk management productswill grow, and we are building the capabilities to grow these products. We are focusing particularly on setting upsophisticated infrastructure and internal control procedures that are critical to these products.
Commercial Banking for Rural and Agricultural Customers
We believe that rural India offers a major growth opportunity for financial services and have identified thisas a key focus area. The Reserve Bank of India’s directed lending norms require us to lend 18.0% of our net bankcredit on the residual portion of our advances (i.e., our total advances excluding the advances of ICICI at
78

year-end fiscal 2002) to the agricultural sector. Recently the Reserve Bank of India has proposed to link prioritysector lending targets and sub-targets for all banks to adjusted net bank credit (net bank credit plus investmentsmade by banks in non statutory liquidity ratio bonds included in the held to maturity category) See also“Supervision and Regulation—Directed Lending”. However, rural banking presents significant challenges interms of geographical coverage and high unit transaction costs. Our rural banking strategy seeks to adopt aholistic approach to the financial needs of various segments of the rural population, by delivering acomprehensive product suite encompassing credit, transaction banking, deposit, investment and insurance. Weprovide corporate banking products and services to corporate clients engaged in agriculture-linked businesses.We are seeking to grow our rural individual and household lending portfolio by developing and scaling up creditproducts to various segments of the rural population, whether engaged in agriculture or other economic activity.Our rural credit products for individuals and households include loans to farmers for cultivation, post-harvestfinancing against warehouse receipts, loans for purchase of tractors, working capital for trading and smallenterprises, loans against jewellery and micro-finance loans for various purposes. We are seeking to roll-out ourrural strategy and reach out to rural customers through partnerships with micro-finance institutions andcompanies active in rural areas. Our rural delivery channels include branches, micro-finance institutions, third-party kiosks and franchisees. See also “—Competition”.
For details of our directed lending portfolio, see “—Asset Composition and Classification—LoanConcentration—Directed Lending”.
Commercial Banking for International Customers
We believe that the international markets present a major growth opportunity and have, therefore, expandedthe range of our commercial banking products to international customers. Our strategy for growth in internationalmarkets is based on leveraging home country links and technology for international expansion by capturingmarket share in select international markets. We have identified North America, the United Kingdom, Russia, theMiddle-East and South-East Asia as the key regions for establishing our international presence. The initial focusareas are supporting Indian companies in raising corporate and project finance for their investments abroad, tradefinance, personal financial services for non-resident Indians and international alliances to support domesticbusinesses. We have over the last few years built a large network of correspondent relationships withinternational banks across all major countries. Most of these countries have significant trade and otherrelationships with India.
Many of the commercial banking products that we offer to international customers, such as trade financeand letters of credit, are similar to the products offered to our corporate customers in India. Some of the productsand services that are unique to international customers are:
• Money2India: an Internet-based remittance tracking platform
• TradeWay: an Internet-based documentary collection product to provide correspondent banks access toreal-time on line information on the status of their export bills collections routed through us.
• Remittance Tracker: an Internet-based application that allows a correspondent bank to query on thestatus of their payment instructions and also to get various information reports online.
• Offshore banking deposits: multi-currency deposit products in US dollar, pound sterling and euro.
• Foreign currency non-resident deposits: foreign currency deposits offered in four main currencies—US dollar, pound sterling, euro and yen.
• Non-resident external fixed deposits: deposits maintained in Indian rupees.
• Non-resident external savings account: savings accounts maintained in Indian rupees.
• Non-resident ordinary savings accounts and non-resident ordinary fixed deposits.
We currently have subsidiaries in the United Kingdom, Canada and Russia, branches in Singapore, DIFC,Sri Lanka, Hong Kong and Bahrain and representative offices in the United States, China, United Arab Emirates,
79

Bangladesh and South Africa. We have recently set-up Representative offices in Thailand, Indonesia andMalaysia after receiving approval from the respective regulatory authorities. We have also received approvalfrom the Central Bank of Kenya to open a representative office in Kenya, the operations of which shallcommence shortly. The Reserve Bank of India has granted approval to open a representative office in Abu Dhabiand a branch in Qatar. Our subsidiaries in the United Kingdom, Canada and Russia offer local banking productsand services in those countries. Our subsidiary in United Kingdom has also opened a branch in Antwerp,Belgium in May 2006. In Canada and the United Kingdom, we have also launched direct banking offerings usingthe Internet as the access channel.
We also access the international debt markets for funding the assets of our overseas branches. We issuedUS$ 400 million senior notes in October 2006. We also have an existing Medium Term Note Program andUS$ Commercial Paper program which we use from time to time.
Delivery Channels
We deliver our products and services through a variety of channels, ranging from traditional bank branchesto ATMs, call centers and the Internet. We also have direct marketing agents or associates, who deliver our retailcredit products. These agents help us achieve deeper penetration by offering doorstep service to the customer.
At September 30, 2006 we had a network of 584 branches and 48 extension counters in 355 centers acrossseveral Indian states. Extension counters are small offices primarily within office buildings or on factorypremises that provide commercial banking services. We propose to open 111 new branches and 450 offsiteATMs pursuant to authorization received from Reserve Bank of India in November 2006.
As a part of its branch licensing conditions, the Reserve Bank of India has stipulated that at least 25.0% ofour branches must be located in semi-urban and rural areas. The following table sets forth the number ofbranches broken down by area at September 30, 2006.
At September 30, 2006
Number of branches % of total
Metropolitan/urban . . . . . . . . . . . . . . . . . . . . . . . . . . . . . . . . . . . . . . . . . . . . . . . . . . 389 66.6%Semi-urban/rural . . . . . . . . . . . . . . . . . . . . . . . . . . . . . . . . . . . . . . . . . . . . . . . . . . . . 195 33.4%
Total . . . . . . . . . . . . . . . . . . . . . . . . . . . . . . . . . . . . . . . . . . . . . . . . . . . . . . . . . . . . . . 584 100.0%
At September 30, 2006, we offered one or more retail credit products in about 1,200 centers.
At September 30, 2006, we had 2,336 ATMs, of which 717 were located at our branches and extensioncounters. Through our website www.icicibank.com, we offer our customers online access to account informationand payment and fund transfer facilities. We provide Internet banking services to our corporate clients throughICICI e-business, a finance portal which is the single point web-based interface for all our corporate clients. Weprovide telephone banking services through our call center. At September 30, 2006, our call center had 4,238service workstations in India. We offer mobile phone banking services to our customers using any cellulartelephone service operator in India.
Treasury
Through our treasury operations, we seek to manage our balance sheet, including the maintenance ofrequired regulatory reserves, and to optimize profits from our trading portfolio by taking advantage of marketopportunities. Our trading and securities portfolio includes our regulatory reserve portfolio, as there is norestriction on active management of our regulatory reserve portfolio. Our treasury operations include a range ofproducts and services for corporate customers, such as forward contracts and interest rate and currency swaps,and foreign exchange products and services.
80

Under the Reserve Bank of India’s statutory liquidity ratio requirement, we are required to maintain aminimum of 25.0% of our demand and time liabilities by way of approved securities, such as government ofIndia securities and state government securities. Amendments to the Banking Regulation Act have been proposedin the Indian Parliament to remove the lower and upper bounds to the statutory liquidity ratio and to provideflexibility to the Reserve Bank of India to prescribe prudential norms. We maintain the statutory liquidity ratiothrough a portfolio of government of India securities that we actively manage to optimize the yield and benefitfrom price movements. Under the Reserve Bank of India’s cash reserve ratio requirements, we are currentlyrequired to maintain a minimum of 5.0% of our net demand and time liabilities in a current account with theReserve Bank of India. Effective June 22, 2006, the Reserve Bank of India pays no interest on these cashreserves. Prior to this date, the Reserve Bank of India used to pay no interest on cash reserves up to 3.0% of thenet demand and time liabilities and used to pay interest at 3.5% on the remaining eligible balance. In December2006, the Reserve Bank of India increased the cash reserve ratio by 50 basis points from 5.0% to 5.5%. Theincrease will be effective in two phases as follows:
the fortnight beginning December 23, 2006: 5.0% to 5.25%
the fortnight beginning January 6, 2007: 5.25% to 5.5%
For a further discussion of these regulatory reserves, see “Supervision and Regulation—Legal ReserveRequirements.”
Our treasury undertakes liquidity management by seeking to maintain an optimum level of liquidity andcomplying with the cash reserve ratio requirement. The objective is to ensure the smooth functioning of all ourbranches and at the same time avoid holding excessive cash. We maintain a balance between interest-earningliquid assets and cash to optimize earnings and undertake reserve management by maintaining statutory reserves,including the cash reserve ratio and the statutory liquidity ratio. Further, we engage in domestic and foreignexchange operations from a centralized trading floor in Mumbai. As part of our treasury activities, we alsomaintain proprietary trading portfolios in domestic debt and equity securities and in foreign currency assets. Ourtreasury manages our foreign currency exposures and the foreign exchange and risk hedging derivative productsoffered to our customers and engages in proprietary trading of currencies. Our investment and market riskpolicies are approved by the Risk Committee and Asset Liability Management Committee of our board ofdirectors.
Our investments portfolio is classified into three categories—held to maturity, available for sale and held fortrading. Investments acquired with the intention to hold them up to maturity are classified as held to maturity.Investments acquired by us with the intention to trade by taking advantage of the short-term price/interest ratemovements are classified as held for trading. The investments which do not fall in the above two categories areclassified as available for sale. Investments under the held for trading category should be sold within 90 days; inthe event of inability to sell due to adverse factors including tight liquidity, extreme volatility or a unidirectionalmovement in the market, the unsold securities should be shifted to the available for sale category. Under eachcategory the investments are classified under (a) government securities (b) other approved securities (c) shares(d) bonds and debentures (e) subsidiaries and joint ventures and (f) others. Investments classified under the heldto maturity category are not marked to market and are carried at acquisition cost, unless it is more than the facevalue, in which case the premium is amortized over the period of such securities. The individual scrips in theavailable for sale category are marked to market. Investments under this category are valued scrip-wise anddepreciation / appreciation is aggregated for each classification. Net depreciation, if any, is provided for. Netappreciation, if any, is ignored. The individual scrips in the held for trading category are marked to market as inthe case of those in the available for sale category.
Our treasury engages in domestic and foreign exchange operations from a centralized trading floor inMumbai. As part of our treasury activities, we also maintain proprietary trading portfolios in domestic debt andequity securities and in foreign currency assets. Our board approves our treasury investment policy and assetliability management policy, which govern the management of market risk of our treasury portfolio.
81

The following table sets forth, for the periods indicated, the details of our investment portfolio.
Year ended March 31,Six months ended
September 30,
2002 2003 2004 2005 2006 2006
(in billions)
Government and other approvedsecurities . . . . . . . . . . . . . . . . Rs.227.93 Rs.255.83 Rs.299.18 Rs.344.82 Rs.510.74 Rs.607.14
Debentures and bonds . . . . . . . . 64.36 56.90 55.49 28.54 18.04 24.00Shares . . . . . . . . . . . . . . . . . . . . 19.09 16.42 16.84 19.15 20.58 21.50Others(1) . . . . . . . . . . . . . . . . . . . 47.53 25.47 62.85 112.36 166.11 177.28
Total . . . . . . . . . . . . . . . . . . . . . Rs.358.91 Rs.354.62 Rs.434.36 Rs.504.87 Rs.715.47 Rs.829.92
(1) Others includes investments in subsidiaries and joint ventures, commercial paper, mutual fund units andinvestments outside India.
At September 30, 2006, 76.4% of our government securities portfolio was in the held to maturity category.We have a limited equity portfolio because the Reserve Bank of India restricts investments by a bank in equitysecurities to 5.0% of its total outstanding domestic loan portfolio as at March 31 of the previous year. Asignificant portion of ICICI’s investments in equity securities was related to projects financed by it. The ReserveBank of India has permitted us to exclude these investments for determining compliance with the restriction oninvestments by banks in equity securities, for a period of five years from the amalgamation. In addition, theReserve Bank of India also approves the exclusion, on a case by case basis, of equity investments acquired byconversion of loans under restructuring schemes approved by the Corporate Debt Restructuring Forum. Toensure compliance with the Securities and Exchange Board of India’s revised insider trading regulations, alldealings in our equity investments in listed companies are undertaken by the equity and corporate bonds dealingdesks of our treasury, which are segregated from our other business groups as well as the other groups and desksin the treasury, and which do not have access to unpublished price sensitive information about these companiesthat may be available to us as lenders.
We deal in several major foreign currencies and take deposits from non-resident Indians in four majorforeign currencies. We also manage onshore accounts in foreign currencies. We control market risk and creditrisk on our foreign exchange trading portfolio through an internal model which sets counterparty limits, stop-losslimits and limits on the loss of the entire foreign exchange trading operations and exception reporting.
For details of our treasury-related products and services for corporate customers, such as forward contractsand interest rate and currency swaps, and foreign exchange products and services, see “- Commercial Bankingfor Corporate Customers”.
Insurance
We provide a wide range of insurance products and services through our subsidiaries ICICI Prudential LifeInsurance Company and ICICI Lombard General Insurance Company. ICICI Prudential Life Insurance Companyand ICICI Lombard General Insurance Company are joint ventures with Prudential plc of UK and FairfaxFinancial Holdings Limited of Canada, respectively, in which we have a 74.0% interest. We collect fees fromthese subsidiaries for generating leads and providing referrals that are converted into policies. ICICI PrudentialLife Insurance Company incurred a net loss of Rs. 1.88 billion (US$ 41 million) in fiscal 2006 and a net loss ofRs 2.22 billion (US$ 48 million) in the six months ended September 30, 2006. ICICI Lombard General Insurancemade a net profit of Rs. 503.1 million (US$ 11 million) in fiscal 2006 and a net profit after tax ofRs. 331.7 million (US$ 7 million) in the six months ended September 30, 2006. We expect our insurance jointventures to experience significant growth and to require additional investments by us. The profit or loss of thesecompanies is not reflected in the financial statements included in this offering memorandum, which are for ICICIBank Limited on a standalone basis.
82

Asset Composition and Classification
Loan Concentration
We follow a policy of portfolio diversification and evaluate our total financing exposure in a particularindustry in light of our forecasts of growth and profitability for that industry. Our Risk Management Groupmonitors all major sectors of the economy and specifically follows industries in which we have credit exposures.We seek to respond to any economic weakness in an industrial segment by restricting new credits to that industrysegment and any growth in an industrial segment by increasing new credits to that industry segment, resulting inactive portfolio management. Our policy is to limit total loans outstanding to any particular industry (other thanretail loans) to 15.0% of our total loan portfolio.
The following tables set forth, at the dates indicated, the composition of our gross loans (net of write-offs).
Year ended March 31, Six months ended September 30,
2005 2006 2006
IndustryTotalloans
% tototalloans
Totalloans
% tototalloans
Totalloans
% tototalloans Total loans
(Rupees in billions, except percentages)(US$ in
millions)
Retail finance(1) . . . . . . . . . . . . . . . . . . . 566.52 60.9 929.08 62.9 1,087.19 69.2 US$23,660Services . . . . . . . . . . . . . . . . . . . . . . . . . 26.87 2.9 77.29 5.2 70.98 4.5 1,545Iron & steel . . . . . . . . . . . . . . . . . . . . . . 47.43 5.1 45.29 3.1 40.39 2.6 879Crude petroleum/refining . . . . . . . . . . . 42.86 4.6 40.51 2.7 39.62 2.5 862Chemicals . . . . . . . . . . . . . . . . . . . . . . . 28.03 3.0 39.51 2.7 37.81 2.4 823Power . . . . . . . . . . . . . . . . . . . . . . . . . . . 17.75 1.9 27.41 1.9 27.41 1.8 597Roads, ports, railways & telecom . . . . . 35.54 3.8 29.91 2.0 25.67 1.6 559Metal & metal products . . . . . . . . . . . . . 17.43 1.9 20.37 1.4 14.31 0.9 311Engineering . . . . . . . . . . . . . . . . . . . . . . 17.17 1.8 23.03 1.6 14.62 0.9 318Shipping . . . . . . . . . . . . . . . . . . . . . . . . 4.77 0.5 7.47 0.5 14.15 0.9 308Cotton Textiles . . . . . . . . . . . . . . . . . . . 11.33 1.2 9.36 0.6 10.63 0.7 231Automobiles . . . . . . . . . . . . . . . . . . . . . 7.08 0.8 8.94 0.6 7.38 0.5 161Food processing . . . . . . . . . . . . . . . . . . 6.81 0.7 11.92 0.8 6.90 0.4 150Cement . . . . . . . . . . . . . . . . . . . . . . . . . 10.08 1.1 7.09 0.5 6.22 0.4 135Paper & paper products . . . . . . . . . . . . . 5.43 0.6 6.40 0.4 5.64 0.4 123Sugar . . . . . . . . . . . . . . . . . . . . . . . . . . . 4.54 0.5 5.92 0.4 3.20 0.2 70Beverages . . . . . . . . . . . . . . . . . . . . . . . 1.00 0.1 5.79 0.4 2.80 0.2 61Other textiles . . . . . . . . . . . . . . . . . . . . . 4.21 0.5 4.11 0.3 2.28 0.2 50Other industries(2) . . . . . . . . . . . . . . . . . 75.60 8.1 176.86 12.0 153.41 9.8 3,339
Total . . . . . . . . . . . . . . . . . . . . . . . . . . . 930.45 100.00 1,476.25 100.00 1,570.61 100.00 34,182
(1) Includes dealer and developer financing.(2) Others primarily include transportation, food products, petrochemicals, man-made fibres, machinery,
plastics, mining, rubber and rubber products, shipping, agriculture, construction, printing, mineral products,glass and glass products, watches, healthcare, gems and jewellery, leather and wood products industries.
Our net loans and advances at September 30, 2006 increased to Rs. 1,554.03 billion (US$ 33.8 billion)as compared to Rs. 1,461.63 billion (US$ 31.8 billion) in March 31, 2006. Our loans and advancesincreased by 60.0% to Rs. 1,461.63 billion (US$ 31.8 billion) at March 31, 2006 from Rs. 914.05 billion(US$ 19.9 billion) at March 31, 2005. Retail finance constituted 69.2% of our total loans and advances atSeptember 30, 2006 compared to 62.9% at year-end fiscal 2006 and 60.9% at year-end fiscal 2005. Retailproducts and services have been the primary driver of our growth and are a critical component of our
83

projections of earnings (See “Risk factors”). The following table sets forth, at the dates indicated, thecomposition of our gross (net of write-offs) retail finance portfolio.
Year endedMarch 31,
Six months endedSeptember 30,
2005 2006 2006 2006
(Rupees in billions)(US$ inbillions)
Home loans(1) . . . . . . . . . . . . . . . . . . . . . . . . . . . . . . . . . . . . . . . . . . . . . . . . 284.76 454.84 547.53 11.92Automobile loans . . . . . . . . . . . . . . . . . . . . . . . . . . . . . . . . . . . . . . . . . . . . . 102.86 188.74 191.81 4.17Commercial business . . . . . . . . . . . . . . . . . . . . . . . . . . . . . . . . . . . . . . . . . . 85.59 120.49 137.18 2.99Two-wheelers loans . . . . . . . . . . . . . . . . . . . . . . . . . . . . . . . . . . . . . . . . . . . 12.42 20.98 17.03 0.37Personal loans . . . . . . . . . . . . . . . . . . . . . . . . . . . . . . . . . . . . . . . . . . . . . . . . 24.95 58.98 93.35 2.03Credit card receivables . . . . . . . . . . . . . . . . . . . . . . . . . . . . . . . . . . . . . . . . . 20.64 35.45 44.85 0.98Loans against securities and others(2) . . . . . . . . . . . . . . . . . . . . . . . . . . . . . . 35.31 49.61 55.44 1.21
Total retail finance portfolio . . . . . . . . . . . . . . . . . . . . . . . . . . . . . . . . . . . . 566.52 929.08 1,087.19 23.67
(1) Includes developer financing.(2) Includes dealer financing.
Our advances to the services sector were 4.5% of our total advances at September 30, 2006 compared to5.2% at year-end fiscal 2006 and 2.9% at year-end fiscal 2005. Our advances to the iron & steel sector were 2.6%of our total advances at September 30, 2006 and 3.1% at year-end fiscal 2006 compared to 5.1% of our totaladvances at year-end fiscal 2005. Our advances to the crude petroleum/refining sector were 2.5% of our totaladvances at September 30, 2006 compared to 2.7% at year-end fiscal 2006 and 4.6% at year-end fiscal 2005.
Pursuant to the guidelines of the Reserve Bank of India, our credit exposure to individual borrowers mustnot exceed 15.0% of our capital funds, comprising Tier I and Tier II capital calculated pursuant to the guidelinesof the Reserve Bank of India. Credit exposure to single borrowers may exceed the exposure norm of 15.0% ofcapital funds by an additional 5.0% (i.e. up to 20.0%) provided the additional credit exposure is on account ofinfrastructure financing. Our exposure to a group of companies under the same management control must notexceed 40.0% of our capital funds unless the exposure is in respect of an infrastructure project. In that case, theexposure to a group of companies under the same management control may be up to 50.0% of our capital funds.With effect from June 1, 2004, banks may, in exceptional circumstances, with the approval of their boards,enhance the exposure by 5.0% of capital funds (i.e., 20.0% of capital funds for an individual borrower and 45.0%of capital funds for a group of companies under same management), making appropriate disclosures in theirannual reports. Exposure for funded facilities is calculated as the total committed credit and investment sanctionsor the outstanding funded amount, whichever is higher (for term loans, as the sum of undisbursed commitmentsand the outstanding amount). Exposure for non-funded facilities is calculated as 100.0% of the committedamount or the outstanding non-funded amount whichever is higher.
At September 30, 2006, ICICI Bank was in compliance with the guidelines of the Reserve Bank of India, asreferred to above. Our exposure to the largest borrower at September 30, 2006 accounted for approximately13.9% of our capital funds. Our exposure to the largest borrower group at September 30, 2006 accounted forapproximately 23.6% of our capital funds.
Directed Lending
The Reserve Bank of India requires banks to lend to certain sectors of the economy. Such directed lendingcomprises priority sector lending, export credit and housing finance.
84

Priority Sector Lending
The Reserve Bank of India has established guidelines requiring banks to lend 40.0% of their net bank credit(total domestic loans less marketable debt instruments and certain exemptions permitted by the Reserve Bank ofIndia from time to time) to certain specified sectors called priority sectors. Priority sectors include small-scaleindustries, the agricultural sector, food and agri-based industries, small businesses and housing finance up tocertain limits. The agricultural sector is further bifurcated into direct finance to agriculture which mainly includesshort-term crop loans and medium and long term loans provided directly to farmers for financing production anddevelopment needs and indirect finance to agriculture which mainly includes financing the distribution offertilizers, pesticides, seeds, etc, financing distribution of inputs for the allied activities such as, cattle feed,poultry feed, etc. and various other specified categories. Out of the 40.0%, banks are required to lend a minimumof 18.0% of their net bank credit to the agriculture sector (including direct agriculture and indirect agriculture)and the balance to certain specified sectors, including small scale industries (defined as manufacturing,processing and services businesses with a limit of Rs. 10.0 million on investment in plant and machinery, and aninvestment limit of Rs. 50.0 million in respect of certain specified items), small businesses, including retailmerchants, professional and other self employed persons and road and water transport operators, housing loansup to certain limits and to specified state financial corporations and state industrial development corporations. Toensure focus of the banks on the direct agricultural advances Reserve Bank of India has stipulated that thelending under the indirect category should not exceed one-fourth of the agricultural sub-target of 18%, thereforebanks are necessarily required to lend 13.5% of their net bank credit to the direct agricultural sector. Whilegranting its approval for the amalgamation, the Reserve Bank of India stipulated that since ICICI’s loanstransferred to us were not subject to the priority sector lending requirement, we are required to maintain prioritysector lending of 50.0% of our net bank credit on the residual portion of our advances (i.e., the portion of ourtotal advances excluding advances of ICICI at year-end fiscal, 2002, henceforth referred to as residual net bankcredit). This additional 10.0% priority sector lending requirement will apply until such time as our aggregatepriority sector advances reach a level of 40.0% of our total net bank credit. The Reserve Bank of India’s existinginstructions on sub-targets under priority sector lending and eligibility of certain types of investments/funds forqualification as priority sector advances apply to us.
We are required to comply with the priority sector lending requirements at the end of each fiscal year. Anyshortfall in the amount required to be lent to the priority sectors may be required to be deposited withgovernment sponsored Indian development banks like the National Bank for Agriculture and Rural Developmentand the Small Industries Development Bank of India. These deposits have a maturity of up to five years and carryinterest rates lower than market rates.
We report our priority sector loans to the Reserve Bank of India on a quarterly basis. The loans reported areas on the last “reporting Friday” of the quarter. At March 31, 2006, which was the last reporting Friday for thequarter-ended March 31, 2006, our priority sector loans were Rs. 432.29 billion, constituting 49.7% of ourresidual net bank credit against the requirement of 50.0%.
The following table sets forth, for the periods indicated, our priority sector loans, classified by the type ofborrower, as at the last reporting Friday of fiscal 2006:
March 31,2006
% of residual net bankcredit at March 31, 2006
Small scale industries(1) . . . . . . . . . . . . . . . . . . . . . . . . . . . . . . . . . . . . . . . . . . . . 3.51 0.4%Others including housing loans and small businesses . . . . . . . . . . . . . . . . . . . . . 282.20 32.4%Agricultural sector(2) . . . . . . . . . . . . . . . . . . . . . . . . . . . . . . . . . . . . . . . . . . . . . . 146.58 16.9%
Total . . . . . . . . . . . . . . . . . . . . . . . . . . . . . . . . . . . . . . . . . . . . . . . . . . . . . . . . . . . 432.29 49.7%
(1) Small scale industries are defined as manufacturing, processing and services businesses with a limit ofRs. 10.0 million on investment in plant and machinery.
(2) Includes direct agriculture loans of Rs. 101.11 billion constituting 11.6% of our residual net bank creditagainst the requirement of 13.5%.
85

Export Credit
As part of directed lending, the Reserve Bank of India also requires banks to make loans to exporters atconcessional rates of interest. Export credit is provided for pre-shipment and post-shipment requirements ofexporter borrowers in rupees and foreign currencies. At the end of the any fiscal year, 12.0% of a bank’s net bankcredit is required to be in the form of export credit. This requirement is in addition to the priority sector lendingrequirement but credits extended to exporters that are small scale industries or small businesses may also meetpart of the priority sector lending requirement. The Reserve Bank of India provides export refinancing for aneligible portion of total outstanding export loans at the bank rate prevailing in India from time to time. Theinterest income earned on export credits is supplemented through fees and commissions earned from theseexporter customers from other fee-based products and services taken by them from us, such as foreign exchangeproducts and bill handling. At March 31, 2006 (last reporting Friday for March 2006), our export credit wasRs. 11.54 billion, constituting 1.3% of our residual net bank credit.
Housing Finance
The Reserve Bank of India requires banks to lend up to 3.0% of their incremental deposits in the previousfiscal year for housing finance. This can be in the form of home loans to individuals or investments in thedebentures and bonds of the National Housing Bank and housing development institutions recognized by thegovernment of India. Our housing finance lending in fiscal 2006 was significantly higher than the requirement of3.0% of incremental deposits. Housing finance also qualifies as priority sector lending. At March 31, 2006 (lastreporting Friday for March 2006), our housing finance loans qualifying as priority sector loans were Rs. 234.27billion.
Classification of Loans
We classify our assets as performing and non-performing in accordance with the Reserve Bank of India’sguidelines. Under these guidelines, an asset is classified as non-performing if any amount of interest or principalremains overdue for more than 90 days (180 days until fiscal 2003), in respect of term loans. In respect ofoverdraft or cash credit, an asset is classified as non-performing if the account remains out of order for a periodof 90 days (180 days until fiscal 2003) and in respect of bills, if the account remains overdue for more than 90days (180 days until fiscal 2003).
Asset Classification
Assets are classified as described below:
Standard assets Assets that do not disclose any problems or which do not carry more thannormal risk attached to the business are classified as standard assets.
Sub-standard assets Sub-standard assets comprise assets that are non-performing for a period notexceeding 12 months (18 months until year-end fiscal 2004).
Doubtful assets Doubtful assets comprise assets that are non-performing for more than 12months (18 months until year-end fiscal 2004).
Loss assets Loss assets comprise assets (i) the losses on which are identified or (ii) that areconsidered uncollectible.
Our non-performing assets include loans and advances as well as credit substitutes, which are funded creditexposures like debentures and preference shares. In compliance with regulations governing the presentation offinancial information by banks, we report only non-performing loans and advances in our financial statements.
86

Restructured Loans
The Reserve Bank of India has separate guidelines for restructured assets. A fully secured standard loan canbe restructured by reschedulement of principal repayments and/or the interest element, but must be separatelydisclosed as a restructured loan in the year of restructuring. The amount of sacrifice, if any, in the element ofinterest, measured in present value terms, is either written off or provision is made to the extent of the sacrificeinvolved. Similar guidelines apply to sub-standard assets. The sub-standard accounts which have been subjectedto restructuring, whether in respect of principal installment or interest amount are eligible to be upgraded to thestandard category only after the specified period, i.e., a period of one year after the date when first payment ofinterest or of principal, whichever is earlier, falls due, subject to satisfactory performance during the period.
Provisioning and Write-Offs
The Reserve Bank of India guidelines on provisioning and write-offs are as described below:
Standard assets As per Reserve Bank of India guidelines issued in September 2005, banks arerequired to make general provision at 0.40% on standard loans (excluding loansto the agriculture sector and to small and medium enterprises). As per ReserveBank of India guidelines issued in May 2006, the general provisions forpersonal loans, loans and advances qualifying as capital market exposure,residential housing loans beyond Rs. 2.0 million and commercial real estateloans was increased to 1.00% from 0.40%. Further, in its guidelines issued inJuly 2006, the Reserve Bank of India has allowed banks to create the aboveadditional provision in a phased manner as given below.
a) 0.55% by June 2006;
b) 0.70% by September 2006;
c) 0.85% by December 2006; and
d) 1.00% by March 2007.
Sub-standard assets A general provision of 10% is required for all sub-standard assets. Anadditional provision of 10% is required for accounts that are unsecured,ab-initio.
Doubtful assets A 100% provision/write-off is required in respect of the unsecured portion ofthe doubtful asset. Until year-end fiscal 2004, a 20% to 50% provision wasrequired for the secured portion as follows:
a) Up to one year: 20% provision;
b) One to three years: 30% provision; and
c) More than three years: 50% provision.
Effective the quarter ended June 30, 2004, a 100% provision is required forassets classified as doubtful for more than three years on or after April 1, 2004.In respect of assets classified as doubtful for more than three years up to March31, 2004, 60% to 100% provision on such secured portion is required asfollows:
a) By March 31, 2005: 60% provision;
b) By March 31, 2006: 75% provision; and
c) By March 31, 2007: 100% provision.
87

Loss assets The entire asset is required to be written off or provided for.
Restructured loans A provision equal to the difference between the present value of the futureinterest as per the original loan agreement and the present value of the futureinterest on the basis of rescheduled terms at the time of restructuring, is requiredto be made.
Our policy
Until fiscal 2004 we made provisions aggregating 50% of the secured portion of corporate non-performingassets over a three-year period instead of the five-and-a-half year period prescribed by the Reserve Bank of India.Effective the quarter ended June 30, 2004, we provide for corporate non-performing assets in line with revisedReserve Bank of India guidelines requiring 100% provision over a five-year period. Loss assets and theunsecured portion of doubtful assets are fully provided for or written off. Additional provisions are made againstspecific non-performing assets if considered necessary by management. We make provisions and write-offs forretail non-performing loans in excess of the provisions required by the Reserve Bank of India guidelines.Non-performing assets acquired from ICICI in the amalgamation were fair valued and additional provisions wererecorded to reflect the fair valuation. We do not distinguish between provisions and write-offs while assessingthe adequacy of our loan loss coverage, as both provisions and write-offs represent a reduction of the principalamount of a non-performing asset. In compliance with regulations governing the presentation of financialinformation by banks, we report non-performing assets net of cumulative write-offs in our financial statements.
For restructured loans, provisions are made in accordance with the guidelines issued by the Reserve Bank ofIndia, which require that the difference between the present values of the future interest as per the original loanagreement and the present values of future interest on the basis of rescheduled terms be provided at the time ofrestructuring.
The following table sets forth, at the dates indicated, data regarding the classification of our gross portfolio(net of write-offs and unpaid interest on non-performing assets).
At March 31,At
September 30,
2002 2003 2004 2005 2006(1) 2006(1)
(in billions, except percentages)Standard . . . . . . . . . . . . Rs.551.98 91.2% Rs.630.50 91.5% Rs.705.98 94.6% Rs.964.08 96.6% Rs.1,512.81 98.5% Rs.1,624.65 98.2%of which:Restructured loans . . . . 50.43 8.3 92.87 13.4 75.45 10.1 65.62 6.6 55.46 3.6 51.08 3.1Non-perform-ing
assets . . . . . . . . . . . . 53.25 8.8 58.39 8.5 40.14 5.4 34.37 3.4 22.73 1.5 30.37 1.8Of which:Sub-standard . . . . . . . . 19.08 3.2 18.69 2.7 14.93 2.0 10.20 1.0 10.71 0.7 16.24 1.0Doubtful assets . . . . . . 34.11 5.6 39.40 5.7 24.87 3.3 23.68 2.4 11.05 0.7 13.13 0.7Loss assets . . . . . . . . . . 0.06 — 0.30 0.1 0.34 0.1 0.49 — 0.97 0.1 1.00 0.1
Total loan assets . . . . . Rs.605.23 100.0% Rs.688.89 100.0% Rs.746.12 100.0% Rs.998.45 100.0% Rs.1,535.54 100.0% Rs.1,655.02 100.0%
(1) Excludes preference shares.
88

The following table sets forth, at the dates indicated, data regarding our non-performing assets, or NPAs.
Year ended Gross NPA(1) Net NPANet customer
assets% of Net NPA to Net
customer assets
(in billions, except percentages)March 31, 2002 . . . . . . . . . . . . . . . . . . . . . . . . . . . . . . Rs.53.25 Rs.27.21 Rs. 575.26 4.73%March 31, 2003 . . . . . . . . . . . . . . . . . . . . . . . . . . . . . . 58.39 31.51 640.51 4.92March 31, 2004 . . . . . . . . . . . . . . . . . . . . . . . . . . . . . . 40.14 20.37 710.02 2.87March 31, 2005 . . . . . . . . . . . . . . . . . . . . . . . . . . . . . . 34.37 19.83 978.94 2.03March 31, 2006(2) . . . . . . . . . . . . . . . . . . . . . . . . . . . . 22.73 10.75 1,520.07 0.71September 30, 2006(2) . . . . . . . . . . . . . . . . . . . . . . . . . 30.37 15.45 1,637.85 0.94
(1) Net of write-offs and interest suspense.(2) Excludes preference shares.
The ratio of net non-performing assets to net customer assets was 0.94% at September 30, 2006 as comparedto 0.71% at March 31, 2006 and 2.03% at March 31, 2005. At September 30, 2006, the gross non-performingassets (net of write-offs and unpaid interest) were Rs. 30.37 billion compared to Rs. 22.73 billion at March 31,2006. Including technical write-offs (provisions considered as write-offs for tax purposes), the grossnon-performing assets at September 30, 2006 were Rs. 37.01 billon compared to Rs. 29.63 billion at March 31,2006. The coverage ratio (i.e. total provisions and technical write-offs made against non-performing assets as apercentage of gross non-performing assets) at September 30, 2006 was 58.3%.
In 1991, India commenced a program of industrial liberalization involving, among other things, theabolition of industrial licensing, reduction in import tariff barriers and greater access for foreign companies to theIndian markets. In the period following the opening up of the economy, a number of Indian companiescommenced large projects in expectation of growth in demand in India. These projects had in general relativelyhigh levels of debt relative to equity, given the inadequate depth in the equity capital markets in India at thattime. During the 1990s, the Indian economy was impacted by negative trends in the global marketplace,particularly in the commodities markets, and recessionary conditions in various economies, which have impairedthe operating environment for the industrial sector in India. The manufacturing sector was also impacted byseveral other factors, including increased competition arising from economic liberalization in India and volatilityin industrial growth and commodity prices. This led to stress on the operating performance of Indian companiesand an increase in the level of non-performing assets in the Indian financial system, including ICICI and us.
Certain Indian corporations have come to terms with this new competitive reality through a process ofrestructuring and repositioning, including rationalization of capital structures and production capacities. Theincrease in commodity prices since fiscal 2003 has had a favorable impact on the operations of corporations inseveral sectors. To create an institutional mechanism for the restructuring of corporate debt, the Reserve Bank ofIndia has devised a corporate debt restructuring system. The objective of this framework is to ensure a timely andtransparent mechanism for the restructuring of corporate debts of viable entities facing problems. The operationof this system led to the approval of restructuring programs for a large number of companies, which led to anincrease in the level of restructured loans in the Indian financial system, including us. The restructured loanscontinue to be classified as such until they complete one year of payment in accordance with the restructuredterms. Our net restructured standard loans were Rs. 49.42 billion at September 30, 2006 compared to Rs. 53.16billion at year-end fiscal 2006 and Rs. 62.63 billion at year-end fiscal 2005.
Non-Performing Asset Strategy
In respect of unviable non-performing assets, where the companies have lost viability, we adopted anaggressive approach aimed at out-of-court settlements, enforcing collateral and driving consolidation. Our focuswas on time value of recovery and a pragmatic approach towards settlements. The strong collateral against ourloan assets has been the critical factor towards the success of our recovery efforts. In addition, we continuallyfocused on proactive management of accounts under watch. Our strategy constituted a proactive approachtowards identification, aimed at early stage solutions to incipient problems.
89

The Securitization Act has strengthened the ability of lenders to resolve non-performing assets by grantingthem greater rights as to enforcement of security and recovery of dues from corporate borrowers. TheSecuritization Act and guidelines issued by the Reserve Bank of India have permitted the setting up of assetreconstruction companies to acquire financial assets by banks and financial institutions. The Reserve Bank ofIndia has issued guidelines to banks on the process to be followed for sales of financial assets to assetreconstruction companies. These guidelines provide that a bank may sell financial assets to an assetreconstruction company provided the asset is a non-performing asset. (See “Supervision and Regulation—Reserve Bank of India Regulations—Regulations relating to Sale of Assets to Asset ReconstructionCompanies”). We sold Rs. 4.79 billion of our net non-performing assets during fiscal 2006 and Rs. 13.28 billionof our net non-performing assets during fiscal 2005 to Asset Reconstruction Company (India) Limited, areconstruction company registered with the Reserve Bank of India. At September 30, 2006, we had anoutstanding net investment of Rs. 24.27 billion (US$ 528 million) in security receipts issued by AssetReconstruction Company (India) Limited in relation to sales of non-performing assets by us to ARCIL. See “RiskFactors—Risks Relating to Our Business—If we are not able to control the level of non-performing assets in ourportfolio, our business will suffer”.
We monitor migration of the credit ratings of our borrowers to enable us to take proactive remedialmeasures to prevent loans from becoming non-performing. We review the industry outlook and analyze theimpact of changes in the regulatory and fiscal environment. Our periodic review system helps us to monitor thehealth of accounts and to take prompt remedial measures. In respect of our retail loans, we adopt a standardizedcollection process to ensure prompt action for follow-up on overdues and recovery of defaulted amounts.
Sector-wise Analysis of Gross Non-Performing Assets
The following table sets forth, at the dates indicated, the composition of gross non-performing assets byindustry sector.
At March 31, At September 30,
2005 2006 2006
Amount % Amount % Amount %
(in billions, except percentages)
Chemicals (including fertilizers & pesticides) . . Rs. 4.02 11.6% Rs. 1.99 8.7% Rs. 2.03 6.6%Agriculture . . . . . . . . . . . . . . . . . . . . . . . . . . . . . . 0.27 0.8 0.80 3.5 1.20 3.9Automobiles (including trucks) . . . . . . . . . . . . . . 0.68 2.0 0.74 3.2 0.74 2.4Iron and steel . . . . . . . . . . . . . . . . . . . . . . . . . . . . 0.67 1.9 0.19 0.8 0.70 2.3Services (excluding finance) . . . . . . . . . . . . . . . . 0.67 1.9 0.81 3.5 0.59 1.9Textiles . . . . . . . . . . . . . . . . . . . . . . . . . . . . . . . . 3.24 9.4 1.26 5.5 0.44 1.5Electronics . . . . . . . . . . . . . . . . . . . . . . . . . . . . . . 1.41 4.1 0.39 1.7 0.33 1.1Food processing . . . . . . . . . . . . . . . . . . . . . . . . . . 0.72 2.1 0.34 1.5 0.19 0.6Engineering . . . . . . . . . . . . . . . . . . . . . . . . . . . . . 1.42 4.1 0.14 0.6 0.10 0.3Other metal & metal products . . . . . . . . . . . . . . . 0.38 1.1 0.04 0.2 0.09 0.3Paper and paper products . . . . . . . . . . . . . . . . . . 0.35 1.0 0.05 0.2 0.05 0.2Power . . . . . . . . . . . . . . . . . . . . . . . . . . . . . . . . . . 7.37 21.3 — — — —Road/port/railways & other infrastructure . . . . . 2.14 6.2 — — — —Services—finance . . . . . . . . . . . . . . . . . . . . . . . . 0.77 2.2 — — — —Cement . . . . . . . . . . . . . . . . . . . . . . . . . . . . . . . . . 0.20 0.6 — — — —Retail finance . . . . . . . . . . . . . . . . . . . . . . . . . . . . 8.08 23.3 14.29 62.3 21.17 69.1Other industries . . . . . . . . . . . . . . . . . . . . . . . . . . 2.21 6.4 1.91 8.3 3.00 9.8
Total . . . . . . . . . . . . . . . . . . . . . . . . . . . . . . . . . . Rs.34.60 100.0% Rs.22.95 100.0% Rs.30.63 100.0%Interest suspense . . . . . . . . . . . . . . . . . . . . . . . . . (0.23) (0.22) (0.26)
Gross non-performing assets . . . . . . . . . . . . . . . . Rs.34.37 Rs.22.73 Rs.30.37
90

Gross retail non-performing assets increased from Rs. 8.08 billion (US$ 176 million) at year-end fiscal 2005to Rs. 14.29 billion (US$ 311 million) at year-end fiscal 2006 and Rs. 21.17 billion (US$ 461 million) atSeptember 30, 2006, primarily due to the growth of the retail portfolio. The net non-performing assets in theretail portfolio at September 30, 2006 were 0.98% of net retail assets. Retail non-performing loans constituted69.1% of total non-performing assets at September 30, 2006 compared to 62.3% at year-end fiscal 2006 and23.3% at year-end fiscal 2005, due to a reduction in non-performing loans, excluding retail loans, and an increasein retail non-performing loans in line with the growth in the retail portfolio.
The following table sets forth, at the dates indicated, our gross non-performing rupee and foreign currencycustomer asset portfolio by business category.
At March 31, At September 30,
2002 2003 2004 2005 2006 2006
(in billions, except percentages)
Consumer loans & creditcard receivables . . . . . . . . Rs. 0.14 Rs. 0.94 Rs. 3.40 Rs. 8.08 Rs. 14.29 Rs. 21.17
Rupee . . . . . . . . . . . . . . . . . . . 0.14 0.94 3.40 8.08 14.29 21.17Foreign currency . . . . . . . . . . . — — — — — —Commercial, financial,
agricultural & others(1) . . 48.93 52.70 32.58 23.63 5.66 5.06Rupee . . . . . . . . . . . . . . . . . . . 32.93 37.76 25.59 20.07 3.65 3.94Foreign currency . . . . . . . . . . . 16.00 14.94 6.99 3.56 2.01 1.12Working capital finance . . . . 4.00 4.78 4.54 2.81 2.94 4.07Rupee . . . . . . . . . . . . . . . . . . . 4.00 4.78 4.54 2.81 2.94 4.07Foreign currency . . . . . . . . . . . — — — — — —Leasing and related
activities . . . . . . . . . . . . . . . 0.62 0.46 0.12 0.08 0.06 0.33Rupee . . . . . . . . . . . . . . . . . . . 0.62 0.46 0.12 0.08 0.06 0.33Foreign currency . . . . . . . . . . . — — — — — —Total non-performing assetsRupee . . . . . . . . . . . . . . . . . . . 37.69 43.94 33.65 31.04 20.94 29.51Foreign currency . . . . . . . . . . . 16.00 14.94 6.99 3.56 2.01 1.12
Gross non-performingassets . . . . . . . . . . . . . . . . . 53.69 58.88 40.64 34.60 22.95 30.63
Provisions . . . . . . . . . . . . . . . . (26.00) (26.88) (19.77) (14.49) (11.93) (14.87)
Interest Suspended & ECGCclaims(2) . . . . . . . . . . . . . . . (0.48) (0.49) (0.50) (0.28) (0.27) (0.31)
Net non-performingassets . . . . . . . . . . . . . . . . . Rs. 27.21 Rs. 31.51 Rs. 20.37 Rs. 19.83 Rs. 10.75 Rs. 15.45
Gross customer assets . . . . . . . Rs.605.19 Rs.690.81 Rs.746.62 Rs.998.68 Rs.1,535.77 Rs.1,655.29Net customer assets . . . . . . . . 575.26 640.51 710.02 978.94 1,520.07 1,637.85Gross non-performing assets
as a percentage of grosscustomer assets . . . . . . . . . . 8.87% 8.52% 5.44% 3.46% 1.49% 1.85%
Net non-performing assets asa percentage of netcustomer assets . . . . . . . . . . 4.73% 4.92% 2.87% 2.03% 0.71% 0.94%
(1) Includes project finance, corporate finance and receivables financing, excluding leasing and relatedactivities.
(2) Including amounts claimed as recoverable from Export Credit Guarantee Corporation of India.
91

Provisions for Loan Losses (non-performing loans)
The following table sets forth, at the dates indicated, movement in our allowances for loan losses.
At March 31, At September 30,
2005 2006 2006
(in billions)
Aggregate provisions for loan losses at the beginning of the year . . . . . Rs. 19.77 Rs. 14.49 Rs.11.93Add: Provisions for loan lossesConsumer loans & credit card receivables finance . . . . . . . . . . . . . . . . . 4.30 1.92(1) 3.31Commercial, financial, agricultural & others(2) . . . . . . . . . . . . . . . . . . . . (0.48) 0.90 0.47Working capital finance . . . . . . . . . . . . . . . . . . . . . . . . . . . . . . . . . . . . . . 0.96 0.61 0.26Leasing and related activities . . . . . . . . . . . . . . . . . . . . . . . . . . . . . . . . . . (0.01) (0.02) 0.02Total provisions for loan losses, net of releases of provisions as a result
of cash collections . . . . . . . . . . . . . . . . . . . . . . . . . . . . . . . . . . . . . . . . Rs. 24.54 Rs. 17.90 Rs.15.99Loans charged-off . . . . . . . . . . . . . . . . . . . . . . . . . . . . . . . . . . . . . . . . . . (10.05) (5.97) (1.12)
Aggregate provisions for loan losses at the end of the year . . . . . . . . . . Rs. 14.49 Rs. 11.93 Rs.14.87
(1) Net off Rs. 1.69 billion on reassessment of provisioning requirement on performing loans andnon-performing loans on a portfolio basis.
(2) Includes project finance, corporate finance and receivables financing, excluding leasing and relatedactivities.
Funding
Our funding operations are designed to ensure stability of funding, minimize funding costs and effectivelymanage liquidity. Since the amalgamation of ICICI with us, our primary source of funding has been depositsraised from both retail and corporate customers. We also raise funds through short-term rupee borrowings andpublic issuance of bonds because ICICI was not allowed to raise banking deposits as a financial institution and soits primary sources of funding prior to the amalgamation were rupee borrowings from a wide range ofinstitutional investors and retail bonds. ICICI also raised funds through foreign currency borrowings fromcommercial banks and other multilateral institutions like the Asian Development Bank and the World Bank,which were guaranteed by the government of India.
Our deposits were 67.1% of our total liabilities at September 30, 2006 and 65.7% of our total liabilities atyear-end fiscal 2006 and 59.5% at year-end fiscal 2005. Our borrowings (including subordinated debt) were18.3% of our total liabilities at September 30, 2006, 19.4% of our total liabilities at year-end fiscal 2006 and24.9% at year-end fiscal 2005.
Our deposits increased by 14.8% to Rs. 1,894.99 billion (US$ 41.2 billion) at September 30, 2006 ascompared to Rs. 1,650.83 billion (US$ 35.9 billion) at year-end March 31, 2006, primarily through increasedfocus on retail and corporate customers by offering a wide range of products designed to meet varied individualand corporate needs and leveraging on our network of branches, extension counters and ATMs.
The following table sets forth, at the dates indicated, our outstanding deposits and the percentagecomposition for each category of deposits.
March 31, 2005 March 31, 2006 September 30, 2006
Amount % of total Amount % of total Amount % of total
(in billions, except percentages)
Other demand deposits . . . . . . . . . . . Rs.128.37 12.9 Rs. 165.73 10.0 Rs. 148.19 7.8Savings deposits . . . . . . . . . . . . . . . . 113.92 11.4 209.37 12.7 271.77 14.3Time deposits . . . . . . . . . . . . . . . . . . 755.90 75.7 1,275.73 77.3 1,475.03 77.9
Total deposits . . . . . . . . . . . . . . . . . Rs.998.19 100.0 Rs.1,650.83 100.0 Rs.1,894.99 100.0
92
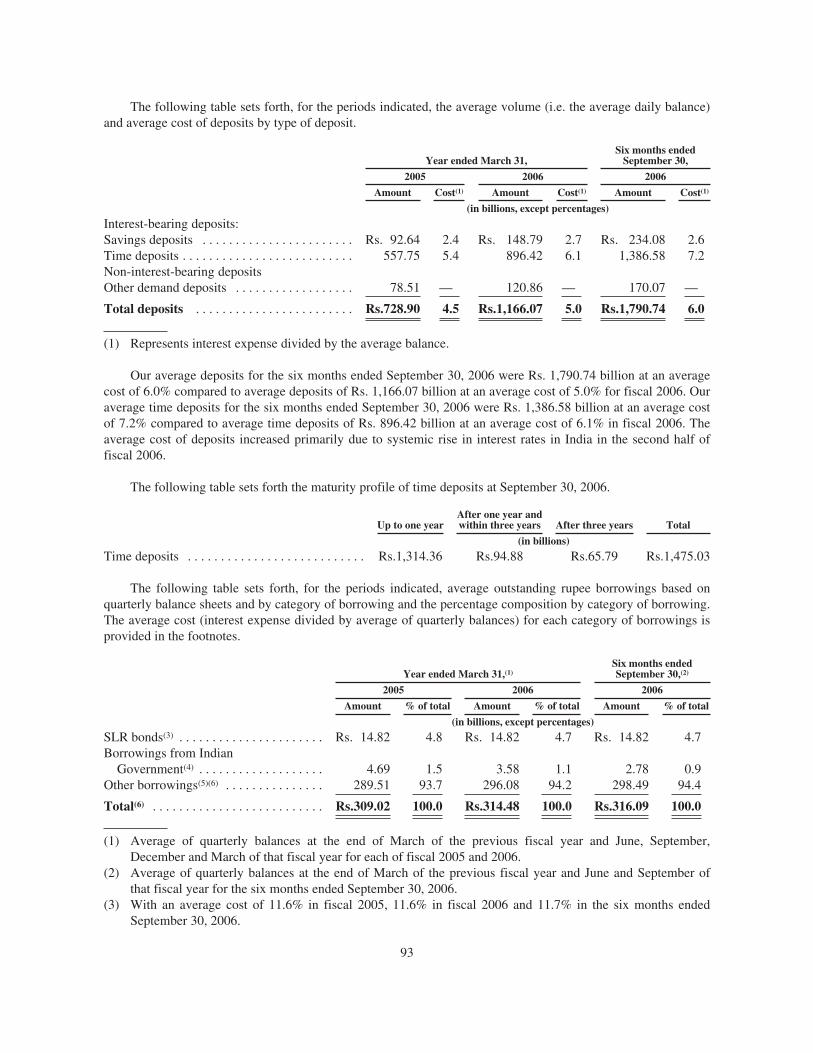
The following table sets forth, for the periods indicated, the average volume (i.e. the average daily balance)and average cost of deposits by type of deposit.
Year ended March 31,Six months ended
September 30,
2005 2006 2006
Amount Cost(1) Amount Cost(1) Amount Cost(1)
(in billions, except percentages)
Interest-bearing deposits:Savings deposits . . . . . . . . . . . . . . . . . . . . . . . Rs. 92.64 2.4 Rs. 148.79 2.7 Rs. 234.08 2.6Time deposits . . . . . . . . . . . . . . . . . . . . . . . . . . 557.75 5.4 896.42 6.1 1,386.58 7.2Non-interest-bearing depositsOther demand deposits . . . . . . . . . . . . . . . . . . 78.51 — 120.86 — 170.07 —
Total deposits . . . . . . . . . . . . . . . . . . . . . . . . Rs.728.90 4.5 Rs.1,166.07 5.0 Rs.1,790.74 6.0
(1) Represents interest expense divided by the average balance.
Our average deposits for the six months ended September 30, 2006 were Rs. 1,790.74 billion at an averagecost of 6.0% compared to average deposits of Rs. 1,166.07 billion at an average cost of 5.0% for fiscal 2006. Ouraverage time deposits for the six months ended September 30, 2006 were Rs. 1,386.58 billion at an average costof 7.2% compared to average time deposits of Rs. 896.42 billion at an average cost of 6.1% in fiscal 2006. Theaverage cost of deposits increased primarily due to systemic rise in interest rates in India in the second half offiscal 2006.
The following table sets forth the maturity profile of time deposits at September 30, 2006.
Up to one yearAfter one year andwithin three years After three years Total
(in billions)
Time deposits . . . . . . . . . . . . . . . . . . . . . . . . . . . Rs.1,314.36 Rs.94.88 Rs.65.79 Rs.1,475.03
The following table sets forth, for the periods indicated, average outstanding rupee borrowings based onquarterly balance sheets and by category of borrowing and the percentage composition by category of borrowing.The average cost (interest expense divided by average of quarterly balances) for each category of borrowings isprovided in the footnotes.
Year ended March 31,(1)Six months endedSeptember 30,(2)
2005 2006 2006
Amount % of total Amount % of total Amount % of total
(in billions, except percentages)
SLR bonds(3) . . . . . . . . . . . . . . . . . . . . . . Rs. 14.82 4.8 Rs. 14.82 4.7 Rs. 14.82 4.7Borrowings from Indian
Government(4) . . . . . . . . . . . . . . . . . . . 4.69 1.5 3.58 1.1 2.78 0.9Other borrowings(5)(6) . . . . . . . . . . . . . . . 289.51 93.7 296.08 94.2 298.49 94.4
Total(6) . . . . . . . . . . . . . . . . . . . . . . . . . . Rs.309.02 100.0 Rs.314.48 100.0 Rs.316.09 100.0
(1) Average of quarterly balances at the end of March of the previous fiscal year and June, September,December and March of that fiscal year for each of fiscal 2005 and 2006.
(2) Average of quarterly balances at the end of March of the previous fiscal year and June and September ofthat fiscal year for the six months ended September 30, 2006.
(3) With an average cost of 11.6% in fiscal 2005, 11.6% in fiscal 2006 and 11.7% in the six months endedSeptember 30, 2006.
93
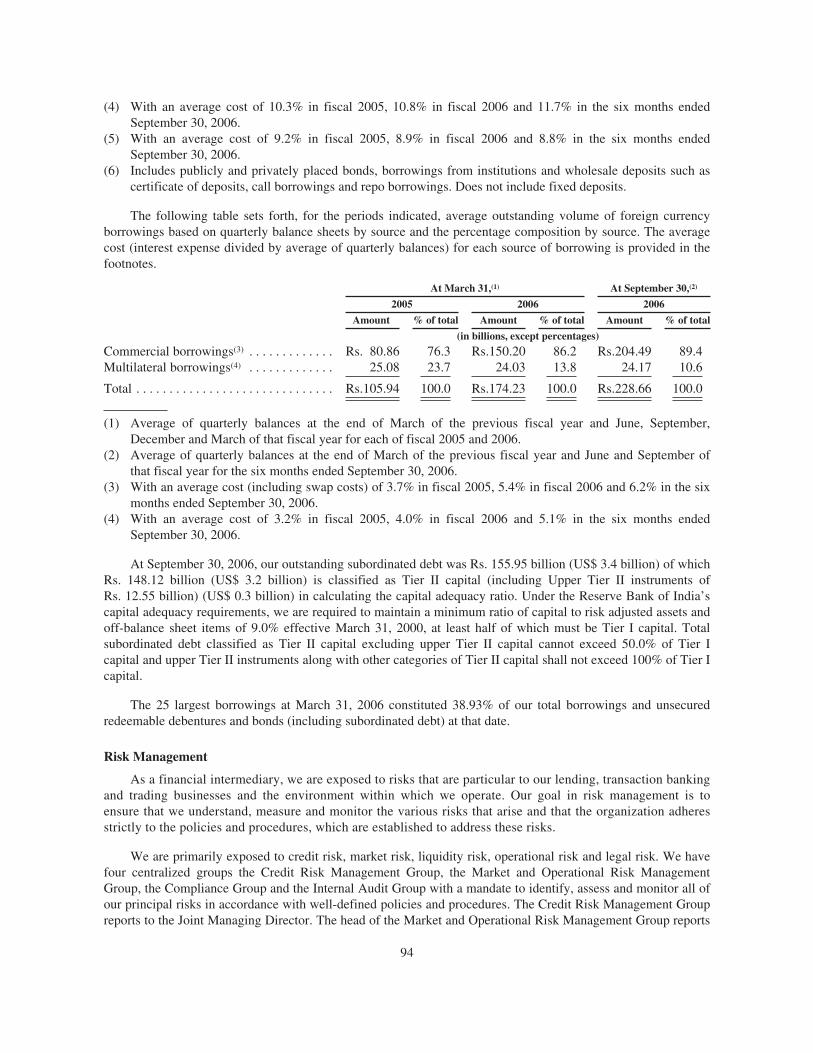
(4) With an average cost of 10.3% in fiscal 2005, 10.8% in fiscal 2006 and 11.7% in the six months endedSeptember 30, 2006.
(5) With an average cost of 9.2% in fiscal 2005, 8.9% in fiscal 2006 and 8.8% in the six months endedSeptember 30, 2006.
(6) Includes publicly and privately placed bonds, borrowings from institutions and wholesale deposits such ascertificate of deposits, call borrowings and repo borrowings. Does not include fixed deposits.
The following table sets forth, for the periods indicated, average outstanding volume of foreign currencyborrowings based on quarterly balance sheets by source and the percentage composition by source. The averagecost (interest expense divided by average of quarterly balances) for each source of borrowing is provided in thefootnotes.
At March 31,(1) At September 30,(2)
2005 2006 2006
Amount % of total Amount % of total Amount % of total
(in billions, except percentages)
Commercial borrowings(3) . . . . . . . . . . . . . Rs. 80.86 76.3 Rs.150.20 86.2 Rs.204.49 89.4Multilateral borrowings(4) . . . . . . . . . . . . . 25.08 23.7 24.03 13.8 24.17 10.6
Total . . . . . . . . . . . . . . . . . . . . . . . . . . . . . . Rs.105.94 100.0 Rs.174.23 100.0 Rs.228.66 100.0
(1) Average of quarterly balances at the end of March of the previous fiscal year and June, September,December and March of that fiscal year for each of fiscal 2005 and 2006.
(2) Average of quarterly balances at the end of March of the previous fiscal year and June and September ofthat fiscal year for the six months ended September 30, 2006.
(3) With an average cost (including swap costs) of 3.7% in fiscal 2005, 5.4% in fiscal 2006 and 6.2% in the sixmonths ended September 30, 2006.
(4) With an average cost of 3.2% in fiscal 2005, 4.0% in fiscal 2006 and 5.1% in the six months endedSeptember 30, 2006.
At September 30, 2006, our outstanding subordinated debt was Rs. 155.95 billion (US$ 3.4 billion) of whichRs. 148.12 billion (US$ 3.2 billion) is classified as Tier II capital (including Upper Tier II instruments ofRs. 12.55 billion) (US$ 0.3 billion) in calculating the capital adequacy ratio. Under the Reserve Bank of India’scapital adequacy requirements, we are required to maintain a minimum ratio of capital to risk adjusted assets andoff-balance sheet items of 9.0% effective March 31, 2000, at least half of which must be Tier I capital. Totalsubordinated debt classified as Tier II capital excluding upper Tier II capital cannot exceed 50.0% of Tier Icapital and upper Tier II instruments along with other categories of Tier II capital shall not exceed 100% of Tier Icapital.
The 25 largest borrowings at March 31, 2006 constituted 38.93% of our total borrowings and unsecuredredeemable debentures and bonds (including subordinated debt) at that date.
Risk Management
As a financial intermediary, we are exposed to risks that are particular to our lending, transaction bankingand trading businesses and the environment within which we operate. Our goal in risk management is toensure that we understand, measure and monitor the various risks that arise and that the organization adheresstrictly to the policies and procedures, which are established to address these risks.
We are primarily exposed to credit risk, market risk, liquidity risk, operational risk and legal risk. We havefour centralized groups the Credit Risk Management Group, the Market and Operational Risk ManagementGroup, the Compliance Group and the Internal Audit Group with a mandate to identify, assess and monitor all ofour principal risks in accordance with well-defined policies and procedures. The Credit Risk Management Groupreports to the Joint Managing Director. The head of the Market and Operational Risk Management Group reports
94

to the group Chief Financial Officer. The Compliance Group reports to the Audit Committee of the Board ofDirectors and the Managing Director and CEO. The Internal Audit Group reports to the Joint Managing Directorand to the Audit Committee of the Board of Directors. These groups are independent of the business units andcoordinate with representatives of the business units to implement our risk management methodologies.Committees of the board of directors have been constituted to oversee the various risk management activities.The Audit Committee provides direction to and also monitors the quality of the internal audit function. The RiskCommittee reviews risk management policies in relation to various risks including portfolio, liquidity, interestrate, investment policies and strategy, and regulatory and compliance issues in relation thereto. The CreditCommittee reviews developments in key industrial sectors and our exposure to these sectors as well as to largeborrower accounts. The Asset Liability Management Committee is responsible for managing the balance sheetand reviewing the asset-liability position to manage our liquidity and market risk exposure. For a discussion ofthese and other committees, see “Management”.
The Credit Risk Management Group has a separate team for risk management in respect of small andmedium enterprises. The Compliance Group is responsible for the regulatory and anti money launderingcompliance of ICICI Bank.
Credit Risk
Our credit policy is approved by our board of directors. In our lending operations, we are principallyexposed to credit risk. Credit risk is the risk of loss that may occur from the failure of any party to abide by theterms and conditions of any financial contract with us, principally the failure to make required payments on loansdue to us. We currently measure, monitor and manage credit risk for each borrower and at the portfolio level. Wehave a structured and standardized credit approval process, which includes a well-established procedure ofcomprehensive credit appraisal.
Credit Risk Assessment Procedures for Corporate Loans
In order to assess the credit risk associated with any financing proposal, we assess a variety of risks relatingto the borrower and the relevant industry. Borrower risk is evaluated by considering:
• the financial position of the borrower by analyzing the quality of its financial statements, its pastfinancial performance, its financial flexibility in terms of ability to raise capital, and its cash flowadequacy;
• the borrower’s relative market position and operating efficiency; and
• the quality of management by analyzing its track record, payment record and financial conservatism.
Industry risk is evaluated by considering:
• certain industry characteristics, such as the importance of the industry to the economy, its growthoutlook, cyclicality and government policies relating to the industry;
• the competitiveness of the industry; and
• certain industry financials, including return on capital employed, operating margins and earningsstability.
After conducting an analysis of a specific borrower’s risk, the Credit Risk Management Group assigns acredit rating to the borrower. We have a scale of 10 ratings ranging from AAA to B, an additional default ratingof D and short-term ratings from S1 to S8. Credit rating is a critical input for the credit approval process. Wedetermine the desired credit risk spread over its cost of funds by considering the borrower’s credit rating and thedefault pattern corresponding to the credit rating. Every proposal for a financing facility is prepared by therelevant business unit and reviewed by the appropriate industry specialists in the Credit Risk Management Group
95

before being submitted for approval to the appropriate approval authority. The approval process for non-fundfacilities is similar to that for fund-based facilities. The credit rating for every borrower is reviewed at leastannually. We also review the ratings of all borrowers in a particular industry upon the occurrence of anysignificant event impacting that industry.
Working capital loans are generally approved for a period of 12 months. At the end of the 12 month validityperiod (18 months in the case of borrowers rated AA- and above), we review the loan arrangement and the creditrating of the borrower and take a decision on continuation of the arrangement and changes in the loan covenantsas may be necessary.
Project Finance Procedures
We have a strong framework for the appraisal and execution of project finance transactions. We believe thatthis framework creates optimal risk identification, allocation and mitigation, and helps minimize residual risk.
The project finance approval process begins with a detailed evaluation of technical, commercial, financial,marketing and management factors and the sponsor’s financial strength and experience. Once this review iscompleted, an appraisal memorandum is prepared for credit approval purposes. As part of the appraisal process, arisk matrix is generated, which identifies each of the project risks, mitigating factors and residual risks associatedwith the project. The appraisal memorandum analyzes the risk matrix and establishes the viability of the project.Typical risk mitigating factors include the commitment of stand-by funds from the sponsors to meet any costover-runs and a conservative collateral position. After credit approval, a letter of intent is issued to the borrower,which outlines the principal financial terms of the proposed facility, sponsor obligations, conditions precedent todisbursement, undertakings from and covenants on the borrower. After completion of all formalities by theborrower, a loan agreement is entered into with the borrower.
In addition to the above, in the case of structured project finance in areas such as infrastructure, oil, gas andpetrochemicals, as a part of the due diligence process, we appoint consultants, wherever considered necessary, toadvise the lenders, including technical advisors, business analysts, legal counsel and insurance consultants. Theseconsultants are typically internationally recognized and experienced in their respective fields. Risk mitigatingfactors in these financings generally also include creation of debt service reserves by borrowers and channelingproject revenues through a trust and retention account.
Our project finance credits are generally fully secured and have full recourse to the borrower. In most cases,we have a security interest and first lien on all the fixed assets and a second lien on all the current assets of theborrower. Security interests typically include property, plant and equipment as well as other tangible assets of theborrower, both present and future. Our borrowers are required to maintain comprehensive insurance on theirassets where we are recognized as payee in the event of loss. In some cases, we also take additional collateral inthe form of corporate or personal guarantees from one or more sponsors of the project and a pledge of thesponsors’ equity holding in the project company. In certain industry segments, we also take security interest inrelevant project contracts such as concession agreements, off-take agreements and construction contracts as partof the security package. In limited cases, loans are also guaranteed by commercial banks and, in the past, havealso been guaranteed by Indian state governments or the Government of India.
It is our current practice to normally disburse funds after the entire project funding is committed and allnecessary contractual arrangements have been entered into. Funds are disbursed in tranches to pay for approvedproject costs as the project progresses. When we appoint technical and market consultants, they are required tomonitor the project’s progress and certify all disbursements. We also require the borrower to submit periodicreports on project implementation, including orders for machinery and equipment as well as expenses incurred.Project completion is contingent upon satisfactory operation of the project for a certain minimum period and, incertain cases, the establishment of debt service reserves. We continue to monitor the credit exposure until itsloans are fully repaid.
96

Corporate Finance Procedures
As part of the corporate loan approval procedures, we carry out a detailed analysis of funding requirements,including normal capital expenses, long-term working capital requirements and temporary imbalances inliquidity. Our funding of long-term core working capital requirements is assessed on the basis, among otherthings, of the borrower’s present and proposed level of inventory and receivables. In case of corporate loans forother funding requirements, we undertake a detailed review of those requirements and an analysis of cash flows.A substantial portion of our corporate finance loans are secured by a lien on appropriate assets of the borrower.
The focus of our structured corporate finance products is on cash flow based financing. We have a set ofdistinct approval procedures to evaluate and mitigate the risks associated with such products. These proceduresinclude:
• carrying out a detailed analysis of cash flows to accurately forecast the amounts that will be paid andthe timing of the payments based on an exhaustive analysis of historical data;
• conducting due diligence on the underlying business systems, including a detailed evaluation of theservicing and collection procedures and the underlying contractual arrangements; and
• paying particular attention to the legal, accounting and tax issues that may impact any structure.
Our analysis enables us to identify risks in these transactions. To mitigate risks, we use various creditenhancement techniques, such as over-collateralization, cash collateralization, creation of escrow accounts anddebt service reserves and performance guarantees. The residual risk is typically managed by complete or partialrecourse to the borrowing company whose credit risk is evaluated as described above. We also have a monitoringframework to enable continuous review of the performance of such transactions.
Working Capital Finance Procedures
We carry out a detailed analysis of our borrowers’ working capital requirements. Credit limits areestablished in accordance with the approval authorized by our board of directors. Once credit limits are approved,we calculate the amounts that can be lent on the basis of monthly statements provided by the borrower and themargins stipulated. Quarterly information statements are also obtained from borrowers to monitor theperformance on a regular basis. Monthly cash flow statements are obtained where considered necessary. Anyirregularity in the conduct of the account is reported to the appropriate authority on a monthly basis. Credit limitsare reviewed on a periodic basis.
Working capital facilities are primarily secured by inventories and receivables. Additionally, in certaincases, these credit facilities are secured by personal guarantees of directors, or subordinated security interests inthe tangible assets of the borrower including plant and machinery.
Credit Monitoring Procedures for Corporate Loans
The Credit Middle Office Group monitors compliance with the terms and conditions for credit facilitiesprior to disbursement. It also reviews the completeness of documentation, creation of security and insurancepolicies for assets financed. All borrower accounts are reviewed at least once a year.
Retail Loan Procedures
Our customers for retail loans are typically middle and high-income, salaried or self-employed individuals,and, in some cases, partnerships and corporations. Except for personal loans and credit cards, we require acontribution from the borrower and our loans are secured by the asset financed.
Our retail credit product operations are sub-divided into various product lines. Each product line is furthersub-divided into separate sales and credit groups. The Risk Management Group, which is independent of the
97

business groups, approves all new retail products and product policies and credit approval authorizations. Allproducts and policies require the approval of the Retail Credit Forum comprised of senior managers. All creditapproval authorizations require the approval of our board of directors.
We use direct marketing associates as well as our own branch network and employees for marketing retailcredit products. However, credit approval authority lies only with our credit officers who are distinct from thebusiness teams. The delegation of credit approval authority is linked, among other factors, to the size of the creditand the authority delegated to credit officers varies across different products.
Our credit officers evaluate credit proposals on the basis of the product policy approved by the Retail CreditForum and the risk assessment criteria defined by the Risk Management Group. These criteria vary acrossproduct segments but typically include factors such as the borrower’s income, the loan-to-value ratio,demographic parameters and certain stability factors. In the case of credit cards, in order to limit the scope ofindividual discretion, we have implemented a credit-scoring program that is an automated credit approval systemthat assigns a credit score to each applicant based on certain demographic attributes like income, educationalbackground and age. The credit score then forms the basis of loan evaluation. External agencies such as fieldinvestigation agencies and credit processing agencies are used to facilitate a comprehensive due diligence processincluding visits to offices and homes in the case of loans to individual borrowers. Before disbursements aremade, the credit officer checks a centralized delinquent database and reviews the borrower’s profile. We avail ofthe services of certain private agencies in India to check applications before disbursement, as a formal nationalcredit bureau has only recently become operational in India. A centralized retail credit team undertakes reviewand audit of credit quality and processes across each credit approval team.
We have established centralized operations to manage operating risk in the various back office processes ofour retail loan business except for a few operations, which are decentralized to improve turnaround time forcustomers.
We have a collections unit structured along various product lines and geographical locations, to managedelinquency levels. The collections unit operates under the guidelines of a standardized recovery process. Wealso make use of external collection agencies to aid it in collection efforts, including collateral repossession inaccounts that are overdue for more than 90 days. External agencies for collections are governed by standardizedprocess guidelines.
A fraud prevention and control department has been set up to manage levels of fraud, primarily throughfraud prevention in the form of forensic audits and also through recovery of fraud losses. The fraud controldepartment is aided by specialized agencies involved in verification of income documents. The fraud controldepartment also evaluates the various external agencies involved in the retail finance operations, including directmarketing associates, external verification associates and collection agencies.
Small Enterprises Loan Procedures
The Small Enterprises Group finances dealers and vendors of companies by implementing structures toenhance the base credit quality of the vendor/dealer, that involve an analysis of the base credit quality of thevendor/dealer pool and an analysis of the linkages that exist between the vendor/dealer and the company.
The group is also involved in financing based on a cluster-based approach, that is, financing of smallenterprises that have a homogeneous profile such as apparel manufacturers and manufacturers ofpharmaceuticals. The risk assessment of such cluster involves identification of appropriate credit norms for targetmarket, use of scoring models for enterprises that satisfy these norms and applying pre-determined exposurelimits to enterprises that are awarded a minimum required score in the scoring model. The assessment alsoinvolves setting up of portfolio control norms, individual borrower approval norms as well as stringent reviewand exit triggers to be followed while financing such clusters or communities.
98

Rural and Agricultural Loan Procedures
The rural and agricultural loan portfolio comprises corporates in the rural sector, small and mediumenterprises, dealers and vendors linked to these entities and farmers. We have designed appropriate riskassessment methodologies for each of the segments. For corporates, borrower risk is evaluated by analyzing theindustry risk, the borrower’s market position, financial performance, cash flow adequacy and the quality ofmanagement. The credit risk of dealers, vendors and farmers is evaluated by analyzing the base credit quality ofthe borrowers or the pool and also the linkages between the borrowers and the companies to which the dealers,vendors or farmers are supplying their produce. We attempt to enhance the credit quality of the pool of dealers,vendors and farmers by strengthening the structure of the transaction.
For some segments, we use a cluster-based approach wherein a lending program is implemented for ahomogeneous group of individuals or business entities that comply with certain laid down parameterized norms.To be eligible for funding under the programs, the borrowers need to meet the stipulated credit norms and obtaina minimum score on the scoring model. We have incorporated control norms, borrower approval norms andreview triggers in all the programs.
Credit Approval Authorities
Our credit approval authorization framework is laid down by our board of directors. We have establishedseveral levels of credit approval authorities for our corporate banking activities—the Credit Committee of theboard of directors, the Committee of Directors, the Committee of Executives (Credit) and the RegionalCommittee (Credit). Retail Credit Forums, Small Enterprise Group Forums and Agri Credit Forums have beencreated for approval of retail loans, credit facilities to small enterprises and agri-based enterprises, respectively.
Our board of directors has delegated the authority to the Credit Committee, consisting of a majority ofindependent directors, the Committee of Directors, consisting of our wholetime directors, to the Committee ofExecutives (Credit), to the Regional Committee (Credit), Retail Credit Forums, Small Enterprise Group Forumsand Agri Credit Forums, all consisting of our designated executives, and to individual executives in the case ofretail, small enterprise, agricultural loans and loans against securities, to approve financial assistance withincertain individual and group exposure limits set by the board of directors.
Quantitative and Qualitative Disclosures About Market Risk
Market risk is the possibility of loss arising from changes in the value of a financial instrument as a result ofchanges in market variables such as interest rates, exchange rates and other asset prices. The prime source ofmarket risk for us is the interest rate risk we are exposed to as a financial intermediary. In addition to interest raterisk, we are exposed to other elements of market risk such as liquidity or funding risk, price risk on tradingportfolios, and exchange rate risk on foreign currency positions.
Market Risk Management Procedures
Our board of directors reviews and approves the policies for the management of market risk. The board hasdelegated the responsibility for market risk management on the banking book to the Asset Liability ManagementCommittee and for the trading book to the Committee of Directors, within the broad parameters laid down bypolicies approved by the board. The Asset Liability Management Committee is responsible for managing interestrate risk on the banking book and liquidity risks reflected in the balance sheet. The Committee of Directors isresponsible for formulating policies and risk controls for the trading book.
The Asset Liability Management Committee is chaired by the Joint Managing Director. The DeputyManaging Directors and the Executive Director are the other members of the Committee. The Committeegenerally meets on a monthly basis and reviews the interest rate and liquidity gap positions on the banking book,formulates a view on interest rates, sets deposit and benchmark lending rates, reviews the business profile and its
99

impact on asset liability management and determines the asset liability management strategy, as deemed fit, inlight of the current and expected business environment. The Structural Rate Risk Management Group andBalance Sheet Management Group are responsible for managing interest rate risk and liquidity risk, under thesupervision of the Asset Liability Management Committee, on a day to day basis.
The Market Risk Management Group recommends changes in risk policies and controls and the processesand methodologies for quantifying and assessing market risks. Risk limits including position limits and stop losslimits for the trading book are monitored on a daily basis by the Treasury Middle Office Group and reviewedperiodically.
Interest Rate Risk
Since our balance sheet consists predominantly of rupee assets and liabilities, movements in domesticinterest rates constitute the main source of interest rate risk. The value of our portfolio of traded and other debtsecurities is negatively impacted by an increase in interest rates, while our net interest income is generallypositively impacted by an increase in interest rates. For a discussion on our vulnerability to interest rate risk, see“Risk Factors—Risk Relating to Our Business—Our business is particularly vulnerable to interest rate risk andvolatility in interest rates could adversely affect our net interest margin, the value of our fixed income portfolio,our income from treasury operations and our financial performance.” and “Risk Factors—Risk Relating to OurBusiness—We are subject to credit, market and liquidity risk which may have an adverse effect on our creditratings and our cost of funds.” Exposure to fluctuations in interest rates is measured primarily by way of gapanalysis, providing a static view of the maturity and re-pricing characteristics of balance sheet positions. Aninterest rate gap report is prepared by classifying all assets and liabilities into various time period categoriesaccording to contracted maturities or anticipated re-pricing date. The difference in the amount of assets andliabilities maturing or being re-priced in any time period category, would then give an indication of the extent ofexposure to the risk of potential changes in the margins on new or re-priced assets and liabilities. We prepareinterest rate risk reports on a fortnightly basis. These reports are submitted to the Reserve Bank of India on amonthly basis. Interest rate risk is further monitored through interest rate risk limits approved by the AssetLiability Management Committee.
Our core business is deposit taking and lending in both rupees and foreign currencies, as permitted by theReserve Bank of India. These activities expose us to interest rate risk. As the rupee market is significantlydifferent from the international currency markets, gap positions in these markets differ significantly.
Our primary source of funding is deposits and, to a smaller extent, borrowings. In the rupee market, most ofour deposit taking is at fixed rates of interest for fixed periods, except for savings deposits and current deposits,which do not have any specified maturity and can be withdrawn on demand. We usually borrow for a fixedperiod with a one-time repayment on maturity, with some borrowings having European call/put options,exercisable only on specified dates, attached to them. However, we have a mix of floating and fixed interest rateassets. Our loans generally are repaid more gradually, with principal repayments being made over the life of theloan. Our housing loans at September 30, 2006 were primarily floating rate loans where any change in thebenchmark rate with reference to which these loans are priced, is generally passed on to the borrower on the firstday of the succeeding quarter. Until December 31, 2003, we followed a four-tier prime rate structure, namely, ashort-term prime rate for one-year loans or loans that re-price at the end of one year, a medium-term prime ratefor one to three year loans, a long-term prime rate for loans with maturities greater than three years, and a primerate for cash credit products. Effective January 1, 2004, we have moved to a single benchmark prime ratestructure for all loans other than specific categories of loans advised by the Indian Banks’ Association (whichinclude, among others, loans to individuals for acquiring residential properties, loans for purchase of consumerdurables, non-priority sector personal loans and loans to individuals against shares, debentures, bonds and othersecurities), with lending rates comprising the benchmark prime rate, term premia and transaction-specific creditand other charges. Interest rates on loans outstanding at December 31, 2003 continue to be based on the four-tierprime rate structure. We seek to eliminate interest rate risk on undisbursed commitments by fixing interest rateson rupee loans at the time of loan disbursement.
100

In contrast to our rupee loans, a large proportion of our foreign currency loans are floating rate loans. Theseloans are generally funded with floating rate foreign currency funds. Our fixed rate foreign currency loans aregenerally funded with fixed rate foreign currency funds. We generally convert all our foreign currencyborrowings and deposits into floating rate dollar liabilities through the use of interest rate and currency swapswith leading international banks. The foreign currency gaps are generally significantly lower than rupee gaps,representing a considerably lower exposure to fluctuations in foreign currency interest rates.
We use the duration of our government securities portfolio as a key variable for interest rate risk management.We increase or decrease the duration of government securities portfolio to increase or decrease our interest rate riskexposure. In addition, we also use interest rate derivatives to manage asset and liability positions. We are an activeparticipant in the interest rate swap market and are one of the largest counterparties in India.
The following table sets forth our asset-liability gap position at September 30, 2006(5).
Maturity buckets <1 year 1 to 3 years 3 to 5 years > 5 years Not sensitive Total
(in billions)InflowsLoans & advances . . . . . . . . . . . . . . . . . . . . 1,084.67 299.78 83.52 80.99 5.08 1,554.04Investments . . . . . . . . . . . . . . . . . . . . . . . . . 339.83 128.91 114.19 110.75 136.24 829.92Cash/Reserve Bank of India balances . . . . — — — — 145.10 145.10Balances with banks, call and term
money(1) . . . . . . . . . . . . . . . . . . . . . . . . . 75.78 — 0.41 0.33 16.64 93.16Fixed assets(2) . . . . . . . . . . . . . . . . . . . . . . . 2.28 3.94 3.83 0.55 28.63 39.23Other assets(6) . . . . . . . . . . . . . . . . . . . . . . . 49.88 0.01 0.01 0.66 111.72 162.28
Total inflows . . . . . . . . . . . . . . . . . . . . . . . 1,552.44 432.64 201.96 193.28 443.41 2,823.73OutflowsCapital . . . . . . . . . . . . . . . . . . . . . . . . . . . . . — — — — 12.43 12.43Reserves & surplus . . . . . . . . . . . . . . . . . . . — — — — 226.57 226.57Deposits . . . . . . . . . . . . . . . . . . . . . . . . . . . 1,328.56 352.91 43.22 22.12 148.19 1,895.00Borrowings(6) . . . . . . . . . . . . . . . . . . . . . . . 209.82 72.44 65.12 12.66 0.02 360.06Others (including subordinated debt). . . . . 11.53 14.14 8.29 122.23 173.48 329.67
Total outflows . . . . . . . . . . . . . . . . . . . . . . 1,549.91 439.49 116.63 157.01 560.69 2,823.73Total gap before risk management
positions . . . . . . . . . . . . . . . . . . . . . . . . . 2.53 (6.85) 85.33 36.27 (117.28) 0.00Risk management positions(7) . . . . . . . . . . . (32.79) (15.81) 51.25 4.29 — 6.94Total gap after risk management
positions . . . . . . . . . . . . . . . . . . . . . . . . . (30.26) (22.66) 136.58 40.56 (117.28) 6.94
(1) Includes balances in current accounts with banks, money at call and short notice, term deposits and otherplacements.
(2) Includes leased assets.(3) The maturity profile has been computed based on relevant asset-liability management guidelines of the
Reserve Bank of India and policies approved by our Asset-Liability Management Committee.(4) In computing the information of maturity profile, certain estimates and assumptions have been made by us.(5) Assets and liabilities are classified into the applicable categories, based on residual maturity or re-pricing
whichever is earlier. Classification methodologies are generally based on Asset Liability ManagementGuidelines issued by the Reserve Bank of India, effective from April 1, 2000. Items that neither mature norre-price are included in the “greater than five years” category. This includes equity share capital and asubstantial part of fixed assets. Impaired loans of residual maturity less than three years are classified in the“greater than one year and up to five years” category and impaired loans of residual maturity between threeto five years are classified in the “greater than five years” category.
(6) The categorization for these items is different from that reported in the financial statements.(7) The risk management positions comprise foreign currency and rupee swaps.
101

Price Risk (Banking book)
The following table sets forth, using the balance sheet at September 30, 2006 as the base, one possibleprediction of the impact of adverse changes in interest rates on net interest income for the twelve month periodending September 30, 2007, assuming a parallel shift in the yield curve.
At September 30, 2006Change in interest rate (in basis points)
(100) (50) 50 100
(in billions, except percentages)
Rupee portfolio . . . . . . . . . . . . . . . . . . . . . . . . . . . . . . . . . . 1.50 0.75 (0.75) (1.51)Foreign currency portfolio . . . . . . . . . . . . . . . . . . . . . . . . . . 0.60 0.30 (0.30) (0.60)
Total . . . . . . . . . . . . . . . . . . . . . . . . . . . . . . . . . . . . . . . . . . 2.10 1.05 (1.05) (2.10)
Based on our asset and liability position at September 30, 2006, the sensitivity model shows that net interestincome from the banking book for the twelve month period ending September 30, 2007 would decrease byRs. 2.10 billion (US$ 46 million) if interest rates increased by 100 basis points during the twelve month periodending September 30, 2007. Conversely, the sensitivity model shows that if interest rates decreased by 100 basispoints during the twelve month period ending September 30, 2007, net interest income for the twelve monthperiod ending September 30, 2007 would increase by an equivalent amount of Rs. 2.10 billion (US$ 46 million).
Sensitivity analysis, which is based upon a static interest rate risk profile of assets and liabilities, is used forrisk management purposes only and the model above assumes that during the course of the year no other changesare made in the respective portfolios. Actual changes in net interest income will vary from the model.
The following tables sets forth, using the fixed income portfolio at September 30, 2006 as the base, onepossible prediction of the impact of changes in interest rates on the value of our rupee fixed income tradingportfolio, assuming a parallel shift in the yield curve
Price Risk (Trading book)
The following table sets forth, using the fixed income portfolio at September 30, 2006 as the base, onepossible prediction of the impact of changes in interest rates on the value of our rupee fixed income tradingportfolio for twelve month the period ended September 30, 2007, assuming a parallel shift in the yield curve.
At September 30, 2006
Portfolio SizeMarket Value
Change in interest rate(in basis points)
(100) (50) 50 100
(Rupees in billions)
Government of India securities . . . . . . . . . . . . . . . . . . . . . . . . . . . . . . . 15.09 1.12 0.56 (0.56) (1.12)
At September 30, 2006, the total market value of our rupee fixed income trading portfolio was Rs. 15.09billion (US$ 328 million). The sensitivity model shows that if interest rates increase by 100 basis points, thevalue of the trading portfolio would fall by Rs. 1.12 billion (US$ 24 million). Conversely, if interest rates fell by100 basis points, under the model, the value of this portfolio would rise by Rs. 1.12 billion (US$ 24 million).
As noted above, sensitivity analysis is used for risk management purposes only and the model used aboveassumes that during the course of the year no other changes are made in the respective portfolios. Actual changesin the value of the fixed income portfolio will vary from the model above.
We revalue our trading portfolio on a daily basis and recognise aggregate re-valuation losses in our profitand loss account. The asset liability management policy stipulates an interest rate risk limit which seeks to cap
102

the risk on account of the mark-to-market impact on the mark-to-market book and the earnings at risk on thebanking book, based on a sensitivity analysis of a 100 basis points parallel and immediate shift in interest rates.
In addition, the Market Risk Management Group stipulates risk limits including position limits and stop losslimits for the trading book. These limits are monitored on a daily basis and reviewed periodically. In addition torisk limits, we also have risk monitoring tools such as Value-at-Risk models for measuring market risk in ourtrading portfolio.
Our available for sale investments included Rs. 127.93 billion (US$ 2.8 billion) of Government of Indiasecurities held for compliance with the liquidity ratio requirements. These are not included in the trading bookanalysis presented above.
The following table sets forth, for the period indicated, our fixed and floating rate assets and liabilities:
At September 30, 2006 Fixed Floating Total
(in billions)
Deposits and borrowings (including subordinated debt) . . . . . . . . . . . . . . . . . . . . . 2,309.87 101.14 2,411.01Advances and investments . . . . . . . . . . . . . . . . . . . . . . . . . . . . . . . . . . . . . . . . . . . . 1,558.14 825.81 2,383.95
Equity Risk
We assume equity risk both as part of our investment book and our trading book. On the investment book,investments in equity shares and preference shares are essentially long-term in nature. Nearly all the investmentin equity securities have been driven by our project financing activities. The decision to invest in equity sharesduring project financing activities has been a conscious decision to participate in the equity of the company withthe intention of realizing capital gains arising from the expected increases in market prices, and is separate fromthe lending decision.
Exchange Rate Risk
We offer foreign currency hedge instruments like swaps, forwards, and currency options to clients, whichare primarily banks and highly rated corporate customers. We actively use cross currency swaps, forwards, andoptions to economically hedge against exchange risks arising out of these transactions. Trading activities in theforeign currency markets expose us to exchange rate risks. This risk is mitigated by setting counterparty limits,stipulating daily and cumulative stop-loss limits, and engaging in exception reporting.
The Reserve Bank of India has authorized the dealing of foreign currency-rupee options by banks forhedging foreign currency exposures including hedging of balance sheet exposures. We have been offering suchproducts to corporate clients and other inter-bank counterparties and are one of the largest participants in thecurrency options market accounting for a significant share of daily trading volume. All the options aremaintained within the specified limits.
In addition, foreign currency loans are made on terms that are similar to foreign currency borrowings,thereby transferring the foreign exchange risk to the borrower. In addition, there is an open foreign exchangeposition limit to minimize exchange rate risk.
Liquidity Risk
Liquidity risk arises in the funding of lending, trading and investment activities and in the management oftrading positions. It includes both the risk of unexpected increases in the cost of funding an asset portfolio atappropriate maturities and the risk of being unable to liquidate a position in a timely manner at a reasonableprice. The goal of liquidity management is to be able, even under adverse conditions, to meet all liabilityrepayments on time and fund all investment opportunities.
103

We maintain diverse sources of liquidity to facilitate flexibility in meeting funding requirements.Incremental operations are principally funded by accepting deposits from retail and corporate depositors. Thedeposits are augmented by borrowings in the short-term inter-bank market and through the issuance of bonds.Loan maturities and sale of investments also provide liquidity. Most of the funds raised are used to extend loansor purchase securities. Generally, deposits have a shorter average maturity than loans or investments.
Most of our incremental funding requirements, including replacement of maturing liabilities of ICICI whichgenerally had longer maturities, are met through short-term funding sources, primarily in the form of depositsincluding inter-bank deposits. However, a large portion of our assets, primarily the assets of ICICI and our homeloan portfolio, have medium or long-term maturities, creating a potential for funding mismatches. We activelymonitor our liquidity position and attempt to maintain adequate liquidity at all times to meet all requirements ofall depositors and bondholders, while also meeting the requirement of lending groups. From time to time, wemay buy back some of our outstanding bonds, including the securities when issued, at our discretion in the openmarket or in privately negotiated transactions depending on market conditions, interest rates and other factors.We seek to establish a continuous information flow and an active dialogue between the funding and borrowingdivisions of the organization to enable optimal liquidity management. A separate group is responsible forliquidity management. Another source of liquidity risk is the put options written by us on the loans that we havesecuritized. These options are binding on us and require us to purchase, upon request of the holders, securitiesissued in such securitized transactions. The options seek to provide liquidity to the note holders. If exercised, wewill be obligated to purchase the securities at the pre-determined exercise price. Under the Reserve Bank ofIndia’s statutory liquidity ratio requirement, we are required to maintain 25.0% of our total demand and timeliabilities by way of approved securities, such as Government of India securities and state government securities.We maintain the statutory liquidity ratio through a portfolio of Government of India securities that we activelymanage to optimize the yield and benefit from price movements. Under the Reserve Bank of India’s cash reserveratio requirements, we are currently required to maintain 5.0% of our demand and time liabilities in a currentaccount with the Reserve Bank of India. In December 2006, the Reserve Bank of India announced an increase inthe cash reserve ratio by 50 basis points from 5.0% to 5.5%. The increase is to be effective in two stages of 25basis points each with the first stage effective from December 23, 2006 and the second stage effective fromJanuary 6, 2006.
We have recourse to the liquidity adjustment facility and the refinance window, which are short-termfunding arrangements provided by the Reserve Bank of India. We maintain a substantial portfolio of liquid highquality securities that may be sold on an immediate basis to meet our liquidity needs. We also have the option ofmanaging liquidity by borrowing in the inter-bank market on a short-term basis. The overnight market, which is asignificant part of the inter-bank market, is susceptible to volatile interest rates. These interest rates on certainoccasions have touched historical highs of 100.0% and above. To curtail reliance on such volatile funding, ourliquidity management policy has stipulated daily limits for borrowing and lending in this market. The limit ondaily borrowing is more stringent than the limit set by the Reserve Bank of India. ICICI Securities, like ICICIBank, relies for a certain proportion of its funding on the inter-bank market for overnight money and is thereforealso exposed to similar risk of volatile interest rates. We are required to submit gap analysis on a monthly basisto the Reserve Bank of India. Pursuant to the Reserve Bank of India guidelines, the liquidity gap (if negative)must not exceed 20.0% of outflows in the 1-14 day and the 15-28 day time category. We prepare fortnightlymaturity gap analysis to review our liquidity position. Static gap analysis is also supplemented by a dynamicanalysis for the short-term, to enable the liability raising units to have a fair estimate of the short-term fundingrequirements. In addition, we also monitor certain liquidity ratios on a fortnightly basis.
Our bonds forming part of our Tier II capital are rated AAA by two Indian credit rating agencies, ICRALimited and Credit Analysis & Research Limited. Our bonds forming part of our Upper Tier II capital andinnovative perpetual debt instruments to be issued in India forming part of Tier I capital are rated AAA by twoIndian credit rating agencies, CRISIL Limited and Credit Analysis & Research Limited. Our term deposits arerated AAA by ICRA Limited and Credit Analysis & Research Limited. Our certificate of deposits are rated A1+by ICRA Limited and PR1+ by Credit Analysis & Research Limited. Our long-term foreign currency borrowings
104

are rated Baa2 by Moody’s Investors Service, BB+ by Standard and Poor’s and BBB by Japan Credit RatingAgency Limited (JCRA). Our short-term foreign currency ratings are Ba2/Not Prime by Moody’s InvestorsService and B by Standard and Poor’s. The outlook from Standard and Poor is positive while the outlook fromboth Moody’s and JCRA is stable. Any downgrade in these credit ratings, or any adverse change in these ratingsrelative to other banks and financial intermediaries, could adversely impact our ability to raise resources to meetour funding requirements, which in turn could adversely impact our liquidity position.
In April 2003, unsubstantiated rumors, believed to have originated in Gujarat, alleged that we were facingliquidity problems, although our liquidity position was sound. We witnessed higher than normal depositwithdrawals during the period April 11 to 13, 2003, on account of these unsubstantiated rumors. We successfullycontrolled the situation, but if such situations were to arise in the future, any failure to control such situationscould result in large deposit withdrawals, which would adversely impact our liquidity position.
Operational Risk
Operational risk is the risk of loss that can result from a variety of factors, including failure to obtain properinternal authorizations, improperly documented transactions, failure of operational and information securityprocedures, computer systems, software or equipment, fraud, inadequate training and employee errors or fromexternal causes. We are exposed to many types of operational risk. Our exposure to operational risk has increasedfollowing our rapid international expansion in recent years.
For a discussion on our vulnerability to operational risk, see “Risk Factors—Risks Relating to OurBusiness—There is operational risk associated with our industry which, when realized, may have an adverseimpact on our business.”, “Risk Factors—Risks Relating to Our Business—We have experienced rapidinternational growth in the last three years which has increased the complexity of the risks that we face.” andRisk Factors—Risks Relating to Our Business—We are subject to legal and regulatory risk which may adverselyaffect our business.”
Our operational risk management policy aims at minimizing losses and customer dissatisfaction due tofailure in processes, focusing on flaws in products and their design that can expose the Bank to losses due tofraud, etc., analyzing the impact of failures in technology/systems and develop mitigants to minimize the impactand developing plans for external shocks that can adversely impact the continuity in the Bank’s operations. Ourapproach to operational risk management is designed to mitigate operational risk by maintaining acomprehensive system of internal controls, establishing systems and procedures to monitor transactions,maintaining key back-up procedures and undertaking regular contingency planning. Our new products andprocesses as well modifications to existing products and processes are approved by the Product and ProcessApproval Committee before launch. The committee consists of representatives of product, operations, legal,accounting, compliance and risk management groups. We follow a policy of centralizing a substantial portion ofour operations related to various categories of products and services.
The compliance with internal processes and policies are regularly monitored through a comprehensivesystem of risk based internal audit. The audit findings are reported to the audit committee of the Board ofDirectors.
Operational Controls and Procedures in Branches
We have operating manuals detailing the procedures for the processing of various banking transactions andthe operation of the application software. Amendments to these manuals are implemented through circulars sentto all offices. Compliance with the procedures is regularly monitored through measures of performance forvarious processes and a comprehensive internal audit mechanism.
We have a scheme of delegation of financial powers that sets out the monetary limit for each employee withrespect to the processing of transactions in a customer’s account. Withdrawals from customer accounts are
105

controlled by dual authorization. Senior officers have been delegated power to authorize larger withdrawals. Ouroperating system validates the check number and balance before permitting withdrawals. Cash transactions overRs. 1 million (US$ 21,763) are subject to special scrutiny to avoid money laundering. Our banking software hasmultiple security features to protect the integrity of applications and data.
Operational Controls and Procedures for Internet Banking
In order to open an Internet banking account, the customer has to first undergo all the processes related toopening of a regular savings account. The customer must provide us with documentation to prove the customer’sidentity and address, such as a copy of the customer’s passport, a photograph and specimen signature of thecustomer. After verification of this documentation, we open the Internet banking account and issue the customera user ID and password to access his account online.
Operational Controls and Procedures in Regional Processing Centers & Central Processing Centers
To improve customer service at our physical locations, we handle transaction processing centrally by takingaway such operations from branches. We have centralized operations at regional processing centers located at 25cities in the country. These regional processing centers process clearing checks and inter-branch transactions,make inter-city check collections, and engage in back-office activities for account opening, standing instructionsand renewal of deposits.
In Mumbai, we have centralized transaction processing on a nation wide basis for transactions like the issueof ATM cards and PIN mailers, reconciliation of ATM transactions, monitoring of ATM functioning, issue ofpasswords to Internet banking customers, depositing postdated checks received from retail loan customers andcredit card transaction processing. Centralized processing has been extended to the issuance of personalizedcheck books, back-office activities of non-resident Indian accounts, opening of new bank accounts for customerswho seek web brokering services and recovery of service charges for accounts for holding shares in book-entryform.
Operational Controls and Procedures in Treasury
We use technology to monitor risk limits and exposures. Our front office, back office and accounting andreconciliation functions are fully segregated in both the domestic treasury and foreign exchange treasury. Therespective middle offices use various risk monitoring tools such as counterparty limits, position limits, exposurelimits and individual dealer limits. Procedures for reporting breaches in limits are also in place.
Our front office treasury operations for rupee transactions consist of operations in fixed income securities,equity securities and inter-bank money markets. Our dealers analyze the market conditions and take views onprice movements. Thereafter, they strike deals in conformity with various limits relating to counterparties,securities and brokers. The deals are then forwarded to the back office for settlement.
Trade strategies are discussed frequently and decisions are taken based on market forecasts, information andliquidity considerations. Trading operations are conducted in conformity with the code of conduct prescribed byinternal and regulatory guidelines.
The Treasury Middle Office Group monitors counterparty limits, evaluates the mark-to-market impact onvarious positions taken by dealers and monitors market risk exposure of the investment portfolio and adherenceto various market risk limits.
Our back office undertakes the settlement of funds and securities. The back office has procedures andcontrols for minimizing operational risks, including procedures with respect to deal confirmations withcounterparties, verifying the authenticity of counterparty checks and securities, ensuring receipt of contract notes
106

from brokers, monitoring receipt of interest and principal amounts on due dates, ensuring transfer of title in thecase of purchases of securities, reconciling actual security holdings with the holdings pursuant to the records andreports any irregularity or shortcoming observed.
Operational Controls and Procedures in Retail Asset Operations
A majority of our retail asset operations are centralized at Mumbai, Delhi and Chennai. The centraloperations unit is located in Mumbai and the regional operations units at Delhi and Chennai. These central andregional units support operations relating to retail asset products across the country.
The central operations unit carries out accounting, reconciliation and repayment management activities forall retail asset products. The regional operations units manage disbursement of approved credit facilities. Thereare no manual issuances of disbursement cheques thus reducing any operational risk on account of manualintervention in the processes. No single team has the full authority to complete a transaction and carry outfinancial reconciliation. Each activity is segregated and carried out by an independent team.
All processes are hosted and controlled through a central process site. At the design stage of the process, alloperational and other risks are identified, mitigants designed and measures of performance specified to ensureadherence. The retail asset operations group has regional audit managers across the country. These auditmanagers monitor adherence to controls and procedures and record and report deviations to facilitate correctiveaction.
Operational Controls and Procedures for Corporate Banking
Our operations in respect of corporate banking products and services are centralised at Mumbai. Thesecentralised operations comprise separate operations teams for trade finance, cash management and generalbanking operations. The centralised operations teams process transactions after verification of creditauthorisations, as well as applicable regulations, particularly in respect of international trade finance transactions.This unit also processes transactions for small enterprise customers.
Anti-money Laundering Controls
Our board of directors approved a group anti-money laundering policy in January 2004, which establishedthe standards of anti-money laundering compliance. The group anti-money laundering policy was revised inDecember 2004 and in April 2006 in view of the requirements of the Reserve Bank of India guidelines, issuedfrom time to time. The group anti-money laundering policy is applicable to all our activities. The unique anti-money laundering regulatory requirements for overseas units are provided separately as an addendum to thegroup anti-money laundering policy. Our anti-money laundering standards are primarily based on two pillars,namely, know your customer and monitoring/reporting of suspicious transactions. The group anti-moneylaundering policy specifies a risk-based approach in implementing the anti-money laundering framework. Thestrategic business units are required to undertake risk profiling of various customer segments and products, andto classify them into high, medium and low-risk categories. The anti-money laundering framework seeks toinstitute a process of customer identification and verification depending on the nature or status of the customerand the type of transaction. In respect of unusual or suspicious transactions or when the customer moves from alow-risk to high-risk profile, appropriate enhanced due-diligence measures are required to be adopted. The policyalso requires that reports of specified cash transactions and suspicious transactions be submitted to the FinancialIntelligence Unit, India (FIU-IND) constituted under the Prevention of Money Laundering Act, 2002 and therules notified thereunder. The Audit Committee of our board of directors supervises the implementation of theanti-money laundering framework. A money laundering reporting officer has been designated to monitor theday-to-day implementation of the anti-money laundering policy and procedures. Our committee of directors hasalso approved a customer acceptance policy, product and customer-specific Know Your Customer proceduresand appropriate transaction monitoring procedures. Suitable training programs on awareness of anti-moneylaundering are organized for the employees on a periodic basis.
107

Global risk management framework
We have adopted a global risk management framework for our international banking operations, includingoverseas branches, offshore banking units and subsidiaries. Under this framework, our credit, investment, assetliability management and anti-money laundering policies apply to all our overseas branches and offshore bankingunits, with modifications to meet local regulatory or business requirements. These modifications may be madeonly with the approval of our board of directors. All overseas banking subsidiaries are required to adopt riskmanagement policy frameworks to be approved by their board of directors or an appropriate committee of theirboard of directors, based on applicable laws and regulations as well as our corporate governance and riskmanagement framework. The overseas banking subsidiaries are required to adopt a process for formulation ofpolicies which involves seeking the guidance and recommendations of the related groups in ICICI Bank.
The Compliance Group plays an oversight role in respect of regulatory compliance at the overseas branchesand offshore banking units. Key risk indicators pertaining to our international banking operations are presented tothe Risk Committee of our board of directors on a quarterly basis.
Audit
The Internal Audit Group undertakes a comprehensive audit of all business groups and other functions, inaccordance with a risk-based audit plan. This plan allocates audit resources based on an assessment of theoperational risks in the various businesses. The audit plan for every fiscal year is approved by the AuditCommittee of our board of directors.
The Internal Audit Group also has a dedicated team responsible for information technology security audits.The annual audit plan covers various components of information technology including applications, databases,networks and operating systems.
The Reserve Bank of India requires banks to have a process of concurrent audits at branches handling largevolumes, to cover a minimum of 50.0% of business volumes. We have a process of concurrent audits, usingexternal accounting firms. Concurrent audits are also carried out at centralized and regional processing centersoperations to ensure existence of and adherence to internal controls.
The Internal Audit Group has formed a separate International Banking Audit Group for audit ofinternational branches, representative offices and subsidiaries.
Legal and Regulatory Risk
We are involved in various litigations and are subject to a wide variety of banking and financial serviceslaws and regulations in each of the jurisdictions in which we operate. We are also subject to a large number ofregulatory and enforcement authorities in each of these jurisdictions. See “Risk Factors—Risks Relating to OurBusiness—We are involved in various litigations and any final judgment awarding material damages against uscould have a material adverse impact on our future financial performance, our stockholders’ equity and the priceof our securities” and “—Regulatory changes or enforcement initiatives in India or any of the jurisdictions inwhich we operate may adversely affect our business and the price of our notes”.
Derivative Instruments Risk
We enter into interest rate and currency derivative transactions primarily for the purpose of hedging interestrate and foreign exchange mismatches and also engage in trading of derivative instruments on our own account.We provide derivative services to selected major corporate customers and other domestic and internationalfinancial institutions, including foreign currency forward transactions and foreign currency and interest rateswaps. Our derivative transactions are subject to counterparty risk to the extent particular obligors are unable tomake payment on contracts when due.
108

Risk management in key subsidiaries
ICICI Securities provides investment banking services, including corporate advisory, fixed income andequity services, to corporate customers. All investment banking mandates, including underwriting commitments,are approved by the Commitments Committee comprising the Managing Director and CEO and relevant groupheads, of ICICI Securities. ICICI Securities is a primary dealer and has Government of India securities as asignificant proportion of its portfolio. The Corporate Risk Management Group at ICICI Securities develops therisk management policies for the organization. The main objective of the group is to ensure adherence to best riskmanagement practices to mitigate the risks, primarily credit and market risks, involved in the various businessesof the company. The group continuously develops and enhances its risk management and control procedures.Further, the Risk Management Committee is responsible for analyzing and monitoring the risks associated withthe different business activities of ICICI Securities and ensuring adherence to the risk and investment limitsapproved by the board of directors.
ICICI Prudential Life Insurance is exposed to business risks arising out of the nature of products andunderwriting, and market risk arising out of the investments made out of the corpus of premiums collected andthe returns guaranteed to policyholders. The Risk Management and Audit Committee of its board of directors isresponsible for oversight of the risk management and internal control functions. For managing investment risk,the company has a prudent investment strategy to optimize risk adjusted returns. Its asset-liability managementframework is designed to cushion and mitigate the investment related risks of assets. The assets undermanagement for the linked portfolio, in respect of which there is minimal asset-liability mismatch risk, amountsto over 83% of the policyholders’ funds. As part of asset-liability management for the non-linked portfolio, ICICIPrudential Life Insurance has hedged the single premium non-participating portfolio by duration matching,rebalanced monthly. On the participating portfolio, the asset allocation strategy, which includes investments inequities, is designed to achieve the twin objectives of managing base guarantees and maximizing returns. Theequity portfolio is benchmarked against a market index. In addition, there are exposure limits to companies,groups and industries. For mitigating operational risks, the management assesses and rates the variousoperational risks and prepares a mitigation plan. The internal audit department performs risk-based audit andreports the findings to the Audit Committee.
ICICI Lombard General Insurance is principally exposed to risks arising out of the nature of businessunderwritten and credit risk on its investment portfolio. In respect of business risk, ICICI Lombard GeneralInsurance seeks to diversify its insurance portfolio across industry sectors and geographical regions. It focuses oncorporate product segments that have historically experienced low loss ratios and retail product segments whererisks are widely distributed. It also has the ability to reduce the risk retained on its own balance sheet byre-insuring a part of the risks underwritten. Its investments are governed by the investment policy approved by itsboard of directors within the norms stipulated by the Insurance Regulatory and Development Authority. TheInvestment Committee oversees the implementation of this policy and reviews it periodically. Exposure to anysingle entity is normally restricted to 5.0% of the portfolio and to any industry to 10.0% of the portfolio.Investments in debt instruments are generally restricted to instruments with a domestic credit rating of AA orhigher.
Technology
We continue to endeavor to be at the forefront of usage of technology in the financial services sector. Westrive to use information technology as a strategic tool for our business operations, to gain a competitiveadvantage and to improve our overall productivity and efficiency. Our technology initiatives are aimed atenhancing value, offering customers enhanced convenience and improved service while optimizing costs. Ourfocus on technology emphasizes:
• Electronic and online channels to:
• offer easy access to our products and services;
• reduce distribution and transaction costs;
109

• reach new target customers;
• enhance existing customer relationships; and
• reduce time to market.
• Application of information systems to:
• manage our large scale of operations efficiently;
• effectively market to our target customers;
• monitor and control risks;
• identify, assess and capitalize on market opportunities; and
• assist in offering improved products to customers.
We also seek to leverage our domestic technology capabilities in our international operations.
Technology Organization
We have dedicated technology groups for our products and services for retail, corporate, international andrural customers. The Technology Management Group coordinates our enterprise-wide technology initiatives. Ourshared services technology group provides the technology infrastructure platform across all business technologygroups to gain synergies in operation. The business technology groups review the individual requirements of thevarious business groups while the technology management group aggregates the requirements of various businessgroups to ensure enterprise-wide consistency.
Banking Application Software
We use banking applications like a core banking system, loan management system and credit cardmanagement system that are flexible and scaleable and allow us to serve our growing customer base. A centralstand-in server provides services all days of the week, throughout the year, to delivery channels. The serverstores the latest customer account balances, which are continuously streamed from the core-banking database.We have a data center in Mumbai for centralized data base management, data storage and retrieval.
Electronic and Online Channels
We use a combination of physical and electronic delivery channels to maximize customer choice andconvenience, which has helped the differentiation of our products in the marketplace. Our branch bankingsoftware is flexible and scaleable and integrates well with its electronic delivery channels. Our ATMs aresourced from some of the world’s leading vendors. These ATMs work with the branch banking software. AtSeptember 30, 2006, we had 2,336 ATMs across India. We were one of the first banks to offer online bankingfacilities to our customers. We now offer a number of online banking services to our customers for bothcorporate and retail products and services. Our call centers employ approximately 4,238 workstations, acrosslocations, at Mumbai, Thane and Hyderabad, which are operational round the clock. These telephone bankingcall centers use an Interactive Voice Response System. The call centers are based on the latest technology andprovide an integrated customer database that allows the call agents to get a complete overview of the customer’srelationship with us. The database enables customer segmentation and assists the call agent in identifying cross-selling opportunities.
We offer mobile banking services in India in line with our strategy to offer multi-channel access to ourcustomers. This service has now been extended to all mobile telephone service providers across India andnon-resident Indian customers in certain other countries where we have presence.
110
High-Speed Electronic Communications Infrastructure
We have a nationwide data communications network linking all our channels and offices. The networkdesign is based on a mix of dedicated leased lines and satellite links to provide for reach and redundancy, whichis imperative in a vast country like India. The communications network is monitored 24 hours a day usingadvanced network management software. We are moving towards multi protocol label switching (MPLS) as analternative to lease lines, thus ensuring redundancy.
Operations relating to Commercial Banking for Corporate Customers
We have successfully centralized our corporate banking back office operations and rolled out a businessprocess management solution to automate our activities in the areas of trade services and general bankingoperations. Through integration of the workflow system with the imaging and document management system, wehave achieved substantial savings and practically eliminated the use of paper for these processes.
We have centralized the systems of the treasuries of all our international branches and subsidiaries. As aresult, the processing of transactions as well as the applications used for deal entry are now centrally located andmaintained out of India.
Customer Relationship Management
We have implemented a customer relationship management solution for automation of customer handling inall key retail products. The solution helps in tracking and timely resolution of various customer queries andissues. The solution has been deployed at the telephone banking call centers as well as a large number ofbranches.
Data Warehousing and Data Mining
We have a data warehouse for customer data aggregation. This data warehouse also provides a platform fordata mining initiatives. We have implemented an Enterprise Application Integration initiative across our retailand corporate products and services, to link various products, delivery and channel systems. This initiativeunderpins our multi-channel customer service strategy and seeks to deliver customer related informationconsistently across access points. It is also aimed to provide us with the valuable information to compile a unifiedcustomer view and creates various opportunities associated with cross-selling other financial products.
Data center and disaster recovery system
While our primary data center is located in Mumbai, a separate disaster recovery data center has been set upin another city and is connected to the main data center in Mumbai. The disaster recovery data center can hostcritical banking applications in the event of a disaster at the primary site.
Employees
At September 30, 2006, we had 30,784 employees, of whom 17,729 employees were professionals inbusiness management, accountancy, engineering, law, computer science or economics. Management believes thatit has a good relationship with its staff.
The financial services industry in India is undergoing unprecedented change as deregulation gainsmomentum. Moreover, changing customer needs and rapid advances in technology are continually re-definingthe lines of innovation and competition, thereby providing us with new challenges and opportunities. To meetthese challenges, we have relied extensively on our human capital, which we believe comprises some of the besttalent in the industry.
111

We continue to attract the best graduates from the premier business schools of the country. We dedicatesignificant amount of senior management time to ensure that employees remain highly motivated and perceivethe organization as a place where opportunities abound, innovation is fuelled, teamwork is valued and success isrewarded. Employee compensation is clearly tied to performance and we encourage the involvement of all ouremployees in our overall performance and profitability through profit sharing incentive schemes based largely onthe financial results and other quantitative and qualitative factors. A performance management system has beenimplemented to assist management in career development and succession planning.
We have an employee stock option scheme to encourage and retain high performing employees. Pursuant tothe employee stock option scheme as amended by the Scheme of Amalgamation and further amended inSeptember 2004, up to 5.0% of the aggregate of our issued equity shares at the time of grant of the stock optionscan be allocated under the employee stock option scheme. The stock option entitles eligible employees to applyfor equity shares. The grant of stock options is approved by our board of directors on the recommendations of theBoard Governance and Remuneration Committee. The eligibility of each employee is determined based on anevaluation of the employee including employee’s work performance, technical knowledge and leadershipqualities. Moreover, we place considerable emphasis and value on our policy of encouraging internalcommunication and consultation between employees and management. See also “Management—Compensationand Benefits to Directors and Officers—Employee Stock Option Scheme.”
We have training centers, where various training programs designed to meet the changing skill requirementsof our employees are conducted. These training programs include orientation sessions for new employees andmanagement development programs for mid-level and senior executives. The training centers regularly offerscourses conducted by faculty, both national and international, drawn from industry, academia and our ownorganization. Training programs are also conducted for developing functional as well as managerial skills.Products and operations training is also conducted through web-based training modules.
In addition to basic compensation, our employees are eligible to receive loans from us at subsidized ratesand to participate in our provident fund and other employee benefit plans. The provident fund, to which both ouremployees and we contribute a defined amount, is a savings scheme, required by government regulation, underwhich we at present are required to pay to employees a minimum 8.5% annual return. If such return is notgenerated internally by the fund, we are liable for the difference. Our provident fund has generated sufficientfunds internally to meet the minimum annual return requirement since inception of the funds. We have also setup a superannuation fund to which it contributes defined amounts. In addition, we contribute specified amountsto a gratuity fund set up pursuant to Indian statutory requirements.
Properties
Our registered office is located at Landmark, Race Course Circle, Vadodara 390 007, Gujarat, India. Ourcorporate headquarters are located at ICICI Bank Towers, Bandra-Kurla Complex, Mumbai 400 051,Maharashtra, India.
We had a principal network consisting of 584 branches, 48 extension counters and 2,336 ATMs atSeptember 30, 2006. These facilities are located throughout India. 38 of these facilities are located on propertiesowned by us, while the remaining facilities are located on leased properties. In addition to the branches,extension counters and ATMs, we have 18 controlling/administrative offices including the registered office atVadodara and the corporate headquarters at Mumbai, 22 regional processing centers in various cities and onecentral processing center at Mumbai. We also have a branch each in Singapore, Dubai International FinanceCentre, Sri Lanka, Hong Kong and Bahrain and one representative office each in the United States, China, UnitedArab Emirates, Bangladesh and South Africa. We also provide residential and holiday home facilities toemployees at subsidized rates. We have 848 apartments for our employees.
112

Competition
We face competition in all our principal areas of business from Indian and foreign commercial banks,housing finance companies, mutual funds and investment banks. We are the largest private sector bank in Indiaand the second largest bank among all banks in the country, in terms of total assets, with total assets ofRs. 2,823.73 billion (US$ 61.5 billion) at September 30, 2006. We seek to gain competitive advantage over ourcompetitors by offering innovative products and services, the use of technology, building customer relationshipsand developing a team of highly motivated and skilled employees. We evaluate our competitive positionseparately in respect of our products and services for retail and corporate customers.
Commercial banking products and services for retail customers
In the retail markets, competition is primarily from foreign and Indian commercial banks and housingfinance companies. Foreign banks have product and delivery capabilities but are likely to focus on limitedcustomer segments and geographical locations since they have a smaller branch network than Indian commercialbanks. Foreign banks in aggregate had only 242 branches in India at June 30, 2006. Indian commercial bankshave wide distribution networks but relatively less strong technology and marketing capabilities. We seek tocompete in this market through a full product portfolio, effective distribution channels, which include agents,robust credit processes and collection mechanisms, experienced professionals and superior technology.
Commercial banks attract the majority of retail bank deposits, historically the preferred retail savingsproduct in India. We have sought to capitalize on our corporate relationships to gain individual customeraccounts through payroll management products and will continue to pursue a multi-channel distribution strategyutilizing physical branches, ATMs, telephone banking call centers and the Internet to reach customers. Further,following a strategy focused on customer profiles and product segmentation, we offer differentiated liabilityproducts to customers of various ages and income profiles. Mutual funds are another source of competition to us.Mutual funds offer tax advantages and have the capacity to earn competitive returns and hence, have increasinglybecome a viable alternative to bank deposits.
Commercial banking products and services for corporate customers
In products and services for corporate customers, we face strong competition primarily from public sectorbanks, foreign banks and other new private sector banks. Our principal competition in these products andservices comes from public sector banks, which have built extensive branch networks that have enabled them toraise low-cost deposits and, as a result, price their loans and fee-based services very competitively. Their widegeographical reach facilitates the delivery of banking products to their corporate customers located in most partsof the country. We have been able, however, to compete effectively because of our efficient service and promptturnaround times that we believe are significantly faster than public sector banks. We seek to compete with thelarge branch networks of the public sector banks through our multi-channel distribution approach andtechnology-driven delivery capabilities.
Traditionally, foreign banks have been active in providing treasury-related products and services, tradefinance, fee-based services and other short-term financing products to top tier Indian corporates. We effectivelycompete with foreign banks in cross-border trade finance as a result of our wider geographical reach relative toforeign banks and our customized trade financing solutions. We have established strong fee-based cashmanagement services and compete with foreign banks due to our technological edge and competitive pricingstrategies. We leverage our balance sheet size, technology and our international presence to compete in treasury-related products and services.
Other new private sector banks also compete in the corporate banking market on the basis of efficiency,service delivery and technology. However, we believe our size, capital base, strong corporate relationships, widergeographical reach and ability to use technology to provide innovative, value-added products and servicesprovide us with a competitive edge.
113

In project finance, ICICI’s primary competitors were established long-term lending institutions. In recentyears, Indian and foreign commercial banks have sought to expand their presence in this market. We believe thatwe have a competitive advantage due to our strong market reputation and expertise in risk evaluation andmitigation. We believe that our in-depth sector specific knowledge and capabilities in understanding risks andpolicy related issues as well as our advisory, structuring and syndication services have allowed us to gaincredibility with project sponsors, overseas lenders and policy makers.
Other business areas
Our international strategy is focused on India-linked opportunities in the initial stages. In our internationaloperations, we face competition from Indian public sector banks with overseas operations, foreign banks withproducts and services targeted at non-resident Indians and Indian businesses and other service providers likeremittance services. We are seeking to position ourselves as an Indian bank offering globally-benchmarkedproducts and services with an extensive distribution network in India to gain a competitive advantage. We seek toleverage our technology capabilities developed in our domestic business to offer convenient and efficientservices to our international customers. We also seek to leverage our strong relationships with Indian corporatesin our international business.
In our commercial banking operations for agricultural and rural customers, we face competition from thepublic sector banks that have large branch networks in rural India. Other private sector banks and non-bankfinance companies also provide products and services in rural areas. We seek to compete in this business basedon our comprehensive product strategy and multiple channels.
Our insurance and asset management joint ventures face competition from existing dominant public sectorplayers as well as new private sector players. We believe that the key competitive strength of our insurance jointventures is the combination of our experience in the Indian financial services industry with the global experienceand skills of our joint venture partners. We believe that ICICI Prudential Life Insurance, ICICI Lombard GeneralInsurance and Prudential ICICI Asset Management have built strong product, distribution and risk managementcapabilities, achieving market leadership positions in their respective businesses. ICICI Prudential Life Insurancehad a retail market share of about 30% in new business written (on weighted received premium basis) by privatesector life insurance companies from April to September 2006. ICICI Lombard General Insurance had a marketshare of over 35% among the private sector general insurance companies from April to September 2006.Prudential ICICI Asset Management Company was the second largest player in the Indian mutual fund industryat September 30, 2006 with a market share of over 10%.
Legal and Regulatory Proceedings
We are involved in various litigations and are subject to a wide variety of banking and financial serviceslaws and regulations in each of the jurisdictions in which we operate. We are also subject to a large number ofregulatory and enforcement authorities in each of these jurisdictions. We are involved in a number of legalproceedings and regulatory relationships in the ordinary course of our business. However, excluding the legalproceedings discussed below, we are not a party to any proceedings and no proceedings are known by us to becontemplated by governmental authorities or third parties, which, if adversely determined, may have a materialadverse effect on our financial condition or results of operations.
See also “Risk Factors—Risks Relating to Our Business—We are subject to legal and regulatory risk whichmay adversely affect our business and the price of our equity shares and ADSs”, “—We have experienced rapidinternational growth in the last three years which has increased the complexity of the risks that we face,” “—Thereis operational risk associated with our industry which, when realized, may have an adverse impact on our business,”“—We are involved in various litigations and any final judgment awarding material damages against us could havea material adverse impact on our future financial performance, our stockholders’ equity and the price of our equityshares and ADSs” and “—Regulatory changes or enforcement initiatives in India or other jurisdictions in which weoperate could adversely affect our business and the price of our equity shares and ADSs.”
114
At September 30, 2006, we had been assessed an aggregate of Rs. 36.79 billion (US$ 801 million) in excessof the provision made in our accounts, in income tax, interest tax, wealth tax and sales tax demands by theGovernment of India’s tax authorities for past years. We have appealed each of these tax demands. Based onconsultation with counsel and favorable judicial or appellate authority decisions in our own or other cases as setout below, management believes that the tax authorities are not likely to be able to substantiate their income tax,interest tax, wealth tax and sales tax assessment and accordingly has not provided for these tax demands atSeptember 30, 2006.
• We have received favorable decisions from the appellate authorities with respect to Rs. 1.45 billion(US$ 32 million) of the assessment. The income tax authorities have appealed these decisions to higherappellate authorities and the same are pending adjudication.
• In our appeal of assessment of sales tax aggregating to Rs. 480.12 million (US$ 10.45 million), we arerelying on a favorable decision of the Supreme Court of India in respect of a writ petition filed by usand the facts of the case.
• In our appeal of assessments of income tax, interest tax and wealth tax aggregating to Rs. 34.86 billion(US$ 758.66 million), we are relying on favorable precedent decisions of the appellate court and expertopinions.
• Of the Rs. 36.79 billion (US$ 801 million), a major proportion relates to the disallowance ofdepreciation claim on leased assets. This is an industry wide issue involving multiple litigations acrossthe country. In respect of depreciation claimed by us for fiscal 1993 on two sale and lease backtransactions, the Income Tax Appellate Tribunal, Mumbai held in August 2003 that these transactionswere tax planning tools and no depreciation was allowable. As the Income Tax Appellate Tribunal’sdecision is based on the facts of two specific transactions, we believe that the Income Tax AppellateTribunal’s decision will not have an adverse tax impact on other sale and lease back transactionsentered into by us. The tax impact of this decision is Rs. 11 million (US$ 2,39,391). After the Tribunaldecision, the Supreme Court has held that tax planning is valid if within the four corners of the law.Following the decision of Supreme Court, two High Courts have held that depreciation should beallowed on sale and lease back transactions. We have filed an appeal to the High Court against theadverse Income Tax Appellate Tribunal judgment which has been admitted and based on consultationwith senior tax counsel and expert advice, we believe that we will receive a favorable decision in thematter. Moreover, the lease agreements provide for variation in the lease rental to offset any loss ofdepreciation benefit to us. Accordingly, we have not provided for this tax demand but have disclosed itas a contingent liability in the financial statements.
At December 15, 2006, there were 18 litigations (each involving a claim of Rs. 10.0 million and more)against us, in the aggregate amount of approximately Rs. 93.63 billion (US$ 2.0 billion) (to the extentquantifiable and including amounts claimed jointly and severally from us and other parties). At December 15,2006, two litigations were pending against our directors in an aggregate amount of approximately Rs. 56.30billion (US$ 1.2 billion) (to the extent quantifiable). The following are the litigations where amounts claimedfrom us are Rs. 1.00 billion (US$ 22 million) or higher:
• In 1999, ICICI filed a suit before the High Court of Judicature at Bombay against Mardia ChemicalsLimited for recovery of amounts totaling Rs. 1.4 billion (US$ 31 million) due from Mardia ChemicalsLimited. The suit was subsequently transferred to the Debt Recovery Tribunal, Mumbai. In 2002, weissued a notice to Mardia Chemicals Limited under the Securitization and Reconstruction of FinancialAssets and Enforcement of Security Interest Ordinance, 2002 (subsequently passed as an Act by theIndian Parliament) demanding payment of the outstanding dues. Subsequently, Mardia ChemicalsLimited filed a suit in the city civil court at Ahmedabad against us, Mr. K.V. Kamath, ManagingDirector & CEO and Ms. Lalita D. Gupte, erstwhile Joint Managing Director, for an amount ofRs. 56.3 billion (US$ 1.2 billion) on the grounds that Mardia Chemicals Limited had allegedly sufferedfinancial losses on account of ICICI’s failure to provide adequate financial facilities, ICICI’s recall ofthe advanced amount and ICICI’s filing of a recovery action against it. The city civil court held that the
115

suit should have been filed in the pending proceedings before the Debt Recovery Tribunal, Mumbai.Mardia Chemicals Limited filed an appeal before the High Court of Gujarat, which dismissed theappeal and ordered that the claim against us be filed before the Debt Recovery Tribunal, Mumbai andthe claim against Mr. K.V. Kamath and Ms. Lalita D. Gupte be continued before the city civil court atAhmedabad. The Debt Recovery Tribunal has admitted the counterclaim filed by Mardia ChemicalsLimited. Subsequently, an order has been issued for the winding of Mardia Chemicals Limited and thejudicial process for the same is being initiated. ICICI had filed a separate Recovery Application againstthe guarantors of Mardia Chemicals Limited, which is pending before the Debt Recovery Tribunal,Mumbai. We have filed our claim affidavit and original documents in the Debt Recovery Tribunal.Mardia Chemicals Limited’s claim against Mr. K.V. Kamath and Ms. Lalita D. Gupte is still pendingbefore the City Civil Court at Ahmedabad. However, since Mardia Chemicals Limited has beenordered to be wound up, it has to be now represented by the Official Liquidator
• In 2003, the promoters of Mardia Chemicals Limited in their capacity as guarantors of loans given byICICI to Mardia Chemicals Limited filed a civil suit in the city civil court at Ahmedabad against us foran amount of Rs. 20.8 billion (US$ 453 million) on the grounds of loss of investment and loss of profiton investment. Pleadings under the above applications have concluded. The matter is posted for finalhearing. The guarantors of Mardia Chemicals Limited have further filed a suit againstMr. K.V. Kamath and Ms. Lalita D. Gupte which is pending before the City Civil Court at Ahmedabad.
• In 2002, we filed a suit before the Debt Recovery Tribunal, Ahmedabad against Gujarat TelephoneCables Limited for recovery of term loans, debentures and working capital finance provided by us. Wesold our exposure to Asset Reconstruction Company (India) Limited in 2004. The borrower has filed asuit in the Civil Court claiming damages of Rs. 10.02 billion (US$ 218 million) jointly and severallyfrom State Bank of India, Bank of Baroda, United Western Bank, UTI Bank, Bank of India, AssetReconstruction Company (India) Limited and us. We have filed an application for rejection of theplaint.
• In 1998, Industrial Finance Corporation of India along with ICICI and Life Insurance Corporation ofIndia filed a suit in the Debt Recovery Tribunal, Delhi against Foremost Ceramics Limited and itsguarantors for recovery of amounts owed. In 2001, a guarantor for the loan filed a counter-claim for anamount of Rs. 4.50 billion (US$ 98 million) against all lenders who had extended financial assistanceto Foremost Ceramics Limited, on various grounds including that timely disbursements were noteffected. Industrial Finance Corporation of India has filed its reply, which has been adopted by LifeInsurance Corporation of India and us, denying these averments and stating that the counter-claim doesnot deny the fact of the guarantee and that the guarantor is merely trying to escape liability. The matteris posted for further arguments.
• In 1999, ICICI filed a suit in the Debt Recovery Tribunal, Delhi against Esslon Synthetics Limited andits Managing Director (in his capacity as guarantor) for recovery of amounts totaling Rs. 169 million(US$ 4 million) due from Esslon Synthetics. In May 2001, the guarantor filed a counter-claim for anamount of Rs. 1.0 billion (US$ 22 million) against ICICI and other lenders who had extended financialassistance to Esslon Synthetics on the grounds that he had been coerced by officers of the lenders intosigning an agreement between LML Limited, Esslon Synthetics and the lenders on account of which hesuffered, among other things, loss of business. Esslon Synthetics Limited has filed an application toamend the counterclaim in January 2004. We have filed our reply to the application for amendment.The application has been partly heard and is listed for further arguments.
Management believes, based on consultation with counsel, that the legal proceedings instituted by each ofMardia Chemicals, Gujarat Telephone Cables Limited, Foremost Ceramics Limited and Esslon Syntheticsagainst us are frivolous and untenable and their ultimate resolution will not have a material adverse effect on ourresults of operations, financial condition or liquidity. Based on a review of other litigations with legal counsel,management also believes that the outcome of such other matters will also not have a material adverse effect onour financial position, results of operations or cashflows.
116

The Reserve Bank of India has issued a show-cause notice to us for non-compliance with extant foreignexchange regulations in relation to an External Commercial Borrowing facility advanced to a customer by ourSingapore branch, on the grounds that such a facility could be provided only to companies engaged in activitiesclassified as “real sector”, while the company concerned was in the retail sector. We have submitted our responseto the show-cause notice stating that we understood that “retail sector” was within the definition of “real sector”.We also sought a personal hearing from the Reserve Bank of India, which has been granted. We are awaitingfurther communication from the Reserve Bank of India in this regard. See also “Risk factors—Risks relating toour business—We are subject to legal and regulatory risk which may adversely affect our business.”
In addition, we have experienced rapid international expansion into banking in multiple jurisdictions whichexposes us to a new variety of regulatory and business challenges and risks, including cross-cultural risk, andwhich increased the complexity of our risks in a number of areas including currency risks, interest rate risks,compliance risk, regulatory risk, reputational risk and operational risk. As a result of this rapid growth andincreased complexity, we or our employees may be subject to regulatory investigations or enforcementproceedings in multiple jurisdictions in a variety of contexts. Despite our best efforts at regulatory complianceand internal controls, we, or our employees, may from time to time, and as is common in the financial servicesindustry, be the subject of confidential examinations or investigations that might, or might not, lead toproceedings against the Bank or its employees. In any such situation it would be our policy to conduct an internalinvestigation, cooperate with the regulatory authorities and, where appropriate, suspend or discipline employees,including termination of their services.
We cannot predict the timing or form of any future regulatory or law enforcement initiatives, which we noteare increasingly common for international banks, but we would expect to cooperate with any such regulatoryinvestigation or proceeding.
117

MANAGEMENT
Directors and Executive Officers
Our board of directors, consisting of 17 members at November 30, 2006, is responsible for the managementof our business. Our organizational documents provide for a minimum of three directors and a maximum of 21directors, excluding the government director and the debenture director (defined below), if any. We may, subjectto the provisions of our organizational documents and the Companies Act, change the minimum or maximumnumber of directors by a resolution which is passed at a general meeting by a majority of the present and votingshareholders. In addition, under the Banking Regulation Act, the Reserve Bank of India may require us toconvene a meeting of our shareholders for the purposes of appointing new directors to our board of directors.
The Banking Regulation Act requires that at least 51% of the directors should have special knowledge orpractical experience in banking and areas relevant to banking including accounting, finance, agriculture andsmall scale industry. All of our directors are professionals with special knowledge of one or more of the aboveareas. Of the 17 directors, five are directors who are in our wholetime employment, or wholetime directors. Theappointment of wholetime directors requires the approval of the Reserve Bank of India and the shareholders.Under the terms of the loan and guarantee facilities provided by the government of India to us, the government ofIndia is entitled to appoint and has appointed one representative to our board, currently Mr. Vinod Rai. Of theremaining 11 independent directors, Mr. N. Vaghul is the non-executive chairman of our board, Mr. R.K. Joshi isthe Chairman-cum-Managing Director of General Insurance Corporation of India and Mr. T.S. Vijayan is theChairman of Life Insurance Corporation of India, which are among ICICI Bank’s large institutional shareholders.One director is a consultant, one is a chartered accountant and business advisor, one is a professor of finance, oneis a retired company executive, one is from a financial holding company with investments in insurance andinvestment management and three are from industrial companies (including agriculture-based industries). Of the11 non-wholetime directors, three have specialized knowledge in respect of agriculture and rural economy orsmall-scale industry. The Reserve Bank of India has also prescribed ‘fit and proper’ criteria to be consideredwhile appointing persons as directors of banking companies. Our directors are required to make declarationsconfirming their ongoing compliance of the ‘fit and proper’ criteria. Our board of directors has reviewed thedeclarations received from the directors in this regard and determined that all our directors satisfy the ‘fit andproper’ criteria.
Pursuant to the provisions of the Companies Act, at least two-thirds of the total number of directors,excluding the government director and the debenture director, are subject to retirement by rotation. One-third ofthese directors must retire from office at each annual meeting of shareholders. A retiring director is eligible forre-election. Pursuant to the provisions of the Banking Regulation Act, none of the directors other than wholetimedirectors may hold office continuously for a period exceeding eight years. Pursuant to the Reserve Bank of Indiaguidelines, a person would be eligible for appointment as director if he or she is between 35 and 70 years of age.
Our organizational documents also provide that we may execute trust deeds in respect of our debenturesunder which the trustee or trustees may appoint a director, known as the debenture director. The debenturedirector is not subject to retirement by rotation and may only be removed as provided in the relevant trust deed.Currently, there is no debenture director on our board of directors.
Our board of directors appointed Mr. R. K. Joshi, Chairman-cum-Managing Director, General InsuranceCorporation of India and Mr. Narendra Murkumbi, founder Managing Director, Shree Renuka Sugars Limited asnon-wholetime directors effective October 13, 2005 and January 20, 2006, respectively. The shareholders haveapproved their appointments at the annual general meeting held on July 22, 2006. Mr. Somesh Sathe who wasappointed as a non-wholetime director effective January 29, 1998 retired from our board effective January 28,2006, on completion of eight years as a non-wholetime director as provided in the Banking Regulation Act.
118

Mr. N. Vaghul was appointed as a director on March 27, 2002. He was appointed as non-wholetimechairman of the board effective May 3, 2002 for a period of three years. The board at its meeting on April 30,2005 reappointed him as non-wholetime chairman of the board until April 30, 2009 which has been approved bythe Reserve Bank of India.
Our board of directors had appointed Ms. Chanda Kochhar and Dr. Nachiket Mor as Executive Directorseffective April 1, 2001, Mr. K.V. Kamath and Ms. Lalita D. Gupte, previously non-wholetime directors on ourboard, as Managing Director & CEO and Joint Managing Director respectively, effective May 3, 2002 andMs. Kalpana Morparia as Executive Director, effective May 3, 2002. Our board subsequently re-appointedMs. Lalita D. Gupte, whose tenure of appointment was until June 23, 2004, as Joint Managing Director untilOctober 31, 2006. Ms. Gupte retired from the Bank effective November 1, 2006. Our board designatedMs. Kalpana Morparia as Deputy Managing Director effective February 1, 2004. Our board at its meeting heldon April 29, 2006 elevated Ms. Kalpana Morparia as Joint Managing Director and Ms. Chanda Kochhar andDr. Nachiket Mor as Deputy Managing Directors. The board and the shareholders have approved the followingre-appointments with respect to the wholetime directors of the Bank:
• Mr. K. V. Kamath, Managing Director & CEO, on the expiry of his current term, i.e., from May 1,2006, until April 30, 2009.
• Ms. Kalpana Morparia, Joint Managing Director, on the expiry of her current term, i.e., from May 1,2006, until May 31, 2007 (up to the date of retirement).
• Ms. Chanda Kochhar and Dr. Nachiket Mor, Deputy Managing Directors, on the expiry of their currentterms, i.e., from April 1, 2006, until March 31, 2011.
The Reserve Bank of India has approved the re-appointment of Mr. K. V. Kamath up to April 30, 2009,re-appointment of Ms. Kalpana Morparia up to May 31, 2007 and that of Ms. Chanda Kochhar and Dr. NachiketMor up to March 31, 2009 and of Ms. Kalpana Morparia up to May 31, 2007.
The Board at its Meeting held on October 24, 2006 appointed Mr. V. Vaidyanathan as the ExecutiveDirector of the Bank, effective October 24, 2006, for a period of five years i.e. up to October 23, 2011. Hisappointment is subject to the approval of the Reserve Bank of India and the Members of the Bank.
In order to comply with the provisions of the Companies Act and our organizational documents,Ms. Lalita D. Gupte and Ms. Kalpana Morparia and Mr. V. Vaidyanathan will be subject to retirement byrotation if at any time the number of non-rotational directors exceeds one-third of the total number of directors. Ifthey are re-appointed as directors immediately upon retirement by rotation, they will continue to hold theiroffices as wholetime directors, and the retirement by rotation and re-appointment shall not be deemed toconstitute a break in their appointment. Our other executive officers may hold office until they retire, unless theyare discharged earlier by us.
119

Our board of directors at November 30, 2006 had the following members:
Name, Designation and Profession Age Date of Appointment Other appointments
Mr. Narayanan VaghulChairman
Chairman:Board Governance & RemunerationCommitteeCredit CommitteeCustomer Service Committee(constituted on July 22, 2006)Risk Committee
Profession:Development Banker
70 March 27, 2002 ChairmanAsset Reconstruction Company (India) LimitedGIVE FoundationHimatsingka Seide LimitedICICI Knowledge ParkMahindra World City Developers Limited(formerly Mahindra Industrial Park Limited)Pratham India Education InitiativeDirectorAir India LimitedAir India Air Transport Services LimitedAir India Engineering Services LimitedApollo Hospitals Enterprise LimitedAzim Premji FoundationHemogenomics Private LimitedMahindra & Mahindra LimitedMittal Steel Company NVMittal Steel CaribbeanNicholas Piramal India LimitedTrans-India Acquisition CorporationWipro Limited
Mr. Sridar Iyengar
Chairman:Audit Committee
Profession:Business Advisor
59 April 30, 2005 DirectorAmerican India FoundationFoundation for Democratic Reforms in IndiaInc.Infosys Technologies LimitedKovair Software Inc.Mango Analytics Inc.Onmobile Asia Pacific LimitedProgeon LimitedRediff.com India LimitedRediff Holdings Inc.TiE Inc.
Mr. Ram Kishore JoshiChairman-cum-Managing Director
Profession:Company Executive
59 October 13, 2005 Chairman-cum-Managing DirectorGeneral Insurance Corporation of IndiaChairmanGIC Asset Management Company LimitedGIC Housing Finance LimitedLoss Prevention Association of India LimitedDirectorDeposit Insurance and Credit GuaranteeCorporationExport Credit Guarantee Corporation of IndiaLimited Indian Register of ShippingKenindia Assurance Company LimitedLife Insurance Corporation of IndiaThe Andhra Pradesh Paper Mills LimitedThe New India Assurance Company Limited
120

Name, Designation and Profession Age Date of Appointment Other appointments
Mr. Lakshmi Niwas Mittal
Profession:Industrialist
56 May 3, 2002 ChairmanMittal Steel Company N.V.CEOArcelor MittalDirectorArtha LimitedGalmatias LimitedLNM Capital LimitedLNM Internet Ventures LimitedLucre LimitedMittal Steel Company LimitedMittal Steel South Africa LimitedMittal Steel USA Inc.Nestor LimitedNuav LimitedONGC Mittal Energy LimitedONGC Mittal Energy Services LimitedPratham UK LimitedTommyfield LimitedPresidentIspat Inland U.L.C
Mr. Narendra Murkumbi
Profession:Industrialist
36 January 20, 2006 Managing DirectorShree Renuka Sugars LimitedDirectorMurkumbi Bioagro Private LimitedMurkumbi Industries Private LimitedDirector & CEORenuka Commodities DMCC
Mr. Anupam Pradip Puri
Profession:Management Consultant
61 May 3, 2002 DirectorDr. Reddy’s Laboratories LimitedMahindra & Mahindra LimitedTech Mahindra Limited (formerly MahindraBritish Telecom Limited)
Mr. Vinod RaiAdditional Special Secretary(Financial Sector)Ministry of Finance, Government ofIndia
Profession:Government Service
58 January 3, 2003 DirectorBank of BarodaIDBI LimitedIndian Infrastructure Finance CompanyLimitedInfrastructure Development Finance CompanyLimitedSmall Industries Development Bank of India
Mr. Mahendra Kumar Sharma
Chairman:Fraud Monitoring CommitteeShare Transfer & Shareholders’/Investors’ Grievance Committee
Alternate Chairman:Audit Committee
Profession:Company Executive
59 January 31, 2003 Vice-Chairman and wholetime DirectorHindustan Lever LimitedDirectorHind Lever Trust LimitedLever Associated Trust LimitedUnilever India Exports Limited (formerlyIndexport Limited)Unilever Nepal Limited (formerly Nepal LeverLimited)
121

Name, Designation and Profession Age Date of Appointment Other appointments
Mr. Priya Mohan Sinha
Profession:Professional Manager
66 January 22, 2002 ChairmanBata India LimitedDirectorAzim Premji FoundationIndian Oil Corporation LimitedLafarge India Private LimitedWipro Limited
Prof. Marti Gurunath Subrahmanyam
Profession:Professor
60 May 3, 2002 DirectorInfosys Technologies LimitedInternational School of Business ManagementLimitedNomura Asset Management (U.S.A.), Inc.Supply Chainge Inc.The Animi Offshore Fund LimitedThe Animi Offshore Concentrated Risk FundUsha Communication Inc.Director—Board of GovernorsNational Institute of Securities MarketsDirector—Advisory BoardMetahelix Life Sciences Private LimitedMicrocredit Foundation of India
Mr. T.S. Vijayan
Profession:Company Executive
53 April 30, 2005 ChairmanLife Insurance Corporation of IndiaNon-Executive ChairmanLIC Housing Finance LimitedLIC Mutual Fund Asset ManagementCompany Limited (formerly Jeevan BimaSahyog Asset Management Company LimitedLIC International B.S.C (C)LIC (Nepal) LimitedLIC (Lanka) LimitedLIC (Mauritius) Offshore LimitedDirectorGeneral Insurance Corporation of IndiaKenindia Assurance Company LimitedNational Commodities & DerivativesExchange Limited
Mr. V. Prem Watsa
Profession:Company Executive
56 January 29, 2004 Chairman & CEOFairfax Financial Holdings LimitedChairmanCrum & Foster Holdings Corp.Northbridge Financial CorporationTIG Holdings, Inc.DirectorLindsey Morden Group Inc.Odyssey Re Holdings Corp.
122

Name, Designation and Profession Age Date of Appointment Other appointments
Mr. Kundapur Vaman KamathManaging Director & CEO
Chairman:Committee of Directors
Profession:Company Executive
59 April 17, 1996(Managing Director& CEO effectiveMay 3, 2002)
ChairmanICICI Bank CanadaICICI Bank UK PlcICICI Lombard General Insurance CompanyLimitedICICI Prudential Life Insurance CompanyLimitedICICI Securities LimitedPrudential ICICI Asset Management CompanyLimited DirectorIndian Institute of Management, AhmedabadVisa International Asia Pacific Regional BoardMember—Governing BoardIndian School of Business
Ms. Kalpana MorpariaJoint Managing Director
Profession:Company Executive
57 May 3, 2002 DirectorICICI Lombard General Insurance CompanyLimitedICICI Prudential Life Insurance CompanyLimitedICICI Securities LimitedPrudential ICICI Asset Management CompanyLimited
Ms. Chanda KochharDeputy Managing Director
Profession:Company Executive
45 April 1, 2001 ChairpersonICICI Bank Eurasia Limited LiabilityCompanyICICI Investment Management CompanyLimitedICICI Home Finance Company LimitedDirectorICICI Prudential Life Insurance CompanyLimitedICICI Bank CanadaICICI Bank UK Plc
Dr. Nachiket MorDeputy Managing Director
Profession:Company Executive
42 April 1, 2001 DirectorCare, USAICICI Home Finance Company LimitedICICI Knowledge ParkICICI Securities LimitedICICI Venture Funds Management CompanyLimitedPratham India Education Initiative
Mr. V. VaidyanathanExecutive Director
Profession:Company Executive
38 October 24, 2006 Director:ICICI Home Finance Company LimitedICICI Lombard General Insurance CompanyLimited
123

Our executive officers at November 30, 2006 were as follows:
Name AgeDesignation andResponsibilities
Years ofwork
experience
Totalremuneration
in fiscal2006(1)
(in Rupees)
Bonus forfiscal
2006(2)
(in Rupees)
Stockoptionsgrantedin fiscal2006(4)
Stockoptionsgrantedin fiscal2007(6)
Share-holdings
September 30,2006(3)
Total stockoptionsgrantedthrough
September 30,2006(5)
Total stockoptions
outstanding atSeptember 30,
2006(5)
Mr. K.V. Kamath . . . . . . . 58 Managing Director &CEO
35 19,564,981 5,215,200 250,000 250,000 164,500 1,275,000 1,090,000
Ms. Kalpana Morparia . . . 57 Joint ManagingDirector—CorporateCentre
31 10,511,539 3,180,000 150,000 165,000 21,190 805,000 785,000
Ms. Chanda D.Kochhar . . . . . . . . . . . . 44 Deputy Managing
Director—International& Corporate Banking
22 9,003,983 2,385,000 125,000 125,000 176,575 630,000 402,500
Dr. Nachiket Mor . . . . . . 42 Deputy ManagingDirector—RuralBanking & ProprietaryTrading
19 7,389,013 2,385,000 125,000 125,000 0 627,000 360,000
Mr.V. Vaidyanathan . . . . 38 Executive Director—Retail Banking
16 6,172,241 2,760,000 75,000 75,000 32,710 334,900 211,250
Ms. Vishakha Mulye . . . . 37 Chief Financial Officerand Treasurer
13 4,330,531 2,400,000 75,000 75,000 34,555 285,975 234,920
Ms. MadhabiPuri-Buch . . . . . . . . . . . 40 Senior General
Manager17 5,054,338 2,760,000 75,000 75,000 1,411 354,900 297,450
Mr. K. Ramkumar . . . . . . 45 Senior GeneralManager
21 4,999,981 2,640,000 75,000 75,000 0 255,000 222,000
Mr. Pravir Vohra . . . . . . . 52 Senior GeneralManager
31 4,964,145 2,400,000 37,500 40,000 21,000 179,500 135,500
(1) Including ICICI Bank’s contribution to the superannuation fund, provident fund and leave travel allowance and excluding bonus payable for fiscal 2005which was paid in fiscal 2006. Includes aggregate leave travel allowance availed during the year: K.V. Kamath—Rs. 2,050,000 (US$ 44,614), Lalita D.Gupte—Rs. 4,050,000 (US$ 88,139), Kalpana Morparia—Rs. 1,250,000 (US$ 27,251), Chanda D. Kochhar—Rs. 2,187,500 (US$ 47,606), NachiketMor—Rs. Nil (US$ Nil) and all other executive officers Rs. 2,500,000 (US$ 54,407) and leave encashment: K.V. Kamath—Rs. 1,230,000 (US$ 26,768),Lalita D. Gupte—Rs. 676,500 (US$ 14,723), Kalpana Morparia—Rs. 550,000 (US$ 11,970) and Chanda D. Kochhar—Rs. 12,500 (US$ 272), NachiketMor—Rs. Nil (US$ Nil) and all other executive officers Rs. 429,332 (US$ 9,343).
(2) Bonus for fiscal 2006 was paid in fiscal 2007.(3) Executive officers and directors as a group held around 0.5% of ICICI Bank’s equity shares as of this date.(4) Each stock option, once exercised, is equivalent to one equity share of ICICI Bank. ICICI Bank granted these stock options to its executive officers at no
cost. See “—Compensation and Benefits to Directors and Officers—Employee Stock Option Scheme” for a description of the other terms of these stockoptions.
(5) In accordance with the Scheme of Amalgamation, directors and employees of ICICI have received stock options in ICICI Bank equal to half the number ofthe outstanding unexercised stock options they held in ICICI with the exercise price of these options being equal to twice the exercise price for the ICICIstock options exchanged. The stock options mentioned above include ICICI stock options converted into ICICI Bank stock options on this basis.
(6) Through September 30, 2006.
Mr. K.V. Kamath is a mechanical engineer and a post-graduate in business management from the Indian Institute ofManagement, Ahmedabad. He joined ICICI in 1971 and worked in the areas of project finance, leasing, resources and corporateplanning. In 1988, he left ICICI to join the Asian Development Bank, where he worked for six years. In January 1995, he joineda private sector group in Indonesia as advisor to its chairman. Mr. Kamath joined the board of directors of ICICI in October1995. He was appointed Managing Director & CEO of ICICI in May 1996 and was re-appointed in May 2001. Mr. Kamath wasa non-wholetime director on the board of ICICI Bank from April 1996. Effective May 3, 2002 our board appointed Mr. Kamathas Managing Director & CEO. Our board, shareholders and the Reserve Bank of India have approved his re-appointment asManaging Director & CEO until April 30, 2009.
Ms. Kalpana Morparia holds Bachelor’s degrees in science and law. She worked in the legal department of ICICI from1975 to 1994. From 1996, when she was designated as General Manager, she was in charge of the legal, planning, treasury andcorporate communications departments. In 1998, she was designated a Senior General Manager of ICICI. She joined the boardof directors of ICICI in May 2001. Effective May 3, 2002 our board appointed Ms. Morparia as an Executive Director. Effective
124

February 1, 2004, our board designated her as Deputy Managing Director. Effective April 29, 2006, our boardelevated her as Joint Managing Director. She is currently in charge of the Corporate Centre which includestransaction processing and operations for wholesale, retail, rural and international banking, strategy, riskmanagement, compliance, audit, legal, finance, treasury, secretarial, human resources management, corporatecommunications and facilities management and administration functions. Our board, shareholders and theReserve Bank of India have approved her re-appointment as a wholetime director until May 31, 2007
Ms. Chanda D. Kochhar holds a management degree from the Jamnalal Bajaj Institute of ManagementStudies, Mumbai and a degree in cost and works accountancy from the Institute of Cost and Works Accountantsof India. She started her career in 1984 with ICICI in its project finance department and has worked in the areasof corporate credit, infrastructure financing, e-commerce, strategy and retail finance. Ms. Kochhar wasdesignated a Senior General Manager of ICICI in 2000 and was in charge of its retail business over the past sixyears. She was appointed to our board as an Executive Director in April 2001. Effective April 29, 2006, ourboard elevated her as Deputy Managing Director. She is currently responsible for retail and corporate banking.Our board and shareholders have approved her re-appointment as a wholetime director until March 31, 2011 onthe expiry of her current term of appointment on March 31, 2006. The Reserve Bank of India has approved herre-appointment up to March 31, 2009.
Dr. Nachiket Mor holds a post-graduate diploma in finance management from the Indian Institute ofManagement, Ahmedabad and a Doctorate of Philosophy in Financial Economics from the University ofPennsylvania, Philadelphia, USA. He started his career as an officer in the corporate planning and policy cell ofICICI in 1987. He has worked in the areas of project and corporate finance, corporate planning and treasury.Dr. Mor was designated a Senior General Manager of ICICI in 2000 and was in charge of treasury. He wasappointed to our board of directors as an Executive Director in April 2001. Effective April 29, 2006, our boardelevated him as Deputy Managing Director. He is currently responsible for rural banking, government banking,structural rate risk management and proprietary trading. Our board and shareholders have approved hisre-appointment as a wholetime director until March 31, 2011 on the expiry of his current term of appointment onMarch 31, 2006. The Reserve Bank of India has approved his re-appointment up to March 31, 2009.
Mr. V. Vaidyanathan has Bachelor’s and Master’s degrees in business administration from the Birla Instituteof Technology & Science, Ranchi. He worked in Citibank N.A. before joining ICICI in 2000 in the personalfinancial services division. In 2003 he was designated a Senior General Manager of ICICI Bank. Currently, he isresponsible for retail banking.
Mr. K. Ramkumar is a science graduate from Madras University with post-graduate diploma in industrialrelations and labor laws. He worked with ICI India before joining ICICI in 2001 in the human resourcesdepartment. In 2004, he was designated as Senior General Manager of ICICI Bank and he is currently in chargeof human resources management, facilities management and administration and retail infrastructure.
Ms. Madhabi Puri-Buch is a graduate in mathematical economics and has a post-graduate degree inmanagement from the Indian Institute of Management, Ahmedabad. She joined ICICI in 1989 in the projectfinance department. She left ICICI in 1992 and worked in ANZ Grindlays Bank and ORG MARG Researchbefore joining ICICI again in January 1997 in the planning and treasury department. In 2003 she was designateda Senior General Manager of ICICI Bank. Currently, she is responsible for operations and service delivery andthe corporate brand management function.
Mr. Pravir Vohra is a post-graduate in economics from Delhi University. He was Joint President in 3iInfotech Limited (formerly ICICI Infotech Limited) before he joined ICICI Bank in 2002. He was designated asSenior General Manager in 2005 and he is currently in charge of technology.
Ms. Vishakha Mulye is a commerce graduate from Mumbai University, and a chartered accountant.Ms. Mulye joined ICICI in 1993 in the project finance department. She was designated as Senior GeneralManager in 2004. Currently she is our Chief Financial Officer and Treasurer.
125

Corporate Governance
Our corporate governance policies recognize the accountability of the board and the importance of makingthe board transparent to all its constituents, including employees, customers, investors and the regulatoryauthorities, and to demonstrate that the shareholders are the ultimate beneficiaries of our economic activities.
Our corporate governance framework is based on an effective independent board, the separation of theboard’s supervisory role from the executive management and the constitution of board committees, generallycomprising a majority of independent directors and chaired by an independent director, to oversee critical areasand functions of executive management.
Our corporate governance philosophy encompasses not only regulatory and legal requirements, such as theterms of listing agreements with stock exchanges, but also several voluntary practices aimed at a high level ofbusiness ethics, effective supervision and enhancement of value for all stakeholders.
Our board’s role, functions, responsibility and accountability are clearly defined. In addition to its primaryrole of monitoring corporate performance, the functions of our board include:
• approving corporate philosophy and mission;
• participating in the formulation of strategic and business plans;
• reviewing and approving financial plans and budgets;
• monitoring corporate performance against strategic and business plans, including overseeingoperations;
• ensuring ethical behavior and compliance with laws and regulations;
• reviewing and approving borrowing limits;
• formulating exposure limits; and
• keeping shareholders informed regarding plans, strategies and performance.
To enable our board of directors to discharge these responsibilities effectively, executive management givesdetailed reports on our performance to the board on a quarterly basis.
Our board functions either as a full board or through various committees constituted to oversee specificoperational areas. These board committees meet regularly. The constitution and main functions of the variouscommittees are given below
In view of similarity of powers and functions of the Agriculture & Small Enterprises Business Committeeand Credit Committee, Agriculture & Small Enterprises Business Committee was dissolved effective October 13,2005 and the powers of the Agriculture & Small Enterprises Business Committee were vested in the CreditCommittee. Further, as the Bank’s budget and other strategic issues were being reviewed directly by the Board,the Business Strategy Committee was dissolved with effect from April 29, 2006. Further, a separate CustomerService Committee was constituted by the Board at its Meeting held on July 22, 2006 and the powers relating tocustomer service (which earlier vested with the Audit Committee and subsequently the Risk Committee) havebeen delegated to this Committee.
Audit Committee
The Audit Committee comprises three independent directors—Mr. Sridar Iyengar, who is a CharteredAccountant, Mr. M.K. Sharma and Mr. Narendra Murkumbi. Mr. Sridar Iyengar is the Chairman of theCommittee. Mr. M.K. Sharma was appointed as Alternate Chairman of the Committee effective July 22, 2004.Our board of directors has determined that Mr. Sridar Iyengar qualifies as an audit committee financial expert.
126

The Audit Committee provides direction to the audit function and monitors the quality of the internal andstatutory audit. The responsibilities of the Audit Committee include overseeing the financial reporting process toensure fairness, sufficiency and credibility of financial statements, recommendation of appointment and removalof central and branch statutory auditors and chief internal auditor and fixation of their remuneration, approval ofpayment to statutory auditors for other services rendered by them, review of functioning of Whistle BlowerPolicy, review of the quarterly financial statements before submission to Board, review of the adequacy ofinternal control systems and the internal audit function, review of compliance with the inspection and auditreports and reports of statutory auditors, review of the findings of internal investigations, review of statement ofsignificant related party transactions, review of management letters/letter of internal control weaknesses issuedby statutory auditors, discussion on the scope of audit with external auditors and examination of reasons forsubstantial defaults, if any, in payment to stakeholders. The Audit Committee provides direction to the internalaudit function and monitors the quality of internal and statutory audit.
In addition, as required by Rule 10A-3 under the Exchange Act, the Audit Committee is empowered toappoint and oversee the work of any registered public accounting firm, establish procedures for the receipt andtreatment of complaints regarding accounting and auditing matters, engage independent counsel and provide forappropriate funding for compensation to be paid to any advisors.
All audit and non-audit services to be provided by our principal accountants are pre-approved by the AuditCommittee before such services are provided to us.
Board Governance & Remuneration Committee
The Board Governance & Remuneration Committee comprises five independent directors—Mr. N. Vaghul,Mr. Anupam Puri, Mr. M.K. Sharma, Mr. P. M. Sinha, and Prof Marti G. Subrahmanyam. Mr. N. Vaghul is theChairman of the Committee.
The functions of the Board Governance & Remuneration Committee include recommendation ofappointments to our board, evaluation of the performance of the Managing Director & CEO and other wholetimeDirectors on pre-determined parameters, recommendation to our board of the remuneration (includingperformance bonuses and perquisites) to wholetime directors, approving the policy for and quantum of bonuspayable to the members of the staff, framing guidelines for the employees stock option scheme andrecommendation of grant of stock options to the staff and wholetime directors of ICICI Bank and its subsidiarycompanies.
Credit Committee
The Credit Committee comprises five directors—Mr. N. Vaghul, Mr. Narendra MurkumbiMr. M. K. Sharma, Mr. P. M. Sinha and Mr. K. V. Kamath. The majority of the members of the committee areindependent directors and Mr. N. Vaghul is the Chairman of the Committee.
The functions of this Committee include review of developments in key industrial sectors and approval ofcredit proposals in accordance with the authorization approved by our board. The functions of this Committeealso include review of our business strategy in the agri-business and small enterprises segments and review of thequality of the agricultural lending and small enterprises finance credit portfolio.
Customer Service Committee
The Customer Service Committee comprises five directors—Mr. N. Vaghul, Mr. Narendra Murkumbi,Mr. M. K. Sharma, Mr. P. M. Sinha and Mr. K. V. Kamath. The majority of the members of the committee areindependent directors and Mr. N. Vaghul is the Chairman of the Committee.
The functions of this Committee include review of customer service initiatives and overseeing thefunctioning of the Customer Service Council.
127
Fraud Monitoring Committee
The Committee comprises five directors—Mr. M.K. Sharma, Mr. Narendra Murkumbi, Mr. K.V. Kamath,Ms. Kalpana Morparia and Ms. Chanda D. Kochhar. Mr. M.K. Sharma is the Chairman of the Committee.
The functions of the Fraud Monitoring Committee include monitoring and review of all instances of fraudsinvolving Rs.10.0 million (US$ 218,007) and above.
Risk Committee
The Risk Committee comprises five directors—Mr. N. Vaghul, Mr. Sridar Iyengar, Prof. Marti G.Subrahmanyam, Mr. V. Prem Watsa and Mr. K. V. Kamath. The majority of the members of this committee areindependent directors and Mr. N. Vaghul is the Chairman of the Committee.
This Committee reviews risk management policies in relation to various risks (credit, portfolio, liquidity,interest rate, off-balance sheet and operational risks), investment policies and strategy and regulatory andcompliance issues in relation thereto.
Share Transfer & Shareholders’/Investors’ Grievance Committee
The Share Transfer & Shareholders’/Investors’ Grievance Committee comprises four directors—Mr. M.K. Sharma, Mr. Narendra Murkumbi, Ms. Kalpana Morparia and Ms. Chanda D. Kochhar. Mr. M.K.Sharma, an independent director, is the Chairman of the Committee.
The functions and powers of the Share Transfer & Shareholders’/Investors’ Grievance Committee includeapproval and rejection of transfer or transmission of equity and preference shares, bonds, debentures andsecurities, issue of duplicate certificates, allotment of shares and securities issued from time to time, includingthose under stock options, review and redressal of shareholders’ and investors’ complaints, delegation ofauthority for opening and operation of bank accounts for payment of interest, dividend and redemption ofsecurities and the listing of securities on stock exchanges.
Committee of Directors
The Committee of Directors comprises all five wholetime directors and Mr. K.V. Kamath, ManagingDirector & CEO is the Chairman of the Committee.
The powers of the Committee include credit approvals as per authorization approved by our board,approvals in respect of borrowing and treasury operations and premises and property related matters and reviewof performance against targets for various business groups.
Asset-Liability Management Committee
The Asset Liability Management Committee comprises the Joint Managing Directors and Deputy ManagingDirectors and Ms. Lalita D. Gupte Kalpana Morparia, Joint Managing Director is the Chairperson of theCommittee.
The functions of the Committee include management of our balance sheet, review of the asset-liabilityprofile with a view to manage the market risk exposure assumed by us and deciding our deposit rates and primelending rate.
Compensation and Benefits to Directors and Officers
Remuneration
Under our organizational documents, each non-wholetime director, except the government director, isentitled to receive remuneration for attending each meeting of our board or of a board committee. The amount of
128

remuneration payable to non-wholetime directors is set by our board from time to time in accordance withlimitations prescribed by the Indian Companies Act or the government of India. The remuneration for attendingeach board or committee meeting is currently fixed at Rs. 20,000 (US$ 436). In addition, ICICI Bank reimbursesdirectors for travel and related expenses in connection with board and committee meetings and related matters. Ifa director is required to perform services for ICICI Bank beyond attending meetings, ICICI Bank mayremunerate the director as determined by our board of directors and this remuneration may be either in additionto or as substitution for the remuneration discussed above. We have not paid any remuneration to non-wholetimedirectors other than the remuneration for attending each meeting of our board or of a board committee.Non-wholetime directors are not entitled to the payment of any benefits at the end of their term of office.
Our board or any committee thereof may fix within the range stated below, the salary payable to thewholetime directors.
Mr. K.V. Kamath, Managing Director & CEO Rs. 600,000 – Rs. 1,050,000 (US$ 13,058 to US$ 22,851) per monthMs. Lalita D. Gupte, Joint Managing Director Rs. 400,000 – Rs. 900,000 (US$ 8,705 to US$ 19,587) per monthMs. Kalpana Morparia, Joint Managing Director Rs. 300,000 – Rs. 900,000 (US$ 6,529 to US$ 19,587) per monthMs. Chanda D. Kochhar, Deputy Managing Director Rs. 200,000 – Rs. 500,000 (US$ 4,353 to US$ 10,881) per monthDr. Nachiket Mor, Deputy Managing Director Rs. 200,000 – Rs. 500,000 (US$ 4,353 to US$ 10,881) per monthMr. V. Vaidyanathan, Executive Director Rs. 200,000 – Rs. 500,000 (US$ 4,353 to US$ 10,881) per month
We are required to obtain specific approval of the Reserve Bank of India for the actual monthly salary andperformance bonus paid each year to the wholetime directors. The Reserve Bank of India has approved thepayment of performance bonus to our wholetime directors for fiscal 2006 and the monthly salary payable forfiscal 2007. None of the service contracts with our directors provide for benefits upon termination ofengagement. The remuneration payable to Mr. Vaidyanathan is subject to the approval of the Reserve Bank ofIndia and our shareholders.
The wholetime directors are entitled to perquisites (evaluated pursuant to Indian Income-Tax Rules,wherever applicable, and otherwise at actual cost to ICICI Bank), such as furnished accommodation, gas,electricity, water and furnishings, club fees, personal insurance, use of car and telephone at residence orreimbursement of expenses in lieu thereof, payment of income-tax on perquisites by ICICI Bank to the extentpermissible under the Indian Income-tax Act, 1961 and the Rules framed thereunder, medical reimbursement,leave and leave travel concession, education benefits, provident fund, superannuation fund, gratuity and otherretirement benefits, in accordance with the scheme(s) and rule(s) applicable to employees of ICICI Bank fromtime to time.
Where accommodation is not provided, each of the wholetime directors is eligible for a house rentallowance of Rs. 50,000 (US$ 1,090) per month and maintenance of accommodation including furniture, fixturesand furnishings, as may be provided by ICICI Bank.
Employee Stock Option Scheme
On January 24, 2000, our board approved an employee stock option scheme to attract, encourage and retainhigh performing employees. Our shareholders approved this scheme at the extraordinary general meeting onFebruary 21, 2000. This scheme was drafted in accordance with guidelines issued by the Securities and ExchangeBoard of India. Under this scheme, up to 5.0% of our issued equity shares at March 31, 2000 could be allocatedto employee stock options. The employee stock option scheme as amended by the Scheme of Amalgamationrestricted the maximum number of options granted to any eligible employee (as defined below) in a year islimited to 0.05% of our issued equity shares at the time of the grant, and the aggregate of all such options to 5.0%of our issued equity shares following the amalgamation. In April 2004, our board approved the recommendationof the Board Governance & Remuneration Committee to modify the limit of the aggregate number of optionsthat could be granted under the employee stock option scheme to 5.0% of our issued capital as on the date ofgrant. The shareholders approved the modification at our annual general meeting held on September 20, 2004.
129

Under the stock option scheme, eligible employees are entitled to apply for equity shares. An eligibleemployee is a permanent employee or a director of ICICI Bank or of its subsidiaries or its holding company.ICICI Bank has no holding company.
The options granted for fiscal 2003 and earlier vest annually in a graded manner over a three-year period,with 20.0%, 30.0% and 50.0% of the grants vesting each year, commencing not earlier than 12 months from thedate of grant. Options granted for fiscal 2004 and thereafter vest in a graded manner over a four-year period with20.0%, 20.0%, 30.0% and 30.0% of grants vesting each year, commencing from the end of 12 months from thedate of grant. The options can be exercised within 10 years from the date of grant or five years from the date ofvesting, whichever is later.
The exercise price for options granted prior to June 30, 2003 is equal to the market price of our equity shareson the date of grant on the stock exchange, which recorded the highest trading volume on the date of grant. OnJune 30, 2003, the Securities and Exchange Board of India revised its guidelines on employee stock options.While the revised guidelines provided that companies were free to determine the exercise price of stock optionsgranted by them, they prescribed accounting rules and other disclosures, including expensing of stock options inthe income statement, which are applicable to our Indian GAAP financial statements, in the event the exerciseprice was not equal to the average of the high and low market price of the equity shares in the two week periodpreceding the date of grant of the options, on the stock exchange which recorded the highest trading volumeduring the two week period. Effective July 22, 2004, the Securities and Exchange Board of India revised thisbasis of pricing to the latest available closing price, prior to the date of the meeting of the board of directors inwhich options are granted, on the stock exchange which recorded the highest trading volume on that date. Theexercise price for options granted by ICICI Bank on or after June 30, 2003, but before July 22, 2004 is equal tothe average of the high and low market price of the equity shares in the two week period preceding the date ofgrant of the options, on the stock exchange which recorded the highest trading volume during the two weekperiod. The exercise price of options granted on or after July 22, 2004 is equal to the closing price on the stockexchange which recorded the highest trading volume preceding the date of grant of options.
The following table sets forth certain information regarding the stock option grants ICICI Bank has madeunder its employee stock option scheme. ICICI Bank granted all of these stock options at no cost to itsemployees. ICICI Bank has not granted any stock options to its non-wholetime directors.
Date of grantNumber of options
granted Exercise price
February 21, 2000 . . . . . . . . . . . . . . . . . . . . . . . . . . . . . . 1,713,000 Rs.171.90 US$ 3.74April 26, 2001 . . . . . . . . . . . . . . . . . . . . . . . . . . . . . . . . . 1,580,200 170.00 3.70March 27, 2002 . . . . . . . . . . . . . . . . . . . . . . . . . . . . . . . . 3,155,000 120.35 2.62April 25, 2003 . . . . . . . . . . . . . . . . . . . . . . . . . . . . . . . . . 7,338,300 132.05 2.87July 25, 2003 . . . . . . . . . . . . . . . . . . . . . . . . . . . . . . . . . . 147,500 157.03 3.42October 31, 2003 . . . . . . . . . . . . . . . . . . . . . . . . . . . . . . . 6,000 222.40 4.84April 30, 2004 . . . . . . . . . . . . . . . . . . . . . . . . . . . . . . . . . 7,539,500 300.10 6.53September 20, 2004 . . . . . . . . . . . . . . . . . . . . . . . . . . . . . 15,000 275.20 6.00April 30, 2005 . . . . . . . . . . . . . . . . . . . . . . . . . . . . . . . . . 4,906,180 359.95 7.83August 20, 2005 . . . . . . . . . . . . . . . . . . . . . . . . . . . . . . . 70,600 498.20 10.84January 20, 2006 . . . . . . . . . . . . . . . . . . . . . . . . . . . . . . . 5,000 569.55 12.39April 29,2006 . . . . . . . . . . . . . . . . . . . . . . . . . . . . . . . . . . 6,267,400 576.80 12.55
130

ICICI also had an employee stock option scheme for its directors and employees and the directors andemployees of its subsidiary companies, the terms of which were substantially similar to the employee stockoption scheme of ICICI Bank. The following table sets forth certain information regarding the stock optiongrants made by ICICI under its employee stock option scheme prior to the amalgamation. ICICI granted all ofthese stock options at no cost to its employees. ICICI had not granted any stock options to its non-wholetimedirectors.
Date of grantNumber of options
granted Exercise price
August 3, 1999 . . . . . . . . . . . . . . . . . . . . . . . . . . . . . . . . . 2,323,750 Rs. 85.55 US$1.86April 28, 2000 . . . . . . . . . . . . . . . . . . . . . . . . . . . . . . . . . . 2,902,500 133.40 2.90November 14, 2000 . . . . . . . . . . . . . . . . . . . . . . . . . . . . . . 20,000 82.90 1.80May 3, 2001 . . . . . . . . . . . . . . . . . . . . . . . . . . . . . . . . . . . . 3,145,000 82.00 1.78August 13, 2001 . . . . . . . . . . . . . . . . . . . . . . . . . . . . . . . . 60,000 52.50 1.14March 27, 2002 . . . . . . . . . . . . . . . . . . . . . . . . . . . . . . . . . 6,473,700 60.25 1.31
(1) The exercise price is equal to the market price of ICICI’s equity shares on the date of grant. However, theshare options granted on August 3, 1999 were accounted as a variable plan resulting in a compensation costof Rs. 97 million (US$ 2 million) which is being amortized over the vesting period.
In accordance with the Scheme of Amalgamation, directors and employees of ICICI and its subsidiarycompanies received stock options in ICICI Bank equal to half the number of their outstanding unexercised stockoptions in ICICI. The exercise price for these options is equal to twice the exercise price for the ICICI stockoptions. All other terms and conditions of these options are similar to those applicable to ICICI Bank’s stockoptions pursuant to its employee stock option scheme.
The following table sets forth certain information regarding the options granted by ICICI Bank (includingoptions granted by ICICI adjusted in accordance with the Scheme of Amalgamation) at September 30, 2006.
Particulars ICICI Bank
Options granted . . . . . . . . . . . . . . . . . . . . . . . . . . . . . . . . . . . . . . . . . . . . . . . . . . . . 40,206,155Options vested . . . . . . . . . . . . . . . . . . . . . . . . . . . . . . . . . . . . . . . . . . . . . . . . . . . . . 22,546,132Options exercised . . . . . . . . . . . . . . . . . . . . . . . . . . . . . . . . . . . . . . . . . . . . . . . . . . 15,823,416Options forfeited/lapsed . . . . . . . . . . . . . . . . . . . . . . . . . . . . . . . . . . . . . . . . . . . . . 4,431,460Extinguishment or modification of options . . . . . . . . . . . . . . . . . . . . . . . . . . . . . . NoneAmount realized by sale of options . . . . . . . . . . . . . . . . . . . . . . . . . . . . . . . . . . . . Rs.2,491,245,6000Total number of options in force . . . . . . . . . . . . . . . . . . . . . . . . . . . . . . . . . . . . . . 19,951,279
131

OVERVIEW OF THE INDIAN FINANCIAL SECTOR
The information in this section has been extracted from publicly available documents from various sources,including officially prepared materials from the Government of India and its various ministries and the ReserveBank of India, and has not been prepared or independently verified by us. This is the latest available informationto our knowledge at December 12, 2006.
Introduction
The Reserve Bank of India, the central banking and monetary authority of India, is the central regulatoryand supervisory authority for the Indian financial system. A variety of financial intermediaries in the public andprivate sectors participate in India’s financial sector, including the following:
• commercial banks;
• long-term lending institutions;
• non-bank finance companies, including housing finance companies;
• other specialized financial institutions, and state-level financial institutions;
• insurance companies; and
• mutual funds.
Until the early 1990s, the Indian financial system was strictly controlled. Interest rates were administered,formal and informal parameters governed asset allocation, and strict controls limited entry into and expansionwithin the financial sector. The Government of India’s economic reform program, which began in 1991,encompassed the financial sector. The first phase of the reform process began with the implementation of therecommendations of the Committee on the Financial System, the Narasimham Committee I. The second phase ofthe reform process began in 1999. See “Banking Sector Reform—Committee on Banking Sector Reform(Narasimham Committee II)”.
This discussion presents an overview of the role and activities of the Reserve Bank of India and of each ofthe major participants in the Indian financial system, with a focus on the commercial banks. This is followed by abrief summary of the banking reform process along with the recommendations of various committees that haveplayed a key role in the reform process. A brief discussion on the impact of the liberalization process on long-term lending institutions and commercial banks is then presented. Finally, reforms in the non-banking financialsector are briefly reviewed.
Reserve Bank of India
The Reserve Bank of India, established in 1935, is the central banking and monetary authority in India. TheReserve Bank of India manages the country’s money supply and foreign exchange and also serves as a bank forthe Government of India and for the country’s commercial banks. In addition to these traditional central bankingroles, the Reserve Bank of India undertakes certain developmental and promotional roles.
The Reserve Bank of India issues guidelines on exposure limits, income recognition, asset classification,provisioning for non-performing and restructured assets, investment valuation and capital adequacy forcommercial banks, long-term lending institutions and non-bank finance companies. The Reserve Bank of Indiarequires these institutions to furnish information relating to their businesses to it on a regular basis. For furtherdiscussion regarding the Reserve Bank of India’s role as the regulatory and supervisory authority of India’sfinancial system and its impact on us, see “Supervision and Regulation”.
Commercial Banks
Commercial banks in India have traditionally focused only on meeting the short-term financial needs ofindustry, trade and agriculture. At June 30, 2006, there were 194 scheduled commercial banks in the country,
132

with a network of 69,104 branches serving approximately Rs. 21.72 trillion (US$ 473 billion) in depositaccounts. Scheduled commercial banks are banks that are listed in the schedule to the Reserve Bank of India Act,1934, and are further categorized as public sector banks, private sector banks and foreign banks. Scheduledcommercial banks have a presence throughout India, with approximately 66.5% of bank branches located in ruralor semi-urban areas of the country. A large number of these branches belong to the public sector banks.
Public Sector Banks
Public sector banks make up the largest category in the Indian banking system. They include the State Bankof India and its seven associate banks, 19 nationalized banks and 109 regional rural banks. Excluding the regionalrural banks, the remaining public sector banks have 47,950 branches, and accounted for 70.2% of the outstandinggross bank credit and 71.4% of the aggregate deposits of the scheduled commercial banks at June 30, 2006. Thepublic sector banks’ large network of branches enables them to fund themselves out of low cost deposits.
The State Bank of India is the largest bank in India. At June 30, 2006, the State Bank of India and its sevenassociate banks had 13,892 branches. They accounted for 22.9% of aggregate deposits and 22.6% of outstandinggross bank credit of all scheduled commercial banks.
Regional rural banks were established from 1976 to 1987 by the central government, state governments andsponsoring commercial banks jointly with a view to develop the rural economy. Regional rural banks providecredit to small farmers, artisans, small entrepreneurs and agricultural laborers. The National Bank for Agricultureand Rural Development is responsible for regulating and supervising the functions of the regional rural banks. In1986 the Kelkar Committee made comprehensive recommendations covering both the organizational andoperational aspects of regional rural banks, several of which were incorporated as amendments to the RegionalRural Banking Act, 1976. As part of comprehensive restructuring programme, recapitalization of the regionalrural banks was initiated in fiscal 1995, a process which continued until fiscal 2000 and covered 187 regionalrural banks with aggregate financial support of Rs. 21.88 billion (US$ 476 million) from the stakeholders.Simultaneously, prudential norms on income-recognition, asset classification and provisioning for loan-lossesfollowing customary banking benchmarks were introduced.
At June 30, 2006, there were 109 regional rural banks with 14,369 branches, accounting for 3.2% ofaggregate deposits and 2.6% of gross bank credit outstanding of scheduled commercial banks. During fiscal 2006and the first half of fiscal 2007, the number of regional rural banks was reduced from 173 to 109 throughamalgamations of several regional rural banks.
Private Sector Banks
After the first phase of bank nationalization was completed in 1969, public sector banks made up the largestportion of Indian banking. The focus on public sector banks was maintained throughout the 1970s and 1980s. Inaddition, existing private sector banks that showed signs of an eventual default were merged with state-ownedbanks. In July 1993, as part of the banking reform process and as a measure to induce competition in the bankingsector, the Reserve Bank of India permitted entry of the private sector into the banking system. This resulted inthe introduction of private sector banks, including ICICI Bank. These banks are collectively known as the “new”private sector banks. At the end of June 2005, there were nine “new” private sector banks. A merger between twoof these banks, Centurion Bank and Bank of Punjab, came into effect from October 1, 2005. In addition, 21private sector banks existing prior to July 1993 were operating at year-end fiscal 2006. There were a total of 29private sector banks at June 30, 2006.
At June 30, 2006, private sector banks accounted for approximately 20.0% of aggregate deposits and 20.3%of gross bank credit outstanding of the scheduled commercial banks. Their network of 6,543 branches accountedfor 9.5% of the total branch network of scheduled commercial banks in the country. At June 30, 2006, ICICIBank accounted for approximately 8.4% of aggregate deposits and 9.5% of non-food credit outstanding of thescheduled commercial banks.
133

During fiscal 2007 (through December 2006), two private sector banks were merged with two other privatesector banks under schemes of amalgamation by the government of India. See also “Supervision andRegulation—Reserve Bank of India Regulation—Moratorium, Reconstruction & Amalgamation of Banks”.
Foreign Banks
At June 30, 2006, there were 29 foreign banks with 242 branches operating in India. Foreign banksaccounted for 5.4% of aggregate deposits and 6.9% of outstanding gross bank credit of scheduled commercialbanks at June 30, 2006. As part of the liberalization process, the Reserve Bank of India has permitted foreignbanks to operate more freely, subject to requirements largely similar to those imposed on domestic banks. Theprimary activity of most foreign banks in India has been in the corporate segment. However, some of the largerforeign banks have made consumer financing a larger part of their portfolios. These banks offer products such asautomobile finance, home loans, credit cards and household consumer finance. Foreign banks operate in Indiathrough branches of the parent bank. Certain foreign banks also have wholly-owned non-bank finance companysubsidiaries or joint ventures for both corporate and retail lending. In a circular dated July 6, 2004, the ReserveBank of India stipulated that banks should not acquire any fresh stake in a bank’s equity shares, if by suchacquisition, the investing bank’s holding exceeded 5.0% of the investee bank’s equity capital. This also applies toholdings of foreign banks with a presence in India, in Indian banks.
The Reserve Bank of India issued a notification on “Roadmap for presence of foreign banks in India” onFebruary 28, 2005, announcing the following measures with respect to the presence of foreign banks:
• During the first phase (up to March 2009), foreign banks will be allowed to establish a presence bysetting up wholly-owned subsidiaries or by converting existing branches into wholly-ownedsubsidiaries.
• In addition, during the first phase, foreign banks would be allowed to acquire a controlling stake in aphased manner only in private sector banks that are identified by the Reserve Bank of India forrestructuring.
• For new and existing foreign banks, it has been proposed to go beyond the existing World TradeOrganization commitment of allowing increases of 12 branches per year. A more liberal policy will befollowed for under-banked areas.
• During the second phase (from April 2009 onwards), after a review of the first phase, foreign bankswould be allowed to acquire up to 74.0% in private sector banks in India.
Cooperative Banks
Cooperative banks cater to the financing needs of agriculture, small industry and self-employedbusinessmen in urban and semi-urban areas of India. The state land development banks and the primary landdevelopment banks provide long-term credit for agriculture. In the light of liquidity and insolvency problemsexperienced by some cooperative banks in fiscal 2001, the Reserve Bank of India undertook several interimmeasures, pending formal legislative changes, including measures related to lending against shares, borrowingsin the call market and term deposits placed with other urban cooperative banks. Presently the Reserve Bank ofIndia is responsible for supervision and regulation of urban cooperative banks, and the National Bank forAgriculture and Rural Development for state cooperative banks and district central cooperative banks. TheBanking Regulation (Amendment) and Miscellaneous Provisions Act, 2004 provides for the regulation of allcooperative banks by the Reserve Bank of India. See also “Recent Structural Reforms—Proposed Amendmentsto the Banking Regulation Act”. In its Annual Policy Statement for fiscal 2005, the Reserve Bank of Indiaannounced that it proposed to consider issuance of fresh licenses to urban cooperative banks only after acomprehensive policy on urban cooperative banks was in place, including an appropriate legal and regulatoryframework for the sector. In the mid-term review of the annual policy statement for fiscal 2005, the ReserveBank of India announced that a vision document for the future role of urban cooperative banks is being evolved
134

to ensure depositors’ interests and avoid contagion while providing useful service to local communities. Withrespect to structural issues, the Reserve Bank of India has stated that it would be encouraging growth of strongand viable entities within this sector through consolidation. A task force appointed by the Government of India toexamine the reforms required in the cooperative banking system submitted its report in December 2004. Itrecommended several structural, regulatory and operational reforms for cooperative banks, including theprovision of financial assistance by the government for revitalizing this sector. In the Union Budget for fiscal2006, the Finance Minister accepted the recommendations of the Task Force in principle and proposed to callstate governments for consultation and begin to implement the recommendations in the states willing to do so. Inthe Annual Policy Statement for fiscal 2006, the Reserve Bank of India has stated that it is in the process ofpreparing a medium-term framework for urban cooperative banks.
Long-Term Lending Institutions
The long-term lending institutions were established to provide medium-term and long-term financialassistance to various industries for setting up new projects and for the expansion and modernization of existingfacilities. These institutions provided fund-based and non-fund-based assistance to industry in the form of loans,underwriting, direct subscription to shares, debentures and guarantees. The primary long-term lendinginstitutions included Industrial Development Bank of India (now a bank), IFCI Limited, Industrial InvestmentBank of India as well as ICICI prior to the amalgamation.
The long-term lending institutions were expected to play a critical role in Indian industrial growth and,accordingly, had access to concessional government funding. However, in recent years, the operatingenvironment of the long-term lending institutions has changed substantially. Although the initial role of theseinstitutions was largely limited to providing a channel for government funding to industry, the reform processrequired them to expand the scope of their business activities, including into:
• fee-based activities like investment banking and advisory services; and
• short-term lending activity including making corporate finance and working capital loans.
Pursuant to the recommendations of the Narasimham Committee II and the Khan Working Group, aworking group created in 1999 to harmonize the role and operations of long-term lending institutions and banks,the Reserve Bank of India, in its mid-term review of monetary and credit policy for fiscal 2000, announced thatlong-term lending institutions would have the option of transforming themselves into banks subject tocompliance with the prudential norms as applicable to banks. In April 2001, the Reserve Bank of India issuedguidelines on several operational and regulatory issues which were required to be addressed in evolving the pathfor transition of a long-term lending institution into a universal bank. See “Recent Structural Reforms—Universal Banking Guidelines”. In April 2002, ICICI merged with ICICI Bank. The Industrial DevelopmentBank (Transfer of Undertaking and Repeal) Act, 2003 converted the Industrial Development Bank of India into abanking company incorporated under the Companies Act, 1956 on September 27, 2004, with exemptions fromcertain statutory and regulatory norms applicable to banks, including an exemption for a period of five yearsfrom the statutory liquidity ratio. IDBI Bank Limited, a new private sector bank that was a subsidiary of theIndustrial Development Bank of India, was merged with the Industrial Development Bank of India in April 2005.
Non-Bank Finance Companies
There are over 13,000 non-bank finance companies in India, mostly in the private sector. All non-bankfinance companies are required to register with the Reserve Bank of India. The non-bank finance companies maybe categorized into entities which take public deposits and those which do not. The companies which take publicdeposits are subject to strict supervision and capital adequacy requirements of the Reserve Bank of India. ICICISecurities Limited, our subsidiary, is a non-bank finance company, which does not accept public deposits. Theprimary activities of the non-bank finance companies are consumer credit, including automobile finance, homefinance and consumer durable products finance, wholesale finance products such as bill discounting for small and
135

medium-sized companies, and fee-based services such as investment banking and underwriting. In 2003, KotakMahindra Finance Limited, a large non-bank finance company was granted a banking license by the ReserveBank of India and converted itself into Kotak Mahindra Bank.
Over the past few years, certain non-bank finance companies have defaulted to investors and depositors, andconsequently actions (including bankruptcy proceedings) have been initiated against them, many of which arecurrently pending. See also “Reforms of the Non-Bank Finance Companies”.
Housing Finance Companies
Housing finance companies form a distinct sub-group of the non-bank finance companies. As a result of thevarious incentives given by the government for investing in the housing sector in recent years, the scope of thisbusiness has grown substantially. Until recently, Housing Development Finance Corporation Limited was thepremier institution providing housing finance in India. In recent years, several other players including banks haveentered the housing finance industry. We are a major housing finance provider and also have a housing financesubsidiary, ICICI Home Finance Company Limited. The National Housing Bank and the Housing and UrbanDevelopment Corporation Limited are the two government-controlled financial institutions created to improvethe availability of housing finance in India. The National Housing Bank Act provides for securitization ofhousing loans, foreclosure of mortgages and setting up of the Mortgage Credit Guarantee Scheme.
Other Financial Institutions
Specialized Financial Institutions
In addition to the long-term lending institutions, there are various specialized financial institutions whichcater to the specific needs of different sectors. They include the National Bank for Agricultural and RuralDevelopment, Export Import Bank of India, Small Industries Development Bank of India, Risk Capital andTechnology Finance Corporation Limited, Tourism Finance Corporation of India Limited, National HousingBank, Power Finance Corporation Limited and the Infrastructure Development Finance Corporation Limited.
State Level Financial Institutions
State financial corporations operate at the state level and form an integral part of the institutional financingsystem. State financial corporations were set up to finance and promote small and medium-sized enterprises. Thestate financial institutions are expected to achieve balanced regional socio-economic growth by generatingemployment opportunities and widening the ownership base of industry. At the state level, there are also stateindustrial development corporations, which provide finance primarily to medium-sized and large-sizedenterprises.
Insurance Companies
Currently, there are 32 insurance companies in India, of which 16 are life insurance companies, 15 aregeneral insurance companies and one is a re-insurance company. Of the 16 life insurance companies, 15 are inthe private sector and one is in the public sector. Among the general insurance companies, nine are in the privatesector and six (including the Export Credit Guarantee Corporation of India Limited and the Agriculture InsuranceCompany of India Limited) are in the public sector. The re-insurance company, General Insurance Corporation ofIndia, is in the public sector. Life Insurance Corporation of India, General Insurance Corporation of India andpublic sector general insurance companies also provide long-term financial assistance to the industrial sector. Wehave joint ventures in each of the life insurance and the general insurance sectors. Our life insurance jointventure, ICICI Prudential Life Insurance Company Limited, and our general insurance joint venture, ICICILombard General Insurance Company Limited, are both major players in their respective segments. During fiscal2005, the gross premiums underwritten by all general insurance companies and the total new premiums of all lifeinsurance companies amounted to Rs. 181.0 billion (US$ 3.9 billion) and Rs. 253.4 billion (US$ 5.5 billion)respectively. First year premium underwritten in the life insurance sector recorded a growth of 40.6% to reach
136

Rs. 358.98 billion (US$ 7.8 billion) in fiscal 2006 with the private sector’s retail market share (on weightedreceived premium basis) increasing from 25.4% in fiscal 2005 to 34.2% in fiscal 2006. Gross premium in thenon-life insurance sector (excluding Export Credit Guarantee Corporation of India Limited) grew by 16.2% toRs. 203.79 billion (US$ 4.4 billion) in fiscal 2006 with the private sector’s market share increasing from 20.3%in fiscal 2005 to 26.6% in fiscal 2006. During fiscal 2007 (through October 2006) the gross premiumunderwritten by all general insurance companies and the total new premiums of all life insurance companiesamounted to Rs. 146.1 billion (US$ 3.2 billion) and Rs. 190.6 billion (US$ 4.1 billion) respectively.
The insurance sector in India is regulated by the Insurance Regulatory and Development Authority. InDecember 1999, the parliament passed the Insurance Regulatory and Development Authority Act, 1999. This Actopened up the Indian insurance sector for foreign and private investors. The Act allows foreign equityparticipation in new insurance companies of up to 26.0%. The new company should have a minimum paid upequity capital of Rs. 1.0 billion (US$ 22 million) to carry on the business of life insurance or general insurance orRs. 2.0 billion (US$ 44 million) to carry on exclusively the business of reinsurance.
In the monetary and credit policy for fiscal 2001, the Reserve Bank of India issued guidelines governing theentry of banks and financial institutions into the insurance business. The guidelines permit banks and financialinstitutions to enter the business of insurance underwriting through joint ventures provided they meet stipulatedcriteria relating to their net worth, capital adequacy ratio, profitability track record, level of non-performing loansand the performance of their existing subsidiary companies. The promoters of insurance companies have todivest in a phased manner their shareholding in excess of 26.0% (or such other percentage as may be prescribed),after a period of 10 years from the date of commencement of business or within such period as may be prescribedby the Indian government. The Indian government, while presenting its budget for fiscal 2005, proposed anincrease in the limit on foreign equity participation in private sector insurance companies from 26.0% to 49.0%.However, this requires an amendment to the Insurance Regulatory and Development Authority Act 1999 and hasnot been implemented as yet.
Mutual Funds
At the end of October 2006, there were 29 mutual funds in India with total assets under management ofRs. 3,101.7 billion (US$ 67.5 billion). From 1963 to 1987, Unit Trust of India was the only mutual fundoperating in the country. It was set up in 1963 at the initiative of the government and the Reserve Bank of India.From 1987 onwards, several other public sector mutual funds entered this sector. These mutual funds wereestablished by public sector banks, the Life Insurance Corporation of India and General Insurance Corporation ofIndia. The mutual funds industry was opened up to the private sector in 1993. The industry is regulated by theSEBI (Mutual Fund) Regulation, 1996. At the end of October 2006, there were 24 private sector mutual fundswith a 77.8% market share in terms of total assets under management. Our asset management joint venture,Prudential ICICI Asset Management Company Limited, was the largest private sector mutual fund in India basedon assets under management at October 31, 2006.
In 2001, Unit Trust of India, with a high level of investment in equity securities, started to face difficultiesin meeting redemption and assured return obligations due to a significant decline in the market value of itssecurities portfolio. In response, the Government of India implemented a package of reform measures for UnitTrust of India, including guaranteeing redemption and assured return obligations to the unit holders, subject torestrictions on the maximum permissible redemption amount. As part of the reforms, Unit Trust of India wasdivided into two mutual funds structured in accordance with the regulations of the Securities and ExchangeBoard of India, one comprising assured return schemes and the other comprising net asset value based schemes.
Impact of Liberalization on the Indian Financial Sector
Until 1991, the financial sector in India was heavily controlled and commercial banks and long-term lendinginstitutions, the two dominant financial intermediaries, had mutually exclusive roles and objectives and operatedin a largely stable environment, with little or no competition. Long-term lending institutions were focused on the
137

achievement of the Indian government’s various socio-economic objectives, including balanced industrial growthand employment creation, especially in areas requiring development. Long-term lending institutions wereextended access to long-term funds at subsidized rates through loans and equity from the Government of Indiaand from funds guaranteed by the Government of India originating from commercial banks in India and foreigncurrency resources originating from multilateral and bilateral agencies.
The focus of the commercial banks was primarily to mobilize household savings through demand and timedeposits and to use these deposits to meet the short-term financial needs of borrowers in industry, trade andagriculture. In addition, the commercial banks provided a range of banking services to individuals and businessentities.
However, since 1991, there have been comprehensive changes in the Indian financial system. Variousfinancial sector reforms, implemented since 1991, have transformed the operating environment of the banks andlong-term lending institutions. In particular, the deregulation of interest rates, emergence of a liberalizeddomestic capital market, and entry of new private sector banks, along with the broadening of long-term lendinginstitutions’ product portfolios, have progressively intensified the competition between banks and long-termlending institutions. The Reserve Bank of India has permitted the transformation of long-term lending institutionsinto banks subject to compliance with the prudential norms applicable to banks.
Banking Sector Reform
Most large banks in India were nationalized in 1969 and thereafter were subject to a high degree of controluntil reform began in 1991. In addition to controlling interest rates and entry into the banking sector, theseregulations also channeled lending into priority sectors. Banks were required to fund the public sector throughthe mandatory acquisition of low interest-bearing government securities or statutory liquidity ratio bonds tofulfill statutory liquidity requirements. As a result, bank profitability was low, impaired assets werecomparatively high, capital adequacy was diminished, and operational flexibility was hindered.
Committee on the Financial System (Narasimham Committee I)
The Committee on the Financial System (The Narasimham Committee I) was set up in August 1991 torecommend measures for reforming the financial sector. Many of the recommendations made by the committee,which addressed organizational issues, accounting practices and operating procedures, were implemented by theGovernment of India. The major recommendations that were implemented included the following:
• with fiscal stabilization and the government increasingly resorting to market borrowing to raiseresources, the statutory liquidity ratio or the proportion of the banks’ net demand and time liabilitiesthat were required to be invested in government securities was reduced from 38.5% in the pre-reformperiod to 25.0% in October 1997;
• similarly, the cash reserve ratio or the proportion of the bank’s net demand and time liabilities thatwere required to be deposited with the Reserve Bank of India was reduced from 15.0% in thepre-reform period to 4.5%. In a circular dated September 11, 2004, the Reserve Bank of India hasraised the cash reserve ratio to 4.75% with effect from September 18, 2004 and 5.0% with effect fromOctober 2, 2004;
• special tribunals were created to resolve bad debt problems;
• most of the restrictions on interest rates for deposits were removed. Commercial banks were allowed toset their own level of interest rates for all deposits except savings bank deposits; and
• substantial capital infusion to several state-owned banks was approved in order to bring their capitaladequacy closer to internationally accepted standards. By the end of fiscal 2002, aggregaterecapitalization amounted to Rs. 217.5 billion (US$ 4.7 billion). The stronger public sector banks weregiven permission to issue equity to further increase capital.
138

Committee on Banking Sector Reform (Narasimham Committee II)
The second Committee on Banking Sector Reform (Narasimham Committee II) submitted its report in April1998. The major recommendations of the committee were in respect of capital adequacy requirements, assetclassification and provisioning, risk management and merger policies. The Reserve Bank of India accepted andbegan implementing many of these recommendations in October 1998.
Recent Structural Reforms
Amendments to the Reserve Bank of India Act
In May 2006, the Indian Parliament approved amendments to the Reserve Bank of India Act removing theminimum cash reserve ratio requirement of 3.0%, giving the Reserve Bank of India discretion to reduce the cashreserve ratio to less than 3.0%. The amendments also resulted in no interest being payable by the Reserve Bankof India on cash reserve ratio balances. Further, the amendments also created a legal and regulatory frameworkfor derivative instruments.
Recent Amendments to Laws Governing Public Sector Banks
The Indian Parliament recently amended the laws governing India’s public sector banks permitting thesebanks to issue preference shares and make preferential allotments or private placements of equity, Theamendments also empower the Reserve Bank of India to prescribe ‘fit and proper’ criteria for directors of thesebanks, and permit supercession of their boards and appointment of administrators in certain circumstances.
Proposed Amendments to the Banking Regulation Act
Legislation seeking to amend the Banking Regulation Act has been introduced in the Indian Parliament. Aspresently drafted, the main amendments propose to:
• permit all banking companies to issue preference shares that will not carry any voting rights;
• make prior approval of the Reserve Bank of India mandatory for the acquisition of more than 5.0% of abanking company’s paid up capital or voting rights by any individual or firm or group;
• remove the minimum statutory liquidity ratio requirement of 25.0%, giving the Reserve Bank of Indiadiscretion to reduce the statutory liquidity ratio to less than 25.0%. See also “Supervision andRegulation—Legal Reserve Requirements—Statutory Liquidity Ratio”; and
• remove the limit of 10.0% on the maximum voting power exercisable by a shareholder in a bankingcompany.
Legislative Framework for Recovery of Debts due to Banks
In fiscal 2003, the Indian Parliament passed the Securitization and Reconstruction of Financial Assets andEnforcement of Security Interest Act, 2002. This Act provides that a secured creditor may, in respect of loansclassified as non-performing in accordance with the Reserve Bank of India guidelines, give notice in writing tothe borrower requiring it to discharge its liabilities within 60 days, failing which the secured creditor may takepossession of the assets constituting the security for the loan, and exercise management rights in relation thereto,including the right to sell or otherwise dispose of the assets. This Act also provides for the setting up of assetreconstruction companies regulated by the Reserve Bank of India to acquire assets from banks and financialinstitutions. The Reserve Bank of India has issued guidelines for asset reconstruction companies in respect oftheir establishment, registration and licensing by the Reserve Bank of India, and operations. AssetReconstruction Company (India) Limited, set up by us, Industrial Development Bank of India, State Bank ofIndia and certain other banks and institutions, has received registration from the Reserve Bank of India andcommenced operation in August 2003. Foreign direct investment is now permitted in the equity capital of asset
139

reconstruction companies and investment by Foreign Institutional Investors registered with the Securities andExchange Board of India is permitted in security receipts issued by asset reconstruction companies, subject tocertain conditions and restrictions.
Several petitions challenging the constitutional validity of the Securitization and Reconstruction of FinancialAssets and Enforcement of Security Interest Act, 2002 were filed before the Indian Supreme Court. The SupremeCourt, in April 2004, upheld the constitutionality of the Act, other than the requirement originally included in theAct that the borrower deposit 75.0% of the dues with the debt recovery tribunal as a pre-condition for appeal bythe borrower against the enforcement measures. In November 2004, the Government of India issued an ordinanceamending the Securitization Act. The Indian Parliament has subsequently passed this ordinance as an Act. ThisAct, as amended, now provides that a borrower may make an objection or representation to a secured creditorafter a notice is issued by the secured creditor to the borrower under the Act demanding payment of dues. Thesecured creditor has to give reasons to the borrower for not accepting the objection or representation. The Actalso introduces a deposit requirement for borrowers if they wish to appeal the decision of the debt recoverytribunal. Further, the Act permits a lender to take over the business of a borrower under the Securitization Actunder certain circumstances (unlike the earlier provisions under which only assets could be taken over). See“Supervision and Regulation—Reserve Bank of India Regulations—Regulations relating to Sale of Assets toAsset Reconstruction Companies.”
Earlier, following the recommendations of the Narasimham Committee, the Recovery of Debts due to Banksand Financial Institutions Act, 1993 was enacted. This legislation provides for the establishment of a tribunal forspeedy resolution of litigation and recovery of debts owed to banks or financial institutions. The Act createstribunals before which the banks or the financial institutions can file a suit for recovery of the amounts due tothem. However, if a scheme of reconstruction is pending before the Board for Industrial and FinancialReconstruction, under the Sick Industrial Companies (Special Provision) Act, 1985, no proceeding for recoverycan be initiated or continued before the tribunals. This protection from creditor action ceases if the securedcreditor takes action under Securitization and Reconstruction of Financial Assets and Enforcement of SecurityInterest Act. While presenting its budget for fiscal 2002, the Government of India announced measures for thesetting up of more debt recovery tribunals and the eventual repeal of the Sick Industrial Companies (SpecialProvision) Act, 1985. To date, however, this Act has not been repealed.
Corporate Debt Restructuring Forum
To put in place an institutional mechanism for the restructuring of corporate debt, the Reserve Bank of Indiahas devised a corporate debt restructuring system. The objective of this framework is to ensure a timely andtransparent mechanism for the restructuring of corporate debts of viable entities facing problems, outside thepurview of the Board of Industrial and Financial Rehabilitation, debt recovery tribunals and other legalproceedings. In particular, this framework aims to preserve viable corporates that are affected by certain internaland external factors and minimize the losses to the creditors and other stakeholders through an orderly andcoordinated restructuring program. The corporate debt restructuring system is a non-statutory mechanism and avoluntary system based on debtor-creditor and inter-creditor agreements.
Universal Banking Guidelines
Universal banking in the Indian context means the transformation of long-term lending institutions into banks.Pursuant to the recommendations of the Narasimham Committee II and the Khan Working Group, the ReserveBank of India, in its mid-term review of monetary and credit policy for fiscal 2000, announced that long-termlending institutions would have the option of transforming themselves into banks subject to compliance with theprudential norms as applicable to banks. If a long-term lending institution chose to exercise the option available to itand formally decided to convert itself into a universal bank, it could formulate a plan for the transition path and astrategy for smooth conversion into a universal bank over a specified time frame. In April 2001, the Reserve Bankof India issued guidelines on several operational and regulatory issues which were required to be addressed inevolving the path for transition of a long-term lending institution into a universal bank.
140

Pension Reforms
Currently, there are three categories of pension schemes in India: pension schemes for governmentemployees, pension schemes for employees in the organized sector and voluntary pension schemes. In case ofpension schemes for government employees, the government pays its employees a defined periodic benefit upontheir retirement. Further, the contribution towards the pension scheme is funded solely by the government andnot matched by a contribution from the employees. The Employees Provident Fund, established in 1952, is amandatory program for employees of certain establishments. It is a contributory program that provides forperiodic contributions of 10% to 12% of the basic salary by both the employer and the employees. Thecontribution is invested in prescribed securities and the accumulated balance in the fund (including the accretionthereto) is paid to the employee as a lump sum on retirement. Besides these, there are voluntary pension schemesadministered by the government (the Public Provident Fund to which contribution may be made up to amaximum of Rs. 70,000 or US$ 1,523 per annum) or offered by insurance companies, where the contributionmay be made on a voluntary basis. Such voluntary contributions are often driven by tax benefits offered underthe scheme.
In 1998, the government commissioned the Old Age Social and Income Security (OASIS) project andnominated an expert committee to suggest changes to the existing policy framework. The committee submittedits report in January 2000, recommending a system for private sector management of pension funds to providemarket-linked returns. It also recommended the establishment of a separate pensions regulatory authority toregulate the pensions system. Subsequently, in the budget for fiscal 2001, the government announced that a highlevel committee would be formulated to design a contribution-based pension scheme for new governmentrecruits. The government also requested the Insurance Regulatory and Development Authority to draw up aroadmap for implementing the OASIS Report. The Insurance Regulatory and Development Authority submittedits report in October 2001. The report suggested that pension fund managers should constitute a separate legalentity to conduct their pension business. In August 2003, the government announced that it would be mandatoryfor its new employees (excluding defense personnel) to join a new defined contribution pension scheme whereboth the government and the employee would make monthly contributions of 10% of the employee’s salary. Thegovernment also announced that a Pension Fund Development and Regulatory Authority would be set up toregulate the pension industry. The government constituted the interim Pension Fund Development andRegulatory Authority on October 11, 2003. In December 2003, the government announced that the new pensionscheme would be applicable to all new recruits to Indian government service (excluding defense personnel) fromJanuary 1, 2004. Further, on December 30, 2004, the government promulgated an ordinance establishing thestatutory regulatory body, Pension Fund Regulatory and Development Authority (PFRDA) to undertakepromotional, developmental and regulatory functions with respect to the pension sector. In March 2005, theGovernment tabled the Pension Fund and Development Authority Bill in Parliament. The Union Budget for fiscal2006 has recognized the opportunities for foreign direct investment in the pension sector and it has alsoannounced that the government would issue guidelines for such investment.
Credit Policy Measures
The Reserve Bank of India issues an annual policy statement setting out its monetary policy stance andannouncing various regulatory measures. It issues a review of the annual policy statement on a quarterly basis.
Annual Policy Statement for Fiscal 2007
In its annual policy statement for fiscal 2007 announced in April 2006, the Reserve Bank of India:
• Raised the requirement of general provisioning on standard advances to specific sectors like residentialhousing loans beyond Rs. 2.0 million (US$ 43,526) and commercial real estate loans from 0.40% to1.0%.
• Increased the risk weight on commercial real estate exposure from 125.0% to 150.0%.
141

• Proposed to include banks’ total exposure to venture capital funds as a part of capital market exposurewith a risk weight of 150.0%.
• Raised the ceiling on non resident external deposit rates to LIBOR/SWAP rates of US Dollar ofcorresponding maturities plus 100 basis points from the existing level of 75 basis points above LIBOR/SWAP rates.
First Quarter Review of Annual Policy Statement for Fiscal 2007
In its first quarter review of the annual policy statement announced on July 25, 2006, the Reserve Bank ofIndia has raised the reverse repo rate by 25 basis points to 6.0% with immediate effect. The bank rate remainedunchanged at 6.0%.
Mid-Term Review of Annual Policy Statement for Fiscal 2007
In its mid-term review of the annual policy statement announced on October 31, 2006, the Reserve Bank ofIndia raised the repo rate by 25 basis points to 7.25%. The bank rate remained unchanged at 6.0%. The ReserveBank also extended the time frame for full compliance with Basel II norms to March 31, 2008 for foreign banksoperating in India and Indian banks present overseas. All other scheduled commercial banks are required to be infull compliance with Basel II norms by no later than March 31, 2009.
Reforms of the Non-Bank Finance Companies
Standards relating to income recognition, provisioning and capital adequacy were prescribed for non-bankfinance companies in June 1994. Registered non-bank finance companies were required to achieve a minimumcapital adequacy of 6.0% by year-end fiscal 1995 and 8.0% by year-end fiscal 1996 and to obtain a minimumcredit rating. To encourage the companies complying with the regulatory framework, the Reserve Bank of Indiaannounced in July 1996 certain liberalization measures under which the non-bank finance companies registeredwith it and complying with the prudential norms and credit rating requirements were granted freedom from theceiling on interest rates on deposits and amount of deposits. Other measures introduced include requiringnon-bank finance companies to maintain a certain percentage of liquid assets and to create a reserve fund. Thepercentage of liquid assets to be maintained by non-bank finance companies has been revised uniformly upwardsand, since April 1999, 15.0% of public deposits must be maintained. From January 1, 2000 the requirementshould not be less than 10.0% in approved securities and the remaining in unencumbered term deposits in anyscheduled commercial bank, the aggregate of which shall not be less than 15.0% of the “public deposit”outstanding at the close of business on the last working day of the second preceding quarter. The maximum rateof interest that non-bank finance companies could pay on their public deposits was reduced from 12.5% perannum to 11.0% per annum effective March 4, 2003.
Efforts have also been made to integrate non-bank finance companies into the mainstream financial sector.The first phase of this integration covered measures relating to registrations and standards. The focus ofsupervision has now shifted to non-bank finance companies accepting public deposits. This is because companiesaccepting public deposits are required to comply with all the directions relating to public deposits, prudentialnorms and liquid assets. A task force on non-bank finance companies set up by the Government of Indiasubmitted its report in October 1998, and recommended several steps to rationalize the regulation of non-bankfinance companies. Accepting these recommendations, the Reserve Bank of India issued new guidelines fornon-bank finance companies, which were as follows:
• a minimum net owned fund of Rs. 2.5 million (US$ 54,406) is mandatory before existing non-bankfinance companies may accept public deposits;
• a minimum investment grade rating is compulsory for loan and investment companies accepting publicdeposits, even if they have the minimum net owned funds;
142

• permission to accept public deposits was also linked to the level of capital to risk assets ratio. Differentcapital to risk assets ratio levels for non-bank finance companies with different ratings were specified;and
• non-bank finance companies were advised to restrict their investments in real estate to 10.0% of theirnet owned funds
In the monetary and credit policy for fiscal 2000, the Reserve Bank of India stipulated a minimum capitalbase of Rs. 20 million (US$ 435,256) for all new non-bank finance companies. In the Government of India’sbudget for fiscal 2002, the procedures for foreign direct investment in non-bank finance companies weresubstantially liberalized.
During fiscal 2003, the Reserve Bank of India introduced a number of measures to enhance the regulatoryand supervisory standards of non-bank finance companies, especially in order to bring them at par withcommercial banks, in select operations, over a period of time. Other regulatory measures adopted andsubsequently revised in November 2004 included aligning interest rates in this sector with the rates prevalent inthe rest of the economy, tightening prudential norms and harmonizing supervisory directions with therequirements of the Companies Act, procedural changes in nomination facilities, issuance of a Know YourCustomer policy and allowing non-bank finance companies to take up insurance agency business.
In 2005, the Reserve Bank of India introduced stricter regulatory measures for non-bank finance companies,including stringent reporting requirements and revised Know Your Customer guidelines.
On December 12, 2006, the Reserve Bank of India issued guidelines on the financial regulation ofsystematically important non-banking financial companies and banks’ relationships with them with a view toremove the possibility of regulatory arbitrage leading to an uneven playing field and potential systemic risk.Within non deposit taking non-banking financial companies, the guidelines classify those with an asset sizeabove Rs. 1.00 billion as per the last audited balance sheet as systemically important. These non-bankingfinancial companies are required to maintain a minimum capital to risk weighted assets ratio (CRAR) of 10.0%,in addition to conforming with single and group exposure norms. The guidelines restrict banks’ holdings in adeposit taking non-banking financial company, excluding housing finance companies, to 10.0% of the paid upequity capital of the non-banking financial company. The total exposure to a single non-banking financialcompany has been limited to 10.0% of the bank’s capital funds (15.0% in the case of an asset finance company).
The limit may be increased to 15.0% and 20.0%, respectively, provided that the excess exposure is onaccount of funds lent by the non-banking financial company to the infrastructure sector.
143

SUPERVISION AND REGULATION
The main legislation governing commercial banks in India is the Banking Regulation Act. Other importantlaws include the Reserve Bank of India Act, the Negotiable Instruments Act and the Banker’s Books EvidenceAct. Additionally, the Reserve Bank of India, from time to time, issues guidelines to be followed by banks.Compliance with all regulatory requirements is evaluated with respect to financial statements under IndianGAAP.
Reserve Bank of India Regulations
Commercial banks in India are required under the Banking Regulation Act to obtain a license from theReserve Bank of India to carry on banking business in India. Before granting the license, the Reserve Bank ofIndia must be satisfied that certain conditions are complied with, including (i) that the bank has the ability to payits present and future depositors in full as their claims accrue; (ii) that the affairs of the bank will not be or are notlikely to be conducted in a manner detrimental to the interests of present or future depositors; (iii) that the bankhas adequate capital and earnings prospects; and (iv) that the public interest will be served if such license isgranted to the bank. The Reserve Bank of India can cancel the license if the bank fails to meet the aboveconditions or if the bank ceases to carry on banking operations in India.
Being licensed as a banking company, we are regulated and supervised by the Reserve Bank of India. TheReserve Bank of India requires us to furnish statements, information and certain details relating to our business.It has issued guidelines for commercial banks on recognition of income, classification of assets, valuation ofinvestments, maintenance of capital adequacy and provisioning for non-performing assets. The Reserve Bank ofIndia has set up a Board for Financial Supervision, under the chairmanship of the Governor of the Reserve Bankof India. The appointment of the auditors of banks is subject to the approval of the Reserve Bank of India. TheReserve Bank of India can direct a special audit in the interest of the depositors or in the public interest.
Regulations relating to the Opening of Branches
Section 23 of the Banking Regulation Act provides that banks must obtain the prior approval of the ReserveBank of India to open new branches. Permission is granted based on factors such as the financial condition andhistory of the banking company, its management, adequacy of capital structure and earning prospects and thepublic interest. The Reserve Bank of India may cancel the license for violations of the conditions under which itwas granted. Under the banking license granted to us by the Reserve Bank of India, we are required to have atleast 25.0% of our branches located in rural and semi-urban areas. A rural area is defined as a center with apopulation of less than 10,000. A semi-urban area is defined as a center with a population of greater than 10,000but less than 100,000. These population figures relate to the 2001 census conducted by the Government of India.In September 2005, the Reserve Bank of India issued a new branch authorization policy in terms of which theexisting system of granting authorizations for opening individual branches from time to time will be replaced bya system of aggregated approvals on an annual basis. The Reserve Bank of India will discuss with individualbanks their branch expansion strategies and plans over the medium term. The term “branch” for this purpose hasbeen defined to also include extension counters, offsite ATMs, administrative offices and back offices. Whileprocessing authorization requests, the Reserve Bank of India will give importance to the nature and scope ofbanking services particularly in under-banked areas, actual credit flow to the priority sector and efforts topromote financial inclusion, the need to induce enhanced competition in the banking sector, the bank’s regulatorycompliance, quality of governance, risk management and relationships with subsidiaries and affiliates.
Capital Adequacy Requirements
We are subject to the capital adequacy requirements of the Reserve Bank of India, which, based on theguidelines of the Basel Committee on Banking Regulations and Supervisory Practices, 1998, require us tomaintain a minimum ratio of capital to risk adjusted assets and off-balance sheet items of 9.0%, at least half ofwhich must be Tier I capital.
144

The total capital of a banking company is classified into Tier I and Tier II capital. Tier I capital, the corecapital, provides the most permanent and readily available support against unexpected losses. It comprisespaid-up capital and reserves consisting of any statutory reserves, free reserves as reduced by equity investmentsin subsidiaries, intangible assets and losses in the current period and those brought forward from the previousperiod. In fiscal 2003, the Reserve Bank of India issued a guideline requiring a bank’s deferred tax asset to betreated as an intangible asset and deducted from its Tier I capital.
Tier II capital includes undisclosed reserves, revaluation reserves (at a discount of 55.0%), generalprovisions and loss reserves (allowed up to a maximum of 1.25% of risk weighted assets), hybrid debt capitalinstruments (which combine certain features of both equity and debt securities) and subordinated debt. Anysubordinated debt is subject to progressive discounts each year for inclusion in Tier II capital and totalsubordinated debt considered as Tier II capital cannot exceed 50.0% of Tier I capital. Tier II capital cannotexceed Tier I capital.
In January 2006, the Reserve Bank of India issued guidelines permitting banks to issue perpetual debt with acall option after not less than 10 years, to be exercised with its prior approval, for inclusion in Tier I capital up toa maximum of 15% of total Tier I capital, The Reserve Bank of India also permitted banks to issue debtinstruments with a minimum maturity of 15 years and a call option after not less than 10 years, to be exercisedwith its prior approval, for inclusion in Tier II capital. In July 2006, the Reserve Bank of India issued guidelinespermitting the issuance of Tier I and Tier II debt instruments denominated in foreign currencies. See also“Operating and Financial Review and Prospects—Capital Resources.”
Risk adjusted assets and off-balance sheet items considered for determining the capital adequacy ratio arethe risk weighted total of specified funded and non-funded exposures. Degrees of credit risk expressed aspercentage weighting have been assigned to various balance sheet asset items and conversion factors tooff-balance sheet items. The value of each item is multiplied by the relevant weight or conversion factor toproduce risk-adjusted values of assets and off-balance-sheet items. Standby letters of credit and guarantees aretreated as similar to funded exposure and are subject to similar risk weight. All foreign exchange open positionscarry a 100.0% risk weight. Capital requirements have also been prescribed for open positions in gold. InDecember 2004, the Reserve Bank of India increased the risk weights on housing loans from 50.0% to 75.0% andon consumer credit including personal loans and credit card receivables from 100.0% to 125.0% as a temporarycounter-cyclical measure given the rapid growth of these segments. In July 2005, the Reserve Bank of Indiaincreased the risk weights on capital market exposure and exposure to commercial real estate from 100.0% to125.0%. In its annual policy statement for fiscal 2007, the Reserve Bank of India further increased the riskweight on loans and exposure to commercial real estate from 125.0% to 150.0%. The risk weight for venturecapital funds included for capital market exposure was increased to 150.0%. The Reserve Bank of India issuedguidelines on securitization of standard assets on February 1, 2006. The guidelines define true sale, criteria to bemet by special purpose vehicles set up for securitization, policy on provision of credit enhancement facilities,liquidity facilities, underwriting facilities and provision of services. The guidelines also cover capitalrequirements on securitization, prudential norms for investment in securities issued by special purpose vehicles,accounting treatment of the securitization transactions and disclosure requirements.
Effective March 31, 2001, banks and financial institutions were required to assign a risk weight of 2.5% inrespect of the entire investment portfolio to cover market risk, over and above the existing risk weights for creditrisk in non-government and non-approved securities. In fiscal 2002, with a view to the building up of adequatereserves to guard against any possible reversal of the interest rate environment in the future due to unexpecteddevelopments, the Reserve Bank of India advised banks to build up an investment fluctuation reserve of aminimum of 5.0% of the bank’s investment portfolio within a period of five years, by fiscal 2006. This reservehad to be computed with respect to investments in held for trading and available for sale categories. Investmentfluctuation reserve is included in Tier II capital. In June 2004, the Reserve Bank of India issued guidelines oncapital for market risk. The guidelines prescribe the method of computation of risk-weighted assets in respect ofmarket risk. The aggregate risk weighted assets are required to be taken into account for determining the capital
145

adequacy ratio. Banks were required to maintain a capital charge for market risk in respect of their trading bookexposure (including derivatives) by year-end fiscal 2005 and securities included under available for sale categoryby year-end fiscal 2006. In October 2005, the Reserve Bank of India specified that banks that maintain capital forboth credit risk and market risk for both held for trading and available for sale categories at year-end fiscal 2006would be permitted to treat the entire balance in the investment fluctuation reserve as Tier I capital.
In February 2005, the Reserve Bank of India issued draft guidelines for the implementation of the revisedcapital adequacy framework of the Basel Committee. These draft guidelines specify that banks in India willadopt the standardized approach for credit risk and the basic indicator approach for operational risk with effectfrom March 31, 2008 (for foreign banks operating in India and Indian banks having presence abroad) andMarch 31, 2009 (for all other scheduled commercial banks). After adequate expertise has been developed, both atthe banks and at the supervisory levels, some banks may be allowed to migrate to the internal ratings basedapproach after obtaining the approval of the Reserve Bank of India. The guidelines also prescribe a 75.0% riskweight for retail credit exposures, differential risk weights for other credit exposures linked to their credit rating,and a capital charge for operational risk based on a factor of 15.0% of the sum of a bank’s net interest incomeand non-interest income (excluding extraordinary income).
Loan Loss Provisions and Non-Performing Assets
In April 1992, the Reserve Bank of India issued formal guidelines on income recognition, assetclassification, provisioning standards and valuation of investments applicable to banks, which are revised fromtime to time.
The principal features of these Reserve Bank of India guidelines, which have been implemented withrespect to ICICI Bank’s loans, debentures, lease assets, hire purchases and bills are set forth below.
The Reserve Bank of India guidelines stipulate the criteria for determining and classifying a non-performingasset set forth below:
Asset Classification
A non-performing asset is an asset in respect of which any amount of interest or principal is overdue formore than 90 days (180 days until year-end fiscal 2003). In particular, an advance is a non-performing assetwhere:
• interest and/or installment of principal remains overdue for a period of more than 90 days in respect ofa term loan;
• the account remains “out-of-order” for a period of more than 90 days in respect of an overdraft or cashcredit;
• the bill remains overdue for a period of more than 90 days in case of bills purchased and discounted;
• installment of interest or principal remains overdue for two harvest seasons for short duration crops orfor one harvest season for long duration crops; or
• any amount to be received remains overdue for a period of more than 90 days in respect of otheraccounts.
Interest in respect of non-performing assets is not recognized or credited to the income account unlesscollected.
Non-performing assets are classified as described below.
Sub-Standard Assets. Assets that are non-performing assets for a period not exceeding 12 months (18months until year-end fiscal 2004). In such cases, the current net worth of the borrower/guarantor or the current
146

market value of the security charged is not enough to ensure recovery of dues to the banks in full. Such an assethas well-defined credit weaknesses that jeopardize the liquidation of the debt and are characterized by the distinctpossibility that the bank will sustain some loss, if deficiencies are not corrected.
Doubtful Assets. Assets that are non-performing assets for more than 12 months (18 months until year-endfiscal 2004). A loan classified as doubtful has all the weaknesses inherent in assets that are classified assub-standard, with the added characteristic that the weaknesses make collection or liquidation in full, on the basisof currently known facts, conditions and values, highly questionable and improbable.
Loss Assets. Assets on which losses have been identified by the bank or internal or external auditors or theReserve Bank of India inspection but the amount has not been written off fully.
There are separate guidelines for projects under implementation which are based on the achievement offinancial closure and the date of approval of the project financing.
The Reserve Bank of India also has separate guidelines for restructured loans. A fully secured restructuredstandard loan can be restructured by reschedulement of principal repayment and/or the interest element, but mustbe separately disclosed as a restructured loan. The amount of sacrifice, if any, in the element of interest,measured in present value terms, is either written off or provision is made to the extent of the sacrifice involved.Similar guidelines are applicable to sub-standard assets. The sub-standard accounts which have been subjected torestructuring, whether in respect of principal installment or interest amount, by whatever modality, are eligible tobe upgraded to the standard category only after the specified period, i.e., a period of one year after the date whenfirst payment of interest or of principal, whichever is earlier, falls due, subject to satisfactory performance duringthe period.
To put in place an institutional mechanism for the restructuring of corporate debt, the Reserve Bank of Indiahas devised a corporate debt restructuring system. See “Overview of the Indian Financial Sector—RecentStructural Reforms—Corporate Debt Restructuring Forum”.
Provisioning and Write-Offs
Provisions are based on guidelines specific to the classification of the assets. The following guidelines applyto the various asset classifications:
• Standard Assets. A general provision of 0.25% is required. In fiscal 2006, the Reserve Bank of Indiaincreased the general provisioning requirement from 0.25% to 0.40% (excluding direct advances to theagriculture and small and medium enterprise sectors). In its annual policy statement for fiscal 2007, theReserve Bank of India increased the general provisioning on standard advances in specific sectors from0.40% to 1.00%. These provisions are eligible for inclusion in Tier II capital for capital adequacypurposes up to the permitted extent. The Reserve Bank of India has permitted banks to phase in theadditional provisioning over the fiscal 2007 to achieve the following levels of provisioning:
i) 0.55% by June 30, 2006;
ii) 0.70% by September 30, 2006;
iii) 0.85% by December 31, 2006; and
iv) 1.00% by March 31, 2007.
• Sub-Standard Assets. A general provision of 10.0% of the total outstanding is required. However,unsecured exposures which are identified as substandard would attract an additional provision of10.0%, i.e., a total of 20.0% on the outstanding balance.
• Doubtful Assets. A 100.0% write-off is required to be taken against the unsecured portion of thedoubtful asset and charged against income. The value assigned to the collateral securing a loan is theamount reflected on the borrower’s books or the realizable value determined by third party appraisers.
147

Until year-end fiscal 2004, in cases where there was a secured portion of the asset, depending upon theperiod for which the asset remained doubtful, a 20.0% to 50.0% provision was required to be takenagainst the secured asset as follows:
• Up to one year: 20.0% provision
• One to three years: 30.0% provision
• More than three years: 50.0% provision
In July 2004, the Reserve Bank of India introduced additional provisioning requirements for non-performingassets classified as ‘doubtful for more than three years’. Effective year-end fiscal 2005, 100.0% provision isrequired for the secured portion of assets classified as doubtful for more than three years on or after April 1,2004. For the secured portion of assets classified as doubtful for more than three years at year-end fiscal, 2004, aprovision of 60.0% is required to be made by year-end fiscal 2005, 75.0% by year-end fiscal 2006 and 100.0% byyear-end fiscal 2007.
• Loss Assets. The entire asset is required to be written off or provided for, i.e., a 100.0% provision.
• Restructured Loans. The amount of sacrifice, if any, in the element of interest, measured in presentvalue terms, is either written off or provision is made to the extent of the sacrifice involved.
In June 2006, the Reserve Bank of India issued prudential norms on creation and utilization of floatingprovisions (i.e., provisions which are not made in respect of specific non-performing assets or are made in excessof regulatory requirements for provisions for standard assets). The norms state that floating provisions can beused only for contingencies under extraordinary circumstances for making specific provisions in impairedaccounts after obtaining approval from the Board of Directors and with the prior permission of the Reserve Bankof India. Floating provisions for advances and investments would be held separately and cannot be reversed bycredit to the profit and loss account. Until utilization of such provisions, they can be netted off from gross nonperforming assets to arrive at disclosure of net non performing assets. Alternatively, floating provisions can betreated as part of Tier II capital within the overall ceiling of 1.25% of total risk-weighted assets. Further, floatingprovisions would not include specific voluntary provisions made by banks for advances at rates which are higherthan the stipulated rates.
Regulations relating to Making Loans
The provisions of the Banking Regulation Act govern the making of loans by banks in India. The ReserveBank of India issues directions covering the loan activities of banks. Some of the major guidelines of the ReserveBank of India, which are now in effect, are as follows:
• The Reserve Bank of India has prescribed norms for bank lending to non-bank financial companies andfinancing of public sector disinvestment.
• Banks are free to determine their own lending rates but each bank must declare its prime lending rate asapproved by its Board of Directors. Banks are required to declare a benchmark prime lending ratebased on various parameters including cost of funds, non-interest expense, capital charge and profitmargin. Each bank should also indicate the maximum spread over the prime lending rate for all creditexposures other than retail loans. The interest charged by banks on advances up to Rs. 200,000 (US$4,353) to any one entity (other than certain permitted types of loans including loans to individuals foracquiring residential property, loans for purchase of consumer durables and other non-priority sectorpersonal loans) must not exceed the prime lending rate. Banks are also given freedom to lend at a ratebelow the prime lending rate in respect of creditworthy borrowers and exposures. Interest rates forcertain categories of advances are regulated by the Reserve Bank of India.
In terms of Section 20(1) of the Banking Regulation Act, a bank cannot grant any loans and advancesagainst the security of its own shares, a banking company is prohibited from entering into any commitment for
148

granting any loans or advances to or on behalf of any of its directors, or any firm in which any of its directors isinterested as partner, manager, employee or guarantor, or any company (not being a subsidiary of the bankingcompany or a company registered under Section 25 of the Companies Act, 1956, or a government company) ofwhich, or the subsidiary or the holding company of which any of the directors of the bank is a director, managingagent, manager, employee or guarantor or in which he holds substantial interest, or any individual in respect ofwhom any of its directors is a partner or guarantor. There are certain exemptions in this regard as the explanationto the section provides that ‘loans or advances’ shall not include any transaction which the Reserve Bank of Indiamay specify by general or special order as not being a loan or advance for the purpose of such section.
There are guidelines on loans against equity shares in respect of amount, margin requirement and purpose.
In June 2005, the Reserve Bank of India issued guidelines requiring banks to put in place a policy forexposure to real estate with the approval of their boards. The policy is required to include exposure limits,collaterals to be considered, collateral cover and margins and credit authorization. The Reserve Bank of India hasalso permitted banks to extend financial assistance to Indian companies for acquisition of equity in overseas jointventures or wholly owned subsidiaries or in other overseas companies, new or existing, as strategic investment.Banks are not permitted to finance acquisitions by companies in India.
Regulations relating to Sale of Assets to Asset Reconstruction Companies
The Securitization and Reconstruction of Financial Assets and Enforcement of Security Interest Act, 2002,as amended, provides for sale of financial assets by banks and financial institutions to asset reconstructioncompanies. The Reserve Bank of India has issued guidelines to banks on the process to be followed for sales offinancial assets to asset reconstruction companies. These guidelines provide that a bank may sell financial assetsto an asset reconstruction company provided the asset is a non-performing asset. These assets are to be sold on‘without recourse’ basis only. A bank may sell a standard asset only if the borrower has a consortium or multiplebanking arrangement, at least 75.0% by value of the total loans to the borrower are classified as non-performingand at least 75.0% by value of the banks and financial institutions in the consortium or multiple bankingarrangement agree to the sale. The banks selling financial assets should ensure that there is no known liabilitydevolving on them and that they do not assume any operational, legal or any other type of risks relating to thefinancial assets sold. Further, banks may not sell financial assets at a contingent price with an agreement to bear apart of the shortfall on ultimate realization. However, banks may sell specific financial assets with an agreementto share in any surplus realized by the asset reconstruction company in the future. While each bank is required tomake its own assessment of the value offered in the sale before accepting or rejecting an offer for purchase offinancial assets by an asset reconstruction company, in consortium or multiple banking arrangements where morethan 75.0% by value of the banks or financial institutions accept the offer, the remaining banks or financialinstitutions are obliged to accept the offer. Consideration for the sale may be in the form of cash, bonds ordebentures or security receipts or pass through certificates issued by the asset reconstruction company or trustsset up by it to acquire the financial assets. See also “Overview of the Indian Financial Sector—Recent StructuralReforms—Legislative Framework for Recovery of Debts Due to Banks”.
Guidelines on Sale and Purchase of Non-performing Assets
In July 2005, the Reserve Bank of India issued guidelines on sales and purchases of non-performing assetsbetween banks, financial institutions and non-bank finance companies. These guidelines require that the Board ofDirectors of the bank must establish a policy for purchases and sales of non-performing assets. Purchases andsales of non-performing assets must be without recourse to the seller and on a cash basis, with the entireconsideration being paid upfront. An asset must have been classified as non-performing for at least two years bythe seller to be eligible for sale. The purchasing bank must hold the non-performing asset on its books for at least15 months before it can sell the asset to another bank. The asset cannot be sold back to the original seller.
149

Directed Lending
Priority Sector Lending
The Reserve Bank of India requires commercial banks to lend a certain percentage of their net bank credit tospecific sectors (the priority sectors), such as agriculture, small-scale industry, small businesses and housingfinance. Total priority sector advances should be 40.0% of net bank credit with agricultural advances required tobe 18.0% of net bank credit and advances to weaker sections required to be 10.0% of net bank credit, and 1.0%of the previous year’s net bank credit required to be lent under the Differential Rate of Interest scheme. Anyshortfall in the amount required to be lent to the priority sectors may be required to be deposited with theNational Bank for Agriculture and the Rural Development. These deposits can be for a period of one year or fiveyears.
Prior to the amalgamation, the advances of ICICI were not subject to the requirement applicable to banks inrespect of priority sector lending. Pursuant to the terms of the Reserve Bank of India’s approval of theamalgamation, ICICI Bank is required to maintain a total of 50.0% of its domestic net bank credit on the residualportion of its advances (i.e., the portion of its total advances excluding advances of ICICI) in the form of prioritysector advances. This additional requirement of 10.0% by way of priority sector advances will apply until suchtime as the aggregate priority sector advances reach a level of 40.0% of the total net bank credit of ICICI Bank.
The Reserve Bank of India issued draft guidelines on priority sector lending on November 8, 2006. Thedraft guidelines provide that the priority sector will broadly comprise agriculture, small-scale industries, smallbusiness/service enterprises, micro credit, education loans and housing loans. The priority sector lending targetsand sub-targets for all banks would now be linked to adjusted net bank credit (net bank credit plus investmentsmade by banks in non-SLR bonds held in the held to maturity category) or credit equivalent of off-balance sheetexposures, whichever is higher, as on March 31 of the previous year.
Export Credit
The Reserve Bank of India also requires commercial banks to make loans to exporters at concessional ratesof interest. This enables exporters to have access to an internationally competitive financing option. Pursuant toexisting guidelines, 12.0% of a bank’s net bank credit is required to be in the form of export credit. ICICI Bankprovides export credit for pre-shipment and post-shipment requirements of exporter borrowers in rupees andforeign currencies.
Credit Exposure Limits
As a prudent measure aimed at better risk management and avoidance of concentration of credit risk, theReserve Bank of India has prescribed credit exposure limits for banks and long-term lending institutions inrespect of their lending to individual borrowers and to all companies in a single group (or sponsor group).
The limits currently set by the Reserve Bank of India are as follows:
• The exposure ceiling for a single borrower is 15.0% of capital funds and group exposure limit is 40.0%of capital funds. In case of financing for infrastructure projects, the exposure limit to a single borroweris extendable by another 5.0%, i.e., up to 20.0% of capital funds and the group exposure limit isextendable by another 10.0%, i.e., up to 50.0% of capital funds. Banks may, in exceptionalcircumstances, with the approval of their Board of Directors, consider enhancement of the exposure toa borrower up to a maximum of further 5.0% of capital funds, subject to the borrower consenting to thebanks making appropriate disclosures in their annual reports.
• Capital funds is the total capital as defined under capital adequacy norms (Tier I and Tier II capital).
• Non-fund based exposures are calculated at 100.0% and in addition, banks include forward contracts inforeign exchange and other derivative products, like currency swaps and options, at their replacementcost value in determining individual or group borrower exposure ceilings, effective April 1, 2003.
150

To ensure that exposures are evenly spread, the Reserve Bank of India requires banks to fix internal limits ofexposure to specific sectors. These limits are subject to periodical review by the banks. ICICI Bank has fixed aceiling of 15.0% on its exposure to any one industry (other than retail loans) and monitors its exposures accordingly.
Limits on exposure to Non-Banking Finance Companies
On December 12, 2006, the Reserve Bank of India issued guidelines on the financial regulation ofsystematically important non-banking financial companies and banks’ relationship with them with a view toremove the possibility of regulatory arbitrage leading to an uneven playing field and potential systemic risk.Within non deposit taking non-banking financial companies, the guidelines classify those with an asset sizeabove Rs. 1.00 billion (US$ 22 million) as per the last audited balance sheet as systemically important. Thesenon-banking financial companies are required to maintain a minimum capital to risk weighted assets ratio of10.0%, in addition to conforming with single and group exposure norms. The guidelines restrict banks’ holdingin a deposit taking non-banking financial company, excluding housing finance companies, to 10.0% of the paidup equity capital of the entity. The total exposure to a single non-banking financial company has been limited to10.0% of the bank’s capital fund while exposure to a non-banking asset finance company has been restricted to15.0% of the bank’s capital fund. The limit may be increased to 15.0% and 20.0% respectively provided that theexcess exposure is on account of funds lent by the non-banking finance company to infrastructure sectors.
Regulations relating to Investments and Capital Market Exposure Limits
Pursuant to the Reserve Bank of India guidelines, the exposure of banks to capital markets by way ofinvestments in shares, convertible debentures, units of equity oriented mutual funds and loans to brokers, shouldnot exceed 5.0% of total advances (including commercial paper) at March 31 of the previous fiscal year andinvestments in shares, convertible debentures and units of equity oriented mutual funds should not exceed 20.0%of the bank’s net worth. However the exposure to capital markets in excess of 5.0% is permitted by the ReserveBank of India on a case by case basis. In its mid-term review of its annual policy statement for fiscal 2006,announced on October 25, 2005, the Reserve Bank of India has proposed to restrict a bank’s capital exposure to40.0% of its net worth (both standalone and consolidated) and the consolidated direct capital market exposure to20.0% of the consolidated net worth. Pursuant to the terms of the Reserve Bank of India’s approval for theamalgamation, ICICI’s project finance related investments are excluded from the computation of these limits fora period of five years from the amalgamation. In addition, the Reserve Bank of India has approved the exclusionof specific equity investments acquired by conversion of debt under restructuring schemes approved by theCorporate Debt Restructuring Forum. In a recent circular the Reserve Bank of India has limited banks’ capitalmarket exposure to 40.0% of their net worth as on March 31 of the previous year on a solo basis. Within thislimit direct investments in shares, convertible bonds/debentures, units of equity oriented mutual funds and allexposures to venture capital funds have been restricted to 20.0% of their net worth. On a consolidated basis, theexposure to capital markets has been restricted to 40.0% of the consolidated net worth as on March 31 of theprevious year with direct investments in shares, convertible bonds/debentures, units of equity oriented mutualfunds and all exposures to venture capital funds restricted to 20.0% of their consolidated net worth.
In November 2003, the Reserve Bank of India issued guidelines on investments by banks in non-StatutoryLiquidity Ratio securities issued by companies, banks, financial institutions, central and state governmentsponsored institutions and special purpose vehicles. These guidelines apply to primary market subscriptions andsecondary market purchases. Pursuant to these guidelines, banks are prohibited from investing in non-StatutoryLiquidity Ratio securities with an original maturity of less than one year, other than commercial paper andcertificates of deposits. Banks are also prohibited from investing in unrated securities. A bank’s investment inunlisted non-Statutory Liquidity Ratio securities may not exceed 10.0% of its total investment in non-StatutoryLiquidity Ratio securities as at the end of the preceding fiscal year with a sub-ceiling of 5.0% for investments inbonds of public sector undertakings. These guidelines do not apply to investments in security receipts issued bysecuritization or reconstruction companies registered with Reserve Bank of India and asset backed securities andmortgage backed securities with a minimum investment grade credit rating. These guidelines were effectiveApril 1, 2004, with provision for compliance in a phased manner by January 1, 2005.
151

In April 1999, the Reserve Bank of India, in its monetary and credit policy, stated that the investment by abank in subordinated debt instruments, representing Tier II capital, issued by other banks and financialinstitutions should not exceed 10.0% of the investing bank’s capital including Tier II capital and free reserves. InJuly 2004, the Reserve Bank of India imposed a ceiling of 10.0% of capital funds (Tier I plus Tier II capital) oninvestments by banks and financial institutions in equity shares, preference shares eligible for capital status,subordinated debt instruments, hybrid debt capital instruments and any other instrument approved as in the natureof capital, issued by other banks and financial institutions. Investments in the instruments which are not deductedfrom Tier I capital of the investing bank or financial institution, are subject to a 100.0% risk weight for credit riskfor capital adequacy purposes. The risk weight for credit risk exposure in capital markets has been increased to125.0% from 100.0% in July 2005. Further, banks and financial institutions cannot acquire any fresh stake in abank’s equity shares, if by such acquisition, the investing bank’s or financial institution’s holding exceeds 5.0%of the investee bank’s equity capital. Banks with investments in excess of the prescribed limits were required toapply to the Reserve Bank of India with a roadmap for reduction of the exposure.
Consolidated Supervision Guidelines
In fiscal 2003, the Reserve Bank of India issued guidelines for consolidated accounting and consolidatedsupervision for banks. These guidelines became effective April 1, 2003. The principal features of theseguidelines are:
Consolidated Financial Statements. Banks are required to prepare consolidated financial statementsintended for public disclosure.
Consolidated Prudential Returns. Banks are required to submit to the Reserve Bank of India, consolidatedprudential returns reporting their compliance with various prudential norms on a consolidated basis, excludinginsurance subsidiaries. Compliance on a consolidated basis is required in respect of the following main prudentialnorms:
• Single borrower exposure limit of 15.0% of capital funds (20.0% of capital funds provided theadditional exposure of up to 5.0% is for the purpose of financing infrastructure projects);
• Borrower group exposure limit of 40.0% of capital funds (50.0% of capital funds provided theadditional exposure of up to 10.0% is for the purpose of financing infrastructure projects);
• Deduction from Tier I capital of the bank, of any shortfall in capital adequacy of a subsidiary for whichcapital adequacy norms are specified; and
• Consolidated capital market exposure limit of 2.0% of consolidated total assets and 10.0% ofconsolidated net worth.
ICICI Bank is in compliance with these guidelines, except for the consolidated capital market exposurelimits. ICICI Bank has submitted to the Reserve Bank of India that the limit of 2.0% of consolidated total assetsand 10.0% of consolidated net worth effectively reduces the standalone capital market exposure limit of 5.0% ofadvances and 20.0% of net worth. See also “Reserve Bank of India Regulations—Credit Exposure Limits”. In itsmid-term review of its annual policy statement for fiscal 2006 announced on October 25, 2005, the Reserve Bankof India has proposed to restrict a bank’s capital exposure to 40.0% of its net worth (both standalone andconsolidated) and the consolidated direct capital market exposure to 20.0% of the consolidated net worth.
In June 2004, the Reserve Bank of India published the report of a working group on monitoring of financialconglomerates, which proposed the following framework:
• identification of financial conglomerates that would be subjected to focused regulatory oversight;
• monitoring intra-group transactions and exposures and large exposures of the group to outside counterparties;
152

• identifying a designated entity within each group that would collate data in respect of all other groupentities and furnish the same to its regulator; and
• formalizing a mechanism for inter-regulatory exchange of information.
The framework covers entities under the jurisdiction of the Reserve Bank of India, the Securities andExchange Board of India, the Insurance Regulatory and Development Authority and the National Housing Bankand would in due course be extended to entities regulated by the proposed Pension Fund Regulatory andDevelopment Authority. The Reserve Bank of India has identified ICICI Bank and its related entities as afinancial conglomerate with ICICI Bank as the designated entity responsible for reporting to the Reserve Bank ofIndia.
Banks’ Investment Classification and Valuation Norms
The key features of the Reserve Bank of India guidelines on categorization and valuation of banks’investment portfolio are given below.
• The entire investment portfolio is required to be classified under three categories: (a) held to maturity,(b) held for trading and (c) available for sale. Held to maturity includes securities acquired with theintention of being held up to maturity; held for trading includes securities acquired with the intention ofbeing traded to take advantage of the short-term price/interest rate movements; and available for saleincludes securities not included in held to maturity and held for trading. Banks should decide thecategory of investment at the time of acquisition.
• Held to maturity investments compulsorily include (a) recapitalization bonds received from theGovernment of India towards their re-capitalization requirement and held in their investment portfolio,(b) investments in subsidiaries and joint ventures and (c) investments in debentures deemed asadvance. Held to maturity investments also include any other investment identified for inclusion in thiscategory subject to the condition that such investments cannot exceed 25.0% of the total investmentexcluding recapitalization bonds and debentures.
• Profit on the sale of investments in the held to maturity category, net of tax and statutory reserve, isappropriated to the capital reserve account after being taken in the income statement. Loss on any saleis recognized in the income statement.
• The market price of the security available from the stock exchange, the price of securities in subsidiarygeneral ledger transactions, the Reserve Bank of India price list or prices declared by Primary DealersAssociation of India jointly with the Fixed Income Money Market and Derivatives Association of Indiaserves as the “market value” for investments in available for sale and held for trading securities.
• Investments under the held for trading category should be sold within 90 days; in the event of inabilityto sell due to adverse factors including tight liquidity, extreme volatility or a unidirectional movementin the market, the unsold securities should be shifted to the available for sale category.
• Profit or loss on the sale of investments in both held for trading and available for sale categories istaken in the income statement.
• Shifting of investments from or to held to maturity may be done with the approval of the Board ofDirectors once a year, normally at the beginning of the accounting year; shifting of investments fromavailable for sale to held for trading may be done with the approval of the Board of Directors, the AssetLiability Management Committee or the Investment Committee; shifting from held for trading toavailable for sale is generally not permitted.
In September 2004, the Reserve Bank of India announced that it would set up an internal group to reviewthe investment classification guidelines to align them with international practices and the current state of riskmanagement practices in India, taking into account the unique requirement applicable to banks in India of
153

maintenance of a statutory liquidity ratio equal to 25.0% of their demand and time liabilities. In the meanwhile,the Reserve Bank of India has permitted banks to exceed the limit of 25.0% of investments for the held tomaturity category provided the excess comprises only statutory liquidity ratio investments and the aggregate ofsuch investments in the held to maturity category do not exceed 25.0% of the demand and time liabilities. TheReserve Bank of India permitted banks to transfer additional securities to the held to maturity category as a onetime measure, in addition to the transfer permitted under the earlier guidelines. The transfer has to be done at thelower of acquisition cost, book value or market value on the date of transfer.
Held to maturity securities are not marked to market and are carried at acquisition cost or at an amortizedcost if acquired at a premium over the face value.
Available for sale and held for trading securities are valued at market or fair value as at the balance sheetdate. Depreciation or appreciation for each basket within the available for sale and held for trading categories isaggregated. Net appreciation in each basket, if any, that is not realized is ignored, while net depreciation isprovided for.
Investments in security receipts or pass through certificates issued by asset reconstruction companies ortrusts set up by asset reconstruction companies should be valued at the net asset value announced periodically bythe asset reconstruction company based on the valuation of the underlying assets.
The Reserve Bank of India has recently issued draft revised guidelines on investment classification,valuation and accounting which have not yet been finalized.
Limit on Transactions through Individual Brokers
Guidelines issued by the Reserve Bank of India require banks to empanel brokers for transactions insecurities. These guidelines also require that a disproportionate part of the bank’s business should not betransacted only through one broker or a few brokers. The Reserve Bank of India specifies that not more than5.0% of the total transactions through empanelled brokers can be transacted through one broker. If for any reasonthis limit is breached, the Reserve Bank of India has stipulated that the Board of Directors of the bank concernedshould ratify such action.
Prohibition on Short-Selling
The Reserve Bank of India does not permit short selling of securities by banks excluding intra-day shortselling in Central Government securities. The Reserve Bank of India has permitted banks to sell Government ofIndia securities already contracted for purchase provided the purchase contract is confirmed and the contract isguaranteed by Clearing Corporation of India Limited or the security is contracted for purchase from the ReserveBank of India. Each security is deliverable or receivable on a net basis for a particular settlement cycle.
In February, 2006, the Reserve Bank of India introduced intra-day short selling in Central Governmentsecurities as a measure to develop the Central Government securities market. In its Annual Policy Statement forfiscal 2007, the Reserve Bank of India proposed to introduce a ‘when issued’ market in government securities inorder to further strengthen the debt management framework.
Subsidiaries and Other Financial Sector Investments
We need the prior permission of the Reserve Bank of India to incorporate a subsidiary. We are required tomaintain an “arms’ length” relationship with our subsidiaries and with mutual funds sponsored by us in regard tobusiness parameters such as taking undue advantage in borrowing/lending funds, transferring/selling/buying ofsecurities at rates other than market rates, giving special consideration for securities transactions, in supporting/financing the subsidiary and financing our clients through them when we are not able or not permitted to do so
154

ourselves. We have to observe the prudential norms stipulated by the Reserve Bank of India, from time to time,in respect of our underwriting commitments. Pursuant to such prudential norms, our underwriting or theunderwriting commitment of our subsidiaries under any single obligation shall not exceed 15.0% of an issue. Wealso need the prior specific approval of the Reserve Bank of India to participate in the equity of financial servicesventures including stock exchanges and depositories notwithstanding the fact that such investments may bewithin the ceiling (the lower of 30.0% of the paid-up capital of the investee company and 30.0% of the investingbank’s own paid up capital and reserves) prescribed under Section 19(2) of the Banking Regulation Act. Ourinvestment in a subsidiary company, financial services company, financial institution and stock and otherexchanges cannot exceed 10.0% of our paid-up capital and reserves and our aggregate investments in all suchcompanies, financial institutions, stock and other exchanges put together cannot exceed 20.0% of our paid-upcapital and reserves. In August 2006, the Reserve Bank of India issued guidelines which included banks’investments in venture capital funds in this limit
Regulations relating to Deposits
The Reserve Bank of India has permitted banks to independently determine rates of interest offered on termdeposits. However, banks are not permitted to pay interest on current account deposits. Further, banks may onlypay interest of up to 3.5% per annum on savings deposits. In respect of savings and time deposits accepted fromemployees, ICICI Bank is permitted by the Reserve Bank of India to pay an additional interest of 1.0% over theinterest payable on deposits from the public.
• Domestic time deposits have a minimum maturity of seven days. Time deposits from non-residentIndians denominated in foreign currency have a minimum maturity of one year and a maximummaturity of three years.
ICICI Bank stipulates a minimum balance of Rs. 10,000 (US$ 218) for a non-resident rupee savings deposit.Interest rates on non-resident rupee term deposits of one to three years maturity are not permitted to exceed theLIBOR/SWAP rates for US dollar of corresponding maturity plus 50 basis points. Interest rates on non-residentrupee savings deposits are not permitted to exceed the LIBOR/SWAP rate plus 50 basis points for six monthsmaturity on US dollar deposits and are fixed quarterly on the basis of the LIBOR/SWAP rate of US dollar on thelast working day of the preceding quarter. On November 17, 2005, the Reserve Bank of India revised the interestrate on non-resident rupee term deposits of one to three years to LIBOR/SWAP rate plus 75 basis points. Theinterest rate on non-resident savings deposits is at rate applicable to domestic savings deposits.
Regulations relating to Knowing the Customer and Anti-Money Laundering
The Reserve Bank of India issued a notification dated November 29, 2004 prescribing guidelines for KnowYour Customer and anti money laundering procedures. Banks are required to have a customer acceptance policylaying down explicit criteria for acceptance of customers and defining risk parameters. A profile of the customersshould be prepared based on risk categorization. Banks have been advised to apply enhanced due diligence forhigh-risk customers. The guidelines provide that banks should undertake customer identification procedureswhile establishing a banking relationship or carrying out a financial transaction or when the bank has a doubtabout the authenticity or the adequacy of the previously obtained customer identification data. Banks need toobtain sufficient information necessary to establish the identity of each new customer and the purpose of theintended banking relationship. The guidelines also provide that banks should monitor transactions depending onthe account’s risk sensitivity. In February 2006, the Reserve Bank of India issued guidelines on the obligations ofbanks under the Prevention of Money Laundering Act, 2002. The Reserve Bank of India also issued anti moneylaundering guidelines to other entities such as non-bank finance companies and authorized money changers.
In August 2005, the Reserve Bank of India has simplified the KYC procedure for opening accounts forthose persons who intend to keep balances not exceeding Rs. 50,000 (US$ 1,088) in all their accounts takentogether and the total credit in all the accounts taken together is not expected to exceed Rs. 100,000 (US$ 2,176)in a year in order to ensure that the implementation of the KYC guidelines do not result in the denial of thebanking services to those who are financially or socially disadvantaged.
155
The Indian Parliament had enacted the Prevention of Money Laundering Act in 2002. Effective July 1,2005, the provisions of this Act have come into force. The Act seeks to prevent money laundering and to providefor confiscation of property derived from, or involved in, money laundering. In addition, the applicable exchangecontrol regulations prescribe reporting mechanisms for transactions in foreign exchange and require authorizeddealers to report identified suspicious transactions to the Reserve Bank of India. In December 2004, the IndianParliament passed the Unlawful Activities (Prevention) Amendment Ordinance/Act, 2004 incorporating theprovisions considered necessary to deal with various facets of terrorism. The Narcotic Drugs and PsychotropicSubstances Act, 1985 deals with proceeds of drug related crime.
Regulations on Asset Liability Management
At present, the Reserve Bank of India’s regulations for asset liability management require banks to draw upasset-liability gap statements separately for rupee and for four major foreign currencies. These gap statements areprepared by scheduling all assets and liabilities according to the stated and anticipated re-pricing date, ormaturity date. These statements have to be submitted to the Reserve Bank of India on a quarterly basis. TheReserve Bank of India has advised banks to actively monitor the difference in the amount of assets and liabilitiesmaturing or being re-priced in a particular period and place internal prudential limits on the gaps in each timeperiod, as a risk control mechanism. Additionally, the Reserve Bank of India has asked banks to manage theirasset-liability structure such that the negative liquidity gap in the 1-14 day and 15–28 day time periods does notexceed 20.0% of cash outflows in these time periods. This 20.0% limit on negative gaps was made mandatorywith effect from April 1, 2000. In respect of other time periods, up to one year, the Reserve Bank of India hasdirected banks to lay down internal norms in respect of negative liquidity gaps. In April 2006, the Reserve Bankof India issued draft guidelines on improvements to banks’ asset liability management framework.
Foreign Currency Dealership
The Reserve Bank of India has granted ICICI Bank a full-fledged authorized dealers’ license to deal in foreignexchange through its designated branches. Under this license, ICICI Bank has been granted permission to:
• engage in foreign exchange transactions in all currencies;
• open and maintain foreign currency accounts abroad;
• raise foreign currency and rupee denominated deposits from non resident Indians;
• grant foreign currency loans to on-shore and off-shore corporations;
• open documentary credits;
• grant import and export loans;
• handle collection of bills, funds transfer services;
• issue guarantees; and
• enter into derivative transactions and risk management activities that are incidental to its normalfunctions authorized under its organizational documents.
Further, we are permitted to hedge foreign currency loan exposures of Indian corporations in the form ofinterest rate swaps, currency swaps and forward rate agreements, subject to certain conditions.
ICICI Bank’s foreign exchange operations are subject to the guidelines specified by the Reserve Bank ofIndia in the exchange control manual. As an authorized dealer, ICICI Bank is required to enroll as a member ofthe Foreign Exchange Dealers Association of India, which prescribes the rules relating to foreign exchangebusiness in India.
Authorized dealers, like ICICI Bank, are required to determine their limits on open positions and maturitygaps in accordance with the Reserve Bank of India’s guidelines and these limits are approved by the ReserveBank of India.
156

Ownership Restrictions
The government of India regulates foreign ownership in Indian banks. The total foreign ownership in aprivate sector bank, like ICICI Bank, cannot exceed 74.0% of the paid-up capital and shares held by foreigninstitutional investors under portfolio investment schemes through stock exchanges cannot exceed 49.0% of thepaid-up capital.
The Reserve Bank of India’s acknowledgement is required for the acquisition or transfer of a bank’s shareswhich will take the aggregate holding (both direct and indirect, beneficial or otherwise) of an individual or agroup to the equivalent of 5.0% or more of its total paid up capital. The Reserve Bank of India, while grantingacknowledgement, may take into account all matters that it considers relevant to the application, includingensuring that shareholders whose aggregate holdings are above specified thresholds meet fitness and proprietytests. In determining whether the acquirer or transferee is fit and proper to be a shareholder, the Reserve Bank ofIndia may take into account various factors including, but not limited to, the acquirer or transferee’s integrity,reputation and track record in financial matters and compliance with tax laws, proceedings of a seriousdisciplinary or criminal nature against the acquirer or transferee and the source of funds for the investment.
While granting acknowledgement for acquisition or transfer of shares that takes the acquirer’s shareholdingto 10.0% or more and up to 30.0% of a private sector bank’s paid-up capital, the Reserve Bank of India mayconsider additional factors, including but not limited to:
• the source and stability of funds for the acquisition and ability to access financial markets as a sourceof continuing financial support for the bank,
• the business record and experience of the applicant including any experience of acquisition ofcompanies,
• the extent to which the acquirer’s corporate structure is in consonance with effective supervision andregulation of its operations; and
• in case the applicant is a financial entity, whether the applicant is a widely held entity, publicly listedand a well established regulated financial entity in good standing in the financial community.
While granting acknowledgment for acquisition or transfer of shares that takes the acquirer’s shareholdingto 30.0% or more of a private sector bank’s paid-up capital, the Reserve Bank of India may consider additionalfactors, including but not limited to, whether or not the acquisition is in the public interest, and shareholderagreements and their impact on the control and management of the bank’s operations.
In February 2005, the Reserve Bank of India issued guidelines on ownership and governance in privatesector banks. The key provisions of the guidelines on ownership are:
• No single entity or group of related entities would be permitted to directly or indirectly hold or controlmore than 10.0% of the paid up equity capital of a private sector bank and any higher level ofacquisition would require the Reserve Bank of India’s prior approval;
• In respect of corporate shareholders, the objective will be to ensure that no entity or group of relatedentities has a shareholding in excess of 10.0% in the corporate shareholder. In case of shareholders thatare financial entities, the objective will be to ensure that it is widely held, publicly listed and wellregulated;
• The Reserve Bank of India may permit a higher level of shareholding in case of restructuring ofproblem banks or weak banks or in the interest of consolidation in the banking industry;
• Banks would be responsible for compliance with the “fit and proper” criteria for shareholders on anongoing basis; and
• Banks with shareholders with holdings in excess of the prescribed limit would have to indicate a planfor compliance.
157

The Reserve Bank of India has recently announced guidelines stating that these regulations would also applyin the event an existing shareholder’s shareholding exceed the specified limit as a result of a rights issue of shareswhere other shareholders do not subscribe to the issue.
Legislation introduced in the Parliament to amend the Banking Regulation Act provides that prior approvalof the Reserve Bank of India shall be mandatory for the acquisition of more than 5.0% of a banking company’spaid up capital or voting rights by any individual or firm or group.
Restrictions on Payment of Dividends
In May 2005, the Reserve Bank of India issued guidelines stating that a bank may declare dividends only ifall of the following conditions are met:
• Capital adequacy ratio is at least 9.0% for the preceding two completed years and the accounting yearfor which the bank proposes to declare a dividend.
• Net non-performing asset ratio is less than 7.0%.
• The bank is in compliance with the prevailing regulations and guidelines issued by the Reserve Bank ofIndia, including the creation of adequate provision for the impairment of assets, staff retirementbenefits, transfer of profits to statutory reserves, etc.
• The proposed dividend will be paid out of the current year’s profit.
• The Reserve Bank of India has not placed any explicit restrictions on the bank for declaration ofdividends.
In case the bank does not meet the capital adequacy norms, but has a capital adequacy ratio of at least 9.0%for the accounting year for which it proposes to declare a dividend, it would be eligible to do so if its netnon-performing asset ratio is less than 5.0%.
Banks that are eligible to declare dividends under the above rules can do so subject to the following:
• The dividend payout ratio (calculated as a percentage of dividend payable in a year to net profit duringthe year) must not exceed 40.0%. The maximum permissible dividend payout ratio would vary frombank to bank, depending on the capital adequacy ratio in each of the last three years and the netnon-performing asset ratio.
• In case the profit for the relevant period includes any extraordinary income, the payout ratio must becalculated after excluding that income for compliance with the prudential payout ratio.
• The financial statements pertaining to the financial year for which the bank is declaring a dividendshould be free of any qualification by the statutory auditors, which might have an adverse effect on theprofit during that year. In case there are any such qualifications, the net profit should be suitablyadjusted while computing the dividend payout ratio.
Moratorium, Reconstruction & Amalgamation of Banks
The Reserve Bank of India can apply to the Government of India for suspension of business by a bankingcompany. The Government of India after considering the application of the Reserve Bank of India may order amoratorium staying commencement of action or proceedings against such company for a maximum period of sixmonths. During such period of moratorium, the Reserve Bank of India may (a) in the public interest; or (b) in theinterest of the depositors; or (c) in order to secure the proper management of the bank; or (d) in the interests ofthe banking system of the country as a whole, prepare a scheme for the reconstruction of the bank oramalgamation of the bank with any other bank. In circumstances entailing reconstruction of the bank oramalgamation of the bank with another bank, the Reserve Bank of India invites suggestions and objections on the
158

draft scheme prior to placing the scheme before the Government of India for its sanction. The CentralGovernment may sanction the scheme with or without modifications. The law does not require consent of theshareholders or creditors of such banks.
Regulations on Mergers of Private Sector Banks and Banks and Non-banking Finance Companies
In May 2005, the Reserve Bank of India issued guidelines to facilitate mergers between private sector banksand between banks and non-banking finance companies. The guidelines particularly emphasize the examinationof the rationale for amalgamation, the systemic benefits arising from it and the advantages accruing to themerged entity. With respect to a merger between two private sector banks, the guidelines require the draftscheme of amalgamation to be approved by the shareholders of both banks with a two-thirds majority afterapproval by the boards of directors of the two banks concerned. The draft scheme should also consider the impactof amalgamation on the valuation, profitability and capital adequacy ratio of the amalgamating bank and verifythat the reconstituted board conforms to the Reserve Bank of India norms. The approved scheme needs to besubmitted to the Reserve Bank of India for valuation and sanction in accordance with the Banking RegulationAct, along with other documentation such as the draft document of proposed merger, copies of all relevantnotices and certificates, swap ratio, share prices, etc. With respect to a merger of a bank and a non-bankingcompany, the guidelines specify that the non-banking finance company has to comply with Know YourCustomer norms for all accounts and all relevant norms issued by the Reserve Bank of India and the Securitiesand Exchange Board of India. The non-banking finance company should also conform to insider trading normsissued by the Securities and Exchange Board of India, whether it is listed or not, in order to regulate thepromoter’s trading of shares before and after the amalgamation discussion period.
Credit Information Bureaus
The Parliament of India has enacted the Credit Information Companies (Regulation) Act, 2005, pursuant towhich every credit institution, including a bank, has to become a member of a credit information bureau andfurnish to it such credit information as may be required of the credit institution by the credit information bureauabout persons who enjoy a credit relationship with it. Other credit institutions, credit information bureaus andsuch other persons as the Reserve Bank of India specifies may access such disclosed credit information.
Deposit Insurance
Demand and time deposits of up to Rs. 100,000 (US$ 2,176) accepted by Indian banks have to bemandatorily insured with the Deposit Insurance and Credit Guarantee Corporation, a wholly-owned subsidiary ofthe Reserve Bank of India. Banks are required to pay the insurance premium for the eligible amount to theDeposit Insurance and Credit Guarantee Corporation on a semi-annual basis. The cost of the insurance premiumcannot be passed on to the customer.
Statutes Governing Foreign Exchange and Cross-Border Business Transactions
The foreign exchange and cross border transactions undertaken by banks are subject to the provisions of theForeign Exchange Management Act. All branches should monitor all non-resident accounts to prevent moneylaundering.
The Reserve Bank of India issued guidelines on External Commercial Borrowings via its Master Circular inJuly 2005, which stated that no financial intermediary, including banks, will be permitted to raise suchborrowings or provide guarantees in favor of overseas lenders for such borrowings. Eligible borrowers may raisesuch borrowings to finance the import of equipment and to meet foreign exchange needs of infrastructureprojects. In a guideline dated August 1, 2005 the Reserve Bank of India has announced that external commercialborrowing proceeds can be utilized for overseas direct investment in joint ventures/wholly owned subsidiariessubject to the existing guidelines on Indian Direct Investment in joint ventures/wholly owned subsidiariesabroad. Further utilization of external commercial borrowing proceeds is not permitted for lending, capitalmarket investments or acquisitions in India or real estate investments.
159

In March 2006, in view of enhanced stability in India’s external and financial sectors and increased integrationof the financial sector in the global economy, the Reserve Bank of India constituted a Committee to set out aroadmap towards fuller capital account convertibility. The Committee has submitted its report in July 2006.
In October 2006, the Reserve Bank of India permitted banks to borrow funds from their overseas branchesand correspondent banks up to a limit of 50.0% of unimpaired Tier I capital or US$ 10.0 million, whichever ishigher, as against the earlier overall limit of 25.0%. However, short-term borrowings up to a period of one yearor less should not exceed 20.0% of unimpaired Tier I capital within the overall limit of 50.0%. Capital fundsraised by issue of innovative perpetual debt instruments and other overseas borrowing with the specific approvalof the Reserve Bank would continue to be outside the limit of 50.0%.
Legal Reserve Requirements
Cash Reserve Ratio
A bank is required to maintain a specified percentage of its net demand and time liabilities, excluding inter-bank deposits, by way of cash reserve with itself and by way of balance in current account with the Reserve Bankof India. The cash reserve ratio can be a minimum of 3.0% and a maximum of 20.0% pursuant to section 42 ofthe Reserve Bank of India Act. Effective October 2, 2004, the cash reserve ratio is 5.0%. Following theenactment of the Reserve Bank of India (Amendment) Bill 2006, the floor and ceiling rates on the cash reserveratio were removed. In a guideline dated June 22, 2006, the Reserve Bank of India announced that the cashreserve ratio requirement would be maintained at 5.0% until further notice. In December 2006 the Reserve Bankof India increased the Cash Reserve Ratio by 50 basis points to 5.5%. The increase will be implemented in twostages, effective from the fortnight beginning December 23, 2006 and the fortnight beginning January 6, 2007.The Reserve Bank of India used to pay on cash reserves above 3.0%, which is no longer paid pursuant to theamendments to the Reserve Bank of India Act.
The following liabilities are excluded from the calculation of the demand and time liabilities to determinethe cash reserve ratio:
• inter-bank liabilities;
• liabilities to primary dealers;
• refinancing from the Reserve Bank of India and other institutions permitted to offer refinancing tobanks; and
• perpetual debt qualifying for lower Tier I capital treatment.
The Reserve Bank of India pays no interest on the cash reserves up to 3.0% of the demand and timeliabilities and has discontinued paying interest on the balance at 3.5% per annum.
The cash reserve ratio has to be maintained on an average basis for a fortnightly period and should not bebelow 70.0% of the required cash reserve ratio on any day of the fortnight.
Statutory Liquidity Ratio
In addition to the cash reserve ratio, a bank is required to maintain a specified percentage of its net demandand time liabilities by way of liquid assets like cash, gold or approved unencumbered securities. The percentageof this liquidity ratio is fixed by the Reserve Bank of India from time to time, and it can be a minimum of 25.0%and a maximum of 40.0% pursuant to section 24 of the Banking Regulation Act. At present, the Reserve Bank ofIndia requires banking companies to maintain a liquidity ratio of 25.0%. The Banking Regulation (Amendment)Bill, 2005 recently introduced in the Indian Parliament proposes to amend section 24 of the Banking RegulationAct to remove the minimum Statutory Liquidity Ratio stipulation, thereby giving the Reserve Bank of India thefreedom to fix the Statutory Liquidity Ratio below this level. See also “Overview of the Indian FinancialSector—Recent Structural Reforms—Proposed Amendments to the Banking Regulation Act”.
160

Requirements of the Banking Regulation Act
Prohibited Business
The Banking Regulation Act specifies the business activities in which a bank may engage. Banks areprohibited from engaging in business activities other than the specified activities.
Reserve Fund
Any bank incorporated in India is required to create a reserve fund to which it must transfer not less than25.0% of the profits of each year before dividends. If there is an appropriation from this account, the bank isrequired to report the same to the Reserve Bank of India within 21 days, explaining the circumstances leading tosuch appropriation. The Government of India may, on the recommendation of the Reserve Bank of India, exempta bank from requirements relating to its reserve fund.
Payment of Dividend
Pursuant to the provisions of the Banking Regulation Act, a bank can pay dividends on its shares only after allits capitalized expenses (including preliminary expenses, share selling commission, brokerage, amounts of lossesand any other item of expenditure not represented by tangible assets) have been completely written off. The Indiangovernment may exempt banks from this provision by issuing a notification on the recommendation of the ReserveBank of India. We have been exempted from this provision in respect of expenses relating to the Early RetirementOption offered by us in fiscal 2004. We have obtained permission from the Reserve Bank of India to write off theseexpenses over a five-year period in our Indian GAAP accounts. Further, the payment of the dividend by banks issubject to the eligibility criteria specified by the Reserve Bank of India from time to time.
Restriction on Share Capital and Voting Rights
Banks can issue only ordinary shares. The Banking Regulation Act specifies that no shareholder in abanking company can exercise voting rights on poll in excess of 10.0% of total voting rights of all theshareholders of the banking company.
Only banks incorporated before January 15, 1937 can issue preference shares. Prior to the amalgamation,ICICI had preference share capital of Rs. 3.5 billion (US$ 76.2 million). The Government of India, on therecommendation of the Reserve Bank of India, has granted an exemption to ICICI Bank which allows theinclusion of preference capital in the capital structure of ICICI Bank for a period of five years, though ICICIBank is a bank incorporated after January 15, 1937.
Legislation recently introduced in the Indian Parliament proposes to amend the Banking Regulation Act toremove the limit of 10.0% on the maximum voting power exercisable by an shareholder in a banking companyand allow banks to issue redeemable and non-redeemable preference shares. See also “Overview of the IndianFinancial Sector—Recent Structural Reforms—Proposed Amendments to the Banking Regulation Act”.
Restrictions on Investments in a Single Company
No bank may hold shares in any company exceeding 30.0% of the paid up share capital of that company or30.0% of its own paid up share capital and reserves, whichever is less.
Regulatory Reporting and Examination Procedures
The Reserve Bank of India is empowered under the Banking Regulation Act to inspect a bank. The ReserveBank of India monitors prudential parameters at quarterly intervals. To this end and to enable off-site monitoringand surveillance by the Reserve Bank of India, banks are required to report to the Reserve Bank of India onaspects such as:
• assets, liabilities and off-balance sheet exposures;
161

• the risk weighting of these exposures, the capital base and the capital adequacy ratio;
• the unaudited operating results for each quarter;
• asset quality;
• concentration of exposures;
• connected and related lending and the profile of ownership, control and management; and
• other prudential parameters.
The Reserve Bank of India also conducts periodical on-site inspections on matters relating to the bank’sportfolio, risk management systems, internal controls, credit allocation and regulatory compliance, at intervalsranging from one to three years. ICICI Bank has been and, at present is also, subject to the on-site inspection bythe Reserve Bank of India at yearly intervals. The inspection report, along with the report on actions taken byICICI Bank, has to be placed before our Board of Directors. On approval by our Board of Directors, we arerequired to submit the report on actions taken by it to the Reserve Bank of India. The Reserve Bank of India alsodiscusses the report with the management team including the Managing Director & CEO.
The Reserve Bank of India also conducts on-site supervision of selected branches of ICICI Bank withrespect to their general operations and foreign exchange related transactions.
Appointment and Remuneration of the Chairman, Managing Director and Other Directors
ICICI Bank is required to obtain prior approval of the Reserve Bank of India before it appoints its chairmanand managing director and any other wholetime directors and fixes their remuneration. The Reserve Bank ofIndia is empowered to remove an appointee to the posts of chairman, managing director and wholetime directorson the grounds of public interest, interest of depositors or to ensure the proper management of ICICI Bank.Further, the Reserve Bank of India may order meetings of our Board of Directors to discuss any matter in relationto ICICI Bank, appoint observers to such meetings and in general may make such changes to the management asit may deem necessary and may also order the convening of a general meeting of the shareholders of ICICI Bankto elect new directors. ICICI Bank cannot appoint as a director any person who is a director of another bankingcompany. In July 2004, the Reserve Bank of India issued guidelines on ‘fit and proper’ criteria for directors ofbanks.
Penalties
The Reserve Bank of India may impose penalties on banks and its employees in case of infringement ofregulations under the Banking Regulation Act. The penalty may be a fixed amount or may be related to theamount involved in any contravention of the regulations. The penalty may also include imprisonment. A pressrelease has been issued by the Reserve Bank of India giving details of the circumstances under which the penaltyis imposed on the bank along with the communication on the imposition of the penalty in public domain. Thebank is also required to disclose the penalty in its annual report.
Assets to be Maintained in India
Every bank is required to ensure that its assets in India (including import-export bills drawn in India andReserve Bank of India approved securities, even if the bills and the securities are held outside India) are not lessthan 75.0% of its demand and time liabilities in India.
Restriction on Creation of Floating Charge
Prior approval of the Reserve Bank of India is required for creating floating charge on ICICI Bank’sundertaking or property. Currently, all ICICI Bank’s borrowings including bonds are unsecured.
162

Secrecy Obligations
ICICI Bank’s obligations relating to maintaining secrecy arise out of common law principles governing itsrelationship with its customers. ICICI Bank cannot disclose any information to third parties except under clearlydefined circumstances. The following are the exceptions to this general rule:
• where disclosure is required to be made under any law;
• where there is an obligation to disclose to the public;
• where ICICI Bank needs to disclose information in its interest; and
• where disclosure is made with the express or implied consent of the customer.
ICICI Bank is also required to disclose information if ordered to do so by a court. The Reserve Bank ofIndia may, in the public interest, publish the information obtained from the bank. Under the provisions of theBanker’s Books Evidence Act, a copy of any entry in a bankers’ book, such as ledgers, day books, cash booksand account books certified by an officer of the bank may be treated as prima facie evidence of the transaction inany legal proceedings.
Regulations governing Offshore Banking Units
The government and Reserve Bank of India have permitted banks to set up Offshore Banking Units inSpecial Economic Zones, which are specially delineated duty free enclaves deemed to be foreign territory for thepurpose of trade operations, duties and tariffs. ICICI Bank has an Offshore Banking Unit located in the SantacruzElectronic Exports Promotion Zone, Mumbai. The key regulations applicable to offshore bank units include, butare not limited to, the following:
• No separate assigned capital is required. However, the parent bank is required to provide a minimum ofUS$ 10 million to its offshore banking unit.
• Offshore Banking Units are exempt from cash reserve ratio requirements.
• Reserve Bank of India may exempt a bank’s offshore banking unit from statutory liquidity ratiorequirements on specific application by the bank.
• An offshore banking unit may not enter into any transactions in foreign exchange with residents inIndia, unless such a person is eligible to enter into or undertake such transactions under the ForeignExchange Management Act, 1999.
• All prudential norms applicable to overseas branches of Indian banks apply to Offshore Banking Units.
• Offshore banking units are required to adopt liquidity and interest rate risk management policiesprescribed by Reserve Bank of India in respect of overseas branches of Indian banks as well as withinthe overall risk management and asset and liability management framework of the bank subject tomonitoring by the bank’s Board of Directors at prescribed intervals. Further, the bank’s board would berequired to set comprehensive overnight limits for each currency for these branches, which would beseparate from the open position limit of the parent bank.
• Offshore banking units may raise funds in convertible foreign currency as deposits and borrowingsfrom non-residents including non-resident Indians but excluding overseas corporate bodies.
• Offshore banking units may operate and maintain balance sheets only in foreign currency.
• The loans and advances of Offshore Banking Units would not be reckoned as net bank credit forcomputing priority sector lending obligations.
• Offshore banking units must follow the Know Your Customer guidelines and must be able to establishthe identity and address of the participants in a transaction, the legal capacity of the participants and theidentity of the beneficial owner of the funds.
163

The Special Economic Zone Act 2005 permitted Offshore Banking Units to additionally undertake thefollowing activities:
• Lend outside India and take part in international syndications/consortiums at par with foreign offices.
• Invest in foreign currency denominated debt of Indian units.
• Extend facilities to subsidiaries/units of Indian entities, located outside India.
Regulations and Guidelines of the Securities and Exchange Board of India
The Securities and Exchange Board of India was established to protect the interests of public investors insecurities and to promote the development of, and to regulate, the Indian securities market. ICICI Bank is subjectto the Securities and Exchange Board of India regulations for its public capital issuances, as well as itsunderwriting, custodial, depositary participant, investment banking, registrar and transfer agents, brokering anddebenture trusteeship activities. These regulations provide for its registration with the Securities and ExchangeBoard of India for each of these activities, functions and responsibilities. ICICI Bank is required to adhere to acode of conduct applicable for these activities.
Public Financial Institution Status
ICICI was a public financial institution under the Indian Companies Act, 1956. The special status of publicfinancial institutions is also recognized under other statutes including the Indian Income Tax Act, 1961, SickIndustrial Companies (Special Provisions) Act, 1985 and Recovery of Debts Due to Banks and FinancialInstitutions Act, 1993. ICICI Bank is not a public financial institution. As a public financial institution, ICICIwas entitled to certain benefits under various statutes. These benefits included the following:
• For income tax purposes, ICICI’s bonds were prescribed modes for investing and depositing surplusmoney by charitable and religious trusts. Since ICICI Bank is a scheduled bank, its deposits and bondsare also prescribed modes for investment by religious and charitable trusts.
• The Government of India had permitted non-government provident, superannuation and gratuity fundsto invest up to 40.0% of their annual accretion of funds in bonds and securities issued by publicfinancial institutions. Further, the trustees of these funds could at their discretion invest an additional20.0% of such accretions in these bonds and securities. These funds can invest up to only 10.0% oftheir annual accretion in bonds and securities issued by private sector banks, such as ICICI Bank.
• Indian law provides that a public financial institution cannot, except as provided by law or practice,divulge any information relating to, or to the affairs of, its customers. ICICI Bank has similarobligations relating to maintaining secrecy arising out of common law principles governing itsrelationship with its customers.
• The Recovery of Debts Due to Banks and Financial Institutions Act, 1993 provides for establishmentof debt recovery tribunals for recovery of debts due to any bank or public financial institution or to aconsortium of banks and public financial institutions. Under this Act, the procedures for recoveries ofdebt were simplified and time frames were fixed for speedy disposal of cases. Upon establishment ofthe debt recovery tribunal, no court or other authority can exercise jurisdiction in relation to matterscovered by this Act, except the higher courts in India in certain circumstances. This Act applies tobanks as well as public financial institutions and therefore applies to ICICI Bank.
ICICI’s cessation as a public financial institution would have constituted an event of default under certain ofICICI’s loan agreements related to its foreign currency borrowings. Prior to the amalgamation becomingeffective, such event of default was waived by the respective lenders pursuant to the terms of such foreigncurrency borrowing agreements.
164

Special Status of Banks in India
The special status of banks is recognized under various statutes including the Sick Industrial CompaniesAct, 1985, Recovery of Debts Due to Banks and Financial Institutions Act, 1993, and the Securitization Act. As abank, ICICI Bank is entitled to certain benefits under various statutes including the following:
• The Recovery of Debts Due to Banks and Financial Institutions Act, 1993 provides for establishmentof Debt Recovery Tribunals for expeditious adjudication and recovery of debts due to any bank orPublic Financial Institution or to a consortium of banks and Public Financial Institutions. Under thisAct, the procedures for recoveries of debt have been simplified and time frames have been fixed forspeedy disposal of cases. Upon establishment of the Debt Recovery Tribunal, no court or otherauthority can exercise jurisdiction in relation to matters covered by this Act, except the higher courts inIndia in certain circumstances.
• The Sick Industrial Companies Act, 1985, provides for reference of sick industrial companies to theBoard for Industrial and Financial Reconstruction. Under the Act, other than the Board of Directors ofa company, a scheduled bank (where it has an interest in the sick industrial company by any financialassistance or obligation, rendered by it or undertaken by it) may refer the company to the BIFR.
• The Securitization Act focuses on improving the rights of banks and financial institutions and otherspecified secured creditors as well as asset reconstruction companies by providing that such securedcreditors can take over management control of a borrower company upon default and/or sell assetswithout the intervention of courts, in accordance with the provisions of the Securitization Act.
Income Tax Benefits
As a banking company, ICICI Bank is entitled to certain tax benefits under the Indian Income Tax Actincluding the following:
• ICICI Bank is allowed a deduction of up to 40.0% of its taxable business income derived from thebusiness of long-term financing (defined as loans and advances extended for a period of not less thanfive years) which is transferred to a special reserve, provided that the total amount of this reserve doesnot exceed two times the paid-up share capital and general reserves. ICICI Bank is entitled to thisbenefit because it is a financial corporation. Effective fiscal 1998, if a special reserve is created, it mustbe maintained and if it is utilized, it is treated as taxable income in the year in which it is utilized.
• ICICI Bank is entitled to a tax deduction on the provisioning towards bad and doubtful debts equal to7.5% of ICICI Bank’s total business income, computed before making any deductions permittedpursuant to Chapter VIA of the Indian Income Tax Act, and to the extent of 10.0% of the aggregateaverage advances made by its rural branches computed in the manner prescribed. ICICI Bank has theoption of claiming a deduction in excess of the specified limits, for an amount not exceeding theincome derived from redemption of securities in accordance with the scheme framed by the CentralGovernment.
• ICICI Bank is entitled to a tax deduction, for income from an offshore banking unit in a specialeconomic zone, at the rate of 100% for a period of five consecutive years beginning with the year inwhich permission under Banking Regulation Act, 1949 is obtained, i.e., up to March 31, 2008 for OBUin SEEPZ, Mumbai and 50% deduction for a period of five consecutive years thereafter in accordancewith and subject to the conditions prescribed therein.
• Subject to application for and receipt of certain approvals, ICICI Bank is eligible to issue tax savingbonds approved in accordance with and subject to the provisions of the Indian Income Tax Act and isalso eligible to issue zero coupon bonds in accordance with the applicable guidelines.
• For income tax purposes, ICICI Bank’s bonds are prescribed modes of investing and depositing surplusmoney by charitable and religious trusts subject to and in accordance with the provisions containedtherein.
165

Regulations governing Insurance Companies
ICICI Prudential Life Insurance Company and ICICI Lombard General Insurance Company, the subsidiariesof ICICI Bank offering life insurance and non-life insurance respectively, are subject to the provisions of theInsurance Act, 1938 and the various regulations prescribed by the Insurance Regulatory and DevelopmentAuthority. These regulations regulate and govern, among other things, registration as an insurance company,investment, solvency margin requirements, licensing of insurance agents, advertising, sale and distribution ofinsurance products and services and protection of policyholders’ interests. In May 2002, the Indian Parliamentapproved the Insurance (Amendment) Act 2002, which facilitates the appointment of corporate agents byinsurance companies and prohibits intermediaries and brokers from operating as surrogate insurance agents. TheIndian government, while presenting its budget for fiscal 2005, has proposed an increase in the limit on foreignequity participation in private sector insurance companies from 26.0% to 49.0%. However, this would require anamendment to the Insurance Regulatory and Development Authority Act 1999 and has not yet beenimplemented.
Regulations governing International Operations
Our international operations are governed by regulations in the countries in which we have a presence.
Overseas Banking Subsidiaries
Our wholly-owned subsidiary in the United Kingdom, ICICI Bank UK Limited is authorized by theFinancial Services Authority, which granted our application under Part IV of the Financial Services and MarketsAct, 2000 on August 8, 2003. Our wholly-owned subsidiary in Canada, ICICI Bank Canada, was incorporated asa Schedule II Bank in Canada. ICICI Bank Canada has obtained the approval of the Canada Deposit InsuranceCorporation (CDIC) for deposit insurance and is regulated by the Office of the Superintendent of FinancialInstitutions. Our wholly-owned subsidiary in Russia, ICICI Bank Eurasia LLC, is regulated by the Central Bankof the Russian Federation.
Offshore Branches
In Singapore, we have an offshore branch, regulated by the Monetary Authority of Singapore. TheSingapore branch is allowed to accept foreign currency deposits from Singapore non-bank-residents whose initialdeposit is not less than US$ 100,000. The Singapore branch is currently engaged in corporate & institutionalbanking, private banking and treasury related activities. In Bahrain, we have an offshore branch, regulated by theCentral Bank of Bahrain. The Bahrain branch is permitted to transact banking business with approved financialinstitutions within Bahrain, individuals or institutions outside Bahrain. It is also permitted to offer bankingservices to non-resident Indians in Bahrain. Our branches in Hong Kong and Sri Lanka, regulated by the HongKong Monetary Authority and the Central Bank of Sri Lanka, respectively, are permitted to undertake bankingbusiness in those jurisdictions. Our branch in the Dubai International Financial Centre (DIFC) is regulated by theDIFC Financial Services Authority and is licensed to engage in the arrangement of credit or investment and toprovide advice on financial products and services.
Representative Offices
Our representative office in New York in the United States is licensed and regulated by the State of NewYork Banking Department and the Federal Reserve Board. Our representative office in Dubai, United ArabEmirates is regulated by the Central Bank of the United Arab Emirates. Our representative office in Shanghai,China is regulated by the China Banking Regulatory Commission. Our representative office in Bangladesh isregulated by the Bangladesh Bank. Our representative office in South Africa is regulated by the South AfricanReserve Bank. Our representative office in Malaysia is regulated by Bank Negara Malaysia. Our representativeoffice in Indonesia is regulated by Bank Indonesia. Bank of Thailand regulates our representative office inThailand.
166

DESCRIPTION OF THE NOTES
General
ICICI Bank Limited (“ICICI Bank”), will issue the notes under an Indenture to be dated on or aboutJanuary 12, 2007 between ICICI Bank and the Bank of New York, as Trustee. The terms of the notes includethose stated in the Indenture.
The following is a summary of the material provisions of the Indenture. Because this is a summary, it maynot contain all the information that is important to you. You should read each of the Indenture and theCalculation Agency Agreement in its entirety. Defined terms not otherwise defined in this description have themeaning given to those terms in the Indenture.
The notes
• are unsecured subordinated obligations of ICICI Bank and will rank (i) behind (junior to) the claims ofholders of Senior Indebtedness (as defined herein), (ii) pari passu with Other Pari Passu Claims and(iii) before (senior to) (x) the claims for payment of any obligation that, expressly or by applicable law,is subordinated to the notes, (y) the claims of holders of preference and equity shares of ICICI Bankand (z) the claims of investors in other instruments eligible for inclusion in Tier I capital of ICICIBank, in accordance with the subordination provisions of the Indenture;
• are issued in an aggregate principal amount of US$ 750,000,000; and
• will mature on April 30, 2022 (the “Maturity Date”).
Interest
Interest will be payable on the outstanding principal amount of the notes from January 12, 2007 (the “IssueDate”) (i) semi-annually in arrears on April 30 and October 31 of each year, at a fixed rate per annum equal to6.375%, during the period from (and including) the Issue Date to (but excluding) April 30, 2017, and (ii)thereafter semi-annually in arrears on April 30 and October 31 of each year, at a variable rate per annum equal tothe 6-month LIBOR plus a margin of 2.28%. Each such date is an “Interest Payment Date”. The first paymentof interest will be made on April 30, 2007 in respect of the period from (and including) the Issue Date to (butexcluding) April 30, 2007.
Each period from and including an Interest Payment Date or the Issue Date, as applicable, to but excludingthe next Interest Payment Date until April 30, 2017 is called a “Fixed Interest Period”. The period from andincluding April 30, 2017, to, but excluding, the next following Interest Payment Date and each successive periodfrom, and including, an Interest Payment Date to, but excluding, the Maturity Date is called a “Floating InterestPeriod”. Each Fixed Interest Period and Floating Interest Period is referred to as an “Interest Period”. Intereston the notes during each Fixed Interest Period will be computed on the basis of a 360-day year consisting of 12months of 30 days each, and in the case of an incomplete month, the number of days elapsed and rounding theresulting figure to the nearest cent (half a cent being rounded upwards). Interest on the notes during each FloatingInterest Period will be computed by multiplying the product of the relevant floating rate of interest and theaggregate principal amount of such notes by the actual number of days elapsed in such Floating Interest Perioddivided by 360.
If any day on which interest would otherwise be payable is not a Business Day, then the Interest PaymentDate will be the next succeeding Business Day unless such day falls in the next relevant calendar month, inwhich case the Interest Payment Date will be the immediately preceding Business Day. During any Fixed InterestPeriod, if the Interest Payment Date is the next succeeding Business Day due to the immediately precedingsentence, interest will be payable with the same force and effect as if the payment was made on the originalInterest Payment Date, and no additional interest shall accrue on the amount so payable from such date to suchnext succeeding Business Day.
During the Floating Interest Period, The Bank of New York in its capacity as the calculation agent (the“Calculation Agent”) will calculate the floating rate and the amount of interest payable on each Interest
167

Payment Date. Promptly upon such determination, the Calculation Agent will notify ICICI Bank, the holders ofthe notes and the Singapore Exchange (as defined below) (or any other stock exchange on which the notes arethen listed) on or prior to the first day of each Interest Period during the Floating Interest Period, of: (i) thefloating rate, (ii) the amount of interest payable and (iii) the Interest Payment Date, in each case relating to theapplicable Interest Period, which as determined by the Calculation Agent, absent manifest error, shall be bindingand conclusive. “6-month LIBOR” means, for each Interest Period, the rate (expressed as a percentage perannum) for deposits in U.S. dollars for a six-month period that appears on Telerate Page 3750 as of 11:00 a.m.(London time) on the LIBOR Determination Date for such Interest Period. The term “Telerate Page 3750”means the display on Telerate, Inc. on page 3750 or any successor service or page for the purpose of displayingthe London interbank offered rates of major banks.
The “LIBOR Determination Date” for any Interest Period is the second day that is a London Banking Dayimmediately preceding the first day of such Interest Period. A “London Banking Day” means a day other thanSaturday or Sunday on which dealings in deposits in U.S. dollars are transacted, or with respect to any future dateare expected to be transacted, in the London interbank market.
If a 6-month LIBOR cannot be determined as described above, the Calculation Agent will select four majorbanks in the London interbank market. The Calculation Agent will request that the principal London offices ofthose four selected banks provide their offered quotations to prime banks in the London interbank market atapproximately 11:00 a.m., London time, on the LIBOR Determination Date for such Interest Period. Thesequotations will be for deposits in U.S. dollars for a six-month period. Offered quotations must be based on aprincipal amount equal to an amount that is representative of a single transaction in U.S. dollars in the market atthe time.
If two or more quotations are provided, 6-month LIBOR for the applicable Interest Period will be thearithmetic mean of the quotations. If fewer than two quotations are provided, the Calculation Agent will selectthree major banks in New York City to provide their quoted rates at approximately 11:00 a.m., New York Citytime, on the LIBOR Determination Date for that Interest Period. The rates quoted will be for loans in U.S. dollarsfor a six-month period. Rates quoted must be based on a principal amount equal to an amount that isrepresentative of a single transaction in U.S. dollars in the market at the time. If three banks provide quotations,6-month LIBOR for the applicable Interest Period will be the arithmetic mean of the three quoted rates. If fewerthan three New York City banks selected by the Calculation Agent are quoting such rates, 6-month LIBOR forthe applicable Interest Period will be the same as for the immediately preceding Interest Period.
The floating rate with respect to each Interest Period will be calculated as promptly as practicable by theCalculation Agent according to the method described above. The 6-month LIBOR rate will be rounded to thenearest hundredth of a percent.
If and to the extent that, on any Interest Payment Date, ICICI Bank has or would have as a result of aninterest payment on such date:
• a Capital Deficiency (as defined below), then ICICI Bank shall not pay any principal or interest onsuch date and (i) with respect to any Interest Payment Date other than the Maturity Date, the interestpayable on such date shall be deferred until the next succeeding date on which interest is payable underthe notes, and (ii) with respect to the Maturity Date, any interest (including Interest Arrears andAdditional Interest (each as defined below)) and principal payable on such date shall be deferred untilthe Compulsory Payment Date (as defined below); or
• if the impact of interest payment by ICICI Bank results in a Net Loss (as defined below) or increase inNet Loss without a Capital Deficiency, then ICICI Bank shall not pay any principal or interest on suchdate except that it may pay interest with the prior approval of the RBI and in the event that the RBI
168

does not grant approval for payment of interest (i) with respect to any Interest Payment Date other thanthe Maturity Date, the interest payable on such date shall be deferred until the next succeeding date onwhich interest is payable under the notes, and (ii) with respect to the Maturity Date, any interest(including Interest Arrears and Additional Interest (each as defined below)) and principal payable onsuch date shall be deferred until the Compulsory Payment Date (as defined below).
(each a “Trigger Event”).
If, as a consequence of a Capital Deficiency or a Net Loss, ICICI Bank shall not pay principal or interest onan Interest Payment Date then, no later than the 5th day prior to the relevant Interest Payment Date, it shall deliverto the Trustee a notice indicating the existence of such Capital Deficiency or Net Loss and that it will as aconsequence thereof not pay principal or interest on such Interest Payment Date (a “Payment SuspensionNotice”). A Payment Suspension Notice will have no force or effect unless ICICI Bank has delivered it to theTrustee in accordance herewith.
Interest on the notes will be cumulative. This means that, if interest is not paid on the notes on any InterestPayment Date, holders of the notes will have the right to receive those interest payments on the next succeedingdate on which interest is payable under the notes.
In the event ICICI Bank determines there is a Net Loss without a Capital Deficiency for any InterestPayment Date, ICICI Bank shall apply to the RBI for permission to pay interest which would otherwise be dueon such Interest Payment Date. If the RBI grants such permission, notwithstanding any prior delivery of aPayment Suspension Notice in relation to such Interest Payment Date, ICICI Bank shall, subject to compliancewith such conditions as may be stipulated by the RBI while granting its approval, proceed to pay the interest dueon such Interest Payment Date, either (i) on such Interest Payment Date, if approval from the RBI is received inadvance thereof, or (ii) within 1 business day of receipt of the approval from the RBI if such approval is receivedafter the date which is 1 business day prior to the relevant Interest Payment Date.
In the event that any interest in respect of the notes is not paid on an Interest Payment Date (any suchamount, “Interest Arrears”), such Interest Arrears shall bear interest (“Additional Interest”) from the InterestPayment Date on which the interest first became due to (and including) the actual date of payment. AdditionalInterest shall be calculated at the interest rate payable on the notes. Additional Interest accrued to any InterestPayment Date shall be added, for the purpose only of calculating the Additional Interest accruing thereafter, tothe amount of Interest Arrears remaining unpaid on such Interest Payment Date.
For purposes of the foregoing,
“Business Day” means a day (other than a Saturday or Sunday) on which commercial banks in London,England and New York, New York are open for business.
“Compulsory Payment Date” means, in the case of principal and interest (including Interest Arrears andAdditional Interest), a date after the Maturity Date following deferral of the payment of principal and interestwhich is one business day after the first date on which ICICI Bank determines that it has (i) neither a CapitalDeficiency nor a Net Loss or (ii) no Capital Deficiency, but a Net Loss or increase in Net Loss and has approvalfrom the Reserve Bank of India to make the payment of principal and interest, provided that any such paymentwill not cause ICICI Bank to have a Capital Deficiency or in the case of (i) a Net Loss.
“Capital Deficiency” means, for any Interest Payment Date, that ICICI Bank determines that its capital torisk assets ratio (“CRAR”) has declined below the minimum regulatory requirement prescribed by the RBI fromtime to time, (i) as at the immediately preceding March 31 in the case of the Interest Payment Date in April and(ii) as at the immediately preceding September 30 in the case of the Interest Payment Date in October.
“Net Loss” means, for any Interest Payment Date, a determination made by ICICI Bank as per(a) unconsolidated Indian GAAP financial statements that it has either (i) a negative balance reported in the
169

balance in the profit and loss account line item in its Balance Sheet, or (ii) a net loss reported in its profit and lossaccount, as at and for the 12 month period ended on the immediately preceding March 31 in the case of theInterest Payment Date in April or as at and for the six month period ended on the immediately precedingSeptember 30 in the case of the Interest Payment Date in October, or (b) regulations or guidelines prescribed byReserve Bank of India from time to time in this regard. In case of any conflict between the determination madeunder (a) and (b) hereinabove, the determination made under (b) shall prevail.
Dividend and Capital Restriction
So long as any Interest Arrears or Additional Interest thereon remain unpaid, ICICI Bank will not (i) otherthan to the holders of Existing Preference Shares to the extent permissible and subject to prevailing Indian laws,declare or pay any dividend, distribution or other payment in respect of its Ordinary Shares, any other security orobligation of ICICI Bank ranking junior to the notes, or any Other Pari Passu Claims (other than as requiredunder the terms of any preference shares or other security or obligation ranking junior to the notes (but notincluding Ordinary Shares) or Other Pari Passu Claims), or (ii) other than as required under the terms of suchsecurity or obligation, effect any repurchase or redemption of any of its Ordinary Shares, any other security orobligation of ICICI Bank ranking junior to the notes or any Other Pari Passu Claims (or contribute any moneysto a sinking fund for the redemption of any such shares, securities or claims).
“Other Pari Passu Claims” means claims of creditors of ICICI Bank which are subordinated so as to rankpari passu with claims in respect of the notes.
“Ordinary Shares” means ordinary shares of ICICI Bank.
“Existing Preference Shares” means the three hundred fifty 0.001% preference shares of Rs. 10,000,000each of ICICI Bank allotted as fully paid preference shares to preference shareholders of erstwhile ICICI Limitedredeemable at par on April 20, 2018.
Additional Amounts
All payments of principal and interest in respect of the notes will be made free and clear of and withoutwithholding or deduction for or on account of any present or future taxes, duties, or other governmental chargesof any nature (referred to collectively as “taxes”) imposed or levied by or on behalf of a Taxing Jurisdictionunless the withholding or deduction is required by law. In the event that ICICI Bank is required by law towithhold or deduct amounts for any such taxes, except as provided below, ICICI Bank will pay such additionalamounts (“Additional Amounts”) as shall be required so that the net amount received by each holder of notesafter the withholding or deduction will be the same as the amount then due and payable to each holder of notes inthe absence of such withholding or deduction. However, ICICI Bank will not be required to pay AdditionalAmounts in connection with any taxes imposed due to any of the following:
(i) the holder or the beneficial owner of the notes has some connection with a Taxing Jurisdiction, otherthan merely holding the notes, receiving interest payments on the notes or enforcement of such notes (suchas citizenship, nationality, residence, domicile, or existence of a business, a permanent establishment, adependent agent, a place of business or a place of management present or deemed present within a TaxingJurisdiction);
(ii) any tax imposed on, or measured by, net income of the holder or beneficial owner of the notes;
(iii) the holder’s or the beneficial owner’s failure to comply with any certification, identification orother reporting requirements concerning its nationality, residence, identity or connection with a TaxingJurisdiction, if (1) compliance is required by applicable law (but not including treaties), regulation oradministrative practice as a precondition to exemption from all or a part of the taxes, (2) the holder or thebeneficial owner is able to comply with those requirements without undue hardship and (3) ICICI Bank hasgiven all holders at least 30 days’ prior written notice before any such withholding or deduction that theywill be required to comply with such requirements;
170

(iv) the holder’s failure to surrender (where surrender is required) its Note within 30 days after ICICIBank has made available to the holder a payment of principal or interest, provided that ICICI Bank will payAdditional Amounts to which a holder would have been entitled had such Note been surrendered on any day(including the last day) within such 30-day period;
(v) any estate, inheritance, gift, transfer, capital gains, excise, value-added, use or sales taxes or similartaxes, assessments or other government charges;
(vi) where such withholding or deduction is imposed on a payment to an individual and is required tobe made pursuant to the European Council Directive 2003/48/EC or any other directive implementing theconclusions of the ECOFIN Council meeting of November 26-27, 2000 on the taxation of savings income,or any law implementing or complying with, or introduced in order to conform to, such Directive or suchother directive;
(vii) where the holder who presents a Note for payment (where presentation is required) would be ableto avoid such withholding or deduction by presenting the Note elsewhere in a member state of the EuropeanUnion; or
(viii) any combination of the above items.
Nor will additional amounts be paid with respect to any payment on a Note to a holder who is a fiduciary, apartnership, a limited liability company or other than the sole beneficial owner of that payment, to the extent thatpayment would be required by the laws of a Taxing Jurisdiction to be included in the income, for tax purposes, ofa beneficiary or settlor with respect to the fiduciary, a member of that partnership, an interest holder in thatlimited liability company or a beneficial owner who would not have been entitled to the additional amounts had itbeen the holder.
“Relevant Date” means the date on which the payment of principal or interest first becomes due.
“Taxing Jurisdiction” means India, or any political subdivision thereof or any authority or agency thereinor thereof having the power to tax, or any other jurisdiction or any political subdivision or any authority oragency therein or thereof having the power to tax which ICICI Bank becomes subject in respect of paymentsmade by it of principal or interest on the notes.
Notwithstanding the foregoing, ICICI Bank will pay any stamp, administrative, court, documentary, exciseor property taxes imposed on the initial issuance and delivery of the notes in a Taxing Jurisdiction and willindemnify the holders of the notes for any such taxes paid by the holders of the notes, excluding any such dutiesor taxes which may relate to any transfer or transmission of the notes following their initial issuance anddelivery.
Each reference herein to payments in respect of the notes shall be deemed to include Additional Amounts, ifany.
Any Additional Amounts paid by ICICI Bank through India would be subject to the regulations of theRBI.
Final RedemptionUnless previously redeemed or purchased and cancelled as specified below, each note will be redeemed by
ICICI Bank at its principal amount plus Accrued Interest (if any) and Additional Amounts (if any) on theMaturity Date, subject to the conditions herein.
Optional RedemptionThe Notes are not redeemable at the option of the holders thereof at any time and are not redeemable at the
option of ICICI Bank prior to April 30, 2017 (the “First Call Date”), except in certain circumstances in the eventof certain changes in withholding taxes (see “—Optional Tax Redemption”) or upon the occurrence of aRegulatory Event (see “—Redemption Upon a Regulatory Event”).
The notes may be redeemed at the option of ICICI Bank, in whole (and not in part), on the First Call Date or onany subsequent Interest Payment Date; provided that ICICI Bank will give notice to holders of notes and the Trusteenot less than 15 business days but not more than 30 business days prior to any such redemption. This notice shall bepublished in accordance with the notice provisions described under “Description of the Notes—Notices”.
171
The redemption price for any redemption of the notes will be 100% of the principal amount of the notes thenoutstanding, plus Interest Arrears (if any) and Additional Interest (if any) on the principal amount beingredeemed to (but excluding) the redemption date (the “Base Redemption Price”).
Any optional redemption of notes is subject to compliance with applicable regulatory requirements,including the prior approval of the RBI. The RBI, while considering the request of ICICI Bank to so redeem thenotes, may take into consideration, amongst other things, ICICI Bank’s CRAR position both at the time of theproposed redemption and thereafter.
Optional Tax Redemption
The notes may be redeemed at any time, but subject to approval by the Reserve Bank of India, at the optionof ICICI Bank, in whole, but not in part, upon not less than 30 but not more than 60 days prior notice to theholders of the notes, at a redemption price equal to the Base Redemption Price, if (i) as a result of any change in,or amendment to, the laws of a Taxing Jurisdiction or any regulations or rulings promulgated thereunder or anychange in the official interpretation or official application of such laws, regulations or rulings (and which changeor amendment, if India is the Taxing Jurisdiction must increase the rate of withholding above the current rate of20% (plus applicable surcharge and cess)), which change or amendment becomes announced on or after the dateof this offering memorandum (or, if the person formed by a consolidation, merger, conveyance or transfer orwhich is substituted as the issuer is not organized or resident in India for tax purposes, or if a branch which issubstituted as the issuer is subject to tax in a Taxing Jurisdiction other than India, on or after the date of suchconsolidation, merger, conveyance, transfer or substitution), ICICI Bank is or would be obligated on the nextsucceeding due date for a payment with respect to the notes to pay additional amounts with respect to the notesand (ii) such obligation cannot be avoided by ICICI Bank taking reasonable measures available to ICICI Bank,which may include changing the jurisdiction from which or through which payments are made. In the eventICICI Bank does not receive from the Reserve Bank of India the requested approval to redeem the notes inaccordance with this provision, ICICI Bank will seek regulatory approval (as may be required) to have theliability to pay the amounts due under the terms of the notes transferred to a substitute entity or branch (see“Description of the Notes— Substitution of Entity or Branch”), if, as a result of such transfer, ICICI Bank wouldavoid the obligation to pay such additional amounts. Prior to any redemption of the notes, the Indenture requiresthat ICICI Bank deliver to the trustee an opinion of tax counsel of recognized standing to the effect that suchchange or amendment has occurred, and an officer’s certificate stating that ICICI Bank is entitled to effect suchredemption and setting forth a statement of facts showing that the conditions precedent to the right of redemptionhave occurred. No notice of redemption may be given earlier than 90 days prior to the earliest date on whichICICI Bank would be obligated to pay additional amounts if a payment in respect of the notes were then due.
Redemption upon a Regulatory Event
Upon the occurrence of a Regulatory Event, and subject to the conditions set forth below, ICICI Bank, uponthe receipt of prior permission from the RBI, will have the right to redeem the notes in whole (and not in part) ata redemption price equal to (A) in the case of redemption prior to April 30, 2017, the higher of the BaseRedemption Price and the Make Whole Amount, or (B) in the case of a redemption on or after April 30, 2017,the Base Redemption Price.
“Regulatory Event” means the receipt by ICICI Bank of an opinion, declaration, rule or decree of the RBI orany other regulatory or governmental authority succeeding to the authority of the RBI as regards monitoring ofcapital adequacy of Indian banks, to the effect that there has been either (i) a change in the law or regulation or (ii) achange in the interpretation thereof, resulting in more than an insubstantial risk that the notes (or any portionthereof) will not be eligible to be included in calculating the Upper Tier II capital of ICICI Bank, other than as aresult of such notes exceeding the permitted basket for notes eligible for inclusion as Upper Tier II capital.
“Make Whole Amount” means an amount, as applied to any date of redemption of the notes as a result of aRegulatory Event, equal to the sum of (i) the present value of the outstanding principal amount of the notes,assuming a repayment thereof on the First Call Date, plus (ii) the present value of the remaining payments ofinterest scheduled to be paid to and including the First Call Date, in each case discounted from the relevantInterest Payment Date to the redemption date on the basis of a 360-day year consisting of 12 months of 30 days
172

each, and in the case of an incomplete month, the number of days elapsed, at the applicable Treasury Yield plusthe Applicable Spread.
For purposes of this foregoing definition, the applicable “Treasury Yield” shall be calculated as follows:
ICICI Bank will select a leading independent, international investment bank (an “Independent FinancialInstitution”), as approved in writing by the Trustee. The Independent Financial Institution, in consultation withICICI Bank, will appoint three or more other primary U.S. Government securities dealers in New York City(each a “Primary Treasury Dealer”) or their respective successors as reference dealers, provided, however, thatif any such dealer ceases to be a Primary Treasury Dealer, the Independent Financial Institution will (inconsultation with ICICI Bank) substitute such dealer with another Primary Treasury Dealer. The IndependentFinancial Institution will select a United States Treasury security having a maturity comparable to the time periodbetween the redemption date and the First Call Date (the “Make Whole End Date”), which would be used inaccordance with customary financial practice to price new issues of corporate debt securities with a maturitycomparable to the Make Whole End Date. The reference dealers will provide the Independent FinancialInstitution with the bid and asked prices for that comparable United States Treasury security as of 5:00 p.m. NewYork City time on the fifth Business Day before the redemption date. The Independent Financial Institution willcalculate the average of the bid and asked prices provided by each reference dealer to obtain such referencedealer’s quotation. The Independent Financial Institution will eliminate the highest and the lowest quotations andthen calculate the average of the remaining quotations; provided, however, that if the Independent FinancialInstitution obtains fewer than four quotations, it will calculate the average of all the quotations withouteliminating any of them. The average quotation is called the “comparable treasury price”. The applicableTreasury Yield will be determined by the Independent Financial Institution and will be the annual equivalentyield to maturity of a security whose price is equal to the comparable treasury price, in each case expressed as apercentage of its principal amount. The “Applicable Spread” shall mean 30 basis points if the notes areredeemed on or before April 30, 2017.
Any redemption of notes upon the occurrence of a Regulatory Event is subject to compliance withapplicable regulatory requirements, including the prior approval of the RBI.
Status and Subordination
Status and Subordination of the Notes
The notes are contractually subordinated to Senior Indebtedness of ICICI Bank. The payment obligations ofICICI Bank under the notes constitute unsecured subordinated obligations of ICICI Bank.
The claims of the holders of the notes for payment by ICICI Bank under the notes will rank:
(i) behind (junior to) the claims of holders of Senior Indebtedness;
(ii) pari passu with Other Pari Passu Claims; and
(iii) before (senior to) (x) the claims for payment of any obligation that, expressly or by applicable law,is subordinated to the notes, (y) the claims of holders of preference shares and Ordinary Shares of ICICIBank and (z) the claims of investors in instruments eligible for inclusion in Tier I capital of ICICI Bank.
The debt evidenced by the notes is subordinated in right of payment, to the extent and in the mannerprovided in the Indenture, to the prior payment of all existing and future Senior Indebtedness. The subordinationprovisions are for the benefit of and enforceable by the holders of Senior Indebtedness of ICICI Bank.
“Senior Indebtedness” means all deposits and other senior liabilities of ICICI Bank (including those inrespect of bonds, notes and debentures) and debt instruments constituting “lower Tier II” capital of ICICI Bankfrom time to time, other than liabilities of ICICI Bank under the notes. For the avoidance of doubt, SeniorIndebtedness shall not include any other debt securities of ICICI Bank which qualify for Upper Tier II treatmentunder the RBI guidelines.
173

Interest and Principal Payments
The Indenture will require that payments of interest and principal in respect of the notes evidenced by theGlobal notes shall be made by ICICI Bank directly or through any paying agent by wire transfer of immediatelyavailable funds to the account specified by the holder of the relevant Global Note.
Without prejudice to the foregoing, all amounts due on the notes will be subject to any fiscal or other lawsand regulations in the place of payment.
Consolidation, Merger or Sale of Assets
ICICI Bank will not, without the consent of holders holding no less than 662⁄3% in aggregate principalamount of the notes outstanding, consolidate with or merge with or into any person, or convey or transfersubstantially all of its properties and assets to any other person unless thereafter:
(i) the person formed by such consolidation or into which ICICI Bank is merged, or the person whichacquires all or substantially all of ICICI Bank’s properties and assets, expressly assumes the due andpunctual payment of the principal of and interest on all the notes and the performance or observance ofevery covenant of the indenture on ICICI Bank’s part to be performed or observed (including, if such personis not organized in or a resident of India for tax purposes, substituting such person’s jurisdiction oforganization or residence for tax purposes for India, including for the obligation to pay AdditionalAmounts);
(ii) immediately after giving effect to such transaction, no Default (as defined below) has occurred andis continuing; and
(iii) the person formed by such consolidation or into which ICICI Bank is merged, or the person whichacquires all or substantially all of ICICI Bank’s properties and assets delivers to the Trustee an officers’certificate and an opinion of counsel, each stating that the consolidation, merger, conveyance or transferand, if a supplemental indenture is required in connection with the transaction, the supplemental indenturecomply with the indenture and that all conditions precedent in the indenture relating to the transaction havebeen complied with, except that such certificate and opinion shall not be required in the event any suchconsolidation, merger, conveyance or transfer is made by order of any court or tribunal having jurisdictionover ICICI Bank, ICICI Bank’s assets or properties.
Defaults; Limitation of Remedies
A “Default” occurs if ICICI Bank fails to pay the full amount of principal or interest (including anyAdditional Amounts, Interest Arrears and Additional Interest in respect thereof) due on the notes on any InterestPayment Date, the First Call Date or the Maturity Date, as the case may be, and such failure continues for aperiod of 14 days. For the avoidance of doubt, any such non-payment of principal or interest shall not constitute aDefault if (i) a Trigger Event has occurred and is continuing at such time as the payment first becomes due, and(ii) a Payment Suspension Notice has been sent to the Trustee in accordance with “Interest”.
Consequences of a Default
If a Default occurs and is continuing under the Indenture, the Trustee or the holders of at least 25% inaggregate in principal amount of all the notes, by written notice to ICICI Bank (and to the Trustee if the notice isgiven by the holders), may, and the Trustee at the request of such holders shall, subject to it receiving anindemnity satisfactory to it from the holders, institute proceedings to obtain the payment of the amounts due orcompliance with the defaulted covenant or agreement or to obtain the bankruptcy of ICICI Bank (or anyanalogous proceeding which may be available from time to time under the laws of the jurisdiction concerned).
The holders of a majority in aggregate in principal amount of all the notes may direct the time, method andplace of conducting any proceeding for any remedy available to the Trustee or exercising any trust or powerconferred on the Trustee, subject to the limitations specified in the Indenture. However, the Trustee may refuse tofollow any direction that conflicts with law or the Indenture, that may involve the Trustee in personal liability, or
174
that the Trustee determines in good faith may be unduly prejudicial to the rights of holders of notes not joining inthe giving of such direction, and may take any other action it deems proper that is not inconsistent with any suchdirection received from holders of notes.
A holder may not institute any proceeding, judicial or otherwise, with respect to the Indenture or the notes,or for the appointment of a receiver or trustee, or for any other remedy under the Indenture or the notes, unless:
(i) the holder has previously given to the Trustee written notice of a continuing Default;
(ii) holders of at least 25% in aggregate in principal amount of all the notes have made a written request tothe Trustee to institute proceedings in respect of the Default in its own name as Trustee under the Indenture;
(iii) holders have offered to the Trustee indemnity reasonably satisfactory to the Trustee against anycosts, losses, liabilities or expenses that may be incurred in compliance with such request;
(iv) the Trustee for 60 days after its receipt of such notice, request and offer of indemnity has failed toinstitute any such proceeding; and
(v) during such 60-day period, the holders of a majority in aggregate in principal amount of all the notesof the outstanding notes have not given the Trustee a direction that is inconsistent with such written request;
it being understood and intended that no one or more holders shall have any right in any manner whatever byvirtue of, or by availing of, any provision of the Indenture to affect, disturb or prejudice the rights of any otherholders, or to obtain or to seek to obtain priority or preference over any other holders or to enforce any rightunder the Indenture, except in the manner herein provided and for the equal and ratable benefit of all the holders.
If any Default occurs and is continuing and is known to the Trustee, the Trustee will send notice of theDefault to each holder within 90 days after it occurs, unless the Default has been cured.
Meeting of Holders, Amendments and Waivers
Amendments without Consent of Holders
ICICI Bank and the Trustee may amend or supplement the Indenture or the notes without notice to or theconsent of any holder of notes:
(i) to cure any ambiguity, to correct or supplement any provision of the Indenture which may beinconsistent with any other provision therein, or to make any other provisions with respect to matters orquestions arising under the Indenture which shall not be inconsistent with the provisions of the Indenture;
(ii) to comply with the provisions relating to consolidation, merger and sale of assets in the Indenture;
(iii) to evidence and provide for the acceptance of appointment by a successor trustee; or
(iv) to make any other change that shall not adversely affect the interests of the holders in any materialrespect.
Amendments with Consent of Holders
Except as otherwise provided in “Amendments without Consent of Holders” or the following paragraph,ICICI Bank and the Trustee may amend or supplement the Indenture and the notes with the written consent of theholders of a majority of principal amount of all the notes then outstanding and the holders of a majority ofprincipal amount of all the notes then outstanding may waive future compliance by ICICI Bank with anyprovision of the Indenture or the notes.
Without the consent of each holder of notes affected, an amendment, supplement or waiver may not
(i) reduce the principal amount of any Note,
(ii) change the time of payment of any principal or interest or reduce the rate of any interest paymenton any Note,
(iii) reduce the amount payable upon the redemption of any Note or change the times at which anyNote may be redeemed or, once notice of redemption has been given, the time at which it must thereupon beredeemed,
175

(iv) change the obligation of ICICI Bank (or its successor) to pay Additional Amounts, Interest Arrears,Additional Interest and interest, if any,
(v) make any Note payable in money other than that stated in the Note,
(vi) impair the right of any holder of notes to receive any principal payment or interest payment onsuch holder’s notes, on or after the applicable Interest Date thereof, or to institute suit for the enforcement ofany such payment,
(vii) make any change in the percentage of the aggregate principal amount of the notes required foramendments or waivers, or
(viii) modify or change any provision of the Indenture affecting the ranking of the notes in a manneradverse to the holders of the notes.
Neither ICICI Bank nor any of its subsidiaries or affiliates may, directly or indirectly, pay or cause to bepaid any consideration, whether by way of interest, fee or otherwise, to any holder of notes for or as aninducement to any consent, waiver or amendment of any of the terms or provisions of the Indenture or the notesunless such consideration is offered to be paid or agreed to be paid to all holders of the notes that consent, waiveor agree to amend such term or provision within the time period set forth in the solicitation documents relating tothe consent, waiver or amendment.
Concerning the Trustee
The Bank of New York is the Trustee under the Indenture.
Except during the continuance of a Default, the Trustee need perform only those duties that are specificallyset forth in the Indenture and no others, and no implied covenants or obligations will be read into the Indentureagainst the Trustee. In case a Default has occurred and is continuing, the Trustee shall exercise those rights andpowers vested in it by the Indenture, and use the same degree of care and skill in their exercise, as a prudentperson would exercise or use under the circumstances in the conduct of his or her own affairs. No provision ofthe Indenture will require the Trustee to expend or risk its own funds or otherwise incur any financial liability inthe performance of its duties thereunder, or in the exercise of its rights or powers, unless it receives indemnitysatisfactory to it against any loss, liability or expense.
ICICI Bank and its affiliates may from time to time enter into normal banking and trustee relationships withthe Trustee and its affiliates in the ordinary course of business.
The Trustee and its affiliates may hold notes in their own names, subject to the conditions hereof.
Reports to Trustee
ICICI Bank will deliver to the Trustee as soon as possible and in any event within 30 days after ICICI Bankbecomes aware or should reasonably become aware of the occurrence of a Default or an event which, with noticeor the lapse of time or both, would constitute a Default, an Officer’s Certificate setting forth the details of suchDefault, and the action which ICICI Bank proposes to take with respect thereto.
Listing and Trading
Approval-in-principle has been obtained for listing of the notes on the Singapore Exchange. The approval-in-principle for the listing, and the admission to the Official List of the Singapore Exchange, of the notes is not tobe taken as an indication of any of the merits of ICICI Bank or the merits of the notes. The notes will be tradedon the Singapore Exchange in a minimum board lot size of US$ 200,000 for so long as the notes are listed on theSingapore Exchange.
Substitution of Entity or Branch
ICICI Bank may at any time, subject to any regulatory approvals as may be required, elect to have theliability to pay the amounts due under the terms of the notes transferred, in whole or in part, to an entity
176

controlled by ICICI Bank or a branch of ICICI Bank other than the Issuer. Any such transfer to an entity mightbe deemed for U.S. federal income tax purposes to be an exchange of the notes for new notes by the holdersthereof, resulting in the recognition of taxable gain or loss for such purposes and possibly certain other adversetax consequences.
Notices
Where the Indenture requires notice to the holders of the notes, such notice will be given by the Trustee by(unless the Indenture specifies otherwise):
• first class mail, postage prepaid, to the address of each holder of the notes as it appears in the notesregister;
• publication in English on a business day in a leading newspaper having general circulation in theBorough of Manhattan, The City of New York; and
• so long as the notes are listed on the Singapore Exchange and the rules of that exchange so require,publication in English in a leading newspaper of general circulation in Singapore (which is expected tobe the Straits Times) or, if that is not practicable, in another English-language daily newspaper ofgeneral circulation in Singapore.
Notice will be deemed to have been validly given on the date of mailing or first publication in all therequired newspapers, as the case may be. If the publication as provided above is not practicable, notice will begiven in such other manner, and shall be deemed to have been given on such date, as the Trustee may approve.
Paying Agent; Registrar; Calculation Agent
The initial Paying Agent and Registrar for the notes will be The Bank of New York, which is located at 101Barclay Street, Floor 21 West, New York, New York 10286, U.S.A. The initial Calculation Agent for the noteswill be The Bank of New York, London Branch, 48th Floor, One Canada Square, London E14 5AL, UnitedKingdom. ICICI Bank reserves the right at any time to vary or terminate the appointment of the Paying Agent,the Registrar or the Calculation Agent and/or to appoint another Paying Agent, Registrar or Calculation Agent.
ICICI Bank has undertaken to the Singapore Exchange that if the Global notes are exchanged for notes incertificated form, unless it obtains an exemption from the Singapore Exchange, it shall (so long as the notes arelisted on the Singapore Exchange) (a) appoint a paying agent in Singapore and (b) promptly make anannouncement to the Singapore Exchange and include in such announcement all material information in relationto such exchange and details of the Singapore paying agent.
Governing Law
The Indenture, the notes and the Calculation Agency Agreement will be governed by the laws of the State ofNew York, except that the subordination provisions of the Indenture and the notes will be governed by the lawsof India.
Consent to Service
The Indenture provides that ICICI Bank appoints its New York Representative Office at 500 Fifth Avenue,Suite 2830, New York, New York 10110, U.S.A., as it agent to receive on its behalf service of copies of thesummons and complaints and any other process which may be served in any suit, action or proceeding arising outof or relating to the Indenture, the Calculation Agency Agreement, the notes or the transactions contemplatedtherein brought in such New York state or federal court sitting in the City of New York.
Prescription
Under New York law, claims relating to payment of principal and interest on the notes will be prescribedaccording to the later of the applicable statute of limitations or not less than ten years (in the case of principal)and five years (in the case of interest).
177

FORM, DENOMINATION AND TRANSFER
Book-Entry; Delivery and Form
The notes will be issued in registered form without interest coupons. No notes will be issued in bearer form.
Notes of each tranche offered and sold to qualified institutional buyers in reliance on Rule 144A under theSecurities Act, or “restricted notes,” will be issued in minimum denominations of US$ 100,000 and integralmultiples of US$ 1,000 in excess thereof. The restricted notes will initially be represented by one or morepermanent global notes in definitive, fully registered book-entry form that will be registered in the name of DTCor its nominee and deposited with the trustee, as custodian for DTC, for credit to the accounts of direct or indirectparticipants in DTC as described below. We refer to these global notes collectively as the “Restricted GlobalNotes.”
Notes of each tranche offered and sold in reliance on Regulation S, or “Regulation S Notes,” will be issuedin minimum denominations of US$ 100,000 and integral multiples of US$ 1,000 in excess thereof. TheRegulation S notes of each tranche will initially be represented by a single permanent global note for suchtranche in definitive, fully registered book-entry form that will be registered in the name of DTC or its nomineeand deposited with the trustee, as custodian for DTC, for credit to the accounts of direct or indirect participants inDTC as described below. We refer to these global notes as the “Regulation S Global Notes” and to the RestrictedGlobal notes and the Regulation S Global notes collectively as the “global notes.”
Through and including the 40th day after the later of the commencement of this offering and the closing ofthis offering (such period through and including such 40th day, the “distribution compliance period”), beneficialinterests in the Regulation S Global notes may be held only through Euroclear and Clearstream, Luxembourg (asindirect participants in DTC), unless transferred to a person that takes delivery through a Rule 144A Global Notein accordance with the certification requirements described below. Beneficial interests in the Rule 144A Globalnotes may not be exchanged for beneficial interests in the Regulation S Global notes at any time except in thelimited circumstances described below. See “—Exchanges and Transfers Between Regulation S notes and Rule144A notes and Other notes.”
Owners of beneficial interests in a global note will be entitled to receive physical delivery of certificatednotes only in the circumstances described under “—Exchange of Book-Entry Notes for Certificated Notes”below.
Transfer of Notes
Each note will be subject to certain restrictions on transfer set forth therein as described under“—Exchanges and Transfers Between Regulation S notes and Rule 144A notes and Other notes” and “TransferRestrictions.” In addition, transfers of beneficial interests in the global notes will be subject to the applicablerules and procedures of DTC, Euroclear and Clearstream, Luxembourg, as the case may be, which may change atany time.
If we issue notes of any tranche in certificated form, those notes may be transferred or exchanged in wholeor in part only in authorized denominations upon surrender of the note to be transferred or exchanged, togetherwith a duly executed instrument of transfer or exchange in form satisfactory to us and the trustee, as noteregistrar, or any transfer agent, at the specified office of the note registrar or of any transfer agent. So long as anytranche of notes are listed on the Singapore Exchange and the rules of that exchange so require, we will maintaina transfer agent in Singapore. Each time that we transfer or exchange a note of any tranche for a note incertificated form, and after the note registrar or transfer agent receives the instrument of transfer or exchange andall other required documents, we will make available for delivery the new certificated note of such tranche at theoffice of the note registrar or the applicable transfer agent. Alternatively, at the option of the person requestingthe transfer or exchange, we will mail, at that person’s risk, the new certificated note of such tranche to theaddress of the person specified in the instrument of transfer.
178

No service charge will be required for any registration of transfer or exchange of the notes, but the noteregistrar may require payment of a sum sufficient to cover any tax or other governmental charge in connectiontherewith, other than any such tax or governmental charge payable in connection with an exchange described inthe first paragraph under “—Exchange of Book-Entry notes for Certificated notes” not involving any transfer.
Depository Procedures
The description of the clearing systems in this section reflects our understanding of the rules and proceduresof DTC, Euroclear and Clearstream, Luxembourg as they are currently in effect. DTC, Euroclear andClearstream, Luxembourg and their participants perform these clearance and settlement functions underagreements they have made with one another or with their customers. You should be aware that they are notobligated to you to perform or continue to perform these procedures and may modify them or discontinue them atany time.
The Depository Trust Company
Book-entry interests in the Restricted Global notes will be shown on, and transfers of these interests will bemade only through, records maintained by DTC and its participants. DTC has provided us with the followinginformation: DTC is a limited-purpose trust company organized under the New York Banking Law, a “bankingorganization” within the meaning of the New York Uniform Commercial Code and a “clearing agency”registered under the provisions of Section 17A of the Exchange Act. DTC holds securities that its directparticipants deposit with DTC. DTC also records the settlements among direct participants of securitiestransactions, such as transfers and pledges, in deposited securities through computerized records for directparticipants’ accounts. This eliminates the need to exchange certificated securities. Direct participants includesecurities brokers and dealers, banks, trust companies, clearing corporations and certain other organizations.
DTC’s book-entry system is also used by other organizations such as securities brokers and dealers, banksand trust companies that work through a direct participant. The rules that apply to DTC and its participants are onfile with the SEC.
DTC is owned by a number of its direct participants and by The New York Stock Exchange, Inc., theAmerican Stock Exchange, LLC. and the National Association of Securities Dealers, Inc.
DTC will keep a computerized record of its participants whose clients have purchased interests in theRestricted Global Note of any tranche. Each participant will then keep a record of its clients. Unless theRestricted Global Note of such tranche is exchanged in whole or in part for a certified note or notes or for aninterest in the Regulation S Global Note of such tranche, such Restricted Global Note may not be transferred.DTC, its nominees and their successors may, however, transfer such Restricted Global Note in whole to oneanother.
When you purchase interests in the Restricted Global notes of a tranche through the DTC system, thepurchases must be made by or through a direct participant, which will receive for the interests on DTC’s records.When you purchase interests in the notes of such tranche, you will become their beneficial owner. Yourownership interest will be recorded only on the direct or indirect participants’ records. DTC will have noknowledge of your individual ownership of interest. DTC’s records will show only the identity of the directparticipants and the amount of the notes held by or through them. You will not receive a written confirmation ofyour purchase or sale or any periodic account statement directly from DTC. You should instead receive thesefrom your direct or indirect participant. As a result, the direct or indirect participants are responsible for keepingaccurate account of the holdings of their customers. The trustee will wire payments of principal and interest onthe notes to DTC or its nominee. We and the trustee will treat DTC or its nominee as the owner of the RestrictedGlobal notes representing the restricted notes of a tranche for all purposes. Accordingly, we, the trustee and theapplicable paying agent will have no direct responsibility or liability to pay amounts due on the Restricted Global
179

notes representing the notes to you or any other beneficial owners in the Restricted Global notes. Any redemptionnotices will be sent by us or the trustee to DTC, which will, in turn, inform the direct participants (or the indirectparticipants), which will then contact you as a beneficial holder.
It is DTC’s current practice, upon receipt of any payment of principal or interest, to proportionately creditdirect participants’ accounts on the payment date based on their holdings. In addition, it is DTC’s current practiceto pass through any consenting or voting rights to such participants by using an omnibus proxy. Thoseparticipants will, in turn, make payments to and solicit votes from you, the ultimate beneficial owner of the notes,based on their customary practices. Payments to you will be the responsibility of the participants and not of DTC,the trustee or our company.
Euroclear and Clearstream, Luxembourg
Euroclear and Clearstream, Luxembourg will record the ownership interests of their participants in much thesame way as DTC.
Clearstream, Luxembourg advises that it is incorporated under the laws of Luxembourg as a bank.Clearstream, Luxembourg will facilitate the clearance and settlement of securities transactions between itscustomers through electronic book-entry transfers between their accounts. Clearstream, Luxembourg will provideto its customers, among other things, services for safekeeping, administration, clearance and settlement ofinternationally traded securities and securities lending and borrowing. Clearstream, Luxembourg will interfacewith domestic securities markets in over 30 countries through established depository and custodial relationships.As a bank, Clearstream, Luxembourg is subject to regulation by the Luxembourg Commission for theSupervision of the Financial Sector, also known as the Commission de Surveillance du Secteur Financier and theLuxembourg Central Bank. Customers of Clearstream, Luxembourg are recognized financial institutions aroundthe world, including underwriters, securities brokers and dealers, banks, trust companies, clearing corporationsand certain other organizations. US customers of Clearstream, Luxembourg are limited to securities brokers anddealers and banks. Indirect access to Clearstream, Luxembourg is also available to other institutions such asbanks, brokers, dealers and trust companies that clear through or maintain a custodial relationship with aClearstream, Luxembourg customer.
Euroclear advises that it was created in 1968 and that it will clear and settle transactions between Euroclearparticipants through simultaneous electronic book-entry delivery against payment, thereby eliminating the needfor physical movement of certificates and any risk from lack of simultaneous transfers of securities and cash.Euroclear will provide various other services, including securities lending and borrowing and interfacing withdomestic markets in several countries. Euroclear is operated by Euroclear Bank S.A./N.V., which we refer to asthe “Euroclear Operator,” under contract with Euroclear Clearance Systems, S.C., a Belgian cooperativecorporation, which we refer to as the “Cooperative.” All operations are conducted by the Euroclear Operator, andall Euroclear securities clearance accounts and Euroclear cash accounts are accounts with the Euroclear Operator,not the Cooperative. The Cooperative establishes policy for Euroclear on behalf of Euroclear participants.Euroclear participants include banks, including central banks, securities brokers and dealers and otherprofessional financial intermediaries and may include the Initial Purchasers. Indirect access to Euroclear is alsoavailable to other firms that clear through or maintain a custodial relationship with a Euroclear participant, eitherdirectly or indirectly.
We have no responsibility for any aspect of the actions or the records kept by DTC, Euroclear orClearstream, Luxembourg, or any of their direct or indirect participants. We also do not supervise these systemsin any way and urge investors to contact the system of their participants directly to discuss these matters.
Holding of the Notes through DTC, Euroclear and Clearstream, Luxembourg
Investors in the Restricted Global Note of a tranche may hold their interests therein directly through DTC, ifthey are direct participants in such system, or through direct or indirect participants in such system. Investors in
180

the Regulation S Global Note of a tranche will hold their interests therein through Euroclear or Clearstream,Luxembourg if they are accountholders in such systems, or indirectly through organizations that areaccountholders in such systems. All interests in a global note may be subject to the procedures and requirementsof DTC, Euroclear or Clearstream.
The laws of some states require that certain persons take physical delivery in definitive form of securitiesthat they own. Consequently, the ability to transfer beneficial interests in a global note to such persons may belimited to that extent. Because DTC can act only on behalf of the participants, which in turn act on behalf of theindirect participants and certain banks, the ability of a person having beneficial interests in the Restricted GlobalNote to pledge those interests to persons or entities that do not participate in the DTC system, or otherwise takeactions in respect of those interests, may be affected by the lack of a physical certificate evidencing thoseinterests.
Transfers between participants in DTC will be effected in the ordinary way in accordance with DTC rulesand will be settled in same-day funds. Transfers between participants in Euroclear and Clearstream, Luxembourgwill be effected in the ordinary way in accordance with their respective rules and operating procedures.
On or after the Closing Date, transfers of notes between accountholders in Euroclear and Clearstream,Luxembourg and transfers of notes between participants in DTC will generally have a settlement day threebusiness days after the trade date (T+3). The customary arrangements for delivery versus payment will apply tosuch transfers.
Cross-market transfers between accountholders in Euroclear or Clearstream, Luxembourg and DTCparticipants will be effected in accordance with their respective rules and will need to have an agreed settlementdate between the parties to such transfer. Because there is no direct link between DTC, on the one hand, andEuroclear and Clearstream, Luxembourg, on the other, transfers of interests in the relevant global note will beeffected through the paying agent, the custodian and the note registrar receiving instructions (and, whereappropriate, certification) from the transferor and arranging for delivery of the interest being transferred to thecredit of the designated account for the transferee. Transfers will be effected on the later of (i) three businessdays after the trade date for the disposal if the interest in the relevant global note resulting in such transfer and(ii) two business days after receipt by the paying Agent or the note registrar, as the case may be, of the necessarycertification or information to effect such transfer. In the case of cross-market transfers, settlement betweenEuroclear and Clearstream, Luxembourg accountholders and DTC participants cannot be made on deliveryversus payment basis. The notes will be delivered on a free delivery basis and arrangements for payment must bemade separately.
We expect that DTC, Euroclear and Clearstream, Luxembourg will take any action permitted to be taken bya holder of notes (including the presentation of notes for exchange) only at the direction of the participants towhose accounts interest in the applicable global notes are credited and only in respect of the aggregate principalamount of notes as to which such participant has given such direction. However, if any of the events described inthe first two paragraphs of “Exchange of Book-Entry Notes for Certificated Notes” occurs, DTC, Euroclear andClearstream, Luxembourg reserve the right to exchange the applicable global note for definitive notes incertificated form and to distribute those notes to participants with the legends set forth under “TransferRestrictions”.
The information in this section concerning DTC, Euroclear and Clearstream, Luxembourg and their bookentry systems has been obtained from sources that we believe to be reliable, but we take no responsibility for theaccuracy thereof.
181
Exchange of Book-Entry Notes for Certificated Notes
The Restricted Global Note of any tranche is exchangeable for definitive notes of such tranche in registeredcertificated form if:
• we advise the trustee in writing that (1) DTC is unwilling or unable to continue as depository for theglobal notes of such tranche or (2) DTC has ceased to be a clearing agency registered under theExchange Act and, in either case, we are unable to appoint a qualified successor within 90 days afternotice from DTC or, if applicable, after we become aware that DTC has ceased to be a registeredclearing agency,
• we, at our option, elect to cause the issuance of the notes of such tranche in certificated form, or
• after the occurrence and during the continuation of a default or an event of default with respect to thenotes of such tranche, DTC or beneficial owners holding interests representing an aggregate principalamount of more than 50% of the notes of such tranche represented by the Restricted Global Note soadvise the trustee in writing.
The Regulation S Global Note of any tranche is exchangeable for definitive notes of such tranche inregistered certificated form if:
• we advise the trustee in writing that Euroclear or Clearstream, Luxembourg is closed for business for acontinuous period of 14 days (other than by reason of legal holidays) or has announced an intentionpermanently to cease business, or
• after the occurrence and during the continuation of a default or an event of default with respect to suchtranche of notes, Euroclear or Clearstream, Luxembourg or beneficial owners holding interestsrepresenting an aggregate principal amount of notes of such tranche of more than 50% of the notesrepresented by the Regulation S Global Note so advise the trustee in writing; provided, that in no eventshall the Regulation S Global Note of such tranche be exchanged for notes of such tranche in definitiveform prior to the expiration of the distribution compliance period.
After the expiration of the distribution compliance period, any noteholder may exchange its beneficialinterests in global notes of any tranche in whole or in part for certificated notes of such tranche of like principalamount in authorized denominations registered in the name of that noteholder, or may transfer beneficial interestsin global notes of such tranche to a person that wishes to take delivery thereof in the form of certificated notes ofsuch tranche registered in the name of that person. In order to effect such an exchange or transfer for certificatednotes of any tranche, a noteholder must cause prior written notice to be sent to the trustee by or on behalf ofDTC, Euroclear and Clearstream, Luxembourg and, if any global note of such tranche is being exchanged ortransferred in whole, must cause such global note to be surrendered to the office or agency, we must maintain forthat purpose in accordance with the indenture.
In all the above cases, certificated notes delivered in exchange for any global note or beneficial intereststherein will be registered in the names, and issued in any approved denominations, requested by or on behalf ofDTC, Euroclear, Clearstream, Luxembourg (in accordance with their customary procedures) and will bear, in thecase of the Restricted Global Note, the restrictive legend described in “Transfer Restrictions” unless wedetermine otherwise in compliance with applicable law.
Exchanges and Transfers Between Regulation S Notes and Rule 144A Notes and Other Notes
Prior to the expiration of the distribution compliance period, a beneficial interest in the Regulation S GlobalNote of any tranche may be transferred to a person who takes delivery in the form of an interest in thecorresponding Restricted Global Note only upon receipt by the note registrar of a written certification from thetransferor to the effect that such transfer is being made (1)(a) to a person whom the transferor reasonably believesis a qualified institutional buyer in a transaction meeting the requirements of Rule 144A, (b) in accordance with
182

Rule 144 under the Securities Act (if available) or (c) pursuant to another exemption from the registrationrequirements under the Securities Act, accompanied by an opinion of counsel regarding the availability of suchexemption, and (2) in accordance with all applicable securities laws of the states of the United States or otherjurisdictions. We refer to such a certificate as a “restricted notes certificate.”
Beneficial interests in the Restricted Global Note of any tranche may be transferred to a person who takesdelivery in the form of an interest in the relevant Regulation S Global Note, whether before or after the expirationof the distribution compliance period, only if the transferor first delivers to the note registrar a written certificateto the effect that (1) such transfer is being made in accordance with Rule 903 or 904 of Regulation S or Rule 144under the Securities Act (if available), (2) such transfer is being made in accordance with all applicable securitieslaws of the states of the United States and other jurisdictions and (3) if such transfer occurs prior to the expirationof the distribution compliance period, the interest transferred will be held immediately thereafter throughEuroclear or Clearstream, Luxembourg. We refer to such a certificate as a “Regulation S certificate.”
Any beneficial interest in one of the global notes that is transferred to a person who takes delivery in theform of an interest in another global note will, upon transfer, cease to be an interest in that global note andbecome an interest in the other global note and, accordingly, will thereafter be subject to all transfer restrictionsand other procedures applicable to beneficial interests in that other global note.
In addition, restricted notes that are held in certificated form may be transferred to a person who takesdelivery in the form of an interest in the Restricted Global Note of any tranche only if the transferor first deliversto the note registrar a restricted notes certificate. Restricted notes that are held in certificated form may betransferred to a person who takes delivery in the form of an interest in the Regulation S Global Note of anytranche only if the transferor first delivers to the note registrar a Regulation S certificate.
A note may be transferred to a person who takes delivery in the form of an interest in a restricted note incertificated form only if the transferor first delivers to the note registrar a restricted notes certificate.
In connection with a transfer of beneficial interests in one global note for beneficial interests in anotherglobal note, of notes in certificated form for beneficial interests in a global note or of beneficial interests in aglobal note for notes in certificated form, DTC, Euroclear or Clearstream, Luxembourg or the note registrar mayrequire that the transferor deliver a written order in accordance with the applicable rules and procedures of DTC,Euroclear or Clearstream, Luxembourg containing information regarding the participant’s account to be creditedwith a beneficial interest in the applicable global note and/or the participant’s account to be debited in an amountequal to the beneficial interest in the global note being transferred, as the case may be.
Upon the transfer, exchange or replacement of certificated notes bearing a restrictive legend described in“Transfer Restrictions,” or upon specific request for removal of the legend on a certificated note, we will deliveronly notes that bear that legend, or will refuse to remove that legend, as the case may be, unless (1) such notesare otherwise sold under an effective registration statement under the Securities Act, (2) those notes are issuedupon transfer or exchange of Regulation S notes after the expiration of the distribution compliance period, or(3) there is delivered to us such satisfactory evidence as we may reasonably require, which may include anopinion of counsel, that neither the legend nor the restrictions on transfer set forth therein are required to ensurecompliance with the provisions of the Securities Act.
183

TAXATION
The information provided below does not purport to be a comprehensive description of all taxconsiderations that may be relevant to a decision to purchase notes. In particular, the information does notconsider any specific facts or circumstances that may apply to a particular purchaser. Neither these statementsnor any other statements in this offering memorandum are to be regarded as advice on the tax position of anyholder of notes or of any person acquiring, selling or otherwise dealing in securities or on any tax implicationsarising from the acquisition, sale or other dealings in notes. The statements do not purport to be acomprehensive description of all the tax considerations that may be relevant to a decision to purchase, own ordispose of notes and do not purport to deal with the tax consequences applicable to all categories of investors,some of which (such as dealers in notes) may be subject to special rules.
Prospective purchasers of notes are advised to consult their own tax advisors as to the taxconsequences of the purchase, ownership and disposition of notes, including the effect of any state or localtaxes, under the tax laws of India, the United States and each country of which they are residents orcountries of purchase, holding or disposition of notes. Additionally, in view of the number of differentjurisdictions where local laws may apply, this offering memorandum does not discuss the local taxconsequences to a potential holder, purchaser or seller arising from the acquisitions, holding or dispositionof the notes, other than in respect of certain US tax consequences discussed below. Prospective investorsmust, therefore, inform themselves as to any tax, exchange control legislation or other laws andregulations in force relating to the subscription, holding or disposition of the notes at their place ofresidence and in the countries of which they are citizens or countries of purchase, holding or disposition ofnotes.
Indian Taxation
The following is a summary of the principal Indian tax consequences to non-resident investors of India, orNon-resident Investors, of purchasing notes issued by us. The summary is based on Indian taxation law andpractice in force at the date of this offering memorandum and is subject to change, possibly with retroactiveeffect. The summary does not constitute legal or tax advice and is not intended to represent a complete analysisof the tax consequences under Indian law of the acquisition, ownership or disposition of notes. Prospectiveinvestors should, therefore, consult their own tax advisors regarding the Indian tax consequences, as well as thetax consequences under any other applicable taxing jurisdiction, of acquiring, owning and disposing of notes.
Payments through Offshore Branches
There is currently no requirement to withhold Indian tax on interest payments made on the notes by ouroffshore branches, if the amounts raised through these notes are utilized outside India. If and to the extent theamounts so raise are utilized in India, Indian tax consequences would be applicable as detailed under theparagraph “Withholding Taxes” and “Taxation of Interest” which are set forth below.
Payments through India
Any payments we make on the notes, including additional amounts, would be subject to the regulations ofthe Reserve Bank of India.
Withholding taxes
There will be a requirement to withhold tax at the rate of 20% (plus applicable surcharge and educationcess) on interest payments made on the notes subject to and in accordance with the conditions contained in theIncome Tax Act, 1961. However, an applicable Tax Treaty may reduce such withholding tax liability to ratesranging from 10% to 15% (depending on the Tax Treaty), subject to fulfillment of the conditions prescribedtherein. To illustrate, the Tax Treaty with the United States provides for a reduced withholding tax rate of 15%,subject to fulfillment of the conditions prescribed therein.
We will be obligated to pay additional amounts in certain circumstances. Please see “Description of theNotes—Additional Amounts.”
184

Taxation of interest
A Non-resident Investor may be liable to pay income tax at a rate of 20% (plus applicable surcharge andeducation cess) on interest paid on the notes subject to and in accordance with the conditions contained in theIncome Tax Act, 1961. However, an applicable Tax Treaty may reduce such tax liability to rates ranging from10% to 15% (depending on the Tax Treaty), subject to fulfillment of the conditions prescribed therein. ANon-resident Investor would be obligated to pay such income tax in an amount equal to, or would be entitled to arefund of, as the case may be, any difference between amounts withheld in respect of interest paid on the notesand its ultimate Indian tax liability for such interest, subject to and in accordance with the provisions of theIncome Tax Act, 1961. To illustrate, the Tax Treaty with the United States provides for a reduced withholdingtax rate of 15%, subject to fulfillment of the conditions prescribed therein.
Taxation of gains arising on disposition
Any gains arising to a Non-resident Investor from disposition of notes held as a capital asset will generallybe chargeable to income tax in India if the notes are regarded as property situated in India. A Non-residentInvestor generally will not be chargeable to income tax in India from a disposition of notes held as a capital assetprovided the notes are regarded as being situated outside India. There is a possibility that the Indian taxauthorities may treat the notes as being located in India as we are incorporated in and resident in India.
If the notes are regarded as situated in India, upon disposition of a note:
(i) a Non-resident Investor, who has held the notes for a period of more than 36 months preceding the dateof their disposition, would be liable to pay capital gains tax at rates ranging from 0% to 20% (plus applicablesurcharge and education cess) subject to and in accordance with the provisions of the Income Tax Act, 1961;
(ii) a Non-resident Investor who has held the notes for 36 months or less would be liable to pay capitalgains tax at rates ranging from 0% to 40% (plus applicable surcharge and education cess), depending on thelegal status of the Non-resident Investor, and his taxable income in India, subject to any lower rate providedfor by an applicable Tax Treaty; and
(iii) any surplus realized by a Non-resident Investor from a disposition of notes held as stock-in-tradewould be subject to income tax in India to the extent, if any, that the surplus is attributable to a “businessconnection in India” or, where a Tax Treaty applies, to a “permanent establishment” in India of theNon-resident Investor. A Non-resident Investor would be liable to pay Indian tax on the gains which are soattributable at a rate of tax ranging from 0% to 40% (plus applicable surcharge and education cess),depending on the legal status of the Non-resident Investor and his taxable income in India, subject to anylower rate provided for by a Tax Treaty.
The Tax Treaty between the United States and India does not provide U.S. holders with any relief fromIndian tax on gains.
Non-resident Investors should consult their own tax advisors regarding the Indian tax consequences ofdisposing of notes.
Wealth Tax
No wealth tax is payable at present in relation to the notes in India.
Estate Duty
No estate duty is payable at present in relation to the notes in India.
Gift Tax
No gift tax is payable at present in India.
185

Stamp Duty
A transfer of notes outside India will not give rise to any Indian stamp duty liability unless brought intoIndia. Stamp duty would also be payable if notes are brought into India for enforcement or for any other purpose.
United States Taxation
This disclosure is limited to the US federal tax issues addressed herein. Additional issues may existthat are not addressed in this disclosure and that could affect the US federal tax treatment of the notes.This tax disclosure was written in connection with the promotion or marketing of the notes by ICICIBank, and it cannot be used by any holder for the purpose of avoiding penalties that may be assertedagainst the holder under the Internal Revenue Code. Holders should seek their own advice based on theirparticular circumstances from an independent tax advisor.
The following is a discussion of certain US federal income tax consequences of purchasing, owning anddisposing of a note to a US Holder (as described below), but it does not purport to be a comprehensivedescription of all the tax considerations that may be relevant to a particular person’s decision to acquire suchsecurity. This discussion applies only to US Holders who hold the notes as capital assets for US federal incometax purposes and acquire such notes for cash pursuant to this offering at the “issue price,” which will equal thefirst price to the public, not including bond houses, brokers or similar persons or organizations acting in thecapacity of underwriters, placement agents or wholesalers, at which a substantial amount of the notes is sold formoney. This discussion does not describe all of the US federal income tax consequences that may be relevant to aholder in light of the holder’s particular circumstances or to holders subject to special rules, such as:
• certain financial institutions;
• insurance companies;
• dealers and certain traders in notes or foreign currencies;
• persons holding the notes as part of a hedge, straddle, conversion or other integrated transaction;
• persons whose functional currency for US federal income tax purposes is not the US dollar;
• partnerships or other entities classified as partnerships for US federal income tax purposes;
• persons liable for the alternative minimum tax; or
• tax-exempt organizations.
This discussion is based on the Internal Revenue Code of 1986, as amended, administrativepronouncements, judicial decisions, and final, temporary and proposed Treasury regulations, as of the datehereof, all of which are subject to change, possibly on a retroactive basis. Prospective purchasers should consulttheir own tax advisors concerning the US federal, state, local and non-US tax consequences of purchasing,owning and disposing of notes in their particular circumstances.
As used herein, the term “US Holder” means a beneficial owner of the notes that is, for US federal incometax purposes, (i) a citizen or resident of the United States; (ii) a corporation or other entity taxable as acorporation, created or organized in or under the laws of the United States, any state thereof or the District ofColumbia; or (iii) an estate or trust the income of which is subject to US federal income taxation regardless of itssource.
ICICI intends to treat the notes as indebtedness issued without original issue discount for United Statesfederal income tax purposes. Except as otherwise indicated, the following discussion assumes this treatment isrespected. Prospective purchasers should consult their own tax advisors concerning the US federal, state, localand non-US tax consequences of purchasing, owning and disposing of the notes in their particular circumstances.
186

Payments of Interest
Interest paid on a note (including any Additional Interest or Additional Amounts) will be taxable to a USHolder as ordinary interest income at the time it accrues or is received in accordance with the holder’s method ofaccounting for US federal income tax purposes. The amount of interest taxable as ordinary income will includeamounts withheld with respect to taxes. Interest income earned by a US Holder with respect to a note willconstitute foreign source income for foreign tax credit purposes.
Amounts withheld (taking into account the availability of any reduced rate of withholding tax under anyapplicable Income Tax Treaty between the relevant Taxing Jurisdiction and the United States) from interestincome on a note may be eligible for credit against the US Holder’s US federal income tax liability, subject togenerally applicable limitations and conditions, or, at the election of the US Holder, for deduction in computingthe US Holder’s taxable income. The limitation on foreign taxes eligible for credit is calculated separately withrespect to specific classes of income. The rules governing foreign tax credits are complex and, therefore, USHolders should consult their own tax advisors regarding the availability of foreign tax credits in their particularcircumstances.
Sale, Exchange or Other Disposition of the Notes
Upon the sale, exchange or other taxable disposition of a note, a US Holder will recognize taxable gain orloss equal to the difference between the amount realized on the sale, exchange or other taxable disposition andthe holder’s adjusted tax basis in the note. A US Holder’s adjusted tax basis in a note will generally equal thecost of such note to such holder. For these purposes, the amount realized does not include any amountattributable to accrued interest. Amounts attributable to accrued interest are treated as interest as described under“Payments of Interest” above.
Gain or loss realized on the sale, exchange or other taxable disposition of a note will generally be capitalgain or loss and will be long-term capital gain or loss if at the time of sale, exchange or other taxable dispositionthe note has been held for more than one year. Gain or loss will generally be US source for purposes ofcomputing a US Holder’s foreign tax credit limitation.
As described under “—Indian Taxation—Taxation of gains arising on disposition” above, you may besubject to Indian tax on the disposition of securities. You should consult your own tax advisor with respect toyour ability to credit any such Indian tax against your US federal income tax liability.
Alternative Characterization
No statutory, judicial or administrative authority directly addresses the treatment of the notes or instrumentssimilar to the notes for US federal income tax purposes, and no ruling is being requested from the InternalRevenue Service with respect to the notes. The Internal Revenue Service, or IRS, might conclude that the notesare equity, in which case the timing, character and amount of the income a US Holder would be required torecognize could be materially different than that described above. Accordingly, US Holders should consult theirtax advisors regarding potential alternative characterizations of the notes.
Information Reporting and Backup Withholding
Payments of interest and proceeds from the sale of a note that are made within the United States or throughcertain US-related financial intermediaries may be subject to information reporting and to backup withholdingunless the US Holder is a corporation or other exempt recipient (and establishes this fact when required) or in thecase of backup withholding, the holder provides a correct taxpayer identification number and certifies that noloss of exemption from backup withholding has occurred. The amount of any backup withholding from apayment to a US Holder will be allowed as a credit against such holder’s US federal income tax liability and mayentitle such holder to a refund, provided that the required information is timely furnished to the IRS.
187

UNITED STATES ERISA CONSIDERATIONS
The following is a summary of certain considerations associated with an investment in the notes by apension, profit sharing or other employee benefit plan subject to Title I of the Employee Retirement IncomeSecurity Act of 1974, as amended (“ERISA”) or Section 4975 of the Code. THE FOLLOWING IS MERELY ASUMMARY, HOWEVER, AND SHOULD NOT BE CONSTRUED AS LEGAL ADVICE OR AS COMPLETEIN ALL RELEVANT RESPECTS. BECAUSE THIS SUMMARY WAS WRITTEN IN CONNECTION WITHTHE MARKETING OF THE NOTE, IT IS NOT INTENDED TO BE USED AND CANNOT BE USED BYANY NOTE HOLDER FOR THE PURPOSE OF AVOIDING PENALTIES AND/OR EXCISE TAX. ALLPURCHASERS ARE URGED TO CONSULT THEIR LEGAL ADVISORS BEFORE INVESTING ASSETSOF AN EMPLOYEE BENEFIT PLAN IN THE NOTES AND TO MAKE THEIR OWN INDEPENDENTDECISIONS.
Each fiduciary of a pension, profit-sharing or other employee benefit plan (an “ERISA Plan”) subject toERISA, should consider the fiduciary standards of ERISA in the context of the ERISA Plan’s particularcircumstances before authorizing an investment in the notes. Accordingly, among other factors, the fiduciaryshould consider whether the investment would satisfy the prudence and diversification requirements of ERISAand would be consistent with the documents and instruments governing the ERISA Plan.
Section 406 of ERISA and Section 4975 of the Code prohibit ERISA Plans, as well as individual retirementaccounts and Keogh plans subject to Section 4975 of the Code (together with ERISA Plans, “Plans”), fromengaging in certain transactions involving “plan assets” with persons who are “parties in interest” under ERISAor “disqualified persons” under the Code with respect to such Plan (together, “Parties in Interest”). For example,if we are a Party in Interest with respect to a Plan (either directly or by reason of its ownership of itssubsidiaries), the purchase of the notes by or on behalf of the Plan would likely be a prohibited transaction underSection 406(a)(1) of ERISA and Section 4975(c)(1) of the Code, unless exemptive relief were available under anapplicable statutory or administrative exemption (see below).
The US Department of Labor has issued five prohibited transaction class exemptions (“PTCEs”) that mayprovide exemptive relief for direct or indirect prohibited transactions resulting from the purchase and holding ofthe notes by or on behalf of a Plan. Those class exemptions are PTCE 96-23 (for certain transactions determinedby in-house asset managers), PTCE 95-60 (for certain transactions involving insurance company generalaccounts), PTCE 91-38 (for certain transactions involving bank collective investment funds), PTCE 90-1 (forcertain transactions involving insurance company separate accounts) and PTCE 84-14 (for certain transactionsdetermined by independent qualified professional asset managers). In addition, pending legislation may providesignificant additional statutory relief from the prohibited transaction provisions of ERISA and the Code.
Accordingly, the notes may not be purchased or held by any Plan, any entity whose underlying assetsinclude “plan assets” by reason of any Plan’s investment in the entity (a “Plan Asset Entity”) or any personinvesting “plan assets” of any Plan, unless the purchase and holding of the notes is exempt under PTCE 96-23,95-60, 91-38, 90-1 or 84-14 or under a statutory exemption. Any purchaser of the notes or any interest therein,including in the secondary market, will be deemed to have represented that, among other things, either (a) it isnot a Plan or other Plan Asset Entity and is not purchasing the notes on behalf of or with “plan assets” of anyPlan or other Plan Asset Entity or (b) its purchase, holding and disposition of the notes is exempt under PTCE96-23, 95-60, 91-38, 90-1 or 84-14 or under a statutory exemption, and that such representations shall be deemedto be made each day from the date on which the purchaser purchases through and including the date on which thepurchaser disposes of the notes. See “Transfer Restrictions” herein.
Due to the complexity of these rules and the penalties that may be imposed upon persons involved innon-exempt prohibited transactions, and due to the uncertainty about pending adoption of legislation significantlyaffecting these issues, it is particularly important that fiduciaries or other persons considering purchasing thenotes on behalf of or with “plan assets” of any Plan consult with their counsel regarding the potentialconsequences under ERISA and the Code and the availability of exemptive relief under PTCE 96-23, 95-60,91-38, 90-1 or 84-14 or under the new legislation.
188

PLAN OF DISTRIBUTION
We intend to offer the notes through the Initial Purchasers. Subject to the terms and conditions contained ina purchase agreement dated January 9, 2007 between us, Citigroup Global Markets Inc., Deutsche BankSecurities Inc. and Merrill Lynch International, the Initial Purchasers, have severally agreed to purchase, and wehave agreed to sell to them, US$ 750,000,000 aggregate principal amount of the notes.
The Initial Purchasers have agreed to purchase all of the notes being sold pursuant to the purchaseagreement if any of these notes are purchased.
We have agreed to indemnify the Initial Purchasers against certain liabilities, including liabilities under theSecurities Act, and will contribute to payments the Initial Purchasers may be required to make in respect of thoseliabilities.
The Initial Purchasers are offering the notes, subject to prior sale, when, as and if issued to and accepted bythem, subject to approval of legal matters by their counsel, including the validity of the notes, and otherconditions contained in the purchase agreement, such as the receipt by the Initial Purchasers of officer’scertificates and legal opinions. The Initial Purchasers reserve the right to withdraw, cancel or modify offers toinvestors and to reject orders in whole or in part.
New Issue of Notes
The notes are a new issue of notes with no established trading market. Approval-in-principle has beenobtained for the listing of the notes on the Singapore Exchange. The Initial Purchasers have advised us that theypresently intend to make a market in the notes after completion of this offering as permitted by applicable lawsand regulations. However, they are under no obligation to do so and may discontinue any market-makingactivities at any time without any notice. Accordingly, we cannot assure you as to the liquidity of, or thedevelopment or continuation of trading markets for, the notes.
Selling Restrictions
United States
The notes have not been registered under the Securities Act and may not be offered or sold in the UnitedStates or to US persons (other than distributors) unless they are registered under the Securities Act or anexemption from the registration requirements of the Securities Act is available. See “Transfer Restrictions”.
We have been advised by the Initial Purchasers that they propose to resell the notes initially to qualifiedinstitutional buyers (as defined in Rule 144A) in reliance on the exemption from the registration requirements ofthe Securities Act provided by Rule 144A and to non-US Persons in reliance on the exemption from theregistration requirements of the Securities Act provided by Regulation S.
The Initial Purchasers have agreed that, except as permitted by the purchase agreement, they will not offer,sell or deliver the notes (i) as part of their distribution at any time or (ii) otherwise until 40 days after the later ofthe commencement of this offering and the original issuance date of the notes, within the United States or to, orfor the account or benefit of, US persons, other than in accordance with Rule 144A, and they will send to eachdistributor, dealer or other person receiving a selling concession or similar fee to which they sell notes in relianceon Regulation S during such 40-day period, a confirmation or other notice detailing the restrictions on offers andsales of the notes within the United States or to, or for the account or benefit of, US persons. In addition, until theexpiration of the 40-day restricted period referred to above, an offer or sale of notes within the United States by adealer (whether or not it is participating in this offering) may violate the registration requirements of the
189

Securities Act if such offer or sale is made otherwise than pursuant to Rule 144A or pursuant to anotherexemption from registration under the Securities Act. Terms used in this paragraph have the meanings given tothem by Regulation S.
United Kingdom
The Initial Purchasers has agreed that:
• they have only communicated or caused to be communicated and will only communicate or cause to becommunicated an invitation or inducement to engage in investment activity (within the meaning ofsection 21 of the Financial Services and Markets Act 2000 (the “FSMA”) received by them inconnection with the issue or sale of the notes in circumstances in which section 21(1) of the FSMAdoes not apply to us; and they have complied and will comply with all applicable provisions of theFSMA with respect to anything done by it in relation to the notes in, from or otherwise involving theUnited Kingdom.
India
The Initial Purchasers have represented and agreed that this offering memorandum has not and will not beregistered as a prospectus with the Registrar of Companies, SEBI or any other statutory or regulatory body of likenature in India, and that the notes will not be offered or sold, and have not been offered or sold, in India nor havethe Initial Purchasers circulated or distributed, nor will they circulate or distribute, this offering memorandum orany other offering document or material relating to the notes, directly or indirectly, to any person or the public orany member of the public in India or otherwise generally distributed or circulated in India or otherwise generallydistributed or circulated in India. The notes have not been offered or sold, and will not be offered or sold, in Indiain circumstances which would constitute an offer to the public within the meaning of the Companies Act, 1956and other laws for the time being in force.
Hong Kong
The Initial Purchasers have agreed that:
• they have not offered or sold and will not offer or sell in Hong Kong, by means of any document, anynotes other than (a) to “professional investors” as defined in the Securities and Futures Ordinance (Cap.571) of Hong Kong and any rules made under that Ordinance; or (b) in other circumstances which donot result in the document being a “prospectus” as defined in the Companies Ordinance (Cap. 32) ofHong Kong or which do not constitute an offer to the public within the meaning of that Ordinance; and
• they have not issued or had in their possession for the purposes of issue, and will not issue or have intheir possession for the purposes of issue, whether in Hong Kong or elsewhere, any advertisement,invitation or document relating to the notes, which is directed at, or the contents of which are likely tobe accessed or read by, the public of Hong Kong (except if permitted to do so under the securities lawsof Hong Kong) other than with respect to notes which are or are intended to be disposed of only topersons outside Hong Kong or only to “professional investors” as defined in the Securities and FuturesOrdinance (Cap. 571) of Hong Kong and any rules made under that Ordinance.
Singapore
Each Initial Purchaser has acknowledged that this offering memorandum has not been registered as aprospectus with the Monetary Authority of Singapore. Accordingly, each Initial Purchaser has represented,warranted and agreed that it has not offered or sold any notes or caused the notes to be made the subject of aninvitation for subscription or purchase nor will it offer or sell the notes or cause the notes to be made the subjectof an invitation for subscription or purchase, nor has it circulated or distributed nor will it circulate or distributethis offering memorandum or any other document or material in connection with the offer or sale, or invitationfor subscription or purchase, of the notes, whether directly or indirectly, to persons in Singapore other than (i) to
190

an institutional investor under Section 274 of the Securities and Futures Act, Chapter 289 of Singapore (the“SFA”), (ii) to a relevant person pursuant to Section 275(1), or any person pursuant to Section 275(1A), and inaccordance with the conditions specified in Section 275, of the SFA or (iii) otherwise pursuant to, and inaccordance with the conditions of, any other applicable provision of the SFA.
Where the notes are subscribed or purchased under Section 275 of the SFA by a relevant person which is:
(a) a corporation (which is not an accredited investor (as defined in Section 4A of the SFA)) the solebusiness of which is to hold investments and the entire share capital of which is owned by one or moreindividuals, each of whom is an accredited investor; or
(b) a trust (where the trustee is not an accredited investor) whose sole purpose is to hold investmentsand each beneficiary of the trust is an individual who is an accredited investor, shares, debentures and unitsof shares and debentures of that corporation or the beneficiaries’ rights and interest (howsoever described)in that trust shall not be transferred within six months after that corporation or that trust has acquired thenotes pursuant to an offer made under Section 275 of the SFA except:
(1) to an institutional investor (for corporations, under Section 274 of the SFA) or to a relevantperson defined in Section 275(2) of the SFA, or to any person pursuant to an offer that is made onterms that such shares, debentures and units of shares and debentures of that corporation or such rightsand interest in that trust are acquired at a consideration of not less than S$200,000 (or its equivalent ina foreign currency) for each transaction, whether such amount is to be paid for in cash or by exchangeof notes or other assets, and further for corporations, in accordance with the conditions specified inSection 275 of the SFA;
(2) where no consideration is or will be given for the transfer; or
(3) where the transfer is by operation of law.
Japan
The Initial Purchasers have agreed that they have not offered or sold, and will not offer or sell, directly orindirectly, any of the notes in Japan or to any resident of Japan or to any persons for reoffering or resale, directlyor indirectly, in Japan or to any resident of Japan, except (x) pursuant to an exemption from the registrationrequirements of the Securities and Exchange Law of Japan available thereunder and (y) in compliance with theother relevant requirements of Japanese law. As used in this paragraph, “resident of Japan” means any personresiding in Japan, including any corporation or other entity organized under the laws of Japan.
Price Stabilization and Short Positions
In connection with this offering, the Initial Purchasers may engage in transactions that stabilize, maintain orotherwise affect the price of the notes. Specifically, the Initial Purchasers may bid for and purchase notes in theopen market for the purpose of pegging, fixing or maintaining the price of the notes. In addition, if the InitialPurchasers creates a short position in the notes in connection with the offering by selling more notes than arelisted on the cover page of this offering memorandum, then the Initial Purchasers may reduce that short positionby purchasing notes in the open market. The Initial Purchasers may also impose penalty bids, which wouldpermit the Initial Purchasers to reclaim a selling concession from a dealer when the notes originally sold by thatdealer are purchased in a covering transaction to cover short positions. In general, purchases of a security for thepurpose of stabilizing or reducing a short position could cause the price of that note to be higher than it mightotherwise have been in the absence of those purchases.
Neither we nor the Initial Purchasers make any representation or prediction as to the direction or magnitudeof any effect that the transactions described above may have on the price of the notes. In addition, neither we northe Initial Purchasers make any representation that anyone will engage in these transactions or that thesetransactions, if they are commenced, will not be discontinued without notice.
191

Other Relationships
The Initial Purchasers and their affiliates have engaged in, and may in the future engage in, investmentbanking and other commercial dealings in the ordinary course of business with us. They have received customaryfees and commissions for these transactions.
The Initial Purchasers and certain of their affiliates have been and currently are our clients to whom weprovide, from time to time, ordinary course commercial banking services.
192

TRANSFER RESTRICTIONS
The notes have not been registered under the Securities Act and may not be offered or sold in the UnitedStates or to, or for the account or benefit of, US persons except in accordance with an applicable exemption fromthe registration requirements thereof. Accordingly, the notes are being offered and sold only (1) to “qualifiedinstitutional buyers” (as defined in Rule 144A under the Securities Act) in compliance with Rule 144A, or(2) outside the United States to non-US persons in reliance upon Regulation S under the Securities Act. As usedin this section, the terms “United States,” “US person” and “offshore transactions” have the meanings given tothem in Regulation S.
Each purchaser of notes, by its acceptance thereof, will be deemed to have acknowledged, represented toand agreed with us and the Initial Purchasers as follows:
1. It is:
• a qualified institutional buyer, is aware that the sale of the notes to it is being made in reliance onRule 144A and is acquiring the notes for its own account or for the account of a qualifiedinstitutional buyer; or
• it is not a US person and is purchasing the notes outside the United States in compliance withRegulation S.
2. It understands that the notes are being offered in a transaction not involving any public offering inthe United States within the meaning of the Securities Act and that the notes have not been registered underthe Securities Act.
3. If it is acquiring the notes in a sale made in reliance upon Rule 144A, it will not offer, resell, pledgeor otherwise transfer notes prior to the date that is two years after the later of the original issue date of thenotes and the last date on which we or any of our affiliates was the owner of that note (or any predecessor ofthat security) except:
• to us;
• inside the United States to a qualified institutional buyer in compliance with Rule 144A;
• outside the United States to non-US persons in offshore transactions in accordance with Rule 903or Rule 904 of Regulation S;
• in a transaction complying with Rule 144 under the Securities Act (if available); or
• pursuant to an effective registration statement under the Securities Act,
in each case in accordance with any applicable securities laws of any state of the United States and otherjurisdictions. In addition, it will, and each subsequent holder is required to, notify any subsequent purchaserof those notes from it of the resale restrictions referred to above.
4. If it is acquiring the notes in a sale being made in reliance upon Rule 144A, it understands that thenotes will, until two years after the later of the original issue date of the notes and the last date on which weor any of our affiliates was the owner of that note (or any predecessor of that note), unless otherwise agreedby us and the securityholder, bear a legend substantially to the following effect:
“This note has not been registered under the United States Securities Act of 1933, as amended (the“Securities Act”), or the securities laws of any state or other jurisdiction. Neither this note nor anyinterest or participation herein may be reoffered, sold, assigned, transferred, pledged, encumbered orotherwise disposed of in the absence of such registration or unless such transaction is exempt from, ornot subject to, such registration.
The holder of this note by its acceptance hereof (1) represents that it is a “qualified institutionalbuyer” (as defined in Rule 144A under the Securities Act) purchasing this note for its own account or
193

for the account of one or more qualified institutional buyers; (2) agrees to offer, sell or otherwisetransfer such note, prior to the date (the “resale restriction termination date”) which is two yearsafter the later of the original issue date hereof and the last date on which the issuer or any affiliate ofthe issuer was the owner of this security (or any predecessor of such note), only (a) to the issuer or anyaffiliate thereof, (b) pursuant to a registration statement that has been declared effective under theSecurities Act, (c) for so long as the notes are eligible for resale pursuant to Rule 144A, to a person itreasonably believes is a “qualified institutional buyer”, that purchases for its own account or for theaccount of a qualified institutional buyer to whom notice is given that the transfer is being made inreliance on Rule 144A, in a principal amount of not less than US$ 100,000, (d) pursuant to offers andsales that occur outside the United States in compliance with Rule 903 or 904 under Regulation Sunder the Securities Act, (e) pursuant to another available exemption from the registrationrequirements of the Securities Act, in each case in accordance with all applicable securities laws of thestates of the United States or any other applicable jurisdiction; and (3) agrees that it will deliver toeach person to whom this security is transferred a notice substantially to the effect of this restrictivelegend. This legend will be removed upon the request of the holder after the resale restrictiontermination date.”
5. If it is acquiring the notes in a sale being made in reliance upon Regulation S, it understands that thenotes will, until the expiration of a 40-day “distribution compliance period” within the meaning of Rule 903of Regulation S, bear a legend substantially to the following effect:
“This note has not been registered under the United States Securities Act of 1933, as amended (the“Securities Act”), or the securities laws of any state or other jurisdiction, and, accordingly, may notbe offered or sold within the United States or to or for the account or benefit of US persons except asset forth in the following sentence. By its acquisition hereof, the holder (1) represents that it is not aUS person, is not acquiring this note for the account or benefit of a US person and is acquiring thisnote in an offshore transaction, (2) by its acceptance hereof, agrees to offer, sell or otherwise transfersuch security only (a) to the issuer or any affiliate thereof, (b) pursuant to a registration statementthat has been declared effective under the Securities Act, (c) for so long as the notes are eligible forresale pursuant to Rule 144A under the Securities Act (“Rule 144A”), to a person it reasonablybelieves is a “qualified institutional buyer” as defined in Rule 144A that purchases for its own accountor for the account of a qualified institutional buyer to whom notice is given that the transfer is beingmade in reliance on Rule 144A in a transaction meeting the requirements of Rule 144A, (d) pursuantto offers and sales that occur outside the United States in compliance with Rule 903 or 904 underRegulation S under the Securities Act or (e) pursuant to another available exemption from theregistration requirements of the Securities Act, in each case in accordance with all applicablesecurities laws of the states of the United States or any other applicable jurisdiction and (3) agreesthat it will deliver to each person to whom this security is transferred a notice substantially to theeffect of this restrictive legend. This legend will be removed after 40 consecutive days beginning onand including the later of (a) the day on which the notes are offered to persons other than distributors(as defined in Regulation S) and (b) the date of the closing of the original offering. As used herein, theterms “offshore transaction”, “United States” and “US person” have the meanings given to them byRegulation S under the Securities Act.
6. If it is a purchaser in a sale that occurs outside the United States within the meaning of Regulation S,it agrees that until the expiration of a 40-day “distribution compliance period” within the meaning of Rule903 of Regulation S under the Securities Act, no offer or sale of the notes shall be made by it to a US personor for the account or benefit of a US person within the meaning of Rule 902(o) of the Securities Act exceptto a qualified institutional buyer and in compliance with the applicable restrictions set forth in paragraph(4) above.
7. It acknowledges that the trustee will not be required to accept for registration of transfer any notesacquired by it, except upon presentation of evidence satisfactory to us and the trustee that the restrictions setforth herein have been complied with.
194
8. It acknowledges that we and the Initial Purchasers will rely upon the truth and accuracy of theforegoing acknowledgments, representations and agreements and agrees that, if any of theacknowledgments, representations or warranties deemed to have been made by its purchase of notes are nolonger accurate, it will promptly notify us and the Initial Purchasers. If it is acquiring any notes as afiduciary or agent for one or more investor accounts, it represents that is has sole investment discretion withrespect to each such account and that it has full power to make the foregoing acknowledgments,representations and agreements on behalf of each such account.
9. It will be deemed to have represented and agreed either that (i) it is not and for so long as it holdsnotes will not be (and is not acquiring the notes directly or indirectly with the assets of a person who is orwhile the notes are held will be) an ERISA Plan or other Plan, an entity whose underlying assets include theassets of any such ERISA Plan or other Plan, or a governmental or other employee benefit plan which issubject to any US federal, state or local law, or foreign law, that is substantially similar to the provisions ofSection 406 of ERISA or Section 4975 of the Code, or (ii) its purchase and holding of the notes will notresult in a prohibited transaction under Section 406 of ERISA or Section 4975 of the Code (or, in the case ofsuch a governmental or other employee benefit plan, any such substantially similar US federal, state or locallaw, or foreign law) for which an exemption is not available. Similarly, each transferee of any notes, byvirtue of the transfer of such notes to such transferee, will be deemed to have represented and agreed eitherthat (i) it is not and for so long as it holds notes will not be (and is not acquiring the notes directly orindirectly with the assets of a person who is or while the notes are held will be) an ERISA Plan or otherPlan, an entity whose underlying assets include the assets of any such ERISA Plan or other Plan, or agovernmental or other employee benefit plan which is subject to any US federal, state or local law, orforeign law, that is substantially similar to the provisions of Section 406 of ERISA or Section 4975 of theCode, or (ii) its purchase and holding of the notes will not result in a prohibited transaction underSection 406 of ERISA or Section 4975 of the Code (or, in the case of such a governmental or otheremployee benefit plan, any such substantially similar federal, state or local law, or foreign law) for which anexemption is not available.
195

LEGAL MATTERS
The validity of the notes will be passed upon for us by Davis Polk & Wardwell, our US counsel, and for theInitial Purchasers by Latham & Watkins, US counsel to the Initial Purchasers.
Matters of Indian law will be passed upon by Amarchand & Mangaldas & Suresh A. Shroff & Co., Indiancounsel to the Initial Purchasers.
INDEPENDENT ACCOUNTANTS
Certain financial data for the fiscal years 2002, 2003, 2004, 2005 and 2006 and the six months endedSeptember 30, 2005 and 2006 included in this offering memorandum have been derived from our unconsolidatedfinancial statements prepared in accordance with Indian GAAP, guidelines issued by the Reserve Bank of Indiafrom time to time and practices generally prevailing in the banking industry in India. The financial statements forfiscal 2002 have been audited by S.B. Billimoria and Co., Chartered Accountants, for fiscal 2003 jointly by N.M.Raiji and Co., Chartered Accountants and S.R. Batliboi and Co., Chartered Accountants, for fiscal 2004, 2005and 2006 and the six months ended September 30, 2005, by S.R. Batliboi and Co., Chartered Accountants and forthe six months ended September 30, 2006 by BSR & Co., Chartered Accountants.
196

DESCRIPTION OF CERTAIN DIFFERENCES BETWEEN INDIAN GAAP AND US GAAP
The following is a general summary of certain differences between Indian GAAP and US GAAP asapplicable to us. The differences identified below are limited to those significant differences that are appropriateto our financial statements. However, they should not be construed as being exhaustive, and no attempt has beenmade to identify possible future differences between Indian GAAP and US GAAP as a result of prescribedchanges in accounting standards nor to identify future differences that may affect our financial statements as aresult of transactions or events that may occur in the future.
Indian GAAP US GAAP
1. Financial Statement Presentation and Disclosure
Two years’ balance sheets, profit and loss account,accounting policies and notes and cash flow statementsare required under Indian GAAP.
As disclosed under “Management’s Discussion andAnalysis of Financial Condition and Results ofOperations—Significant changes in accountingpolicies”, in 2003, 2004 and 2005 we changed certainaccounting policies. Under Indian GAAP thesechanges are accounted for prospectively with adisclosure of comparable prior period amounts as ifrestatement had occurred.
Companies filing US GAAP financial statements withthe SEC are required to present three years’ statementof operations, statement of stockholders’ equity andother comprehensive income and cash flowstatements and two years’ balance sheet.
Disclosure requirements under US GAAP also vary incertain respects to those of Indian GAAP.
Under US GAAP for the period presented changes inaccounting policies are generally accounted for on acumulative change basis.
2. Consolidation
ICICI Bank has presented its Indian GAAP financialstatements on an unconsolidated basis where thefinancial position and results of operations of itscontrolled entities are not consolidated, but ratherreflected on the basis of cost subject to consideration ofimpairment.
Under Indian GAAP, the investments in subsidiariesare consolidated on a line-by-line basis by addingtogether items of assets, liabilities, income andexpenses. Investments in associates is accounted for asper the equity method of accounting as defined in AS23 “Accounting for Investments in Associates inConsolidated Financial Statements” and in jointventures as per the proportionate consolidation methodas defined in AS 27 “Financial Reporting of Interestsin Joint Ventures.” The financial statements ofcompanies which are in the nature of jointly controlledentities are consolidated as per AS 21 “ConsolidatedFinancial Statements”, consequent to the limitedrevision to AS 27 “Financial Reporting of Interests inJoint Ventures.”
US GAAP requires consolidation and generally doesnot consider financial statements to be prepared undera “fundamental basis of accounting” if a consolidationaccounting policy is not followed. US GAAP alsorequires consolidation of variable interest entities, ifthe investing entity is a primary beneficiary asdefined in FIN 46R.
197

Indian GAAP US GAAP
3. Business Combination
Under Indian GAAP, for legal and accountingpurposes, ICICI Bank acquired ICICI by issuing sharesof ICICI Bank to the shareholders of ICICI. Thebusiness combination was accounted for in accordancewith purchase method of accounting. The excess of fairvalue of the assets of ICICI over the paid up value ofthe shares issued by ICICI Bank was taken to generalreserves.
In accordance with SFAS 141, the amalgamation ofICICI with ICICI Bank qualifies as a reverseacquisition. For financial reporting purposes ICICIwas the acquiring entity and hence the assets andliabilities of ICICI Bank were fair valued under thepurchase method of accounting.
The total purchase price was determined by takinginto consideration the fair value of the common stockissued and stock options assumed and the directacquisition costs.
The total purchase price was allocated to the acquiredassets and assumed liabilities based on managementestimates and independent appraisals. The differencebetween the total purchase price and net tangible andintangible assets acquired was treated as goodwill.
4. Unrealized gains/losses on Investments
All investments are categorized into “Held toMaturity”, “Available for Sale” and “Trading”. “Heldto Maturity” securities are carried at their acquisitioncost or at amortized cost if acquired at a premium overthe face value. “Available for Sale” and “Trading”securities are valued periodically as per the ReserveBank of India’s guidelines. Depreciation/appreciationfor each basket within “Available for Sale” and“Trading” category is aggregated. Net appreciation ineach basket if any, being unrealized, is ignored, whilenet depreciation is charged to the profit and lossaccount.
Investments are classified into “Trading” or“Available for Sale” based on management’s intentand ability. Currently, no investments are classified as“Held to Maturity.” While “Trading” and “AvailableFor Sale” securities are valued at fair value, “Held toMaturity” securities are valued at cost, adjusted foramortization of premiums and accretion of discount.The unrealized gains and losses on “Trading”securities are taken to the income statement, whilethose on “Available for Sale” securities are reportedas a separate component of stockholders’ equity, netof applicable taxes, until realized.
5. Amortization of premium/discount on purchase ofinvestments
No amortization of premium/discount on investmentsis required except for premium on investmentscategorized as Held to Maturity.
Premium/discount is amortized on all categories ofinvestments.
6. Retirement benefits
Effective April 1, 2006 the liability for defined benefitplans like gratuity and pension is determined using theprojected unit credit actuarial method. The discountrate for obligations is based on market yields ofGovernment of India securities. The actuarial gains orlosses are recognized immediately in the statement ofincome.
The liability for defined benefit schemes isdetermined using the projected unit credit actuarialmethod. The discount rate for obligations is based onmarket yields of high quality corporate bonds. Theactuarial gains or losses are not recognizedimmediately in the statement of income. As aminimum, amortization of an unrecognized net gainor loss is included as a component of net pension costfor a year if, as of the beginning of the year, that
198

Indian GAAP US GAAP
unrecognized net gain or loss exceeds 10% of thegreater of the projected benefit obligation or themarket-related value of plan assets. The balance, ifany, is amortized over the average remaining serviceperiod of active employees expected to receivebenefits under the plan.
7. Revaluation of property
Property is carried at historical cost or other amountsubstituted for historical cost less accumulateddepreciation. An increase in net book value as a resultof revaluation is taken directly to revaluation reserveswhile a decline is charged to profit and loss account.
Revaluation of property is not permitted in accountsunder US GAAP. As a result, depreciation charge islower under US GAAP, and when revalued propertyis disposed of, a greater profit or loss is generallyrecorded under US GAAP than Indian GAAP.
8. Allowance for credit losses
All credit exposures are classified as per Reserve Bankof India’s guidelines, into performing andnon-performing assets. Further, non-performing assetsare classified into substandard, doubtful and loss assetsfor provisioning based on the criteria stipulated by theReserve Bank of India. Provisions are generally madeon substandard and doubtful assets at rates equal to orhigher than those prescribed by the Reserve Bank ofIndia. For restructured assets, provision is made inaccordance with the guidelines issued by the ReserveBank of India, which require that a provision equal tothe present value of the interest sacrifice be made at thetime of restructuring. In addition to the generalprovision made on standard assets in accordance withReserve Bank of India guidelines, the Bank maintainsgeneral provisions to cover potential credit losses.
Credit losses on homogeneous groups of loans arerecognized when they are both probable of occurrenceand reasonably estimable. Individual loans are testedfor impairment and placed on a non-accrual basiswhen based on current information and events, themanagement estimates that the collection ofoutstanding interest and principal amount is doubtful.The impairment of a loan is measured based on thepresent value of the expected future cash flowsdiscounted at the loan’s effective interest rate, or atthe observable market price of the loan, or at the fairvalue of the collateral if the loan is collateraldependent. The impairment is recognized if themeasured value is less than the recorded investmentin the impaired loan.
9. Loan origination fees/costs
Loan origination fees are recognized upfront on theirbecoming due. Loan origination costs are taken to theprofit and loss account in the year in which accrued/incurred.
Non-refundable loan origination fees (net of directloan origination costs) are deferred and recognized asan adjustment to yield over the life of the loan. Theadjustment is made by the interest method based onthe contractual terms of the loan.
10. Acceptances
Acceptances are not recorded on the balance sheet andare disclosed as off-balance sheet contingent liabilities.
Acceptances and the related customer liabilities aredisclosed on the balance sheet as an asset and aliability.
11. Derivatives instruments and hedging activities
The impact of derivative instruments are correlatedwith the movement of the underlying assets andliabilities and accounted pursuant to the principles of
All derivatives, either assets or liabilities, aremeasured at fair value. Fair values of derivatives arebased on quoted market prices, which take into
199

Indian GAAP US GAAP
hedge accounting. The related amount receivable fromand payable to the swap counter parties is included inthe other assets or liabilities in the balance sheet. Whenthere is no correlation of movements betweenderivatives and the underlying asset or liability, or ifthe underlying asset or liability specifically related tothe derivative instrument has matured or is sold orterminated, the derivative instrument is closed out ormarked to market as an element of non interest incomeon an outgoing basis.
account current market and contractual prices of theunderlying instrument as well as time valueunderlying the positions. Derivatives that are notdesignated as part of a hedging relationship areaccounted for in other assets and are adjusted to fairvalue through income. If the derivative qualifies as ahedge, depending on the nature of the hedge, theeffective portion of the hedge’s change in fair value iseither offset against the change in fair value of thehedged asset, liability or firm commitment throughincome or held in equity until the hedged item isrecognized as income. The ineffective portion of ahedge’s change in fair value is immediatelyrecognized in income.
12. Deferred Taxes
Deferred taxation is provided on timing differenceswhere it is considered probable that a benefit or aliability will crystallize. There is no specific guidanceunder Indian GAAP for recognition of deferred tax onundistributed earnings of subsidiaries.
Under SFAS 109, an assets/liability method is usedsuch that deferred tax assets and liabilities arecalculated for all temporary differences. A valuationallowance is raised against a deferred tax asset whereit is more likely than not that some portion of thedeferred tax assets will not be realized. Deferred taxis required on temporary differences relating toinvestments in domestic subsidiaries unless theinvestment can be recovered tax-free.
13. Basis for Depreciation
Depreciation is charged on a straight-line basis at ratesprescribed under the Companies Act, 1956.
Depreciation is provided over the estimated usefullives of the assets or lease term, whichever is shorter.
200

FINANCIAL STATEMENTS
INDEX TO FINANCIAL STATEMENTS
Page
Important Information Relating to the Financial Information Presented . . . . . . . . . . . . . . . . . . . . . . . . . . . F-2
Unconsolidated Financial Statements of ICICI Bank Limited for the six months endedSeptember 30, 2006
Auditors’ Report to the Board of Directors of ICICI Bank Limited for the six months endedSeptember 30, 2006 . . . . . . . . . . . . . . . . . . . . . . . . . . . . . . . . . . . . . . . . . . . . . . . . . . . . . . . . . . . . . . . . . . F-3
Unconsolidated Balance Sheet as on September 30, 2006 . . . . . . . . . . . . . . . . . . . . . . . . . . . . . . . . . . . . . . F-4Unconsolidated Profit and loss Account for the period ended September 30, 2006 . . . . . . . . . . . . . . . . . . . F-5Cash flow statement for the period ended September 30, 2006 . . . . . . . . . . . . . . . . . . . . . . . . . . . . . . . . . . F-6Schedules to the financial statements . . . . . . . . . . . . . . . . . . . . . . . . . . . . . . . . . . . . . . . . . . . . . . . . . . . . . . F-7
Unconsolidated Financial Statements of ICICI Bank Limited for the year ended March 31, 2006Auditors’ Report to the Members of ICICI Bank Limited for the year ended March 31, 2006 . . . . . . . . . . F-53Unconsolidated Balance Sheet as on March 31, 2006 . . . . . . . . . . . . . . . . . . . . . . . . . . . . . . . . . . . . . . . . . . F-54Unconsolidated Profit and loss Account for the year ended March 31, 2006 . . . . . . . . . . . . . . . . . . . . . . . . F-55Cash flow statement for the year ended March 31, 2006 . . . . . . . . . . . . . . . . . . . . . . . . . . . . . . . . . . . . . . . F-56Schedules to the financial statements . . . . . . . . . . . . . . . . . . . . . . . . . . . . . . . . . . . . . . . . . . . . . . . . . . . . . . F-57
Unconsolidated Financial Statements of ICICI Bank Limited for the year ended March 31, 2005Auditors’ Report to the Members of ICICI Bank Limited for the fiscal year ended 31st March, 2005 . . . . F-97Unconsolidated Balance Sheet as on March 31, 2005 . . . . . . . . . . . . . . . . . . . . . . . . . . . . . . . . . . . . . . . . . . F-98Unconsolidated Profit and loss Account for the year ended March 31, 2005 . . . . . . . . . . . . . . . . . . . . . . . . F-99Cash flow statement for the year ended March 31, 2005 . . . . . . . . . . . . . . . . . . . . . . . . . . . . . . . . . . . . . . . F-100Schedules to the financial statements . . . . . . . . . . . . . . . . . . . . . . . . . . . . . . . . . . . . . . . . . . . . . . . . . . . . . . F-101
Unconsolidated Financial Statements of ICICI Bank Limited for the year ended March 31, 2004Auditors’ Report to the Members of ICICI Bank Limited for the year ended March 31, 2004 . . . . . . . . . . F-137Balance Sheet as on March 31, 2004 . . . . . . . . . . . . . . . . . . . . . . . . . . . . . . . . . . . . . . . . . . . . . . . . . . . . . . . F-138Profit and loss Account for the year ended March 31, 2004 . . . . . . . . . . . . . . . . . . . . . . . . . . . . . . . . . . . . . F-139Schedules to the financial statements . . . . . . . . . . . . . . . . . . . . . . . . . . . . . . . . . . . . . . . . . . . . . . . . . . . . . . F-140Cash flow statement for the year ended March 31, 2004 . . . . . . . . . . . . . . . . . . . . . . . . . . . . . . . . . . . . . . . F-169
F-1

IMPORTANT INFORMATION RELATING TO THE FINANCIAL INFORMATION PRESENTED
Financial statements included in this offering memorandum are our unconsolidated audited financialstatements prepared in accordance with Indian GAAP guidelines issued by the Reserve Bank of India from timeto time, and practices generally prevailing in the banking industry. The financial information in our annual reporton Form 20-F for the fiscal year 2006 is based on our audited consolidated financial statements andaccompanying notes prepared in accordance with Indian GAAP with the net income and stockholders’ equityreconciled to US GAAP. Financial information in our annual reports on Form 20-F for the fiscal years 2000 to2005 filed with the SEC was prepared in accordance with US GAAP. US GAAP requires consolidation as afundamental basis of accounting, and is different in many respects to Indian GAAP. For further discussion of thesignificant differences between Indian GAAP and US GAAP, see “Description of Certain Differences betweenIndian GAAP and US GAAP”. We also prepare consolidated financial statements prepared in accordance withIndian GAAP, which are not included in this offering memorandum.
F-2

To the Board of DirectorsICICI Bank Limited
Auditors’ report on the financial statements of ICICI Bank Limited
1. We have audited the attached Balance Sheet of ICICI Bank Limited (‘the Bank’) as at September 30, 2006and also the Profit and Loss Account and the Cash Flow Statement of the Bank for the period ended on thatdate, annexed thereto. These financial statements are the responsibility of the Bank’s management. Ourresponsibility is to express an opinion on these financial statements based on our audit.
2. We conducted our audit in accordance with auditing standards generally accepted in India. Those standardsrequire that we plan and perform the audit to obtain reasonable assurance about whether the financialstatements are free of material misstatements. An audit includes examining, on a test basis, evidencesupporting the amounts and disclosures in the financial statements. An audit also includes assessing theaccounting principles used and significant estimates made by the management, as well as evaluating theoverall financial statements presentation. We believe that our audit provides a reasonable basis for our opinion.
3. The Balance Sheet and the Profit and Loss Account have been drawn up in accordance with the provisionsof Section 29 of the Banking Regulation Act, 1949 read with Section 211(1) and (2) of the Companies Act,1956, subject to non transfer of profit to various reserves.
4. We report that:
(a) we have obtained all the information and explanations which, to the best of our knowledge and belief,were necessary for the purpose of our audit and have found them to be satisfactory;
(b) the transactions of the Bank, which have come to our notice, have been within the powers of the Bank;
(c) the returns received from the offices and branches of the Bank have been found adequate for thepurposes of our audit.
5. In our opinion, the Balance Sheet, Profit and Loss Account and Cash Flow Statement dealt with by thisreport comply with the Accounting Standards issued by the Institute of Chartered Accountants of India.
6. We further report that:
(a) the Balance Sheet and the Profit and Loss Account dealt with by this report are in agreement with thebooks of account and the returns;
(b) in our opinion, proper books of account as required by law have been kept by the Bank so far asappears from our examination of those books;
(c) as per information and explanation given to us the Central Government has, till date, not prescribed anycess payable under Section 441A of the Companies Act, 1956.
7. In our opinion and to the best of our information and according to the explanations given to us, the saidaccounts together with the notes thereon give the information required by the Banking Regulation Act, 1949as well as the Companies Act, 1956, in the manner so required for banking companies and give a true andfair view in conformity with the accounting principles generally accepted in India:
(a) in the case of the Balance Sheet, of the state of affairs of the Bank as at September 30, 2006;
(b) in the case of the Profit and Loss Account, of the profit of the Bank for the six months ended on thatdate; and
(c) in the case of the Cash Flow Statement, of the cash flows of the Bank for the six months ended on that date.
For BSR & Co.Chartered Accountants
Akeel MasterPartnerMembership No.: 046768
Mumbai24 October 2006
F-3

ICICI BANK LIMITED
Unconsolidated Balance Sheet as on September 30, 2006
ScheduleAs on
30.09.2006As on
31.03.2006As on
30.09.2005
Rupees in million
CAPITAL AND LIABILITIES
Capital . . . . . . . . . . . . . . . . . . . . . . . . . . . . . . . . . . . . . . . . . . 1 12,429.2 12,398.3 10,909.2Reserves and Surplus . . . . . . . . . . . . . . . . . . . . . . . . . . . . . . . 2 226,574.7 213,161.6 129,753.8Deposits . . . . . . . . . . . . . . . . . . . . . . . . . . . . . . . . . . . . . . . . . 3 1,894,993.7 1,650,831.7 1,204,523.4Borrowings . . . . . . . . . . . . . . . . . . . . . . . . . . . . . . . . . . . . . . . 4 360,064.2 385,219.1 341,186.0Other liabilities and provisions . . . . . . . . . . . . . . . . . . . . . . . 5 329,663.6 252,278.8 205,812.4
TOTAL CAPITAL AND LIABILITIES . . . . . . . . . . . . . . 2,823,725.4 2,513,889.5 1,892,184.8
ASSETS
Cash and balance with Reserve Bank of India . . . . . . . . . . . . 6 145,094.3 89,343.7 79,324.0Balances with banks and money at call and short notice . . . . 7 93,156.0 81,058.5 50,554.4Investments . . . . . . . . . . . . . . . . . . . . . . . . . . . . . . . . . . . . . . 8 829,922.9 715,473.9 553,172.9Advances . . . . . . . . . . . . . . . . . . . . . . . . . . . . . . . . . . . . . . . . 9 1,554,034.9 1,461,631.1 1,070,709.7Fixed assets . . . . . . . . . . . . . . . . . . . . . . . . . . . . . . . . . . . . . . 10 39,234.8 39,807.1 39,600.6Other assets . . . . . . . . . . . . . . . . . . . . . . . . . . . . . . . . . . . . . . 11 162,282.5 126,575.2 98,823.2
TOTAL ASSETS . . . . . . . . . . . . . . . . . . . . . . . . . . . . . . . . . 2,823,725.4 2,513,889.5 1,892,184.8
Contingent liabilities . . . . . . . . . . . . . . . . . . . . . . . . . . . . . . . 12 4,653,576.7 3,950,336.7 3,109,852.1Bills for collection . . . . . . . . . . . . . . . . . . . . . . . . . . . . . . . . . 35,579.4 43,384.6 32,425.1Significant accounting policies and notes to accounts . . . . . . 18
The schedules referred to above form an integral part of the Balance Sheet.
As per our Report of even date
For and on behalf of the Board of Directors
For BSR & Co. N. Vaghul K. V. Kamath Lalita D. GupteChartered Accountants Chairman Managing Director & CEO Joint Managing Director
Akeel Master Kalpana Morparia Chanda D. Kochhar Nachiket MorPartner Joint Managing Director Deputy Managing Director Deputy Managing Director
Membership No.: 046768Vishakha Mulye Jyotin Mehta Rakesh Jha
Chief Financial Officer& Treasurer
General Manager &Company Secretary
General Manager
Place: MumbaiDate : October 24, 2006
F-4

ICICI BANK LIMITED
Unconsolidated Profit and Loss Account for the period ended September 30, 2006
ScheduleHalf year ended
30.09.2006Year ended31.03.2006
Half year ended30.09.2005
Rupees in millionI. INCOME
Interest earned . . . . . . . . . . . . . . . . . . . . . . . . . . . . . . . 13 105,080.6 143,061.3 64,453.2Other income . . . . . . . . . . . . . . . . . . . . . . . . . . . . . . . . 14 28,476.9 49,831.4 22,020.5
TOTAL INCOME . . . . . . . . . . . . . . . . . . . . . . . . . . . . . . . 133,557.5 192,892.7 86,473.7
II. EXPENDITUREInterest expended . . . . . . . . . . . . . . . . . . . . . . . . . . . . . 15 74,557.9 95,974.5 44,063.6Operating expenses . . . . . . . . . . . . . . . . . . . . . . . . . . . 16 30,567.2 50,011.5 22,261.7Provisions and contingencies . . . . . . . . . . . . . . . . . . . 17 14,682.2 21,506.0 9,047.8
TOTAL EXPENDITURE . . . . . . . . . . . . . . . . . . . . . . . . . 119,807.3 167,492.0 75,373.1
III. PROFIT/LOSSNet profit for the period/year . . . . . . . . . . . . . . . . . . . 13,750.2 25,400.7 11,100.6Profit brought forward . . . . . . . . . . . . . . . . . . . . . . . . . 2,934.4 1,882.2 1,882.2
TOTAL PROFIT / (LOSS) . . . . . . . . . . . . . . . . . . . . . . . . 16,684.6 27,282.9 12,982.8
IV. APPROPRIATIONS/TRANSFERSTransfer to Statutory Reserve . . . . . . . . . . . . . . . . . . . — 6,360.0 —Transfer to Reserve fund . . . . . . . . . . . . . . . . . . . . . . . — 0.2 —Transfer to Capital Reserve . . . . . . . . . . . . . . . . . . . . . — 680.0 —Transfer to Investment Fluctuation Reserve . . . . . . . . — 5,900.0 —Transfer from Investment Fluctuation Reserve . . . . . . — (13,203.4) —Transfer to Special Reserve . . . . . . . . . . . . . . . . . . . . . — 2,750.0 —Transfer to Revenue and other reserves . . . . . . . . . . . — 13,203.4 —Proposed equity share dividend . . . . . . . . . . . . . . . . . . 19.0 7,593.3 29.8Proposed preference share dividend . . . . . . . . . . . . . . — — —Corporate dividend tax . . . . . . . . . . . . . . . . . . . . . . . . 2.7 1,065.0 4.2Balance carried over to balance sheet . . . . . . . . . . . . . 16,662.9 2,934.4 12,948.8
TOTAL . . . . . . . . . . . . . . . . . . . . . . . . . . . . . . . . . . . . . . . . 16,684.6 27,282.9 12,982.8
Significant accounting policies and notes toaccounts . . . . . . . . . . . . . . . . . . . . . . . . . . . . . . . . . . 18
Earning per share (Refer note B. 4 )Basic (Rs.) . . . . . . . . . . . . . . . . . . . . . . . . . . . . . . . . . . 15.42 32.49 15.02Diluted (Rs.) . . . . . . . . . . . . . . . . . . . . . . . . . . . . . . . . 15.30 32.15 14.87
Face value per share (Rs.) . . . . . . . . . . . . . . . . . . . . . . . . . 10.00 10.00 10.00
The schedules referred to above form an integral part of the Profit and Loss Account.
As per our Report of even date
For and on behalf of the Board of Directors
For BSR & Co. N. Vaghul K. V. Kamath Lalita D. GupteChartered Accountants Chairman Managing Director & CEO Joint Managing Director
Akeel Master Kalpana Morparia Chanda D. Kochhar Nachiket MorPartner Joint Managing Director Deputy Managing Director Deputy Managing Director
Membership No.: 046768Vishakha Mulye Jyotin Mehta Rakesh Jha
Chief Financial Officer& Treasurer
General Manager &Company Secretary
General Manager
Place : MumbaiDate : October 24, 2006
F-5

ICICI BANK LIMITED
Cash Flow Statement for the period ended September 30, 2006
ParticularsHalf year ended
30.09.2006Year ended31.03.2006
Half year ended30.09.2005
Rupees in millionCash flow from operating activitiesNet profit before taxes . . . . . . . . . . . . . . . . . . . . . . . . . . . . . . . . . . . . . . . . . . . . . . . . . . . . . . . 16,511.2 30,966.0 14,131.7
Adjustments for:Depreciation and amortisation . . . . . . . . . . . . . . . . . . . . . . . . . . . . . . . . . . . . . . . . . . . . . . . . 3,978.2 9,021.2 4,425.2Net (appreciation) / depreciation on investments . . . . . . . . . . . . . . . . . . . . . . . . . . . . . . . . . . 4,939.2 8,301.4 3,372.7Provision in respect of non-performing assets (including prudential provision on standard
assets) . . . . . . . . . . . . . . . . . . . . . . . . . . . . . . . . . . . . . . . . . . . . . . . . . . . . . . . . . . . . . . . . . 5,992.4 7,947.2 2,481.7Provision for contingencies & others . . . . . . . . . . . . . . . . . . . . . . . . . . . . . . . . . . . . . . . . . . . 594.5 226.8 228.7Dividend from subsidiaries . . . . . . . . . . . . . . . . . . . . . . . . . . . . . . . . . . . . . . . . . . . . . . . . . . . (1,356.5) (3,386.9) (2,101.4)(Profit)/Loss on sale of fixed assets . . . . . . . . . . . . . . . . . . . . . . . . . . . . . . . . . . . . . . . . . . . . (410.5) (71.2) (43.8)
30,248.5 53,004.5 22,494.8
Adjustments for:(Increase)/decrease in investments . . . . . . . . . . . . . . . . . . . . . . . . . . . . . . . . . . . . . . . . . . . . . 1,129.0 (141,019.2) (57,996.9)(Increase)/decrease in advances . . . . . . . . . . . . . . . . . . . . . . . . . . . . . . . . . . . . . . . . . . . . . . . (97,023.5) (552,112.9) (158,739.1)Increase/(decrease) in borrowings . . . . . . . . . . . . . . . . . . . . . . . . . . . . . . . . . . . . . . . . . . . . . . 1,680.3 65,476.0 24,349.8Increase/(decrease) in deposits . . . . . . . . . . . . . . . . . . . . . . . . . . . . . . . . . . . . . . . . . . . . . . . . 244,162.0 652,643.9 206,335.6(Increase)/decrease in other assets . . . . . . . . . . . . . . . . . . . . . . . . . . . . . . . . . . . . . . . . . . . . . (32,181.1) (36,704.2) (11,942.0)Increase/(decrease) in other liabilities and provisions . . . . . . . . . . . . . . . . . . . . . . . . . . . . . . 28,513.6 13,861.4 (78.8)
146,280.3 2,145.0 1,928.6
Refund/(payment) of direct taxes . . . . . . . . . . . . . . . . . . . . . . . . . . . . . . . . . . . . . . . . . . . . . . (7,156.0) (8,620.2) (2,121.8)
Net cash flow from operating activities (A) . . . . . . . . . . . . . . . . . . . . . . . . . . . . . . . . . . . . 169,372.8 46,529.3 22,301.6
Cash flow from investing activitiesInvestments in subsidiaries and/or joint ventures (including application money) . . . . . . . . . (7,746.6) (8,509.1) (3,377.8)Income received on such investments . . . . . . . . . . . . . . . . . . . . . . . . . . . . . . . . . . . . . . . . . . . 1,356.5 3,386.9 2,101.4Purchase of fixed assets . . . . . . . . . . . . . . . . . . . . . . . . . . . . . . . . . . . . . . . . . . . . . . . . . . . . . (2,508.0) (5,474.0) (2,824.4)Proceeds from sale of fixed assets . . . . . . . . . . . . . . . . . . . . . . . . . . . . . . . . . . . . . . . . . . . . . . 1,297.9 942.8 888.7(Purchase) / sale of held to maturity securities . . . . . . . . . . . . . . . . . . . . . . . . . . . . . . . . . . . . (112,509.5) (69,286.4) 9,730.2
Net cash from investing activities (B) . . . . . . . . . . . . . . . . . . . . . . . . . . . . . . . . . . . . . . . . . (120,109.7) (78,939.8) 6,518.1
Cash flow from financing activitiesProceeds from issue of share capital (other than ESOPs) net of issue expenses . . . . . . . . . . . — 79,039.4 —Amount received on exercise of stock options . . . . . . . . . . . . . . . . . . . . . . . . . . . . . . . . . . . . 612.4 774.4 638.8Net proceeds/(repayment) of bonds (including subordinated debt) . . . . . . . . . . . . . . . . . . . . 26,459.3 869.6 (21,663.3)Dividend and dividend tax paid . . . . . . . . . . . . . . . . . . . . . . . . . . . . . . . . . . . . . . . . . . . . . . . (8,646.0) (7,174.4) (7,174.4)
Net cash generated from financing activities (C) . . . . . . . . . . . . . . . . . . . . . . . . . . . . . . . . 18,425.7 73,509.0 (28,198.9)
Effect of exchange fluctuation on translation reserve (D) . . . . . . . . . . . . . . . . . . . . . . . . . 159.3 4.0 (42.1)
Net increase/(decrease) in cash and cash equivalents (A) + (B) + (C) + (D) . . . . . . . . . . 67,848.1 41,102.5 578.7
Cash and cash equivalents as at 1st April . . . . . . . . . . . . . . . . . . . . . . . . . . . . . . . . . . . . . . 170,402.2 129,299.7 129,299.7
Cash and cash equivalents as at 30th September / 31st March . . . . . . . . . . . . . . . . . . . . 238,250.3 170,402.2 129,878.4
For significant accounting policies and notes to accounts refer schedule 18.
The Schedules referred to above form an integral part of the Balance Sheet.
As per our Report of even date
For and on behalf of the Board of Directors
For BSR & Co. N. Vaghul K. V. Kamath Lalita D. GupteChartered Accountants Chairman Managing Director & CEO Joint Managing Director
Akeel Master Kalpana Morparia Chanda D. Kochhar Nachiket MorPartner Joint Managing Director Deputy Managing Director Deputy Managing Director
Membership No.: 046768Vishakha Mulye Jyotin Mehta Rakesh Jha
Chief Financial Officer& Treasurer
General Manager &Company Secretary
General Manager
Place : MumbaiDate : October 24, 2006
F-6

Schedules forming part of the balance sheet
SCHEDULE 1—CAPITAL
As on30.09.2006
As on31.03.2006
As on30.09.2005
Rupees in million
Authorised capital1,000,000,000 equity shares of Rs. 10 each [March 31, 2006: 1,000,000,000
equity shares of Rs. 10 each; September 30, 2005: 1,000,000,000 equityshares of Rs.10 each] . . . . . . . . . . . . . . . . . . . . . . . . . . . . . . . . . . . . . . . . . . . . 10,000.0 10,000.0 10,000.0
55,000,000 preference shares of Rs. 100 each [March 31, 2006: 55,000,000preference shares of Rs. 100 each; September 30, 2005: 55,000,000preference shares of Rs. 100 each] . . . . . . . . . . . . . . . . . . . . . . . . . . . . . . . . . . 5,500.0 5,500.0 5,500.0
350 preference shares of Rs. 10 million each . . . . . . . . . . . . . . . . . . . . . . . . . . . 3,500.0 3,500.0 3,500.0
Equity share capitalIssued, subscribed and paid-up capital1
889,823,901 equity shares of Rs. 10 each (March 31, 2006: 884,920,650 equityshares; September 30, 2005:736,716,094) . . . . . . . . . . . . . . . . . . . . . . . . . . . . 8,898.2 8,849.2 7,367.2
Add : Issued 3,071,960 equity shares of Rs. 10 each fully paid up (March 31,2006: 4,903,251 equity shares; September 30: 2005 4,165,023 equity shares)on exercise of employee stock options . . . . . . . . . . . . . . . . . . . . . . . . . . . . . . 30.7 49.0 41.6
8,928.9 8,898.2 7,408.8Less : Calls unpaid . . . . . . . . . . . . . . . . . . . . . . . . . . . . . . . . . . . . . . . . . . . . . . . . 0.1 0.3 —Add : Forfeited 67,323 equity shares (March 31, 2006: 67,323 equity shares;
September 30, 2005: 67,323 equity shares) . . . . . . . . . . . . . . . . . . . . . . . . . . . 0.4 0.4 0.4Share capital suspense [net] [Represents application money received for Nil
equity shares (March 31, 2006: Nil equity shares; September 30, 2005: Nil)of Rs.10 each on exercise of employee stock options] . . . . . . . . . . . . . . . . . . — — —
TOTAL EQUITY CAPITAL . . . . . . . . . . . . . . . . . . . . . . . . . . . . . . . . . . . . . . 8,929.2 8,898.3 7,409.2
Preference share capital2
[Represents face value of 350 preference shares of Rs. 10 million eachissued to preference share holders of erstwhile ICICI Limited onamalgamation redeemable at par on April 20, 2018] . . . . . . . . . . . . . . . . . . . . 3,500.0 3,500.0 3,500.0
TOTAL CAPITAL . . . . . . . . . . . . . . . . . . . . . . . . . . . . . . . . . . . . . . . . . . . . . . . 12,429.2 12,398.3 10,909.2
1. Includes:a) 110,967,096 equity shares of Rs.10 each issued vide prospectus dated December 8, 2005.b) 14,285,714 equity shares of Rs.10 each fully paid up issued consequent to exercise of green shoe
option vide prospectus dated December 8, 2005.c) 37,237,460 equity shares of Rs. 10 each issued consequent to issue of 18,618,730 American Depository
Shares vide prospectus dated December 6, 2005.2. For these preference shares, the notification from Ministry of Finance has currently exempted the Bank from
the restriction of Section 12 (1) of the Banking Regulation Act, 1949, which prohibits issue of preferenceshares by banks.
F-7

Schedules forming part of the balance sheet—(Continued)
SCHEDULE 2—RESERVES AND SURPLUS
As on30.09.2006
As on31.03.2006
As on30.09.2005
Rupees in million
I. Statutory reserveOpening balance . . . . . . . . . . . . . . . . . . . . . . . . . . . . . . . . . . . . . . . . . . 20,987.3 14,627.3 14,627.3Additions during the period/year . . . . . . . . . . . . . . . . . . . . . . . . . . . . . — 6,360.0 —Deductions during the period/year . . . . . . . . . . . . . . . . . . . . . . . . . . . . — — —Closing balance . . . . . . . . . . . . . . . . . . . . . . . . . . . . . . . . . . . . . . . . . . . 20,987.3 20,987.3 14,627.3
II. Special reserveOpening balance . . . . . . . . . . . . . . . . . . . . . . . . . . . . . . . . . . . . . . . . . . 14,690.0 11,940.0 11,940.0Additions during the period/year . . . . . . . . . . . . . . . . . . . . . . . . . . . . . — 2,750.0 —Deductions during the period/year . . . . . . . . . . . . . . . . . . . . . . . . . . . . — — —Closing balance . . . . . . . . . . . . . . . . . . . . . . . . . . . . . . . . . . . . . . . . . . . 14,690.0 14,690.0 11,940.0
III. Share premiumOpening balance . . . . . . . . . . . . . . . . . . . . . . . . . . . . . . . . . . . . . . . . . . 118,175.6 39,892.4 39,892.4Additions during the period/year1 . . . . . . . . . . . . . . . . . . . . . . . . . . . . . 581.5 79,157.3 597.3Deductions during the period/year . . . . . . . . . . . . . . . . . . . . . . . . . . . . — 874.1 —Closing balance . . . . . . . . . . . . . . . . . . . . . . . . . . . . . . . . . . . . . . . . . . . 118,757.1 118,175.6 40,489.7
IV. Investment fluctuation reserveOpening balance . . . . . . . . . . . . . . . . . . . . . . . . . . . . . . . . . . . . . . . . . . — 5,160.0 5,160.0Additions during the period/year . . . . . . . . . . . . . . . . . . . . . . . . . . . . . — 8,043.4 2,143.4Deductions during the period/year . . . . . . . . . . . . . . . . . . . . . . . . . . . . — 13,203.4 —Closing balance . . . . . . . . . . . . . . . . . . . . . . . . . . . . . . . . . . . . . . . . . . . — — 7,303.4
V. Capital reserveOpening balance . . . . . . . . . . . . . . . . . . . . . . . . . . . . . . . . . . . . . . . . . . 5,530.0 4,850.0 4,850.0Additions during the period/year . . . . . . . . . . . . . . . . . . . . . . . . . . . . . — 680.0 —Deductions during the period/year . . . . . . . . . . . . . . . . . . . . . . . . . . . . — — —Closing balance . . . . . . . . . . . . . . . . . . . . . . . . . . . . . . . . . . . . . . . . . . . 5,530.0 5,530.0 4,850.0
VI. Foreign currency translation reserve . . . . . . . . . . . . . . . . . . . . . . . . . . . 163.2 4.0 (42.1)VII. Reserve fund
Opening balance . . . . . . . . . . . . . . . . . . . . . . . . . . . . . . . . . . . . . . . . . . 0.2 — —Additions during the period/year . . . . . . . . . . . . . . . . . . . . . . . . . . . . . — 0.2 —Deductions during the period/year . . . . . . . . . . . . . . . . . . . . . . . . . . . . — — —Closing balance . . . . . . . . . . . . . . . . . . . . . . . . . . . . . . . . . . . . . . . . . . . 0.2 0.2 —
VIII. Revenue and other reservesOpening balance . . . . . . . . . . . . . . . . . . . . . . . . . . . . . . . . . . . . . . . . . . 50,840.1 39,780.1 39,780.1Additions during the period/year . . . . . . . . . . . . . . . . . . . . . . . . . . . . . — 13,203.4 —Deductions during the period/year2 . . . . . . . . . . . . . . . . . . . . . . . . . . . . 1,055.9 2,143.4 2,143.4Closing balance . . . . . . . . . . . . . . . . . . . . . . . . . . . . . . . . . . . . . . . . . . . 49,784.0 50,840.1 37,636.7
IX. Balance in profit and loss account . . . . . . . . . . . . . . . . . . . . . . . . . . . . 16,662.9 2,934.4 12,948.8
TOTAL RESERVES AND SURPLUS . . . . . . . . . . . . . . . . . . . . . . . . . . . . 226,574.7 213,161.6 129,753.8
1. Includes Rs. 521.8 million (March 31, 2006: Rs. 725.6 million; September 30, 2005: Rs. 597.3 million) onexercise of employee stock options.
2. Represents transition adjustment on account of first time adoption of Accounting Standard 15 (Revised) on“Employee benefits” issued by The Institute of Chartered Accountants of India.
F-8

Schedules forming part of the balance sheet—(Continued)
SCHEDULE 3—DEPOSITS
As on30.09.2006
As on31.03.2006
As on30.09.2005
Rupees in millionA. I. Demand deposits
i) From banks . . . . . . . . . . . . . . . . . . . . . . . . . . . . . . . . . . . 4,051.0 4,224.0 3,444.4ii) From others . . . . . . . . . . . . . . . . . . . . . . . . . . . . . . . . . . . 144,140.5 161,510.8 122,394.9
II. Savings bank deposits . . . . . . . . . . . . . . . . . . . . . . . . . . . . . . 271,774.4 209,369.8 145,326.2III. Term deposits
i) From banks . . . . . . . . . . . . . . . . . . . . . . . . . . . . . . . . . . . 103,064.9 107,080.4 92,917.6ii) From others . . . . . . . . . . . . . . . . . . . . . . . . . . . . . . . . . . . 1,371,962.9 1,168,646.7 840,440.3
TOTAL DEPOSITS . . . . . . . . . . . . . . . . . . . . . . . . . . . . . . . . . . . . . . . 1,894,993.7 1,650,831.7 1,204,523.4
B. I. Deposits of branches in India . . . . . . . . . . . . . . . . . . . . . . . . . 1,812,333.2 1,565,128.4 1,153,462.2II. Deposits of branches outside India . . . . . . . . . . . . . . . . . . . . . 82,660.5 85,703.3 51,061.2
TOTAL DEPOSITS . . . . . . . . . . . . . . . . . . . . . . . . . . . . . . . . . . . . . . . 1,894,993.7 1,650,831.7 1,204,523.4
SCHEDULE 4—BORROWINGS
As on30.09.2006
As on31.03.2006
As on30.09.2005
Rupees in millionI. Borrowings in India
i) Reserve Bank of India . . . . . . . . . . . . . . . . . . . . . . . . . . . . . . . . . . . — — —ii) Other banks . . . . . . . . . . . . . . . . . . . . . . . . . . . . . . . . . . . . . . . . . . . 36,505.6 39,370.2 31,239.6iii) Other institutions and agencies
a) Government of India . . . . . . . . . . . . . . . . . . . . . . . . . . . . . . . . 2,492.7 2,813.6 3,213.0b) Financial institutions . . . . . . . . . . . . . . . . . . . . . . . . . . . . . . . . 33,566.1 34,372.4 36,158.4
iv) Borrowings in the form ofa) Deposits taken over from erstwhile ICICI Limited . . . . . . . . . 392.6 1,388.5 2,055.9b) Bonds and debentures (excluding subordinated debt)
— Debentures and bonds guaranteed by the Governmentof India . . . . . . . . . . . . . . . . . . . . . . . . . . . . . . . . . . . . . . 14,815.0 14,815.0 14,815.0
— Borrowings under private placement of bonds carryingmaturity of 1 to 30 years from the date of placement . . . 7,920.6 16,179.5 25,256.3
Bonds issued under multiple option/safety bonds series— Regular interest bonds . . . . . . . . . . . . . . . . . . . . . . . . . . . 6,144.5 8,556.6 10,071.6— Deep discount bonds . . . . . . . . . . . . . . . . . . . . . . . . . . . . 4,354.8 4,257.2 4,210.9— Bonds with premium warrants . . . . . . . . . . . . . . . . . . . . — 928.7 861.0— Encash bonds . . . . . . . . . . . . . . . . . . . . . . . . . . . . . . . . . . 431.0 679.2 1,167.2— Tax saving bonds . . . . . . . . . . . . . . . . . . . . . . . . . . . . . . . 30,043.6 46,187.3 53,077.1— Pension bonds . . . . . . . . . . . . . . . . . . . . . . . . . . . . . . . . . 61.5 61.0 60.2
TOTAL . . . . . . . . . . . . . . . . . . . . . . . . . . . . . . . . . . . . . . . . . . . . . . . . . . . . . . 136,728.0 169,609.2 182,186.2
II. Borrowings outside Indiai) From multilateral/bilateral credit agencies (guaranteed by the
Government of India for the equivalent of Rs. 19,971.4 million atSeptember 30, 2006) . . . . . . . . . . . . . . . . . . . . . . . . . . . . . . . . . . . . 24,086.8 23,820.6 23,763.1
ii) From international banks, institutions and consortiums . . . . . . . . . 128,436.4 123,776.5 103,338.8iii) By way of bonds and notes . . . . . . . . . . . . . . . . . . . . . . . . . . . . . . . 70,596.5 68,012.8 31,897.9iv) Other borrowings . . . . . . . . . . . . . . . . . . . . . . . . . . . . . . . . . . . . . . . 216.5 — —
TOTAL . . . . . . . . . . . . . . . . . . . . . . . . . . . . . . . . . . . . . . . . . . . . . . . . . . . . . . 223,336.2 215,609.9 158,999.8
TOTAL BORROWINGS . . . . . . . . . . . . . . . . . . . . . . . . . . . . . . . . . . . . . . . 360,064.2 385,219.1 341,186.0
Secured borrowings in I and II above is Rs. Nil.
F-9

Schedules forming part of the balance sheet—(Continued)
SCHEDULE 5—OTHER LIABILITIES AND PROVISIONS
As on30.09.2006
As on31.03.2006
As on30.09.2005
Rupees in millionI. Bills payable . . . . . . . . . . . . . . . . . . . . . . . . . . . . . . . . . . . . . . . . . . . . . . 50,792.6 33,271.9 30,744.1II. Inter-office adjustments (net) . . . . . . . . . . . . . . . . . . . . . . . . . . . . . . . . . 10,080.8 3,496.5 —III. Interest accrued . . . . . . . . . . . . . . . . . . . . . . . . . . . . . . . . . . . . . . . . . . . . 16,956.3 13,846.5 14,259.4IV. Unsecured redeemable debentures/bonds [Subordinated debt included
in Tier I and Tier II Capital] . . . . . . . . . . . . . . . . . . . . . . . . . . . . . . . . . . 155,948.6 101,443.8 80,520.3V. Others
a) Security deposits from clients . . . . . . . . . . . . . . . . . . . . . . . . . . . . . 10,741.3 7,709.8 10,059.2b) Sundry creditors . . . . . . . . . . . . . . . . . . . . . . . . . . . . . . . . . . . . . . . 62,210.0 58,083.5 54,329.3c) Received for disbursements under special program . . . . . . . . . . . . 2,992.6 3,007.1 2,841.8d) Provision for standard assets . . . . . . . . . . . . . . . . . . . . . . . . . . . . . . 6,978.2 5,638.2 2,658.1e) Other liabilities1 . . . . . . . . . . . . . . . . . . . . . . . . . . . . . . . . . . . . . . . . 12,963.2 25,781.5 10,400.2
TOTAL OTHER LIABILITIES AND PROVISIONS . . . . . . . . . . . . . . . 329,663.6 252,278.8 205,812.4
1. Includes :-
a) Proposed dividend of Rs. Nil [March 31, 2006: Rs. 7,563.5 million; September 30, 2005: Rs. Nil].b) Corporate dividend tax payable of Rs. Nil [March 31, 2006: Rs. 1,060.8 million; September 30, 2005:
Rs. Nil].
SCHEDULE 6—CASH AND BALANCES WITH RESERVE BANK OF INDIA
As on30.09.2006
As on31.03.2006
As on30.09.2005
Rupees in millionI. Cash in hand (including foreign currency notes) . . . . . . . . . . . . . . . . . . . . 20,784.9 12,088.2 8,867.3II. Balances with Reserve Bank of India in current accounts . . . . . . . . . . . . . 124,309.4 77,255.5 70,456.7
TOTAL CASH AND BALANCES WITH RESERVE BANK OFINDIA . . . . . . . . . . . . . . . . . . . . . . . . . . . . . . . . . . . . . . . . . . . . . . . . . . . . . . 145,094.3 89,343.7 79,324.0
SCHEDULE 7—BALANCES WITH BANKS AND MONEY AT CALL AND SHORT NOTICE
As on30.09.2006
As on31.03.2006
As on30.09.2005
Rupees in millionI. In India
i) Balances with banksa) In current accounts . . . . . . . . . . . . . . . . . . . . . . . . . . . . . . . . . . . . 5,473.7 4,402.9 7,093.5b) In other deposit accounts . . . . . . . . . . . . . . . . . . . . . . . . . . . . . . . 4,146.1 6,185.6 3,726.1
ii) Money at call and short noticea) With banks . . . . . . . . . . . . . . . . . . . . . . . . . . . . . . . . . . . . . . . . . . 8,600.0 6,500.0 2,450.0b) With other institutions . . . . . . . . . . . . . . . . . . . . . . . . . . . . . . . . . 1,300.0 3.0 —
TOTAL . . . . . . . . . . . . . . . . . . . . . . . . . . . . . . . . . . . . . . . . . . . . . . . . . . . . . . . . 19,519.8 17,091.5 13,269.6II. Outside India
i) In current accounts . . . . . . . . . . . . . . . . . . . . . . . . . . . . . . . . . . . . . . . . 11,156.5 7,318.9 14,770.6ii) In other deposit accounts . . . . . . . . . . . . . . . . . . . . . . . . . . . . . . . . . . . 49,554.1 48,614.9 22,514.2iii) Money at call and short notice . . . . . . . . . . . . . . . . . . . . . . . . . . . . . . . 12,925.6 8,033.2 —
TOTAL . . . . . . . . . . . . . . . . . . . . . . . . . . . . . . . . . . . . . . . . . . . . . . . . . . . . . . . . 73,636.2 63,967.0 37,284.8
TOTAL BALANCES WITH BANKS AND MONEY AT CALL ANDSHORT NOTICE . . . . . . . . . . . . . . . . . . . . . . . . . . . . . . . . . . . . . . . . . . . . . . 93,156.0 81,058.5 50,554.4
F-10

Schedules forming part of the balance sheet—(Continued)
SCHEDULE 8—INVESTMENTS [net of provisions]As on
30.09.2006As on
31.03.2006As on
30.09.2005
Rupees in millionI. Investments in India
i) Government securities . . . . . . . . . . . . . . . . . . . . . . . . . . . . . . . . . . . 607,140.5 510,744.4 415,365.8ii) Other approved securities . . . . . . . . . . . . . . . . . . . . . . . . . . . . . . . . 0.6 0.6 300.7iii) Shares (includes equity and preference shares) . . . . . . . . . . . . . . . 21,504.0 20,578.5 14,886.4iv) Debentures and bonds . . . . . . . . . . . . . . . . . . . . . . . . . . . . . . . . . . . 24,003.0 18,040.3 15,807.9v) Subsidiaries and/or joint ventures . . . . . . . . . . . . . . . . . . . . . . . . . . 21,131.7 16,691.6 14,297.1vi) Others (commercial paper, mutual fund units, pass through
certificates, security receipts etc.) . . . . . . . . . . . . . . . . . . . . . . . . . . 104,722.0 104,308.9 66,965.3
TOTAL . . . . . . . . . . . . . . . . . . . . . . . . . . . . . . . . . . . . . . . . . . . . . . . . . . . . . . 778,501.8 670,364.3 527,623.2II. Investments outside India
i) Government securities . . . . . . . . . . . . . . . . . . . . . . . . . . . . . . . . . . . 3,198.3 1,342.4 344.6ii) Subsidiaries and/or joint ventures abroad (includes equity and
preference shares) . . . . . . . . . . . . . . . . . . . . . . . . . . . . . . . . . . . . . . 15,222.2 11,915.3 9,119.1iii) Others . . . . . . . . . . . . . . . . . . . . . . . . . . . . . . . . . . . . . . . . . . . . . . . 33,000.6 31,851.9 16,086.0
TOTAL . . . . . . . . . . . . . . . . . . . . . . . . . . . . . . . . . . . . . . . . . . . . . . . . . . . . . . 51,421.1 45,109.6 25,549.7TOTAL INVESTMENTS . . . . . . . . . . . . . . . . . . . . . . . . . . . . . . . . . . . . . . . 829,922.9 715,473.9 553,172.9
SCHEDULE 9—ADVANCES [net of provisions]As on
30.09.2006As on
31.03.2006As on
30.09.2005
Rupees in millionA. i) Bills purchased and discounted . . . . . . . . . . . . . . . . . . . . . . . . . . 41,886.4 63,066.0 62,479.1
ii) Cash credits, overdrafts and loans repayable on demand . . . . . . . 191,882.3 249,328.3 132,477.3iii) Term loans . . . . . . . . . . . . . . . . . . . . . . . . . . . . . . . . . . . . . . . . . . 1,288,213.1 1,117,904.6 852,283.2iv) Securitisation, finance lease and hire purchase receivables1 . . . . 32,053.1 31,332.2 23,470.1
TOTAL . . . . . . . . . . . . . . . . . . . . . . . . . . . . . . . . . . . . . . . . . . . . . . . . 1,554,034.9 1,461,631.1 1,070,709.7
B. i) Secured by tangible assets [includes advances against bookdebt] . . . . . . . . . . . . . . . . . . . . . . . . . . . . . . . . . . . . . . . . . . . . . . . 1,254,096.2 1,199,732.4 889,897.4
ii) Covered by Bank/Government guarantees . . . . . . . . . . . . . . . . . . 9,289.1 13,508.7 25,588.8iii) Unsecured . . . . . . . . . . . . . . . . . . . . . . . . . . . . . . . . . . . . . . . . . . . 290,649.6 248,390.0 155,223.5
TOTAL . . . . . . . . . . . . . . . . . . . . . . . . . . . . . . . . . . . . . . . . . . . . . . . . 1,554,034.9 1,461,631.1 1,070,709.7
C. I. Advances in India . . . . . . . . . . . . . . . . . . . . . . . . . . . . . . . . . . . . . . . . .i) Priority Sector . . . . . . . . . . . . . . . . . . . . . . . . . . . . . . . . . . . . . . . . 401,675.5 426,756.2 280,173.3ii) Public Sector . . . . . . . . . . . . . . . . . . . . . . . . . . . . . . . . . . . . . . . . . 3,077.4 11,572.0 4,134.3iii) Banks . . . . . . . . . . . . . . . . . . . . . . . . . . . . . . . . . . . . . . . . . . . . . . 52.3 48.9 114.5iv) Others . . . . . . . . . . . . . . . . . . . . . . . . . . . . . . . . . . . . . . . . . . . . . . 998,980.7 898,014.7 690,039.1
TOTAL . . . . . . . . . . . . . . . . . . . . . . . . . . . . . . . . . . . . . . . . . . . . . . . . 1,403,785.9 1,336,391.8 974,461.2II. Advances outside India
i) Due from banks . . . . . . . . . . . . . . . . . . . . . . . . . . . . . . . . . . . . . . 23,319.7 18,559.9 57,977.0ii) Due from others
a) Bills purchased and discounted . . . . . . . . . . . . . . . . . . . . . . 20,332.5 43,769.3 —b) Syndicated loans . . . . . . . . . . . . . . . . . . . . . . . . . . . . . . . . . . 80,864.3 29,704.4 18,174.1c) Others . . . . . . . . . . . . . . . . . . . . . . . . . . . . . . . . . . . . . . . . . . 25,732.5 33,205.8 20,097.4
TOTAL . . . . . . . . . . . . . . . . . . . . . . . . . . . . . . . . . . . . . . . . . . . . . . . . 150,249.0 125,239.3 96,248.5TOTAL ADVANCES . . . . . . . . . . . . . . . . . . . . . . . . . . . . . . . . . . . . . 1,554,034.9 1,461,631.1 1,070,709.7
1. Includes receivables under lease amounting to Rs. 611.9 million (March 31, 2006 : Rs. 695.1 million;September 30, 2005: Rs. 802.6 million).
F-11

Schedules forming part of the balance sheet—(Continued)
SCHEDULE 10—FIXED ASSETS
As on30.09.2006
As on31.03.2006
As on30.09.2005
Rupees in million
I. PremisesAt cost as on March 31st of preceding year . . . . . . . . . . . . . . . . . . . . . . . . 20,199.4 18,829.7 18,829.7Additions during the period/year . . . . . . . . . . . . . . . . . . . . . . . . . . . . . . . . 469.0 1,454.2 861.2Deductions during the period/year . . . . . . . . . . . . . . . . . . . . . . . . . . . . . . . (103.6) (84.5) (38.4)Depreciation to date . . . . . . . . . . . . . . . . . . . . . . . . . . . . . . . . . . . . . . . . . . (2,336.8) (2,029.0) (1,780.1)
Net block . . . . . . . . . . . . . . . . . . . . . . . . . . . . . . . . . . . . . . . . . . . . . . . . . . 18,228.0 18,170.4 17,872.4II. Other fixed assets (including furniture and fixtures)
At cost as on March 31st of preceding year . . . . . . . . . . . . . . . . . . . . . . . . 20,531.9 16,303.9 16,303.9Additions during the period/year . . . . . . . . . . . . . . . . . . . . . . . . . . . . . . . . 2,050.6 4,361.2 1,963.3Deductions during the period/year . . . . . . . . . . . . . . . . . . . . . . . . . . . . . . . (313.9) (133.2) (66.8)Depreciation to date . . . . . . . . . . . . . . . . . . . . . . . . . . . . . . . . . . . . . . . . . . (11,793.5) (10,633.4) (9,129.1)
Net block . . . . . . . . . . . . . . . . . . . . . . . . . . . . . . . . . . . . . . . . . . . . . . . . . . 10,475.1 9,898.5 9,071.3III. Assets given on lease
At cost as on March 31st of preceding year . . . . . . . . . . . . . . . . . . . . . . . . 18,954.3 20,122.8 20,122.8Additions during the period/year . . . . . . . . . . . . . . . . . . . . . . . . . . . . . . . . — 0.5 —Deductions during the period/year . . . . . . . . . . . . . . . . . . . . . . . . . . . . . . . (750.6) (1,169.0) (149.4)Depreciation to date, accumulated lease adjustment and provisions . . . . . (7,672.0) (7,216.1) (7,316.5)
Net block . . . . . . . . . . . . . . . . . . . . . . . . . . . . . . . . . . . . . . . . . . . . . . . . . . 10,531.7 11,738.2 12,656.9
TOTAL FIXED ASSETS . . . . . . . . . . . . . . . . . . . . . . . . . . . . . . . . . . . . . . . . . 39,234.8 39,807.1 39,600.6
SCHEDULE 11—OTHER ASSETS
As on30.09.2006
As on31.03.2006
As on30.09.2005
Rupees in million
I. Inter-office adjustments (net) . . . . . . . . . . . . . . . . . . . . . . . . . . . . . . . . . . — — 450.9II. Interest accrued . . . . . . . . . . . . . . . . . . . . . . . . . . . . . . . . . . . . . . . . . . . . . 26,778.5 21,543.1 17,023.8III. Tax paid in advance/tax deducted at source (net) . . . . . . . . . . . . . . . . . . . 32,909.2 28,220.5 25,280.1IV. Stationery and stamps . . . . . . . . . . . . . . . . . . . . . . . . . . . . . . . . . . . . . . . . 2.8 1.7 3.4V. Non-banking assets acquired in satisfaction of claims1 . . . . . . . . . . . . . . 3,367.3 3,627.9 3,296.2VI. Others
a) Advance for capital assets . . . . . . . . . . . . . . . . . . . . . . . . . . . . . . . . . 810.2 1,479.4 690.5b) Outstanding fees and other income . . . . . . . . . . . . . . . . . . . . . . . . . . 4,635.7 3,676.9 3,315.0c) Exchange fluctuation suspense with Government of India . . . . . . . 1.0 25.0 50.4d) Swap suspense . . . . . . . . . . . . . . . . . . . . . . . . . . . . . . . . . . . . . . . . . 91.3 71.6 157.7e) Deposits . . . . . . . . . . . . . . . . . . . . . . . . . . . . . . . . . . . . . . . . . . . . . . 32,988.4 25,767.0 19,924.9f) Deferred tax asset (net) . . . . . . . . . . . . . . . . . . . . . . . . . . . . . . . . . . . 2,294.0 1,642.8 612.5g) Early retirement option expenses not written off . . . . . . . . . . . . . . . 694.0 886.0 1,078.0h) Others . . . . . . . . . . . . . . . . . . . . . . . . . . . . . . . . . . . . . . . . . . . . . . . . 57,710.1 39,633.3 26,939.8
TOTAL OTHER ASSETS . . . . . . . . . . . . . . . . . . . . . . . . . . . . . . . . . . . . . . . 162,282.5 126,575.2 98,823.2
1. Includes certain non-banking assets acquired in satisfaction of claims which are in the process of beingtransferred in the Banks’ name.
F-12
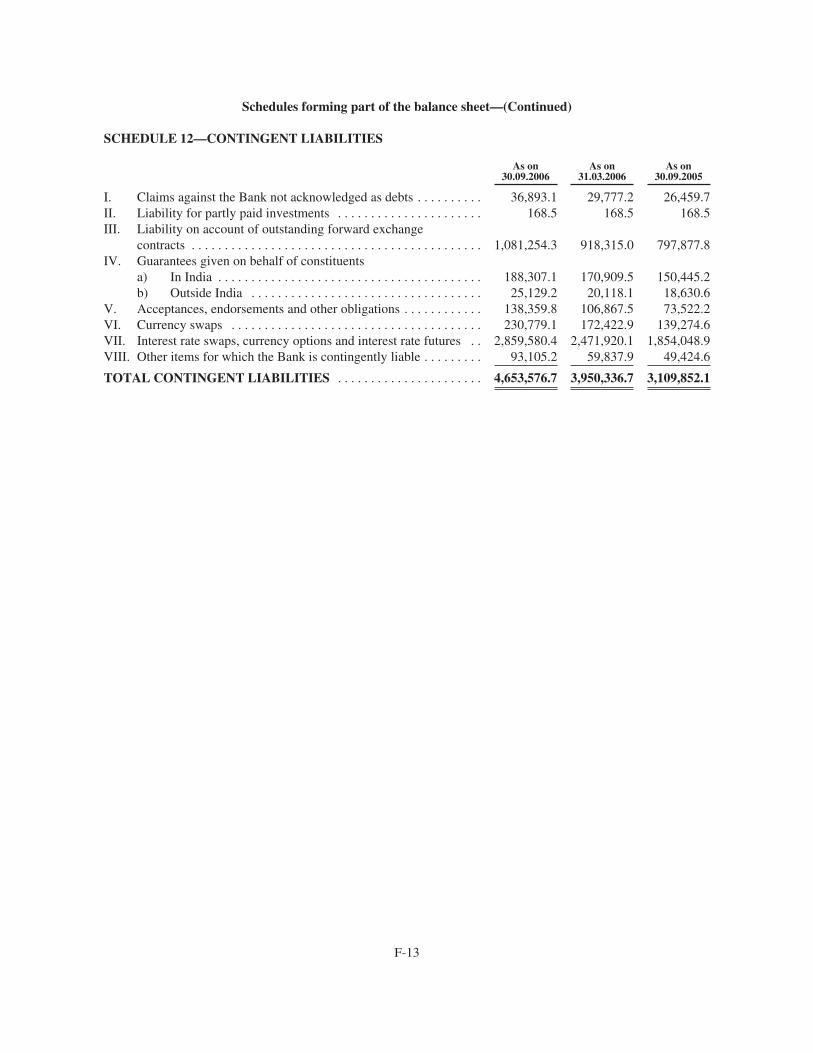
Schedules forming part of the balance sheet—(Continued)
SCHEDULE 12—CONTINGENT LIABILITIES
As on30.09.2006
As on31.03.2006
As on30.09.2005
I. Claims against the Bank not acknowledged as debts . . . . . . . . . . 36,893.1 29,777.2 26,459.7II. Liability for partly paid investments . . . . . . . . . . . . . . . . . . . . . . 168.5 168.5 168.5III. Liability on account of outstanding forward exchange
contracts . . . . . . . . . . . . . . . . . . . . . . . . . . . . . . . . . . . . . . . . . . . . 1,081,254.3 918,315.0 797,877.8IV. Guarantees given on behalf of constituents
a) In India . . . . . . . . . . . . . . . . . . . . . . . . . . . . . . . . . . . . . . . . 188,307.1 170,909.5 150,445.2b) Outside India . . . . . . . . . . . . . . . . . . . . . . . . . . . . . . . . . . . 25,129.2 20,118.1 18,630.6
V. Acceptances, endorsements and other obligations . . . . . . . . . . . . 138,359.8 106,867.5 73,522.2VI. Currency swaps . . . . . . . . . . . . . . . . . . . . . . . . . . . . . . . . . . . . . . 230,779.1 172,422.9 139,274.6VII. Interest rate swaps, currency options and interest rate futures . . 2,859,580.4 2,471,920.1 1,854,048.9VIII. Other items for which the Bank is contingently liable . . . . . . . . . 93,105.2 59,837.9 49,424.6
TOTAL CONTINGENT LIABILITIES . . . . . . . . . . . . . . . . . . . . . . 4,653,576.7 3,950,336.7 3,109,852.1
F-13

Schedules forming part of the profit and loss account
SCHEDULE 13—INTEREST EARNED
Half year ended30.09.2006
Year ended31.03.2006
Half year ended30.09.2005
Rupees in million
I. Interest/discount on advances/bills . . . . . . . . . . . . . . . . . . . . . . . 72,273.6 102,065.9 45,543.2II. Income on investments . . . . . . . . . . . . . . . . . . . . . . . . . . . . . . . . 28,272.6 36,927.6 16,864.5III. Interest on balances with Reserve Bank of India and other
inter-bank funds . . . . . . . . . . . . . . . . . . . . . . . . . . . . . . . . . . . . . . 4,041.0 3,354.6 1,555.6IV. Others1 . . . . . . . . . . . . . . . . . . . . . . . . . . . . . . . . . . . . . . . . . . . . . 493.4 713.2 489.9
TOTAL INTEREST EARNED . . . . . . . . . . . . . . . . . . . . . . . . . . . . 105,080.6 143,061.3 64,453.2
1. Includes interest on income tax refunds of Rs. 279.5 million (March 31, 2006: Rs. 399.8 million;September 30, 2005: Rs. 280.6 million).
SCHEDULE 14—OTHER INCOME
Half year ended30.09.2006
Year ended31.03.2006
Half year ended30.09.2005
Rupees in million
I. Commission, exchange and brokerage . . . . . . . . . . . . . . . . . . . . 19,446.9 30,019.6 12,518.2II. Profit/(Loss) on sale of investments (net) . . . . . . . . . . . . . . . . . . 3,096.7 7,497.5 3,653.3III. Profit/(Loss) on revaluation of investments (net) . . . . . . . . . . . . 395.1 (534.8) (66.4)IV. Profit/(Loss) on sale of land, buildings and other assets
(net)1 . . . . . . . . . . . . . . . . . . . . . . . . . . . . . . . . . . . . . . . . . . . . . . . 410.5 71.2 43.8V. Profit/(Loss) on foreign exchange transactions (net) . . . . . . . . . . 1,597.3 4,730.8 1,830.0VI. Income earned by way of dividends, etc. from subsidiary
companies and/or joint ventures abroad/ in India . . . . . . . . . . . . 1,356.5 3,386.9 2,101.4VII. Miscellaneous income (including lease income) . . . . . . . . . . . . . 2,173.9 4,660.2 1,940.2
TOTAL OTHER INCOME . . . . . . . . . . . . . . . . . . . . . . . . . . . . . . . 28,476.9 49,831.4 22,020.5
1. Includes profit/(loss) on sale of assets given on lease.
SCHEDULE 15—INTEREST EXPENDED
Half year ended30.09.2006
Year ended31.03.2006
Half year ended30.09.2005
Rupees in million
I. Interest on deposits . . . . . . . . . . . . . . . . . . . . . . . . . . . . . . . . . . . 53,384.8 58,366.8 26,289.8II. Interest on Reserve Bank of India/inter-bank borrowings1 . . . . . 5,920.2 9,254.2 3,869.9III. Others (including interest on borrowings of erstwhile ICICI
Limited) . . . . . . . . . . . . . . . . . . . . . . . . . . . . . . . . . . . . . . . . . . . . 15,252.9 28,353.5 13,903.9
TOTAL INTEREST EXPENDED . . . . . . . . . . . . . . . . . . . . . . . . . . 74,557.9 95,974.5 44,063.6
1. Includes interest paid on inter-bank deposits.
F-14

Schedules forming part of the profit and loss account—(Continued)
SCHEDULE 16—OPERATING EXPENSES
Half year ended30.09.2006
Year ended31.03.2006
Half year ended30.09.2005
Rupees in million
I. Payments to and provisions for employees . . . . . . . . . . . . . . . . 7,497.2 10,822.9 4,702.0II. Rent, taxes and lighting . . . . . . . . . . . . . . . . . . . . . . . . . . . . . . . 1,428.3 2,348.0 1,115.0III. Printing and stationery . . . . . . . . . . . . . . . . . . . . . . . . . . . . . . . . 661.5 1,110.4 499.2IV. Advertisement and publicity . . . . . . . . . . . . . . . . . . . . . . . . . . . 907.2 1,855.5 864.3V. Depreciation on Bank’s property (including non-banking
assets) . . . . . . . . . . . . . . . . . . . . . . . . . . . . . . . . . . . . . . . . . . . . . 1,743.7 3,471.7 1,656.9VI. Depreciation (including lease equalisation) on leased assets . . 1,024.4 2,766.3 1,282.4VII. Directors’ fees, allowances and expenses . . . . . . . . . . . . . . . . . 1.5 3.2 1.6VIII. Auditors’ fees and expenses . . . . . . . . . . . . . . . . . . . . . . . . . . . 10.0 18.5 9.3IX. Law charges . . . . . . . . . . . . . . . . . . . . . . . . . . . . . . . . . . . . . . . . 108.7 112.4 49.1X. Postages, telegrams, telephones, etc. . . . . . . . . . . . . . . . . . . . . . 1,337.8 2,157.6 953.8XI. Repairs and maintenance . . . . . . . . . . . . . . . . . . . . . . . . . . . . . . 1,564.3 2,580.7 1,191.6XII. Insurance . . . . . . . . . . . . . . . . . . . . . . . . . . . . . . . . . . . . . . . . . . 776.6 1,080.3 495.7XIII. Direct marketing agency expenses . . . . . . . . . . . . . . . . . . . . . . 7,179.5 11,770.6 5,114.9XIV. Other expenditure . . . . . . . . . . . . . . . . . . . . . . . . . . . . . . . . . . . 6,326.5 9,913.5 4,325.9
TOTAL OPERATING EXPENSES . . . . . . . . . . . . . . . . . . . . . . . . . 30,567.2 50,011.5 22,261.7
SCHEDULE 17—PROVISIONS AND CONTINGENCIES
Half year ended30.09.2006
Year ended31.03.2006
Half year ended30.09.2005
Rupees in million
I. Income tax— Current period tax . . . . . . . . . . . . . . . . . . . . . . . . . . . . . . . . 3,235.5 6,618.7 3,358.6— Deferred tax adjustment . . . . . . . . . . . . . . . . . . . . . . . . . . . . (709.3) (1,346.9) (452.5)— Fringe benefit tax . . . . . . . . . . . . . . . . . . . . . . . . . . . . . . . . . 219.8 263.5 110.0
II. Wealth tax . . . . . . . . . . . . . . . . . . . . . . . . . . . . . . . . . . . . . . . . . . 15.0 30.0 15.0III. Provision for investments (including credit substitutes) (net) . . . 5,334.3 7,766.6 3,306.3IV. Provision for advances (net)1 . . . . . . . . . . . . . . . . . . . . . . . . . . . . 5,992.4 7,947.3 2,481.7V. Others . . . . . . . . . . . . . . . . . . . . . . . . . . . . . . . . . . . . . . . . . . . . . . 594.5 226.8 228.7
TOTAL PROVISIONS AND CONTINGENCIES . . . . . . . . . . . . . 14,682.2 21,506.0 9,047.8
1. Includes provision on standard assets, non-performing advances, non-performing leased assets and otherreceivables.
F-15

SCHEDULE 18—SIGNIFICANT ACCOUNTING POLICIES AND NOTES TO ACCOUNTS
OVERVIEW
ICICI Bank Limited (“ICICI Bank” or “the Bank”), incorporated in Vadodara, India is a publicly held bankingcompany engaged in providing a wide range of banking and financial services including commercial banking andtreasury operations. ICICI Bank is a banking company governed by the Banking Regulation Act, 1949.
Basis of preparation
The financial statements have been prepared in accordance with statutory requirements prescribed under theBanking Regulation Act, 1949. The accounting and reporting policies of ICICI Bank used in the preparation ofthese financial statements conform to Generally Accepted Accounting Principles (“GAAP”) in India, theguidelines issued by Reserve Bank of India (“RBI”) from time to time and practices generally prevalent withinthe banking industry in India. The Bank follows the accrual method of accounting, except where otherwisestated, and the historical cost convention.
The preparation of financial statements requires the management to make estimates and assumptionsconsidered in the reported amounts of assets and liabilities (including contingent liabilities) as of the date of thefinancial statements and the reported income and expenses during the reporting period. Management believesthat the estimates used in the preparation of the financial statements are prudent and reasonable. Future resultscould differ from these estimates.
These financial statements have been prepared in accordance with Accounting Standard 25 on “InterimFinancial Reporting” issued by the Institute of Chartered Accountants of India (“ICAI”).
Equity issue
During the year ended March 31, 2006, the Bank raised equity capital amounting to Rs. 80,006.1 million.The expenses of the issue amounting to Rs. 874.1 million have been charged to the share premium account. Thedetails of the equity capital raised are given in the table below.
Details No. of equity sharesAmount of share
premiumAggregateproceeds
Rupees in million except per share data
Fully paid equity shares of Rs.10 each at a premium ofRs. 515 per share . . . . . . . . . . . . . . . . . . . . . . . . . . . . . . . . . . . . . 67,787,322 34,910.5 35,588.3
Fully paid equity shares of Rs.10 each at a premium ofRs. 488.75 per share1 . . . . . . . . . . . . . . . . . . . . . . . . . . . . . . . . . . 28,894,060 14,122.0 14,410.9
18,618,730 American Depository Share (“ADS”) at a price ofUS$26.75 per share2 . . . . . . . . . . . . . . . . . . . . . . . . . . . . . . . . . . 37,237,460 22,134.6 22,506.9
Fully paid equity shares of Rs.10 each issued by exercise of thegreen shoe option . . . . . . . . . . . . . . . . . . . . . . . . . . . . . . . . . . . . 14,285,714 7,357.1 7,500.0
Total . . . . . . . . . . . . . . . . . . . . . . . . . . . . . . . . . . . . . . . . . . . . . . . . 148,204,556 78,524.2 80,006.1
1. Unpaid calls of Rs. 0.1 million (Unpaid share premium Rs. 32.3 million).2. Includes green shoe option of 2,428,530 ADSs.
A. SIGNIFICANT ACCOUNTING POLICIES
1. Revenue recognition
a) Interest income is recognised in the profit and loss account as it accrues except in the case ofnon-performing assets (“NPAs”) where it is recognised, upon realisation, as per the prudential norms of RBI.
F-16

b) Income from hire purchase operations is accrued by applying the implicit interest rate on outstandingbalances.
c) Income from leases is calculated by applying the interest rate implicit in the lease to the net investmentoutstanding on the lease over the primary lease period. Leases entered into till March 31, 2001 have beenaccounted for as operating leases. Leases effective from April 1, 2001 are accounted as advances at an amountequal to the net investment in the lease. The lease rentals are apportioned between principal and finance incomebased on a pattern reflecting a constant periodic return on the net investment of outstanding in respect of financelease. The principal amount is recognised as repayment of advances and the finance income is reported as interestincome.
d) Income on discounted instruments is recognised over the tenure of the instrument on a constant yieldbasis.
e) Dividend is accounted on an accrual basis when the right to receive the dividend is established.
f) All other fee income is recognised upfront when it becomes due.
g) Net income arising from sell-down of loan assets is recognised upfront in interest income. With effectfrom February 1, 2006, net income arising from securitisation of loan assets is amortised over the life ofsecurities issued or to be issued by the special purpose vehicle/special purpose entity to which the assets are sold.Net income arising from sale of loan assets through direct assignment is recognised at the time of sale.
h) Guarantee commission is recognised on a straight-line basis over the period of the guarantee.
2. Investments
Investments are accounted for in accordance with the extant RBI guidelines on investment classification andvaluation as given below.
a) All investments are classified into ‘Held to Maturity’, ‘Available for Sale’ (AFS) and ‘Held forTrading’. Reclassifications, if any, in any category are accounted for as per RBI guidelines. Under eachclassification, the investments are further categorised as (a) government securities (b) other approvedsecurities (c) shares (d) bonds and debentures, (e) subsidiaries and joint ventures and (f) others.
b) ‘Held to Maturity’ securities are carried at their acquisition cost or at amortised cost, if acquired at apremium over the face value. Any premium over the face value of the securities acquired is amortised overthe remaining period to maturity on the basis of constant effective yield. A provision is made for other thantemporary diminution in the profit and loss account.
c) ‘Available for Sale’ and ‘Held for Trading’ securities are valued periodically as per RBI guidelines.Any premium over the face value of the investments in government securities only, classified as AFS, isamortised over the remaining period to maturity on the basis of constant effective yield. Quoted investmentsare valued based on the trades/quotes on the recognized stock exchanges, SGL account transactions, pricelist of RBI or prices declared by Primary Dealers Association of India jointly with Fixed Income MoneyMarket and Derivatives Association (“FIMMDA”), periodically.
The market/fair value of unquoted SLR securities included in the ‘Available for Sale’ and ‘Held forTrading’ categories is as per the rates published by FIMMDA.
The valuation of non-SLR securities, other than those quoted on the stock exchanges, wherever linked to theYield-to-Maturity (“YTM”) rates, is computed with a mark-up (reflecting associated credit risk) over theYTM rates for government securities published by FIMMDA.
Unquoted equity shares are valued at the book value, if the latest balance sheet is available or at Re. 1 as perRBI guidelines.
F-17

Securities are valued scrip-wise and depreciation/appreciation aggregated for each category. Netappreciation in each category, if any, being unrealised, is ignored, while net depreciation is provided for.
d) Costs including brokerage and commission pertaining to investments, paid at the time of acquisition,are charged to the profit and loss account.
e) Investments in subsidiaries/joint ventures are categorised as ‘Held to Maturity’ in accordance withRBI guidelines.
f) Profit on sale of investments in the ‘Held to Maturity’ category is credited to the profit and lossaccount and is thereafter appropriated (net of applicable taxes and statutory reserve requirements) to CapitalReserve. Profit on sale of investments in ‘Available for Sale’ and ‘Held for Trading’ categories is credited toprofit and loss account.
g) Repurchase and reverse repurchase transactions are accounted for in accordance with the extant RBIguidelines.
h) Broken period interest on debt instruments is treated as a revenue item.
i) At the end of each reporting period, security receipts issued by the asset reconstruction company arevalued in accordance with the guidelines applicable to non-SLR instruments prescribed by RBI from time totime. Accordingly, in case where the security receipts issued by the asset reconstruction company arelimited to the actual realisation of the financial assets assigned to the instruments in the concerned scheme,the Bank reckons the Net Asset Value (“NAV”), obtained from the asset reconstruction company from timeto time, for valuation of such investments at each reporting period / year end.
j) The Bank follows trade date method for accounting of its investments.
3. Provisions / Write-offs on loans and other credit facilities
a) All credit exposures are classified as per RBI guidelines, into performing and non-performing assets(“NPAs”). Further, NPAs are classified into sub-standard, doubtful and loss assets based on the criteria stipulatedby RBI. In the case of corporate loans provisions are made for sub-standard and doubtful assets at ratesprescribed by RBI. Loss assets and unsecured portion of doubtful assets are provided / written off as per theextant RBI guidelines. Subject to the minimum provisioning levels prescribed by RBI, provision onhomogeneous loans relating to retails assets is assessed on a portfolio level, on the basis of days past due.
b) For restructured / rescheduled assets, provision is made in accordance with the guidelines issued by RBI,which requires the present value of the interest sacrifice be provided at the time of restructuring.
c) In the case of loan accounts classified as NPAs (other than those subjected to restructuring), the accountis upgraded as “standard” account if arrears of interest and principal are fully paid by the borrower.
In respect of non-performing loan accounts subjected to restructuring, the account is upgraded to standardonly after the specified period i.e., a period of one year after the date when first payment of interest or ofprincipal, whichever is earlier, falls due, subject to satisfactory performance of the account during the period.
d) Amounts recovered against debts written off in earlier years and provisions no longer considerednecessary in the context of the current status of the borrower are recognised in the profit and loss account.
e) In addition to the specific provision on NPAs, the Bank maintains a general provision on performingloans. The general provision covers the requirements of the RBI guidelines.
f) In addition to the provisions required to be held according to the asset classification status, provisions areheld for individual country exposure (other than for home country). The countries are categorised into seven riskcategories namely insignificant, low, moderate, high, very high, restricted and off-credit and provisioning made
F-18

on exposures exceeding 90 days on a graded scale ranging from 0.25% to 100%. For exposures with contractualmaturity of less than 90 days, 25% of the provision is required to be held. If the country exposure (net) of theBank in respect of each country does not exceed 1% of the total funded assets, no provision is maintained onsuch country exposure.
4. Transfer and servicing of assets
The Bank transfers commercial and consumer loans through securitisation transactions. The transferredloans are de-recognised and gains / losses, net of provisions, are accounted for only if the Bank surrenders therights to benefits specified in the loan contract. Recourse and servicing obligations are reduced from proceeds ofthe sale. Retained beneficial interests in the loans is measured by allocating the carrying value of the loansbetween the assets sold and the retained interest, based on the relative fair value at the date of the securitisation.
In accordance with the RBI guidelines, with effect from February 1, 2006, the Bank accounts for any lossarising on sale immediately at the time of sale and the profit/premium arising on account of sale is amortised overthe life of the securities issued or to be issued by the Special Purpose Vehicle (SPV) to which the assets are sold.
5. Fixed assets and depreciation
Premises and other fixed assets are carried at cost less accumulated depreciation. Cost includes freight, duties,taxes and incidental expenses related to the acquisition and installation of the asset. Depreciation is charged over theestimated useful life of a fixed asset on a straight-line basis. The rates of depreciation for fixed assets, which are notlower than the rates prescribed in Schedule XIV of the Companies Act, 1956, are given below.
Asset Depreciation Rate
Premises owned by the Bank . . . . . . . . . . . . . . . . . . . . . . 1.63%Improvements to leasehold premises . . . . . . . . . . . . . . . . 1.63% or over the lease period, whichever is higherATMs . . . . . . . . . . . . . . . . . . . . . . . . . . . . . . . . . . . . . . . . 12.50%Plant and machinery like air conditioners, photo-
copying machines, etc. . . . . . . . . . . . . . . . . . . . . . . . . . 10.00%Computers . . . . . . . . . . . . . . . . . . . . . . . . . . . . . . . . . . . . 33.33%Card acceptance devices1 . . . . . . . . . . . . . . . . . . . . . . . . . 16.67%Furniture and fixtures . . . . . . . . . . . . . . . . . . . . . . . . . . . . 15.00%Motor vehicles . . . . . . . . . . . . . . . . . . . . . . . . . . . . . . . . . 20.00%Others (including Software and system development
expenses) . . . . . . . . . . . . . . . . . . . . . . . . . . . . . . . . . . . 25.00%
1. EDC terminalsa) Depreciation on leased assets and leasehold improvements is recognised on a straight-line basis using rates
determined with reference to the primary period of lease or rates specified in Schedule XIV to theCompanies Act, 1956, whichever is higher.
b) Assets purchased / sold during the year are depreciated on a pro-rata basis for the actual number of days theasset has been put to use.
c) Items costing up to Rs. 5,000/- are depreciated fully over a period of 12 months from the date of purchase.
6. Foreign currency transactions
Foreign currency income and expenditure items of domestic operations are translated at the exchange ratesprevailing on the date of the transaction. Income and expenditure items of integral foreign operations(representative offices) are translated at weekly average closing rate, and income and expenditure of non-integralforeign operations (foreign branches and offshore banking units) are translated at quarterly average closing rate.
Monetary foreign currency assets and liabilities of domestic and integral foreign operations are translated atclosing exchange rates notified by Foreign Exchange Dealers’ Association of India (“FEDAI”) at the balancesheet date and the resulting profits/losses are included in the profit and loss account.
F-19

Both monetary and non-monetary foreign currency assets and liabilities of non-integral foreign operationsare translated at closing exchange rates notified by FEDAI at the balance sheet date and the resulting profits/losses from exchange differences are accumulated in the foreign currency translation reserve until the disposal ofthe net investment in the non-integral foreign operations.
The premium or discount arising on inception of forward exchange contracts that are entered into toestablish the amount of reporting currency required or available at the settlement date of a transaction isamortised over the life of the contract. All other outstanding forward exchange contracts are revalued at theexchange rates notified by FEDAI for specified maturities and at interpolated rates for contracts of in-betweenmaturities. The resultant gains or losses are recognised in the profit and loss account.
Contingent liabilities on account of guarantees, endorsements and other obligations denominated in foreigncurrencies are disclosed at the closing exchange rates notified by FEDAI at the balance sheet date.
7. Accounting for derivative contracts
The Bank enters into derivative contracts such as foreign currency options, interest rate and currency swapsand cross currency interest rate swaps to hedge on-balance sheet / off-balance sheet assets and liabilities or fortrading purposes.
The swap contracts entered to hedge on-balance sheet assets and liabilities are structured in such a way thatthey bear an opposite and offsetting impact with the underlying on-balance sheet items. The impact of suchderivative instruments is correlated with the movement of underlying assets and accounted pursuant to theprinciples of hedge accounting. Hedged swaps / options are accounted for on an accrual basis.
Foreign currency and rupee derivatives, which are entered for trading purposes, are marked to market andthe resulting gain or loss, (net of provisions, if any) is accounted for in the profit and loss account.
8. Employee Stock Option Scheme (“ESOS”)
Employees Stock Option Scheme (“the scheme “) provides for the grant of equity shares of the Bank to itsemployees. The Scheme provides that employees are granted an option to acquire equity shares of the Bank thatvests in a graded manner. The options may be exercised within a specified period. The Bank follows the intrinsicvalue method to account for its stock-based employees compensation plans. Compensation cost is measured bythe excess, if any, of the fair market price of the underlying stock over the exercise price. The fair market price isthe latest closing price, immediately prior to the date of the Board of Directors meeting in which the options aregranted, on the stock exchange on which the shares of the Bank are listed. If the shares are listed on more thanone stock exchange, then the stock exchange where there is highest trading volume on the said date is considered.
Since the exercise prices of the Bank’s stock options are equal to the fair market price, there is nocompensation cost under the intrinsic value method.
9. Staff Retirement Benefits
Gratuity
ICICI Bank pays gratuity to employees who retire or resign after a minimum period of five years ofcontinuous service. ICICI Bank makes contributions to three separate gratuity funds, for employees inductedfrom erstwhile ICICI, employees inducted from erstwhile Bank of Madura and employees of ICICI Bank otherthan employees inducted from erstwhile ICICI and erstwhile Bank of Madura.
The gratuity funds for employees inducted from erstwhile ICICI and erstwhile Bank of Madura are separategratuity funds managed by ICICI Prudential Life Insurance Company Limited. Actuarial valuation of the gratuity
F-20

liability is determined by an actuary appointed by ICICI Prudential Life Insurance Company Limited. Theinvestments of the funds are made according to rules prescribed by the Government of India. The gratuity fundfor employees of ICICI Bank other than employees inducted from erstwhile ICICI and erstwhile Bank of Madurais administered by the Life Insurance Corporation of India. In accordance with the gratuity fund’s rules, actuarialvaluation of gratuity liability is calculated based on certain assumptions regarding rate of interest, salary growth,mortality and staff turn over as per the projected unit method.
As per the transition provision of AS 15 (Revised) on “Accounting for retirement benefits in financialstatements of employer”, the difference in the liability on account of retirement benefits created by the Bank atMarch 31, 2006 have been included in Schedule 2 (“Reserves and Surplus”).
Superannuation Fund
ICICI Bank contributes 15.0% of the total annual salary of each employee to a superannuation fund forICICI Bank employees. ICICI Bank’s employees get an option on retirement or resignation to receive one-thirdof the total balance and a monthly pension based on the remaining two-third balance. In the event of death of anemployee, his or her beneficiary receives the remaining accumulated two-third balance. ICICI Bank also givescash option to its employees, allowing them to receive the amount contributed by ICICI Bank in their monthlysalary during their employment.
Up to March 31, 2005, the superannuation fund was administered solely by the Life Insurance Corporationof India. Subsequent to March 31, 2005, the fund is being administered by both Life Insurance Corporation ofIndia and ICICI Prudential Life Insurance Company Limited. Employees have the option to retain the existingbalance with Life Insurance Corporation of India or seek a transfer to ICICI Prudential Life Insurance CompanyLimited.
Pension
The Bank provides for pension, a deferred retirement plan covering certain employees. The plan providesfor a pension payment on a monthly basis to these employees on their retirement based on the respectiveemployee’s salary and years of employment with the Bank. Employees covered by the pension plan are noteligible for benefits under the provident fund plan, a defined contribution plan. The pension plan pertains to Bankof Madura which was merged with ICICI Bank with effect from March, 2001.
Provident Fund
ICICI Bank is statutorily required to maintain a provident fund as a part of its retirement benefits to itsemployees. There are separate provident funds for employees inducted from erstwhile Bank of Madura (otherthan those employees who have opted for pensions), and for other employees of ICICI Bank. These funds aremanaged by in-house trustees. Each employee contributes 12.0% of his or her basic salary (10.0% for clerks andsub-staff of erstwhile Bank of Madura) and ICICI Bank contributes an equal amount to the funds. Theinvestments of the funds are made according to rules prescribed by the Government of India.
Leave encashment
The Bank provides for leave encashment benefit, which is a defined benefit scheme, based on actuarialvaluation as at the balance sheet date conducted by an independent actuary.
10. Income Taxes
Income tax expense is the aggregate amount of current tax, deferred tax and fringe benefit tax charge.Current year taxes are determined in accordance with the Income Tax Act, 1961. Deferred tax adjustmentscomprise of changes in the deferred tax assets or liabilities during the period.
F-21

Deferred tax assets and liabilities are recognised on a prudent basis for the future tax consequences oftiming differences arising between the carrying values of assets and liabilities and their respective tax basis, andcarry forward losses. Deferred tax assets and liabilities are measured using tax rates and tax laws that have beenenacted or substantially enacted at the balance sheet date. The impact of changes in the deferred tax assets andliabilities is recognised in the profit and loss account.
Deferred tax assets are recognised and reassessed at each reporting date, based upon management’sjudgement as to whether realisation is considered certain. Deferred tax assets are recognised on carry forward ofunabsorbed depreciation, tax losses and carry forward capital losses, only if there is virtual certainty that suchdeferred tax asset can be realised against future profits.
11. Impairment of Assets
Fixed assets are reviewed for impairment whenever events or changes in circumstances indicate that thecarrying amount of an asset may not be recoverable. Recoverability of assets to be held and used is measured bya comparison of the carrying amount of an asset to future net discounted cash flows expected to be generated bythe asset. If such assets are considered to be impaired, the impairment is recognised by debiting the profit andloss account and is measured by the amount by which the carrying amount of the assets exceeds the fair value ofthe assets.
12. Provisions, contingent liabilities and contingent assets
The Bank estimates the probability of any loss that might be incurred on outcome of contingencies on thebasis of information available up to the date on which the financial statements are prepared. A provision isrecognised when an enterprise has a present obligation as a result of a past event and it is probable that anoutflow of resources will be required to settle the obligation, in respect of which a reliable estimate can be made.Provisions are determined based on management estimate required to settle the obligation at the balance sheetdate, supplemented by experience of similar transactions. These are reviewed at each balance sheet date andadjusted to reflect the current management estimates. In cases where the available information indicates that theloss on the contingency is reasonably possible but the amount of loss cannot be reasonably estimated, adisclosure is made in the financial statements. In case of remote possibility neither provision nor disclosure ismade in the financial statements. The Bank does not account for contingent assets, if any.
13. Earnings Per Share (“EPS”)
Basic earnings per share is calculated by dividing the net profit or loss for the period / year attributable toequity shareholders by the weighted average number of equity shares outstanding during the period / year.
Diluted earning per share reflects the potential dilution that could occur if contracts to issue equity shareswere exercised or converted during the period / year. Diluted earnings per equity share is computed using theweighted average number of equity shares and dilutive potential equity shares outstanding during the period,except where the results are anti-dilutive.
14. Lease Transactions
Lease payments for assets taken on operating lease are recognised as an expense in the profit and lossaccount on a straight-line basis over the lease term.
15. Cash and cash equivalents
Cash and cash equivalents include cash in hand, balances with RBI, balances with other banks and money atcall and short notice.
F-22

NOTES FORMING PART OF THE ACCOUNTS
The following additional disclosures have been made taking into account RBI guidelines in this regard.
1. Capital adequacy ratio
The capital to risk weighted assets ratio (CRAR) as assessed on the basis of the financial statements andguidelines issued by RBI is given in the table below.
As onSeptember 30,
2006
As onMarch 31,
2006
As onSeptember 30,
2005
Rupees in million
Tier I capital . . . . . . . . . . . . . . . . . . . . . . . . . . . . . . . . . . . . . . . . . . . . . 219,203.3 191,815.3 108,317.5(of which Lower Tier I) . . . . . . . . . . . . . . . . . . . . . . . . . . . . . . . . . . . . 22,710.0 — —Tier II capital . . . . . . . . . . . . . . . . . . . . . . . . . . . . . . . . . . . . . . . . . . . . 115,824.9 86,610.9 64,120.2(of which Upper Tier II) . . . . . . . . . . . . . . . . . . . . . . . . . . . . . . . . . . . 12,552.0 — —Total capital . . . . . . . . . . . . . . . . . . . . . . . . . . . . . . . . . . . . . . . . . . . . . 335,028.2 278,426.2 172,437.7Total risk weighted assets . . . . . . . . . . . . . . . . . . . . . . . . . . . . . . . . . . 2,336,998.2 2,085,935.9 1,496,416.2CRAR (%) . . . . . . . . . . . . . . . . . . . . . . . . . . . . . . . . . . . . . . . . . . . . . . 14.34% 13.35% 11.52%CRAR—Tier I capital (%) . . . . . . . . . . . . . . . . . . . . . . . . . . . . . . . . . . 9.38% 9.20% 7.24%CRAR—Tier II capital (%) . . . . . . . . . . . . . . . . . . . . . . . . . . . . . . . . . 4.96% 4.15% 4.28%Amount of subordinated debt raised as Tier II capital/Tier I capital
during the period/year . . . . . . . . . . . . . . . . . . . . . . . . . . . . . . . . . . . 56,612.0 39,730.0 10,250.0
2. Business/information ratios (annualised)
The business/information ratios for the half year ended September 30, 2006, for the year ended March 31,2006 and for the half year ended September 30, 2005 are given in the table below.
Half year endedSeptember 30, 2006
Year endedMarch 31, 2006
Half year endedSeptember 30, 2005
(i) Interest income to working funds1 . . . . . . . . . . . . . . . . 7.79% 7.30% 7.29%(ii) Non-interest income to working funds1 . . . . . . . . . . . . 2.11% 2.54% 2.49%(iii) Operating profit to working funds1 . . . . . . . . . . . . . . . . 2.11% 2.39% 2.28%(iv) Return on assets2 . . . . . . . . . . . . . . . . . . . . . . . . . . . . . . 1.02% 1.30% 1.26%(v) Profit per employee (Rs. in million) . . . . . . . . . . . . . . . 0.9 1.0 1.0
1. For the purpose of computing the ratios, working funds represent the average of total assets as reported toRBI under Section 27 of the Banking Regulation Act, 1949.
2. For the purpose of computing the ratio, assets represent average total assets as reported to RBI in Form Xunder Section 27 of the Banking Regulation Act, 1949.
As onSeptember 30, 2006
As onMarch 31, 2006
As onSeptember 30, 2005
Rupees in million
(vi) Business per employee (average deposits plus averageadvances) . . . . . . . . . . . . . . . . . . . . . . . . . . . . . . . . . . . 113.7 90.5 91.1
3. Information about business and geographical segments
• Consumer and Commercial Banking comprising the retail and corporate banking operations of theBank.
• Investment Banking comprising the treasury operations of the Bank.
Inter-segment transactions are generally based on transfer pricing measures as determined by management.Income, expenses, assets and liabilities are either specifically identified with individual segments or are allocatedto segments on a systematic basis.
F-23

Based on such allocations, segmental balance sheet as on September 30, 2006, March 31, 2006 andSeptember 30, 2005 and segmental profit & loss account for the half year ended September 30, 2006, for the yearended March 31, 2006, for the half year ended September 30, 2005 have been prepared.
Business segmental results are given below.
Consumer andcommercial banking Investment banking Total
Particulars
For the halfyear ended
September 30,2006
For the halfyear ended
September 30,2005
For the halfyear ended
September 30,2006
For the halfyear ended
September 30,2005
For the halfyear ended
September 30,2006
For the halfyear ended
September 30,2005
Rupees in million
1. Revenue . . . . . . . . . . . . . . . . 106,977.5 69,752.5 34,915.3 23,439.9 141,892.8 93,192.42. Less: Inter-segment
revenue . . . . . . . . . . . . . . (8,335.3) (6,718.7)3. Total revenue (1)–(2) . . . . . 133,557.5 86,473.74. Operating profit (i.e. profit
before unallocatedexpenses, and tax) . . . . . . 18,836.9 14,292.1 9,787.6 6,048.3 28,624.5 20,340.4
5. Unallocated expenses . . . . . 192.0 192.06. Provisions (net) . . . . . . . . . . 6,759.9 2,061.5 5,161.4 3,955.2 11,921.3 6,016.77. Profit before tax . . . . . . . . 12,077.0 12,230.6 4,626.2 2,093.1 16,511.2 14,131.78. Income tax expenses (net of
deferred tax credit) . . . . . 2,761.0 3,031.19. Net profit(7)-(8) . . . . . . . . . 13,750.2 11,100.610. Segment assets . . . . . . . . . . 1,768,345.0 1,207,334.0 1,019,483.0 657,880.2 2,787,828.0 1,865,214.211. Unallocated assets . . . . . . . . 35,897.4 26,970.612. Total assets (10)+(11) . . . . 2,823,725.4 1,892,184.813. Segment liabilities . . . . . . . . 2,220,137.3 1,440,845.1 603,588.1 451,339.7 2,823,725.4 1,892,184.814. Unallocated liabilities . . . . .15. Total liabilities
(13)+(14) . . . . . . . . . . . . . 2,823,725.4 1,892,184.8
Particulars
For the year ended March 31, 2006
Consumer andcommercial banking Investment banking Total
Rupees in million
1. Revenue . . . . . . . . . . . . . . . . . . . . . . . . . . . . . . . . . . . . . 154,085.3 49,725.0 203,810.32. Less: Inter-segment revenue . . . . . . . . . . . . . . . . . . . . . (10,917.6)3. Total revenue (1)–(2) . . . . . . . . . . . . . . . . . . . . . . . . . . . 192,892.74. Operating profit (i.e. Profit before unallocated
expenses, and tax) . . . . . . . . . . . . . . . . . . . . . . . . . . . . . 33,870.5 13,420.2 47,290.75. Unallocated expenses . . . . . . . . . . . . . . . . . . . . . . . . . . . 384.06. Provisions (net) . . . . . . . . . . . . . . . . . . . . . . . . . . . . . . . 7,320.2 8,620.5 15,940.77. Profit before tax . . . . . . . . . . . . . . . . . . . . . . . . . . . . . . 26,550.3 4,799.7 30,966.08. Income tax expenses (net of deferred tax credit) . . . . . . 5,565.39. Net profit (7)-(8) . . . . . . . . . . . . . . . . . . . . . . . . . . . . . . 25,400.710. Segment assets . . . . . . . . . . . . . . . . . . . . . . . . . . . . . . . . 1,643,838.9 839,301.3 2,483,140.211. Unallocated assets . . . . . . . . . . . . . . . . . . . . . . . . . . . . . 30,749.312. Total assets (10)+(11) . . . . . . . . . . . . . . . . . . . . . . . . . . 2,513,889.513. Segment liabilities . . . . . . . . . . . . . . . . . . . . . . . . . . . . . 1,923,206.7 590,682.8 2,513,889.514. Unallocated liabilities . . . . . . . . . . . . . . . . . . . . . . . . . . —15. Total liabilities (13)+(14) . . . . . . . . . . . . . . . . . . . . . . . 2,513,889.5
F-24

Geographical segments
The Bank reports its operations under the following geographical segments.
• Domestic Operations comprises branches having operations in India.
• Foreign Operations comprises branches having operations outside India and offshore banking unithaving operations in India.
Geographical segmental results are given below.
Particulars Domestic Operations Foreign Operations Total
For the halfyear ended
September 30,2006
For theyear endedMarch 31,
2006
For the halfyear ended
September 30,2006
For theyear endedMarch 31,
2006
For the halfyear ended
September 30,2006
For theyear endedMarch 31,
2006
Rupees in million
1. Revenue . . . . . . . . . . . . 124,845.7 183,348.0 8,711.8 9,544.7 133,557.5 192,892.7
Particulars Domestic Operations Foreign Operations Total
As onSeptember 30,
2006
As onMarch 31,
2006
As onSeptember 30,
2006
As onMarch 31,
2006
As onSeptember 30,
2006
As onMarch 31,
2006
2. Assets . . . . . . . . . . . . . . 2,569,915.8 2,295,744.9 253,809.6 218,144.6 2,823,725.4 2,513,889.5
Hitherto the business operations of the Bank were largely concentrated in India. The assets and income fromforeign operations were not significant to the overall operations of the Bank and have accordingly not beendisclosed for earlier comparative period.
4. Earnings Per Share
Basic and diluted earnings per equity share are computed in accordance with Accounting Standard 20,“Earnings per Share”. Basic earnings per share is computed by dividing net profit after tax by the weightedaverage number of equity shares outstanding during the period / year. Diluted earnings per share is computedusing the weighted average number of equity shares and dilutive potential equity shares outstanding during theperiod / year.
The computation of earnings per share is given below.
Half year endedSeptember 30,
2006
Year endedMarch 31,
2006
Half year endedSeptember 30,
2005
Rupees in million except per share data
Basic (not annualised for the period)Weighted average no. of equity shares outstanding . . . . . . . . . . . . 891,603,833 781,693,773 738,954,333Net profit . . . . . . . . . . . . . . . . . . . . . . . . . . . . . . . . . . . . . . . . . . . . . 13,750.2 25,400.7 11,100.6Basic earnings per share (Rs.) . . . . . . . . . . . . . . . . . . . . . . . . . . . . . 15.42 32.49 15.02Diluted (not annualised for the period)Weighted average no. of equity shares outstanding . . . . . . . . . . . . 898,684,619 789,963,635 746,683,470Net profit . . . . . . . . . . . . . . . . . . . . . . . . . . . . . . . . . . . . . . . . . . . . . 13,750.2 25,400.7 11,100.6Diluted earnings per share (Rs.) . . . . . . . . . . . . . . . . . . . . . . . . . . . 15.30 32.15 14.87Nominal value per share (Rs.) . . . . . . . . . . . . . . . . . . . . . . . . . . . . . 10.00 10.00 10.00
The dilutive impact is due to options granted to employees by the Bank.
F-25

5. Maturity pattern
• In compiling the information of maturity pattern (refer 5. (a), (b) and (c) below), certain estimates andassumptions have been made by the management.
• Assets and liabilities in foreign currency exclude off-balance sheet assets and liabilities.
a) The maturity pattern of assets and liabilities of the Bank as on September 30, 2006 is given below.
Maturity bucketsLoans &
advances1Investmentsecurities1 Deposits1 Borrowings1
Totalforeign
currencyassets
Totalforeign
currencyliabilities
Rupees in million1 to 14 days . . . . . . . . . . . . . . . . . 62,492.2 85,081.3 137,615.6 7,564.5 60,396.5 32,572.215 to 28 days . . . . . . . . . . . . . . . . 19,806.4 51,289.5 63,897.8 3,960.5 11,618.0 9,571.229 days to 3 months . . . . . . . . . . . 92,990.7 82,929.8 260,851.3 19,309.3 30,656.1 34,474.13 to 6 months . . . . . . . . . . . . . . . . 111,312.4 90,828.5 417,473.3 68,151.4 30,492.5 73,515.56 months to 1 year . . . . . . . . . . . . 165,157.7 149,149.0 370,301.4 79,089.0 29,950.3 64,904.41 to 3 years . . . . . . . . . . . . . . . . . . 538,250.6 157,616.8 579,645.2 86,257.1 33,419.3 61,787.33 to 5 years . . . . . . . . . . . . . . . . . . 209,318.4 50,715.3 43,196.7 73,998.8 47,440.2 48,297.5Above 5 years . . . . . . . . . . . . . . . . 354,706.5 162,312.7 22,012.4 21,733.6 79,547.6 16,228.9Total . . . . . . . . . . . . . . . . . . . . . . . 1,554,034.9 829,922.9 1,894,993.7 360,064.2 323,520.0 341,351.1
1. Includes foreign currency balances.
b) The maturity pattern of assets and liabilities of the Bank as on March 31, 2006 is given below.
Maturity bucketsLoans &
advances1Investmentsecurities1 Deposits1 Borrowings1
Totalforeign
currencyassets
Totalforeign
currencyliabilities
Rupees in million1 to 14 days . . . . . . . . . . . . . . . . . 75,450.2 103,983.4 149,071.4 31,237.0 41,679.5 37,847.115 to 28 days . . . . . . . . . . . . . . . . 8,865.2 44,993.6 69,193.3 10,049.4 11,454.3 18,646.829 days to 3 months . . . . . . . . . . . 75,231.3 81,976.1 255,473.5 53,804.3 37,365.6 59,270.53 to 6 months . . . . . . . . . . . . . . . . 89,859.5 64,510.5 231,693.4 46,661.4 32,628.1 28,415.96 months to 1 year . . . . . . . . . . . . 145,066.0 93,267.8 388,402.8 53,160.2 29,919.0 57,175.51 to 3 years . . . . . . . . . . . . . . . . . . 591,575.5 142,607.5 520,604.7 72,646.8 37,734.5 43,054.43 to 5 years . . . . . . . . . . . . . . . . . . 165,878.4 41,030.3 14,002.1 94,981.8 41,477.4 67,547.5Above 5 years . . . . . . . . . . . . . . . . 309,705.0 143,104.7 22,390.5 22,678.2 49,596.3 12,765.4Total . . . . . . . . . . . . . . . . . . . . . . . 1,461,631.1 715,473.9 1,650,831.7 385,219.1 281,854.7 324,723.1
1. Includes foreign currency balances.
c) The maturity pattern of assets and liabilities of the Bank as on September 30, 2005 is given below.
Maturity bucketsLoans &
advances1Investmentsecurities1 Deposits1 Borrowings1
Totalforeign
currencyassets
Totalforeign
currencyliabilities
Rupees in million1 to 14 days . . . . . . . . . . . . . . . . . 80,373.2 49,326.2 119,584.8 21,545.2 31,407.7 23,200.015 to 28 days . . . . . . . . . . . . . . . . 13,130.5 38,025.0 38,795.6 6,114.1 5,543.0 9,320.129 days to 3 months . . . . . . . . . . . 46,990.3 52,386.4 148,434.2 37,286.1 26,244.9 30,911.13 to 6 months . . . . . . . . . . . . . . . . 62,156.0 67,263.6 207,067.9 56,179.6 25,877.8 48,251.86 months to 1 year . . . . . . . . . . . . 101,422.4 64,840.5 228,551.9 50,461.5 15,909.2 31,620.81 to 3 years . . . . . . . . . . . . . . . . . . 369,203.7 116,701.5 431,696.3 73,998.9 29,477.3 27,665.83 to 5 years . . . . . . . . . . . . . . . . . . 147,207.2 37,151.4 21,861.9 71,022.1 38,453.7 40,740.9Above 5 years . . . . . . . . . . . . . . . . 250,226.4 127,478.3 8,530.8 24,578.5 46,396.6 14,536.7Total . . . . . . . . . . . . . . . . . . . . . . . 1,070,709.7 553,172.9 1,204,523.4 341,186.0 219,310.2 226,247.2
1. Includes foreign currency balances.
F-26

6. Related party transactions
The Bank has transactions with its related parties comprising of subsidiaries, associates, joint ventures andkey management personnel. The following are the significant transactions between the Bank and its relatedparties.
Insurance services
During the half year ended September 30, 2006, the Bank paid insurance premium to insurance jointventures amounting to Rs. 540.5 million (March 31, 2006: Rs. 829.6 million, September 30, 2005: Rs. 200.1million). During the half year ended September 30, 2006, the Bank received claims from insurance joint venturesamounting to Rs. 3.8 million (March 31, 2006: Rs. 16.8 million, September 30, 2005: Rs. 0.1 million).
Fees and commission
During the half year ended September 30, 2006, the Bank received fees from its subsidiaries and jointventures amounting to Rs. 1,960.2 million (March 31, 2006: Rs. 2,280.5 million, September 30, 2005: Rs. 525.0million) and commission of Rs. 7.0 million (March 31, 2006: Rs. 9.9 million, September 30, 2005: Rs. 6.1million) on account of guarantees and letters of credit issued for subsidiaries.
Lease of premises and facilities
During the half year ended September 30, 2006, the Bank charged an aggregate amount of Rs. 252.1 million(March 31, 2006: Rs. 443.7 million, September 30, 2005: Rs. 215.5 million) for lease of premises, facilities andother administrative costs to subsidiaries and joint ventures.
Sale/purchase of housing loan portfolio
During the half year ended September 30, 2006, the Bank sold housing loan portfolio to its subsidiaryamounting to Rs. 6,533.9 million (March 31, 2006: Rs. 37,711.0 million, September 30, 2005: Rs. 3,550.0million). During the half year ended September 30, 2006, the Bank purchased housing portfolio from itssubsidiary amounting to Rs. Nil (March 31, 2006: Rs. 18,307.7 million, September 30, 2005: Rs. Nil).
Secondment of employees
During the half year ended September 30, 2006, the Bank received Rs. 5.3 million (March 31, 2006: Rs.3.0 million, September 30, 2005: Rs. 2.3 million) from subsidiaries and joint ventures for secondment ofemployees.
Purchase of investments
During the half year ended September 30, 2006, the Bank purchased certain investments from itssubsidiaries and joint ventures amounting to Rs. 14,547.6 million (March 31, 2006: Rs. 15,255.5 million,September 30, 2005: Rs. 8,941.3 million) and from its associates amounting to Rs. 2,100.0 million (March 31,2006: Rs. Nil, September 30, 2005: Rs. Nil).
Sale of investments
During the half year ended September 30, 2006, the Bank sold certain investments to its subsidiaries andjoint ventures amounting to Rs. 3,947.7 million (March 31, 2006: Rs. 6,757.7 million, September 30, 2005: Rs.5,671.1 million) and to its associates amounting to Rs. Nil (March 31, 2006: Rs. 1,545.0 million, September 30,2005: Rs. 1,545.0 million). On the sales made to subsidiaries and joint ventures, the Bank accounted for a gain ofRs. 78.2 million (March 31, 2006: Gain of Rs. 16.7 million, September 30, 2005: Gain of Rs. 11.7 million) andon the sale made to associates, the Bank accounted for a gain of Rs. Nil (March 31, 2006: Gain of Rs.10.1 million, September 30, 2005: Gain of Rs. 10.1 million).
F-27

Redemption / Buyback and Conversion of investments
During the half year ended September 30, 2006, consideration of Rs. Nil (March 31, 2006: Rs.1,078.9 million, September 30, 2005: Rs. 765.9 million) was received on account of buyback / capital reductionof equity shares by subsidiaries and a gain amounting to Rs. Nil (March 31, 2006: Rs. 620.6 million,September 30, 2005: Rs. 393.0 million) was accounted in the books. Units in associates amounting to Rs.1,296.6 million (March 31, 2006: Rs. 1,162.3 million, September 30, 2005: Rs. 664.0 million) were redeemedduring the half-year.
Reimbursement of expenses
During the half year ended September 30, 2006, the Bank reimbursed expenses to its subsidiaries amountingto Rs. 1,717.9 million (March 31, 2006: Rs. 3,397.8 million, September 30, 2005: Rs. 1,552.9 million).
Brokerage Expenses
During the half year ended September 30, 2006, the Bank paid brokerage to its subsidiary amounting to Rs.30.6 million (March 31, 2006: Rs. 13.6 million, September 30, 2005: Rs. 4.7 million).
Custodial charges income
During the half year ended September 30, 2006, the Bank received custodial charges from its subsidiariesand joint ventures amounting to Rs. 14.5 million (March 31, 2006: Rs. 15.8 million, September 30, 2005: Rs. 5.8million) and associates amounting to Rs. 2.8 million (March 31, 2006: Rs. 5.4 million, September 30, 2005: Rs.4.4 million).
Interest expenses
During the half year ended September 30, 2006, the Bank paid interest to its subsidiaries and joint venturesamounting to Rs. 151.5 million (March 31, 2006: Rs. 384.2 million, September 30, 2005: Rs. 195.4 million) andassociates amounting to Rs. 0.3 million (March 31, 2006: Rs. Nil, September 30, 2005: Rs. Nil).
Interest income
During the half year ended September 30, 2006, the Bank received interest from its subsidiaries and jointventures amounting to Rs. 61.1 million (March 31, 2006: Rs. 613.6 million, September 30, 2005: Rs. 256.7million) and from its key management personnel1 Rs. 0.2 million (March 31, 2006: Rs. 0.5 million,September 30, 2005: Rs. 0.3 million).
Other income
During the half year ended September 30, 2006, the loss on derivative transactions entered into withsubsidiaries and joint ventures was Rs. 132.8 million (March 31, 2006: Gain of Rs. 245.3 million, September 30,2005: Loss of Rs. 192.5 million).
Dividend income
During the half year ended September 30, 2006, the Bank received dividend from its subsidiaries and jointventures amounting to Rs. 1,046.5 million (March 31, 2006: Rs. 1,635.6 million, September 30, 2005: Rs. 917.4million) and from its associates amounting to Rs. 310.1 million (March 31, 2006: Rs. 1,808.2 million,September 30, 2005: Rs. 1,637.4 million).
Dividend paid
During the half year ended September 30, 2006, the Bank paid dividend to its key management personnelamounting to Rs. 4.4 million (March 31, 2006: Rs. 3.2 million, September 30, 2005: Rs. 3.2 million).
F-28

Remuneration to whole-time directors
Remuneration paid to the whole-time directors of the Bank during the half year ended September 30, 2006was Rs. 51.5 million (March 31, 2006: Rs. 75.9 million, September 30, 2005: Rs. 49.0 million).
Lines of credit
As on September 30, 2006, the Bank had issued line of credit to its subsidiaries amounting toRs. 4,592.5 million (March 31, 2006: Rs. 4,461.5 million, September 30, 2005: Rs. 4,405.0).
Letter of Comfort
The Bank has issued letters of comfort on behalf of its foreign subsidiaries namely, ICICI Bank UKLimited, ICICI Bank Eurasia LLC and ICICI Bank Canada Limited. The details of the same are given in the tablebelow.
On behalf of To Purpose
ICICI Bank UK Limited . . . . . . . . . . Financial Services Authority, UK(“FSA”)
To financially support ICICI BankUK Limited to ensure that it meetsall of its financial obligations asthey fall due.
ICICI Bank Canada . . . . . . . . . . . . . . Office of the Superintendent ofFinancial Institutions, Canada(“OSFI”)
To infuse additional capital shouldICICI Bank Canada’s capital fallbelow the minimum requirementand provide ICICI Bank Canadaongoing financial, managerial andoperational support.
ICICI Bank Canada . . . . . . . . . . . . . . Canada Deposit InsuranceCorporation (“CDIC”)
To comply with the Bank Act andthe CDIC regulations or by-lawsthere under and to indemnifyCDIC against all losses, damages,reasonable costs and expensesarising from failure of ICICI BankCanada in performing the same.
ICICI Bank Eurasia LLC . . . . . . . . . . ICICI Bank UK Limited To confirm that ICICI Bank isaware of ICICI Bank UK Limitedgranting short-term money, foreignexchange and derivative lines ofcredit to ICICI Bank EurasiaLimited Liability Company.
F-29

Related party balances
The balances payable to/receivable from subsidiaries/joint ventures/associates/key management personnelincluded in the balance sheet as on September 30, 2006 are given below.
ItemsSubsidiaries/
Joint ventures AssociatesKey management
personnel1 Total
Rupees in million
Deposits with ICICI Bank . . . . . . . . . . . . . . . . . . . . . . . . . 3,662.3 28.1 18.4 3,708.8Deposits of ICICI Bank2 . . . . . . . . . . . . . . . . . . . . . . . . . . 7,346.8 — — 7,346.8Call/ Term money borrowed . . . . . . . . . . . . . . . . . . . . . . . — — — —Advances . . . . . . . . . . . . . . . . . . . . . . . . . . . . . . . . . . . . . . 2,068.8 — 13.8 2,082.6Investments of ICICI Bank . . . . . . . . . . . . . . . . . . . . . . . . 38,650.1 15,242.4 — 53,892.5Investments of related parties in ICICI Bank . . . . . . . . . . 1,091.7 — 5.0 1,096.7Receivables . . . . . . . . . . . . . . . . . . . . . . . . . . . . . . . . . . . . 918.3 2.0 — 920.3Payables . . . . . . . . . . . . . . . . . . . . . . . . . . . . . . . . . . . . . . . 504.0 — — 504.0Repo . . . . . . . . . . . . . . . . . . . . . . . . . . . . . . . . . . . . . . . . . . — — — —Reverse repo . . . . . . . . . . . . . . . . . . . . . . . . . . . . . . . . . . . . 1,820.0 — — 1,820.0Guarantees3 . . . . . . . . . . . . . . . . . . . . . . . . . . . . . . . . . . . . 3,662.2 — — 3,662.2Letters of comfort4 . . . . . . . . . . . . . . . . . . . . . . . . . . . . . . . 43,389.4 — — 43,389.4Swaps/forward contracts . . . . . . . . . . . . . . . . . . . . . . . . . . 189,909.4 — — 189,909.4Participation certificate . . . . . . . . . . . . . . . . . . . . . . . . . . . 3,833.1 — — 3,833.1
1. Whole-time directors and relatives.2. Includes call money lent.3. Includes letter of undertaking.4. Excludes letters of comfort issued on behalf of foreign subsidiaries, details of which are given separately.
The maximum balance payable to/receivable from subsidiaries/joint ventures/associates/key managementpersonnel during the half year ended September 30, 2006 is given below.
ItemsSubsidiaries/
Joint ventures AssociatesKey management
personnel1 Total
Rupees in million
Deposits with ICICI Bank . . . . . . . . . . . . . . . . . . . . . . . 16,238.9 3,148.5 39.8 19,427.2Deposits of ICICI Bank2 . . . . . . . . . . . . . . . . . . . . . . . . 12,537.3 — — 12,537.3Call / Term money borrowed . . . . . . . . . . . . . . . . . . . . . 230.2 — — 230.2Advances . . . . . . . . . . . . . . . . . . . . . . . . . . . . . . . . . . . . 2,243.6 — 15.4 2,259.0Investments of ICICI Bank . . . . . . . . . . . . . . . . . . . . . . 38,650.1 16,539.2 — 55,189.3Investments of related parties in ICICI Bank . . . . . . . . 1,091.7 — 5.4 1,097.1Receivables . . . . . . . . . . . . . . . . . . . . . . . . . . . . . . . . . . 1,181.2 2.0 — 1,183.2Payables . . . . . . . . . . . . . . . . . . . . . . . . . . . . . . . . . . . . . 915.5 — — 915.5Repo . . . . . . . . . . . . . . . . . . . . . . . . . . . . . . . . . . . . . . . . — — — —Reverse repo . . . . . . . . . . . . . . . . . . . . . . . . . . . . . . . . . . 1,880.0 — — 1,880.0Guarantees3 . . . . . . . . . . . . . . . . . . . . . . . . . . . . . . . . . . 3,670.5 — — 3,670.5Letters of comfort4 . . . . . . . . . . . . . . . . . . . . . . . . . . . . . 46,484.5 — — 46,484.5Swaps/forward contracts . . . . . . . . . . . . . . . . . . . . . . . . 189,909.4 — — 189,909.4Participation certificate . . . . . . . . . . . . . . . . . . . . . . . . . 3,837.0 — — 3,837.0
1. Whole-time directors and relatives.2. Includes call money lent.3. Includes letter of undertaking.4. Excludes letters of comfort issued on behalf of foreign subsidiaries, details of which are given separately.
F-30

The balances payable to/ receivable from subsidiaries/joint ventures/associates/key management personnelincluded in the balance sheet as on March 31, 2006 are given below.
ItemsSubsidiaries/
Joint ventures AssociatesKey management
personnel1 Total
Rupees in million
Deposits with ICICI Bank . . . . . . . . . . . . . . . . . . . . . . . 8,734.8 274.9 25.0 9,034.7Deposits of ICICI Bank2 . . . . . . . . . . . . . . . . . . . . . . . . 11,339.7 — — 11,339.7Call/ Term money borrowed . . . . . . . . . . . . . . . . . . . . . — — — —Advances . . . . . . . . . . . . . . . . . . . . . . . . . . . . . . . . . . . . 1,631.9 — 15.4 1,647.3Investments of ICICI Bank . . . . . . . . . . . . . . . . . . . . . . 29,263.2 14,228.5 — 43,491.7Investments of related parties in ICICI Bank . . . . . . . . 447.5 — 4.3 451.8Receivables . . . . . . . . . . . . . . . . . . . . . . . . . . . . . . . . . . 666.0 2.0 — 668.0Payables . . . . . . . . . . . . . . . . . . . . . . . . . . . . . . . . . . . . . 779.2 — — 779.2Repo . . . . . . . . . . . . . . . . . . . . . . . . . . . . . . . . . . . . . . . . — — — —Reverse repo . . . . . . . . . . . . . . . . . . . . . . . . . . . . . . . . . . — — — —Guarantees3 . . . . . . . . . . . . . . . . . . . . . . . . . . . . . . . . . . 3,634.0 — — 3,634.0Letters of comfort4 . . . . . . . . . . . . . . . . . . . . . . . . . . . . . 30,059.6 — — 30,059.6Swaps/forward contracts . . . . . . . . . . . . . . . . . . . . . . . . 148,404.1 — — 148,404.1Participation certificate . . . . . . . . . . . . . . . . . . . . . . . . . 2,320.0 — — 2,320.0
1. Whole-time directors and relatives.2. Includes call money lent.3. Includes letter of undertaking.4. Excludes letters of comfort issued on behalf of foreign subsidiaries, details of which are given separately.
The maximum balance payable to/receivable from subsidiaries/joint ventures/associates/key managementpersonnel during the year ended March 31, 2006 is given below.
ItemsSubsidiaries/
Joint ventures AssociatesKey management
personnel1 Total
Rupees in million
Deposits with ICICI Bank . . . . . . . . . . . . . . . . . . . . . . . . . 11,331.7 2,160.2 46.1 13,538.0Deposits of ICICI Bank2 . . . . . . . . . . . . . . . . . . . . . . . . . . 12,223.9 — — 12,223.9Call/Term money borrowed . . . . . . . . . . . . . . . . . . . . . . . . 7,490.3 — — 7,490.3Advances . . . . . . . . . . . . . . . . . . . . . . . . . . . . . . . . . . . . . . 2,245.8 — 21.2 2,267.0Investments of ICICI Bank . . . . . . . . . . . . . . . . . . . . . . . . 29,960.3 14,726.8 — 44,687.1Investments of related parties in ICICI Bank . . . . . . . . . . 547.1 — 4.4 551.5Receivables . . . . . . . . . . . . . . . . . . . . . . . . . . . . . . . . . . . . 798.4 4.1 — 802.5Payables . . . . . . . . . . . . . . . . . . . . . . . . . . . . . . . . . . . . . . . 3,060.0 0.5 — 3,060.5Repo . . . . . . . . . . . . . . . . . . . . . . . . . . . . . . . . . . . . . . . . . . 400.3 — — 400.3Reverse repo . . . . . . . . . . . . . . . . . . . . . . . . . . . . . . . . . . . . 2,244.7 — — 2,244.7Guarantees3 . . . . . . . . . . . . . . . . . . . . . . . . . . . . . . . . . . . . 5,196.3 — — 5,196.3Letters of comfort4 . . . . . . . . . . . . . . . . . . . . . . . . . . . . . . . 30,815.7 — — 30,815.7Swaps/forward contracts . . . . . . . . . . . . . . . . . . . . . . . . . . 207,739.7 — — 207,739.7Participation certificate . . . . . . . . . . . . . . . . . . . . . . . . . . . 2,320.0 — — 2,320.0
1. Whole-time directors and relatives.2. Includes call money lent.3. Includes letter of undertaking.4. Excludes letters of comfort issued on behalf of foreign subsidiaries, details of which are given separately.
F-31

The balances payable to/receivable from subsidiaries/joint ventures/associates/key management personnelincluded in the balance sheet as on September 30, 2005 are given below.
ItemsSubsidiaries/
Joint ventures AssociatesKey management
personnel1 Total
Rupees in million
Deposits with ICICI Bank . . . . . . . . . . . . . . . . . . . . . . . . . 15,533.6 18.3 34.6 15,586.5Deposits of ICICI Bank2 . . . . . . . . . . . . . . . . . . . . . . . . . . 5,546.5 — — 5,546.5Call / Term money borrowed . . . . . . . . . . . . . . . . . . . . . . . 1,589.3 — — 1,589.3Advances . . . . . . . . . . . . . . . . . . . . . . . . . . . . . . . . . . . . . . 1,246.9 — 16.3 1,263.2Investments of ICICI Bank . . . . . . . . . . . . . . . . . . . . . . . . 24,072.3 14,726.8 — 38,799.1Investments of related parties in ICICI Bank . . . . . . . . . . 3.2 — 4.0 7.2Receivables . . . . . . . . . . . . . . . . . . . . . . . . . . . . . . . . . . . . 361.1 3.3 — 364.4Payables . . . . . . . . . . . . . . . . . . . . . . . . . . . . . . . . . . . . . . . 1,724.6 0.4 — 1,725.0Repo . . . . . . . . . . . . . . . . . . . . . . . . . . . . . . . . . . . . . . . . . . — — — —Reverse repo . . . . . . . . . . . . . . . . . . . . . . . . . . . . . . . . . . . . — — — —Guarantees3 . . . . . . . . . . . . . . . . . . . . . . . . . . . . . . . . . . . . 3,890.9 — — 3,890.9Letters of comfort4 . . . . . . . . . . . . . . . . . . . . . . . . . . . . . . . 30,815.7 — — 30,815.7Swaps/forward contracts . . . . . . . . . . . . . . . . . . . . . . . . . . 138,497.1 — — 138,497.1Participation certificate . . . . . . . . . . . . . . . . . . . . . . . . . . . 2,215.1 — — 2,215.1
1. Whole-time directors and relatives.2. Includes call money lent.3. Includes letter of undertaking.4. Excludes letters of comfort issued on behalf of foreign subsidiaries, details of which are given separately.
The maximum balance payable to/receivable from subsidiaries/joint ventures/associates/key managementpersonnel during the half year ended September 30, 2005 is given below.
ItemsSubsidiaries/
Joint ventures AssociatesKey management
personnel1 Total
Rupees in million
Deposits with ICICI Bank . . . . . . . . . . . . . . . . . . . . . . . . . 15,538.8 2,160.2 46.1 17,745.1Deposits of ICICI Bank2 . . . . . . . . . . . . . . . . . . . . . . . . . . 14,527.1 — — 14,527.1Call/ Term money borrowed . . . . . . . . . . . . . . . . . . . . . . . 2,882.3 — — 2,882.3Advances . . . . . . . . . . . . . . . . . . . . . . . . . . . . . . . . . . . . . . 1,447.8 — 19.7 1,467.5Investments of ICICI Bank . . . . . . . . . . . . . . . . . . . . . . . . 24,072.3 14,726.8 — 38,799.1Investments of related parties in ICICI Bank . . . . . . . . . . 101.7 — 4.0 105.7Receivables . . . . . . . . . . . . . . . . . . . . . . . . . . . . . . . . . . . . 361.2 4.1 — 365.3Payables . . . . . . . . . . . . . . . . . . . . . . . . . . . . . . . . . . . . . . . 1,820.7 0.5 — 1,821.2Repo . . . . . . . . . . . . . . . . . . . . . . . . . . . . . . . . . . . . . . . . . . 400.3 — — 400.3Reverse repo . . . . . . . . . . . . . . . . . . . . . . . . . . . . . . . . . . . . 2,244.7 — — 2,244.7Guarantees3 . . . . . . . . . . . . . . . . . . . . . . . . . . . . . . . . . . . . 5,196.3 — — 5,196.3Letters of comfort4 . . . . . . . . . . . . . . . . . . . . . . . . . . . . . . . 30,815.7 — — 30,815.7Swaps/forward contracts . . . . . . . . . . . . . . . . . . . . . . . . . . 174,463.6 — — 174,463.6Participation certificate . . . . . . . . . . . . . . . . . . . . . . . . . . . 2,215.1 — — 2,215.1
1. Whole-time directors and relatives.2. Includes call money lent.3. Includes letter of undertaking.4. Excludes letters of comfort issued on behalf of foreign subsidiaries, details of which are given separately.
Subsidiaries and joint ventures
ICICI Venture Funds Management Company Limited, ICICI Securities Limited, ICICI Brokerage ServicesLimited, ICICI International Limited, ICICI Trusteeship Services Limited, ICICI Home Finance Company
F-32

Limited, ICICI Investment Management Company Limited, ICICI Securities Holdings Inc., ICICI Securities Inc.,ICICI Bank UK Limited, ICICI Bank Canada, ICICI Prudential Life Insurance Company Limited, ICICILombard General Insurance Company Limited, Prudential ICICI Asset Management Company Limited,Prudential ICICI Trust Limited, ICICI Bank Eurasia Limited Liability Company, TCW/ICICI InvestmentPartners L.L.C and TSI Ventures (India) Private Limited.
Associates
ICICI Equity Fund, ICICI Eco-net Internet and Technology Fund, ICICI Emerging Sectors Fund, ICICIStrategic Investments Fund, ICICI Property Trust.
7. Securitisation
The Bank sells loans through securitisation and direct assignment. The information on securitisation activityof the Bank as an originator for the half year ended September 30, 2006, for the year ended March 31, 2006 andfor the half year ended September 30, 2005 is given in the table below.
Half year endedSeptember 30, 2006
Year endedMarch 31, 2006
Half year endedSeptember 30, 2005
Rupees in million except number of loans securitised
Total number of loan assets securitised . . . . . . . . . . . . . . . . 783,524 909,130 556,829Total book value of loan assets securitised . . . . . . . . . . . . . 45,174.0 94,856.2 61,869.8Sale consideration received for the securitised assets . . . . . 45,625.0 102,856.6 66,791.0Net gain/(loss) on account of securitisation . . . . . . . . . . . . . 260.71 4,032.4 3,053.8
1. Excludes unamortised gain.
As onSeptember 30, 2006
As onMarch 31, 2006
As onSeptember 30, 2005
Rupees in million
Outstanding credit enhancement . . . . . . . . . . . . . . . . . . . . . 17,138.5 16,369.2 11,981.6Outstanding liquidity facility . . . . . . . . . . . . . . . . . . . . . . . . 4,130.4 2,640.4 1,480.6Outstanding servicing liability . . . . . . . . . . . . . . . . . . . . . . . 502.8 695.6 562.7Outstanding subordinate contributions . . . . . . . . . . . . . . . . . 8,091.7 8,369.8 12,515.0
The Bank has also issued credit enhancement in the form of guarantees amounting to Rs. 1,231.9 million ason September 30, 2006 (March 31, 2006: Rs. Nil, September 30, 2005: Rs. Nil).
F-33

8. Staff retirement benefits
Reconciliation of opening and closing balance of the present value of the defined benefit obligation forpension, leave encashment and gratuity benefits is given below.
Half year endedSeptember 30, 2006
Particulars Pension Gratuity
Rupees in million
Opening obligations . . . . . . . . . . . . . . . . . . . . . . . . . . . . . . . . . . . . . . . . . . . . . . . . . . . . . . . . . . 1,038.5 1,001.0Service cost . . . . . . . . . . . . . . . . . . . . . . . . . . . . . . . . . . . . . . . . . . . . . . . . . . . . . . . . . . . . . . . . . 3.4 110.5Interest cost . . . . . . . . . . . . . . . . . . . . . . . . . . . . . . . . . . . . . . . . . . . . . . . . . . . . . . . . . . . . . . . . . 38.9 37.8Actuarial (gain) / loss . . . . . . . . . . . . . . . . . . . . . . . . . . . . . . . . . . . . . . . . . . . . . . . . . . . . . . . . . (58.7) (20.6)Benefits paid . . . . . . . . . . . . . . . . . . . . . . . . . . . . . . . . . . . . . . . . . . . . . . . . . . . . . . . . . . . . . . . . (29.8) (33.1)Obligations as at September 30, 2006 . . . . . . . . . . . . . . . . . . . . . . . . . . . . . . . . . . . . . . . . . . . 992.3 1,095.6
Defined benefit obligation liability at September 30, 2006Opening plans assets, at fair value . . . . . . . . . . . . . . . . . . . . . . . . . . . . . . . . . . . . . . . . . . . . . . . 1,079.5 785.4Expected return on plan assets . . . . . . . . . . . . . . . . . . . . . . . . . . . . . . . . . . . . . . . . . . . . . . . . . . 39.4 31.2Actuarial gain / (loss) . . . . . . . . . . . . . . . . . . . . . . . . . . . . . . . . . . . . . . . . . . . . . . . . . . . . . . . . . (21.3) (37.9)Contributions . . . . . . . . . . . . . . . . . . . . . . . . . . . . . . . . . . . . . . . . . . . . . . . . . . . . . . . . . . . . . . . . 2.1 133.0Benefits paid . . . . . . . . . . . . . . . . . . . . . . . . . . . . . . . . . . . . . . . . . . . . . . . . . . . . . . . . . . . . . . . . (29.8) (33.1)Plans assets at September 30, 2006, at fair value . . . . . . . . . . . . . . . . . . . . . . . . . . . . . . . . . . 1,069.9 878.6
Fair value of plan assets at the end of the period . . . . . . . . . . . . . . . . . . . . . . . . . . . . . . . . . . . . 1,069.9 878.6Present value of the defined benefit obligations at the end of the period . . . . . . . . . . . . . . . . . . 992.3 1,095.6Asset/(liability) at September 30, 2006 . . . . . . . . . . . . . . . . . . . . . . . . . . . . . . . . . . . . . . . . . . 77.6 (217.0)
Cost for the periodService cost . . . . . . . . . . . . . . . . . . . . . . . . . . . . . . . . . . . . . . . . . . . . . . . . . . . . . . . . . . . . . . . . . 3.4 110.5Interest cost . . . . . . . . . . . . . . . . . . . . . . . . . . . . . . . . . . . . . . . . . . . . . . . . . . . . . . . . . . . . . . . . . 38.9 37.8Expected return on plan assets . . . . . . . . . . . . . . . . . . . . . . . . . . . . . . . . . . . . . . . . . . . . . . . . . . (39.4) (31.2)Actuarial (gain)/loss . . . . . . . . . . . . . . . . . . . . . . . . . . . . . . . . . . . . . . . . . . . . . . . . . . . . . . . . . . (37.3) 17.3Net cost . . . . . . . . . . . . . . . . . . . . . . . . . . . . . . . . . . . . . . . . . . . . . . . . . . . . . . . . . . . . . . . . . . . . (34.4) 134.4
Investment details of plan assetsMajority of the plan assets are invested in Government securities and corporate bonds in case
of pension plan and insurer managed funds and special deposit schemes in case of gratuityplan.
AssumptionsInterest rate . . . . . . . . . . . . . . . . . . . . . . . . . . . . . . . . . . . . . . . . . . . . . . . . . . . . . . . . . . . . . . . . . 8.25% 8.25%Salary escalation rate . . . . . . . . . . . . . . . . . . . . . . . . . . . . . . . . . . . . . . . . . . . . . . . . . . . . . . . . . . 7.00% 7.00%Estimated rate of return on plan assets . . . . . . . . . . . . . . . . . . . . . . . . . . . . . . . . . . . . . . . . . . . . 7.50% 7.50%
The estimates of future salary increases, considered in actuarial valuation, take account of inflation,seniority, promotion and other relevant factors.
9. Employee Stock Option Scheme
In terms of the ESOS, as amended, the maximum number of options granted to any eligible employee in afinancial year shall not exceed 0.05% of the issued equity shares of the Bank at the time of grant of the optionsand aggregate of all such options granted to the eligible employees shall not exceed 5% of the aggregate numberof the issued equity shares of the Bank on the date(s) of the grant of options.
In terms of the Scheme, 19,951,279 options (March 31, 2006: 17,362,584 options, September 30, 2005:18,678,337 options) granted to eligible employees were outstanding at September 30, 2006.
F-34

A summary of the status of the Bank’s stock option plan is given below.
Stock options outstanding
Half year endedSeptember 30, 2006
Year endedMarch 31, 2006
Half year endedSeptember 30, 2005
Outstanding at the beginning of the period/year . . . . . . . . . 17,362,584 18,215,335 18,215,335Add: Granted during the period/year . . . . . . . . . . . . . . . . . . 62,67,400 4,981,780 4,976,780Less: Forfeited/lapsed during the period/year . . . . . . . . . . . 606,745 931,280 348,755
Exercised during the period/year1 . . . . . . . . . . . . . . . . 3,071,960 4,903,251 4,165,023Outstanding at the end of the period/year . . . . . . . . . . . . 19,951,279 17,362,584 18,678,337
1. Excludes options exercised but not allotted.
10. Preference shares
Certain government securities amounting to Rs. 2,051.1 million (March 31, 2006: Rs. 2,001.1 million,September 30, 2005: Rs. 1,954.4 million) have been earmarked against redemption of preference share capital,which falls due for redemption on April 20, 2018, as per the original issue terms.
11. Appropriation of net profit
The Bank appropriates net profit only at year-end. Accordingly, the financial statements do not includeappropriations to Statutory Reserve (Rs. 3,437.6 million) and Capital Reserve (Rs. 216.3 million).
12. Transfer to Investment Fluctuation Reserve (“IFR”)
An amount of Rs. 2,143.4 million being the excess balance in Investment Fluctuation Reserve (IFR) accountover the regulatory requirement was transferred to general reserve account during the year ended March 31,2005. RBI has subsequently instructed that this amount should be retained in IFR account itself. Accordingly, thesaid amount was transferred back to IFR account from the general reserve account in the first quarter of the yearended March 31, 2006, making IFR account balance Rs. 7,303.4 million.
RBI required banks to create Investment Fluctuation Reserve aggregating to 5% of their investments infixed income securities (in AFS and Trading Book) over a five-year period starting from March 31, 2002.Accordingly a further amount of Rs. 5,900.0 million was transferred to IFR during the year ended March 31,2006, making the IFR account balance Rs. 13,203.4 million. RBI has vide its circularDBOD.No.BP.BC.38/21.04.141/2005-06 dated October 10, 2005 permitted banks that have maintained capital ofat least 9% of the risk weighted assets for both credit risk and market risk for both held for trading and availablefor sale categories of investments as on March 31, 2006, to transfer the balance in the IFR ‘below the line’ in theProfit and Loss Appropriation Account to Statutory Reserve, General Reserve or balance of Profit & LossAccount.
Pursuant to the above, the entire IFR account balance of Rs. 13,203.4 million has been transferred from IFRto Revenue and other Reserves in the balance sheet during the year ended March 31, 2006.
13. Subordinated debt
a) During the half year ended September 30, 2006, the Bank raised subordinated perpetual debt qualifyingfor Tier I /Tier II amounting to Rs. 56,612.0 million The details of these bonds are given below.
Particulars Date of Issue Coupon Rate (%) Tenure Amount
Rupees in million
Option I . . . . . . . . . . . . . . . . . . . . August 24, 2006 7.25% (semi-annually)1 Perpetual2 15,510.0Total (Tier I) . . . . . . . . . . . . . . . . 15,510.0
F-35

1. Coupon rate of 7.25% payable semi-annually from August 24, 2006 (i) April 30 and October 31 of eachyear, at a fixed rate per annum of 7.25% till October 31, 2016 and (ii) thereafter semi-annually in arrears onApril 30 and October 31 of each year at a variable rate equal to 6-month LIBOR plus 2.94%.
2. Call option exercisable after 10 years i.e. on August 17, 2016 and on every interest payment thereafter(exercisable with RBI approval).
Particulars Date of Issue Coupon Rate (%) Tenure Amount
Rupees in millionTranche 2 Option I . . . . . . . . . . September 13, 2006 9.98% (semi-annually)1 Perpetual2 5,500.0Total (Tier I) . . . . . . . . . . . . . . 5,500.0
1. Coupon rate of 9.98% payable semi-annually for first 10 years, 100 basis points over and above the couponrate of 9.98% i.e. 10.98% payable semi-annually for the balance years, if the call option is not exercised bythe Bank.
2. Call option exercisable after 10 years i.e. on September 13, 2016 and on every interest payment datethereafter (exercisable with RBI approval).
Particulars Date of Issue Coupon Rate (%) Tenure Amount
Rupees in millionTranche 1 Option 1 . . . . . . . . . . . August 9, 2006 10.10% (semi-annually)1 Perpetual2 2,330.0Total (Tier I) . . . . . . . . . . . . . . . 2,330.0
1. Coupon rate of 10.10% payable semi-annually for first 10 years, 100 basis points over and above the couponrate of 10.10% i.e. 11.10% payable semi-annually for the balance years, if the call option is not exercised bythe Bank.
2. Call option exercisable after 10 years i.e. on August 9, 2016 and on every interest payment date thereafter(exercisable with RBI approval).
Particulars Date of Issue Coupon Rate (%) Tenure Amount
Rupees in millionTranche 2 Option 1 . . . . . . . . . . July 17, 2006 9.50% Annual1 15 years2 10,000.0Total (Upper Tier II) . . . . . . . . 10,000.0
1. Coupon rate of 9.50% for first 10 years. For next 5 years, 50 basis points over and above coupon rate of9.50% i.e. 10.00%, if the call option is not exercised by the Bank.
2. Call option after 10 years.
Particulars Date of Issue Coupon Rate (%) Tenure Amount
Rupees in millionTranche 5 Option 1 . . . . . . . . . . June 22, 2006 8.95% Annual1 15 years2 2,552.0Total (Upper Tier II) . . . . . . . . 2,552.0
1. Coupon rate of 8.95% for first 10 years. For next 5 years, 50 basis points over and above coupon rate of8.95% i.e. 9.45%, if the call option is not exercised by the Bank.
2. Call option after 10 years.
Particulars Date of Issue Coupon Rate (%) Tenure Amount
Rupees in millionTranche 1 Option 1 . . . . . . . . . . July 11, 2006 9.00% Annual 10 years 20,000.0Total (Tier II) . . . . . . . . . . . . . 20,000.0
Particulars Date of Issue Coupon Rate (%) Tenure Amount
Rupees in millionTranche 4 Option 1 . . . . . . . . . . May 19, 2006 8.50% Annual 10 years 230.0Tranche 4 Option 2 . . . . . . . . . . May 19, 2006 8.60% Annual 12 years 140.0Tranche 4 Option 3 . . . . . . . . . . May 19, 2006 8.40% Annual 5 years and
11 months 350.0Total (Tier II) . . . . . . . . . . . . . 720.0
F-36

b) During the year ended March 31, 2006, the Bank raised subordinate debt amounting to Rs.39,730.0 million through private placements of bonds. The details of these bonds are given below.
Particulars Date of Issue Coupon Rate (%) Tenure Amount
Rupees in millionTranche 3 Option I . . . . . March 31, 2006 8.83% Annual 10 years and
15 days 2,500.0Tranche 2 Option I . . . . . March 25, 2006 8.80% Annual 9 years 11 months
and 19 days 20,000.0Tranche 1 Option I . . . . . March 14, 2006 8.55% Annual 10 years and
1 month 2,500.0Total (Tier II) . . . . . . . . 25,000.0
Particulars Date of Issue Coupon Rate (%) Tenure Amount
Rupees in millionOption I . . . . . . . . . . . . . February 14, 2006 8.15% Annual 10 years 1,190.0Option II . . . . . . . . . . . . . February 14, 2006 8.25% Annual 15 years 370.0Total (Tier II) . . . . . . . . 1,560.0
Particulars Date of Issue Coupon Rate (%) Tenure Amount
Rupees in millionOption II . . . . . . . . . . . . . December 30, 2005 7.60% (semi-annually) 10 years 1,010.0Option III . . . . . . . . . . . . December 30, 2005 7.75% (semi-annually) 12 years 1,020.0Option IV . . . . . . . . . . . . December 30, 2005 7.80% (semi-annually) 15 years 890.0Total (Tier II) . . . . . . . . 2,920.0
Particulars Date of Issue Coupon Rate (%) Tenure Amount
Rupees in millionOption I . . . . . . . . . . . . . September 28, 2005 1 Yr INBMK1 + 0.50%
(To be reset semi-annually)
5 years and7 months 2,250.0
Option II . . . . . . . . . . . . . September 28, 2005 7.50 % Annual 10 years 2,750.0Total (Tier II) . . . . . . . . 5,000.0
1. INBMK—Indian Benchmark
Particulars Date of Issue Coupon Rate (%) Tenure Amount
Rupees in millionOption I . . . . . . . . . . . . . June 29, 2005 1 Yr INBMK1 + 0.50 %
(To be reset semi-annually)
5 years and10 months 1,100.0
Option II . . . . . . . . . . . . . June 29, 2005 7.25% Annual 5 years and10 months 770.0
Option III . . . . . . . . . . . . June 29, 2005 7.45% Annual 10 years 3,380.0Total (Tier II) . . . . . . . . 5,250.0
1. INBMK—Indian Benchmark
c) During the half year ended September 30, 2005, the Bank raised subordinate debt amounting to Rs.10,250.0 million through private placement of bonds. The details of these bonds are given below.
Particulars Date of Issue Coupon Rate (%) Tenure Amount
Rupees in millionOption I . . . . . . . . . . . . . September 28, 2005 1 Yr INBMK1 + 0.50 %
(To be reset semi-annually)
5 years and7 months 2,250.0
Option III . . . . . . . . . . . . September 28, 2005 7.50% Annual 10 years 2,750.0Total (Tier II) . . . . . . . . 5,000.0
F-37

1. INBMK—Indian Benchmark
Particulars Date of Issue Coupon Rate (%) Tenure Amount
Rupees in million
Option I . . . . . . . . . . . . . June 29, 2005 1 Yr INBMK1 + 0.50 %(To be reset semi-annually)
5 years and10 months 1,100.0
Option II . . . . . . . . . . . . . June 29, 2005 7.25% Annual 5 years and10 months 770.0
Option III . . . . . . . . . . . . June 29, 2005 7.45% Annual 10 years 3,380.0Total (Tier II) . . . . . . . . 5,250.0
1. INBMK—Indian Benchmark.
14. Investments
The details of investments and the movement of provisions held towards depreciation of investments of theBank as on September 30, 2006, March 31, 2006 and September 30, 2005 is given below.
Particulars
As onSeptember 30,
2006
As onMarch 31,
2006
As onSeptember 30,
2005
Rupees in million
(1) Value of Investments(i) Gross value of investments
(a) In India . . . . . . . . . . . . . . . . . . . . . . . . . . . . . . . . . . . . . . . . . . . 783,229.1 675,324.8 533,303.2(b) Outside India . . . . . . . . . . . . . . . . . . . . . . . . . . . . . . . . . . . . . . 51,437.5 45,215.5 25,553.1
(ii) Provisions for depreciation and fair value provision(a) In India . . . . . . . . . . . . . . . . . . . . . . . . . . . . . . . . . . . . . . . . . . . 4,727.3 4,960.5 5,680.0(b) Outside India . . . . . . . . . . . . . . . . . . . . . . . . . . . . . . . . . . . . . . 16.4 105.9 3.4
(iii) Net value of investments(a) In India . . . . . . . . . . . . . . . . . . . . . . . . . . . . . . . . . . . . . . . . . . . 778,501.8 670,364.3 527,623.2(b) Outside India . . . . . . . . . . . . . . . . . . . . . . . . . . . . . . . . . . . . . . 51,421.1 45,109.6 25,549.7
(2) Movement of provisions held towards depreciation on investments
For the halfyear ended
September 30,2006
For theyear endedMarch 31,
2006
For the halfyear ended
September 30,2005
Rupees in million
(i) Opening balance . . . . . . . . . . . . . . . . . . . . . . . . . . . . . . . . . . . . . . . . 5,066.4 6,079.1 6,079.1(ii) Add: Provisions made during the period/year (including utilisation
of fair value provision) . . . . . . . . . . . . . . . . . . . . . . . . . . . . . . . 329.5 692.3 (395.7)(iii) Less: Write-off/ write-back of excess provisions during the period/
year . . . . . . . . . . . . . . . . . . . . . . . . . . . . . . . . . . . . . . . . . . . . . (652.2) (1,705.0) —(iv) Closing balance . . . . . . . . . . . . . . . . . . . . . . . . . . . . . . . . . . . . . . . . 4,743.7 5,066.4 5,683.4
F-38

15. Investment in non-SLR securities
i) Issuer composition of non-SLR investments
a) The issuer composition of non-SLR investments of the Bank as on September 30, 2006 is given below.
No. Issuer AmountExtent of private
placement
Extent of ‘belowinvestment grade’
securities
Extent of‘unrated’securities2
Extent of‘unlisted’securities2
Rupees in million(a) (b) (c) (d)
1 PSUs . . . . . . . . . . . . . . . . . . . . . . . . . . 2,657.9 251.5 32.1 0.5 32.62 Fis . . . . . . . . . . . . . . . . . . . . . . . . . . . . 12,219.1 2,934.3 — 8,034.9 8,034.93 Banks . . . . . . . . . . . . . . . . . . . . . . . . . 24,474.5 5,249.03 1,927.8 8,174.7 11,093.23
4 Private corporates . . . . . . . . . . . . . . . 39,744.4 17,041.7 1,171.0 16,773.3 14,432.15 Subsidiaries/Joint ventures . . . . . . . . 38,650.1 5,066.6 — 150.0 150.06 Others . . . . . . . . . . . . . . . . . . . . . . . . . 1,09,771.9 40,929.5 26,461.9 0.1 —7 Provision held towards
depreciation . . . . . . . . . . . . . . . . . . . . (4,736.1)Total . . . . . . . . . . . . . . . . . . . . . . . . . 222,781.8 71,472.6 29,592.8 33,133.5 33,742.8
1. Amounts reported under columns (a), (b), (c), and (d) above are not mutually exclusive.2. This excludes investments, amounting to Rs. 2,620.3 million, in preference shares of subsidiaries, namely
ICICI Bank UK Limited and ICICI Bank Canada. This also excludes investments in government securitiesRs. 3,196.9 million and certificate of deposit Rs. 1,837.0 million of non-Indian origin made by overseasbranches.
3. Includes Rs. 2,000.0 million of application money towards bonds issued by banks, which were subsequentlyallotted and listed.
b) The issuer composition of non-SLR investments of the Bank as on March 31, 2006 is given below.
No Issuer AmountExtent of private
placement
Extent of ‘belowinvestment grade’
securities
Extent of‘unrated’securities2
Extent of‘unlisted’securities2
Rupees in million(a) (b) (c) (d)
1 PSUs . . . . . . . . . . . . . . . . . . . . . . . . . . 2,875.6 277.5 1,134.3 0.5 32.62 Fis . . . . . . . . . . . . . . . . . . . . . . . . . . . . 9,589.3 920.3 271.2 6,560.5 6,560.53 Banks . . . . . . . . . . . . . . . . . . . . . . . . . . 22,373.4 7,087.2 1,228.0 7,942.8 7,992.94 Private corporates . . . . . . . . . . . . . . . . 43,351.2 17,367.5 2,917.3 17,256.5 16,026.65 Subsidiaries/ Joint ventures . . . . . . . . . 28,607.0 2,704.8 — 150.0 150.06 Others . . . . . . . . . . . . . . . . . . . . . . . . . . 102,976.4 23,422.4 23,422.1 0.3 —7 Provision held towards depreciation . . (5,043.9) — — — —
Total . . . . . . . . . . . . . . . . . . . . . . . . . . 204,729.0 51,779.7 28,972.9 31,910.6 30,762.6
1. Amounts reported under columns (a), (b), (c), and (d) above are not mutually exclusive.2. This excludes investments, amounting to Rs. 2,554.8 million, in preference shares of subsidiaries, namely
ICICI Bank UK Limited and ICICI Bank Canada. This also excludes investments in government securitiesRs. 1,342.3 million and certificate of deposit Rs. 223.1 million of non-Indian origin made by overseasbranches.
F-39

c) The issuer composition of non-SLR investments of the Bank as on September 30, 2005 is given below.
No Issuer AmountExtent of private
placement
Extent of ‘belowinvestment grade’
securities
Extent of‘unrated’securities2
Extent of‘unlisted’securities2
Rupees in million(a) (b) (c) (d)
1 PSUs . . . . . . . . . . . . . . . . . . . . . . . . . . . 1,804.8 1,204.5 32.1 10.5 42.62 Fis . . . . . . . . . . . . . . . . . . . . . . . . . . . . . 9,526.8 8,649.1 132.1 7,210.5 7,386.63 Banks . . . . . . . . . . . . . . . . . . . . . . . . . . . 9,137.7 1,928.0 — 3,215.3 3,265.34 Private corporates . . . . . . . . . . . . . . . . . 37,234.1 21,103.9 209.1 21,735.1 20,338.35 Subsidiaries/Joint ventures . . . . . . . . . . 22,778.3 2,675.1 — 150.0 150.06 Others . . . . . . . . . . . . . . . . . . . . . . . . . . . 62,651.1 25,085.5 25,085.2 241.2 240.97 Provision held towards depreciation . . . (5,626.5) — — — —
Total . . . . . . . . . . . . . . . . . . . . . . . . . . . 137,506.3 60,646.1 25,458.5 32,562.6 31,423.7
1. Amounts reported under columns (a), (b), (c), and (d) above are not mutually exclusive.2. This excludes investments, amounting to Rs. 2,525.1 million, in preference shares of subsidiaries, namely
ICICI Bank UK Limited and ICICI Bank Canada. This also excludes investments in government securitiesRs. 344.1 million of non-Indian origin made by overseas branches.
ii) Non-performing non-SLR investments
The movement in gross non-performing non-SLR investments of the Bank for the half year half endedSeptember 30, 2006, year ended March 31, 2006 and half year ended September 30, 2005 are given below.
ParticularsHalf year ended
September 30, 2006Year ended
March 31, 2006Half year ended
September 30, 2005
Rupees in millionOpening balance . . . . . . . . . . . . . . . . . . . . . . . . . . . . . . . . . . 2,595.9 8,877.3 8,877.3Additions during the period/year . . . . . . . . . . . . . . . . . . . . . 811.7 2,158.0 1,543.0Reduction during the period/year . . . . . . . . . . . . . . . . . . . . . (381.7) (8,439.4) (7,239.0)Closing balance . . . . . . . . . . . . . . . . . . . . . . . . . . . . . . . . . . 3,025.9 2,595.9 3,181.3Total provisions held . . . . . . . . . . . . . . . . . . . . . . . . . . . . . . 1,917.3 1,509.3 2,219.9
16. Repurchase transactions
The details of securities sold and purchased under repos and reverse repos during the half-year endedSeptember 30, 2006, the year ended March 31, 2006 and the half-year ended September 30, 2005.
Minimumoutstanding balance
during thehalf year/year
Maximumoutstanding balance
during thehalf year/year
Daily averageoutstanding balance
during thehalf year/ year
Balanceas on
half year/year end
Rupees in millionHalf year ended September 30, 2006Securities sold under repurchase
transaction . . . . . . . . . . . . . . . . . . . . . . . . — 55,823.8 16,976.3 2,542.5Securities purchased under reverse
repurchase transaction . . . . . . . . . . . . . . . — 5,100.1 194.3 1,958.3
Year ended March 31, 2006Securities sold under repurchase
transaction . . . . . . . . . . . . . . . . . . . . . . . . — 43,134.3 15,296.0 10,000.0Securities purchased under reverse
repurchase transaction . . . . . . . . . . . . . . . — 33,608.7 1,214.9 —
Half year ended September 30, 2005Securities sold under repurchase
transaction . . . . . . . . . . . . . . . . . . . . . . . . — 43,134.3 14,925.0 3,612.0Securities purchased under reverse
repurchase transaction . . . . . . . . . . . . . . . — 33,608.7 1,757.7 —
F-40

Notes: The above figures do not include securities sold and purchased under Liquidity Adjustment Facility(“LAF”) of RBI.
The above figures are for Indian branches only.
17. Lending to sensitive sectors
The Bank has lending to sectors, which are sensitive to asset price fluctuations. The sensitive sectors includecapital market, real estate and commodities.
The position of lending to capital market and commodities sector is given below.
As onSeptember 30,
2006
As onMarch 31,
2006
As onSeptember 30,
2005
Rupees in million
Capital market sectori) Investments made in equity shares . . . . . . . . . . . . . . . . . . . . . . . . . . . 15,741.0 14,453.1 11,155.0ii) Investments in convertible bonds/ convertible debentures . . . . . . . . 500.5 583.8 584.4iii) Investments in units of equity—oriented mutual funds . . . . . . . . . . . 50.6 200.6 2.7iv) Advances against share to individuals for investment in equity
shares (including IPOs /ESOPS), bonds and debentures, units ofequity oriented mutual funds . . . . . . . . . . . . . . . . . . . . . . . . . . . . . . . 7,858.7 5,470.1 4,220.1
v) Secured and unsecured advances to stockbrokers and guaranteesissued on behalf of stockbrokers and market makers1 . . . . . . . . . . . . 14,973.0 7,485.9 8,935.0
Total2 . . . . . . . . . . . . . . . . . . . . . . . . . . . . . . . . . . . . . . . . . . . . . . . . . . . . . 39,123.8 28,193.5 24,897.2vi) Of (v) above, the total finance extended to stockbrokers for margin
trading . . . . . . . . . . . . . . . . . . . . . . . . . . . . . . . . . . . . . . . . . . . . . . . . — — —Commodities sector . . . . . . . . . . . . . . . . . . . . . . . . . . . . . . . . . . . . . . . . . . 39,467.4 29,849.4 16,842.1
1. Represents loans to non-banking financial companies (“NBFCs”), brokers and includes an amount of Rs.66.3 million as on September 30, 2006 (March 31, 2006: Rs. 102.7 million, September 30, 2005: Rs. 102.7million) pertaining to guarantee issued to a corporate for the issue of non-convertible debentures, theproceeds of which have been utilised for acquisition of shares by the corporate and includes Rs.3,040.0 million issued on behalf of a corporate customer to ensure equity capital contribution. (March 31,2006 : Rs. Nil, September 30, 2005 : Rs. Nil).
2. The total does not include exposure in venture capital funds amounting to Rs. 20,931.5 million as ofSeptember 30, 2006 (the total does not include exposure in unregistered venture capital funds March 31,2006: Rs. 16,149.9 million, September 30, 2005: Rs. 16,164.8 million), which forms a part of capital marketexposure.
F-41

The summary of lending to real estate sector is given below.
As onSeptember 30,
2006
As onMarch 31,
2006
As onSeptember 30,
2005
Rupees in million
Real estate sectorI. Direct exposure . . . . . . . . . . . . . . . . . . . . . . . . . . . . . . . . . . . . . . . . . . . 621,019.4 501,514.8 400,274.9i) Residential mortgages, . . . . . . . . . . . . . . . . . . . . . . . . . . . . . . . . . . . . . 514,389.2 431,668.5 327,337.4— of which housing loans up to Rs. 1.5 million . . . . . . . . . . . . . . . . . . 284,542.8 263,796.5 216,055.5ii) Commercial real estate1 . . . . . . . . . . . . . . . . . . . . . . . . . . . . . . . . . . . . 100,546.1 69,846.0 71,319.9iii) Investments in mortgage backed securities (MBS) and other
securitised exposures . . . . . . . . . . . . . . . . . . . . . . . . . . . . . . . . . . . . . . 6,084.1 0.3 1,617.6— a. Residential . . . . . . . . . . . . . . . . . . . . . . . . . . . . . . . . . . . . . . . . . . 6,084.1 0.3 1,617.6— b. Commercial real estate . . . . . . . . . . . . . . . . . . . . . . . . . . . . . . . . . — — —II. Indirect exposure . . . . . . . . . . . . . . . . . . . . . . . . . . . . . . . . . . . . . . . . . 28,508.5 30,135.8 30,879.3Fund based and non-fund based exposures on National Housing Bank
(NHB) and Housing Finance Companies (HFCs) . . . . . . . . . . . . . . . . 12,947.5 13,821.5 6,688.7Others . . . . . . . . . . . . . . . . . . . . . . . . . . . . . . . . . . . . . . . . . . . . . . . . . . . . 15,561.0 16,314.3 24,190.6Total . . . . . . . . . . . . . . . . . . . . . . . . . . . . . . . . . . . . . . . . . . . . . . . . . . . . . 649,527.9 531,650.6 431,154.2
1. Commercial real estate exposure includes loans given to land and building developers for construction,corporates for their real estate requirements and to individuals for non-residential premises.
2. Excludes non-banking assets acquired in satisfaction of claims.
18. Credit exposure
a) As on September 30, 2006, the Bank had no single borrower exposure above 15% and no group borrowerexposure above 40% of capital funds.
b) As on March 31, 2006, the Bank had no single borrower exposure above 15% and no group borrowerexposure above 40% of capital funds.
c) As on September 30, 2005 the Bank had taken single borrower exposure above 15% with the approval ofthe Board of Directors in the cases given below.
Name of Borrower As on September 30, 2005
% to capital funds
Bharat Heavy Electricals Ltd. . . . . . . . . . . . . . . . . . . . . . . . . . . . . . . . . . . . . . . . . . . . . . . . 17.52%Essar Oil Ltd. . . . . . . . . . . . . . . . . . . . . . . . . . . . . . . . . . . . . . . . . . . . . . . . . . . . . . . . . . . . . 16.03%ARCIL . . . . . . . . . . . . . . . . . . . . . . . . . . . . . . . . . . . . . . . . . . . . . . . . . . . . . . . . . . . . . . . . . 16.02%
1. Includes exposure to security receipts issued by ARCIL.
F-42
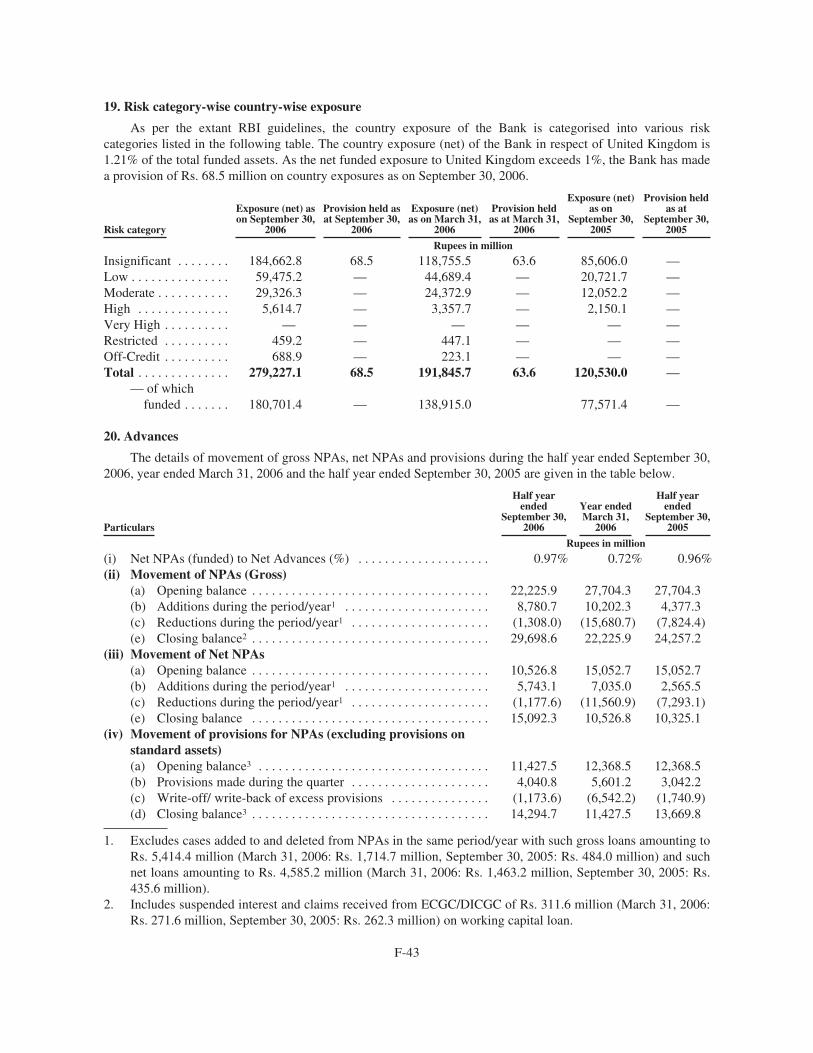
19. Risk category-wise country-wise exposure
As per the extant RBI guidelines, the country exposure of the Bank is categorised into various riskcategories listed in the following table. The country exposure (net) of the Bank in respect of United Kingdom is1.21% of the total funded assets. As the net funded exposure to United Kingdom exceeds 1%, the Bank has madea provision of Rs. 68.5 million on country exposures as on September 30, 2006.
Risk category
Exposure (net) ason September 30,
2006
Provision held asat September 30,
2006
Exposure (net)as on March 31,
2006
Provision heldas at March 31,
2006
Exposure (net)as on
September 30,2005
Provision heldas at
September 30,2005
Rupees in million
Insignificant . . . . . . . . 184,662.8 68.5 118,755.5 63.6 85,606.0 —Low . . . . . . . . . . . . . . . 59,475.2 — 44,689.4 — 20,721.7 —Moderate . . . . . . . . . . . 29,326.3 — 24,372.9 — 12,052.2 —High . . . . . . . . . . . . . . 5,614.7 — 3,357.7 — 2,150.1 —Very High . . . . . . . . . . — — — — — —Restricted . . . . . . . . . . 459.2 — 447.1 — — —Off-Credit . . . . . . . . . . 688.9 — 223.1 — — —Total . . . . . . . . . . . . . . 279,227.1 68.5 191,845.7 63.6 120,530.0 —
— of whichfunded . . . . . . . 180,701.4 — 138,915.0 77,571.4 —
20. Advances
The details of movement of gross NPAs, net NPAs and provisions during the half year ended September 30,2006, year ended March 31, 2006 and the half year ended September 30, 2005 are given in the table below.
Particulars
Half yearended
September 30,2006
Year endedMarch 31,
2006
Half yearended
September 30,2005
Rupees in million
(i) Net NPAs (funded) to Net Advances (%) . . . . . . . . . . . . . . . . . . . . 0.97% 0.72% 0.96%(ii) Movement of NPAs (Gross)
(a) Opening balance . . . . . . . . . . . . . . . . . . . . . . . . . . . . . . . . . . . . 22,225.9 27,704.3 27,704.3(b) Additions during the period/year1 . . . . . . . . . . . . . . . . . . . . . . 8,780.7 10,202.3 4,377.3(c) Reductions during the period/year1 . . . . . . . . . . . . . . . . . . . . . (1,308.0) (15,680.7) (7,824.4)(e) Closing balance2 . . . . . . . . . . . . . . . . . . . . . . . . . . . . . . . . . . . . 29,698.6 22,225.9 24,257.2
(iii) Movement of Net NPAs(a) Opening balance . . . . . . . . . . . . . . . . . . . . . . . . . . . . . . . . . . . . 10,526.8 15,052.7 15,052.7(b) Additions during the period/year1 . . . . . . . . . . . . . . . . . . . . . . 5,743.1 7,035.0 2,565.5(c) Reductions during the period/year1 . . . . . . . . . . . . . . . . . . . . . (1,177.6) (11,560.9) (7,293.1)(e) Closing balance . . . . . . . . . . . . . . . . . . . . . . . . . . . . . . . . . . . . 15,092.3 10,526.8 10,325.1
(iv) Movement of provisions for NPAs (excluding provisions onstandard assets)(a) Opening balance3 . . . . . . . . . . . . . . . . . . . . . . . . . . . . . . . . . . . 11,427.5 12,368.5 12,368.5(b) Provisions made during the quarter . . . . . . . . . . . . . . . . . . . . . 4,040.8 5,601.2 3,042.2(c) Write-off/ write-back of excess provisions . . . . . . . . . . . . . . . (1,173.6) (6,542.2) (1,740.9)(d) Closing balance3 . . . . . . . . . . . . . . . . . . . . . . . . . . . . . . . . . . . . 14,294.7 11,427.5 13,669.8
1. Excludes cases added to and deleted from NPAs in the same period/year with such gross loans amounting toRs. 5,414.4 million (March 31, 2006: Rs. 1,714.7 million, September 30, 2005: Rs. 484.0 million) and suchnet loans amounting to Rs. 4,585.2 million (March 31, 2006: Rs. 1,463.2 million, September 30, 2005: Rs.435.6 million).
2. Includes suspended interest and claims received from ECGC/DICGC of Rs. 311.6 million (March 31, 2006:Rs. 271.6 million, September 30, 2005: Rs. 262.3 million) on working capital loan.
F-43

3. Excludes technical write-off amounting to Rs. 6,290.1 million (March 31, 2006: Rs. 6,586.7 million,September 30, 2005: Rs. 14,565.3 million) and suspended interest and claims received from ECGC/DICGCof Rs. 311.6 million (March 31, 2006: Rs. 271.6 million, September 30, 2005: Rs. 262.3 million).
The movement of floating provision during the half year ended September 30, 2006 is given below.
v) Movement of floating provision Half year ended September 30, 2006
Rupees in million
(a) Opening balance . . . . . . . . . . . . . . . . . . . . . . . . . . . . . . . . . . . . . . . . . . . . . . . . 2,841.7(b) Provisions made during the period /year . . . . . . . . . . . . . . . . . . . . . . . . . . . . . —(c) Utilisation during the period / year . . . . . . . . . . . . . . . . . . . . . . . . . . . . . . . . . . —(d) Closing balance . . . . . . . . . . . . . . . . . . . . . . . . . . . . . . . . . . . . . . . . . . . . . . . . 2,841.7
The Bank has not created any additional floating provision during the half-year ended September 30, 2006.
21. Financial assets transferred during the period/year to Securitisation Company (SC)/ReconstructionCompany (RC)
The Bank has transferred certain assets to an asset reconstruction company (ARC) in terms of the guidelinesissued by RBI governing such transfer. For the purpose of the valuation of the underlying security receipts issuedby the underlying trust managed by ARCIL, the security receipts are valued at their respective NAVs as advisedby the ARCIL. The details of the assets transferred for the half year ended September 30, 2006, for the yearended March 31, 2006 and for the half year ended September 30, 2005 are given in the table below.
Half yearended
September 30,2006
Year endedMarch 31,
2006
Half yearended
September 30,2005
Rupees in million
A No. of accounts . . . . . . . . . . . . . . . . . . . . . . . . . . . . . . . . . . . . . . . . . 9 15 7B Aggregate value (net of provisions) of accounts sold to SC/RC . . . 5,289.2 4,794.0 2,635.9C Aggregate consideration . . . . . . . . . . . . . . . . . . . . . . . . . . . . . . . . . . 5,112.1 4,066.3 2,195.0D Additional consideration realised in respect of accounts transferred
in earlier years1 . . . . . . . . . . . . . . . . . . . . . . . . . . . . . . . . . . . . . . . . . — — —E Aggregate gain/(loss) over net book value . . . . . . . . . . . . . . . . . . . . (177.1) (727.7) (440.9)
1. During the half year ended September 30, 2006, ARCIL fully redeemed security receipts of six trusts. TheBank realised Rs. 643.5 million over the gross book value in respect of these trusts (March 31, 2006: Rs.95.7 million, September 30, 2005: Rs. 60.1 million). The Bank also realised an additional amount of Rs.23.6 million over the gross book value in respect of trust redeemed during the year ended March 31, 2006.
22. Provisions on standard assets
RBI has increased the requirement of general provisioning on standard loans (relating to personal loans,loans and advances qualifying as capital market exposure and residential housing loans beyond Rs. 2.0 million to0.70% compared to 0.40% earlier. This will be increased to 1% in a graded manner by March 31, 2007 (i.e.0.85% by December 31, 2006 and 1% by March 31, 2007). In accordance with the revised RBI guidelines ongeneral provision of Rs. 1,340.0 million during the half year ended September 30, 2006. The provision onstandard assets held by the Bank in accordance with RBI guidelines was Rs. 6,978.2 million at September 30,2006 (March 31, 2006: Rs. 5,638.2 million, September 30, 2005: Rs. 2,658.1 million).
F-44

23. Provisions and contingencies
Break up of ‘Provisions and contingencies’ shown under the head Expenditure in Profit and Loss Account.
Half year endedSeptember 30, 2006
Rupees in millionProvisions for depreciation of investments1 . . . . . . . . . . . . . . . . . . . . . . . . . . . . . . . . . . . . . . . . . 5,334.3Provision towards non-performing assets . . . . . . . . . . . . . . . . . . . . . . . . . . . . . . . . . . . . . . . . . . 4,652.5Provision towards standard assets . . . . . . . . . . . . . . . . . . . . . . . . . . . . . . . . . . . . . . . . . . . . . . . . 1,340.0Provision made towards income tax . . . . . . . . . . . . . . . . . . . . . . . . . . . . . . . . . . . . . . . . . . . . . . . 2,746.0Provision made towards wealth tax . . . . . . . . . . . . . . . . . . . . . . . . . . . . . . . . . . . . . . . . . . . . . . . 15.0Other provision and contingencies . . . . . . . . . . . . . . . . . . . . . . . . . . . . . . . . . . . . . . . . . . . . . . . . 594.4
1. Including premium amortised on Government securities.
24. Information in respect of restructured assets
a) Details of loan assets subjected to restructuring are given below.
Particulars
Half year endedSeptember 30, 2006
Half year endedSeptember 30, 2005
No AmountInterestSacrifice No Amount
InterestSacrifice
Rupees in million(i) Total amount of loan assets subjected to restructuring,
rescheduling, renegotiation: . . . . . . . . . . . . . . . . . . . . . . 4 381.2 — 2 3,838.2 233.0of which under CDR . . . . . . . . . . . . . . . . . . . . . . . . . . . 3 256.4 — 2 3,838.2 233.0[(i) = (ii) + (iii) + (iv)]
(ii) The amount of standard assets subjected torestructuring, rescheduling, renegotiation: . . . . . . . . . . . 4 381.2 — 2 3,838.2 233.0of which under CDR . . . . . . . . . . . . . . . . . . . . . . . . . . . 3 256.4 2 3,838.2 233.0
(iii) The amount of sub-standard assets subjected torestructuring, rescheduling, renegotiation: . . . . . . . . . . . — — — — — —of which under CDR . . . . . . . . . . . . . . . . . . . . . . . . . . . — — — — — —
(iv) The amount of doubtful assets subjected torestructuring, rescheduling, renegotiation: . . . . . . . . . . . — — — — — —of which under CDR . . . . . . . . . . . . . . . . . . . . . . . . . . . — — — — — —
Year ended March 31, 2006
Particulars No. AmountInterestSacrifice
Rupees in million(i) Total amount of loan assets subjected to restructuring, rescheduling,
renegotiation: . . . . . . . . . . . . . . . . . . . . . . . . . . . . . . . . . . . . . . . . . . . . . . . . . . . . . . 5 4,139.4 50.7of which under CDR . . . . . . . . . . . . . . . . . . . . . . . . . . . . . . . . . . . . . . . . . . . . . . . . 4 4,077.0 50.7[(i) = (ii) + (iii) + (iv)]
(ii) The amount of standard assets subjected to restructuring, rescheduling,renegotiation: . . . . . . . . . . . . . . . . . . . . . . . . . . . . . . . . . . . . . . . . . . . . . . . . . . . . . . 2 4,055.5 50.7of which under CDR . . . . . . . . . . . . . . . . . . . . . . . . . . . . . . . . . . . . . . . . . . . . . . . . 2 4,055.5 50.7
(iii) The amount of sub-standard assets subjected to restructuring, rescheduling,renegotiation: . . . . . . . . . . . . . . . . . . . . . . . . . . . . . . . . . . . . . . . . . . . . . . . . . . . . . . 1 62.4 —of which under CDR . . . . . . . . . . . . . . . . . . . . . . . . . . . . . . . . . . . . . . . . . . . . . . . . — — —
(iv) The amount of doubtful assets subjected to restructuring, rescheduling,renegotiation: . . . . . . . . . . . . . . . . . . . . . . . . . . . . . . . . . . . . . . . . . . . . . . . . . . . . . . 2 21.5 —of which under CDR . . . . . . . . . . . . . . . . . . . . . . . . . . . . . . . . . . . . . . . . . . . . . . . . 2 21.5 —
Above details exclude cases that were approved by CDR forum and disclosed in the earlier years by theBank and in which certain terms and conditions have been modified by CDR forum during the current year.
F-45

25. Details of non-performing assets sold, excluding those sold to SC/RC
The Bank has sold non-performing assets in terms of the guidelines issued by RBI circular no.DBOD.NO.BP.BC.16/21.04.048/2005-06 dated July 13, 2005 on such sale. The details of assets sold are givenbelow.
ParticularsHalf year ended
September 30, 2006Year ended
March 31, 2006Half year ended
September 30, 2005
Rupees in million
1. No. of borrower accounts sold . . . . . . . . . . . . . . . . . . . . . — 366 —2. Aggregate outstanding (Gross) . . . . . . . . . . . . . . . . . . . . . — 14,384.1 —3. Aggregate consideration received . . . . . . . . . . . . . . . . . . — 2,223.2 —
26. Fixed Assets
Fixed assets include software acquired by the Bank. The movement in software is given below.
ParticularsHalf year ended
September 30, 2006Year ended
March 31, 2006Half year ended
September 30, 2005
Rupees in million
At cost as on March 31st of preceding year . . . . . . . . . . . . . 2,852.7 2,422.6 2,422.6Additions during the period / year . . . . . . . . . . . . . . . . . . . . 507.5 430.1 191.6Deductions during the period / year . . . . . . . . . . . . . . . . . . . (91.0) — —Depreciation to date . . . . . . . . . . . . . . . . . . . . . . . . . . . . . . . (2,176.2) (2,026.3) (1,700.3)Net block . . . . . . . . . . . . . . . . . . . . . . . . . . . . . . . . . . . . . . . . 1,093.0 826.4 913.9
27. Assets given on lease
27.1 Assets under operating lease
The details of future rentals receivable on operating leases are given below.
Period
As onSeptember 30,
2006
As onMarch 31,
2006
As onSeptember 30,
2005
Rupees in million
Not later than one year . . . . . . . . . . . . . . . . . . . . . . . . . . . . . . . . . . . . . . . . 0.2 126.7 126.6Later than one year and not later than five years . . . . . . . . . . . . . . . . . . . . — 605.9 600.4Later than five years . . . . . . . . . . . . . . . . . . . . . . . . . . . . . . . . . . . . . . . . . . — 2.0 69.8
Total . . . . . . . . . . . . . . . . . . . . . . . . . . . . . . . . . . . . . . . . . . . . . . . . . . . . . . 0.2 734.6 796.8
27.2 Assets under finance lease
The details of finance leases are given below.
Period
As onSeptember 30,
2006
As onMarch 31,
2006
As onSeptember 30,
2005
Rupees in million
Total of future minimum lease receipts . . . . . . . . . . . . . . . . . . . . . . . . . . . 705.7 817.1 958.0Present value of lease receipts . . . . . . . . . . . . . . . . . . . . . . . . . . . . . . . . . . 611.9 695.1 802.6Unmatured finance charges . . . . . . . . . . . . . . . . . . . . . . . . . . . . . . . . . . . . 93.8 122.0 155.4Maturity profile of total of future minimum lease receipts
— Not later than one year . . . . . . . . . . . . . . . . . . . . . . . . . . . . . . . . . 253.6 232.4 265.6— Later than one year and not later than five years . . . . . . . . . . . . . 452.1 584.7 692.4— Later than five years . . . . . . . . . . . . . . . . . . . . . . . . . . . . . . . . . . . — — —
Total . . . . . . . . . . . . . . . . . . . . . . . . . . . . . . . . . . . . . . . . . . . . . . . . . . . . . . 705.7 817.1 958.0
F-46

27.3 Maturity profile of present value of lease rentals
The details of maturity profile of present value of finance lease receipts are given below.
Period
As onSeptember 30,
2006
As onMarch 31,
2006
As onSeptember 30,
2005
Rupees in million
Not later than one year . . . . . . . . . . . . . . . . . . . . . . . . . . . . . . . . . . . . . . . . 204.5 176.7 202.7Later than one year and not later than five years . . . . . . . . . . . . . . . . . . . . 407.4 518.4 599.9Later than five years . . . . . . . . . . . . . . . . . . . . . . . . . . . . . . . . . . . . . . . . . . — — —
Total . . . . . . . . . . . . . . . . . . . . . . . . . . . . . . . . . . . . . . . . . . . . . . . . . . . . . . 611.9 695.1 802.6
28. Early Retirement Option (“ERO”)
The Bank had implemented an Early Retirement Option Scheme 2003 for its employees in July 2003. Allemployees who had completed 40 years of age and seven years of service with the Bank (including period ofservice with entities amalgamated with the Bank) were eligible for the ERO.
The ex-gratia payments under ERO, termination benefits and leave encashment in excess of the provisionmade (net of tax benefits), aggregating to Rs. 1,910.0 million is being amortised over a period of five yearscommencing August 1, 2003 (the date of retirement of employees exercising the Option being July 31, 2003).
On account of the above ERO scheme, an amount of Rs. 192.0 million (March 31, 2006: Rs. 384.0 million,September 30, 2005: Rs. 192.0 million) has been charged to revenue being the proportionate amount amortisedfor the half year ended September 30, 2006.
29. Provisions for income tax
The provision for income tax (including deferred tax and fringe benefit tax) for the half year endedSeptember 30, 2006, for the year ended March 31, 2006 and for the half year ended September 30, 2005amounted to Rs. 2,746.0 million, Rs. 5,535.3 million and Rs. 3,016.1 million respectively.
30. Deferred tax
As on September 30, 2006, the Bank has recorded net deferred tax asset of Rs. 2,294.0 million (March 31,2006: Rs. 1,642.8 million, September 30, 2005: Rs. 612.5 million), which has been included in other assets. Thebreak-up of deferred tax assets and liabilities into major items is given below.
Particulars
As onSeptember 30,
2006
As onMarch 31,
2006
As onSeptember 30,
2005
Rupees in million
Deferred Tax AssetProvision for bad and doubtful debts . . . . . . . . . . . . . . . . . . . . . . . . . . . . . 7,734.9 6,501.5 6,791.9Capital loss . . . . . . . . . . . . . . . . . . . . . . . . . . . . . . . . . . . . . . . . . . . . . . . . . 814.8 950.0Others . . . . . . . . . . . . . . . . . . . . . . . . . . . . . . . . . . . . . . . . . . . . . . . . . . . . . 885.7 880.7 864.8
9,435.4 8,332.2 7,656.7Less: Deferred Tax LiabilityDepreciation on fixed assets . . . . . . . . . . . . . . . . . . . . . . . . . . . . . . . . . . . 7,091.1 6,697.2 7,052.1Others . . . . . . . . . . . . . . . . . . . . . . . . . . . . . . . . . . . . . . . . . . . . . . . . . . . . . 58.8 — —
2,285.5 6,697.2 7,052.1
Add: Deferred tax asset pertaining to foreign branches . . . . . . . . . . . 8.5 7.8 7.9
Total net deferred tax asset / (liability) . . . . . . . . . . . . . . . . . . . . . . . . . 2,294.0 1,642.8 612.5
F-47

During the year ended March 31, 2006, the Bank has created a deferred tax asset on carry forward capitallosses, as based on its firm plans, it is virtually certain that sufficient future taxable capital gains will be availableagainst which the loss can be set off.
31. Subvention Income
The Bank had aligned its accounting policy for subvention income with its accounting policy for directmarketing agency / associate expenses in the year ended March 31, 2006. Accordingly, subvention income hasbeen accounted for in the period in which it is received instead of over the period of the loan. As a result of thechange in policy, the impact on profit for the year ended March 31, 2006 is not expected to be significant.
32. Derivatives
ICICI Bank is a major participant in the financial derivatives market. The Bank deals in derivatives forbalance sheet management and market making purposes whereby the Bank offers derivative products to itscustomers, enabling them to hedge their risks.
Dealing in derivatives is carried out by identified groups in the treasury of the Bank based on the purpose ofthe transaction. Derivative transactions are entered into by the treasury front office. Treasury middle officeconducts an independent check of the transactions entered into by the front office and also undertakes activitiessuch as confirmation, settlement, accounting, risk monitoring and reporting and ensures compliance with variousinternal and regulatory guidelines.
The market making and the proprietary trading activities in derivatives are governed by the investmentpolicy of the Bank, which lays down the position limits, stop loss limits as well as other risk limits. The RiskManagement Group (“RMG”) lays down the methodology for computation and monitoring of risk. The RiskCommittee of the Board (“RCB”) reviews the Bank’s risk management policy in relation to various risks(portfolio, liquidity, interest rate, off-balance sheet and operational risks), investment policies and complianceissues in relation thereto. The RCB comprises of independent directors and the Managing Director and CEO.
Risk monitoring of the derivatives portfolio is done on a daily basis. The Bank measures and monitors riskusing Value at Risk (“VAR”) approach and the relevant greeks for options. Risk reporting on derivatives formsan integral part of the management information system and the marked to market position and the VAR of thederivatives portfolio is reported on a daily basis.
The use of derivatives for hedging purpose is governed by the hedge policy approved by Asset LiabilityManagement Committee (“ALCO”). Subject to prevailing RBI guidelines, the Bank deals in derivatives forhedging fixed rate, floating rate or foreign currency assets/ liabilities. Transactions for hedging and marketmaking purposes are recorded separately. For hedge transactions, the Bank identifies the hedged item (asset orliability) at the inception of the transaction itself. The effectiveness is assessed at the time of inception of thehedge and periodically thereafter. During the year ended March 31, 2006, the Bank changed its method fortesting hedge effectiveness from the price value of basis point (“PVBP”) or duration method to the marked tomarket method. Due to this change certain derivative contracts, which were hitherto accounted for as hedges,became ineffective and were accordingly accounted for as trading.
Hedge derivative transactions are accounted for pursuant to the principles of hedge accounting. Derivativesfor market making purpose are marked to market and the resulting gain/ loss is recorded in the profit and lossaccount. Premia on options are accounted for at the expiry of the options. The Bank makes provisions on theoutstanding positions in trading derivatives for possible adverse movements in the underlying. Derivativetransactions are covered under International Swap Dealers Association (“ISDA”) master agreements with therespective counterparties. The credit exposure on account of derivative transactions is computed as per RBIguidelines and is marked against the credit limits approved for the respective counterparties.
F-48

As on September 30, 2006
Sr No. ParticularCurrency
derivatives1Interest ratederivatives2
Rupees in million
1 Derivatives (Notional principal amount)a) For hedging . . . . . . . . . . . . . . . . . . . . . . . . . . . . . . . . . . . . . . . . . . . . . . . . . . 582.5 57,213.4b) For trading . . . . . . . . . . . . . . . . . . . . . . . . . . . . . . . . . . . . . . . . . . . . . . . . . . . 570,938.3 2,461,625.0
2 Marked to market positions3
a) Asset (+) . . . . . . . . . . . . . . . . . . . . . . . . . . . . . . . . . . . . . . . . . . . . . . . . . . . . 4,089.0 1,531.7b) Liability (-) . . . . . . . . . . . . . . . . . . . . . . . . . . . . . . . . . . . . . . . . . . . . . . . . . .
3 Credit exposure . . . . . . . . . . . . . . . . . . . . . . . . . . . . . . . . . . . . . . . . . . . . . . . . . . . 30,579.34 27,557.44 Likely impact of one percentage change in interest rate (100*PV01)
a) on hedging derivatives4 . . . . . . . . . . . . . . . . . . . . . . . . . . . . . . . . . . . . . . . . . (8.6) (2,223.5)b) on trading derivatives . . . . . . . . . . . . . . . . . . . . . . . . . . . . . . . . . . . . . . . . . . 612.0 99.2
5 Maximum and minimum of 100*PV01 observed during the period / yeara) on hedging4
Maximum . . . . . . . . . . . . . . . . . . . . . . . . . . . . . . . . . . . . . . . . . . . . . . . . . . . — (1,098.1)Minimum . . . . . . . . . . . . . . . . . . . . . . . . . . . . . . . . . . . . . . . . . . . . . . . . . . . . (8.7) (2,287.0)
b) on tradingMaximum . . . . . . . . . . . . . . . . . . . . . . . . . . . . . . . . . . . . . . . . . . . . . . . . . . . 1,934.0 1,965.5Minimum . . . . . . . . . . . . . . . . . . . . . . . . . . . . . . . . . . . . . . . . . . . . . . . . . . . . (172.7) (274.2)
1. Options & Cross Currency Interest Rate Swaps are included in currency derivatives.2. Foreign currency Interest Rate Swaps, Forward Rate Agreements and swaptions are included in interest rate
derivatives.3. For trading portfolio.4. The swap contracts entered for hedging purpose would have an opposite and offsetting impact with the
underlying on-balance sheet items.
As on March 31, 2006
Sr No. ParticularCurrency
derivatives1Interest ratederivatives2
Rupees in million
1 Derivatives (Notional principal amount)a) For hedging . . . . . . . . . . . . . . . . . . . . . . . . . . . . . . . . . . . . . . . . . . . . . . . . . . — 41,252.2b) For trading . . . . . . . . . . . . . . . . . . . . . . . . . . . . . . . . . . . . . . . . . . . . . . . . . . . 428,580.4 2,174,510.4
2 Marked to market positions3
a) Asset (+) . . . . . . . . . . . . . . . . . . . . . . . . . . . . . . . . . . . . . . . . . . . . . . . . . . . . 2,150.3 1,963.2b) Liability (-) . . . . . . . . . . . . . . . . . . . . . . . . . . . . . . . . . . . . . . . . . . . . . . . . . . — —
3 Credit exposure . . . . . . . . . . . . . . . . . . . . . . . . . . . . . . . . . . . . . . . . . . . . . . . . . . . 21,458.8 28,170.84 Likely impact of one percentage change in interest rate (100*PV01)
a) on hedging derivatives4 . . . . . . . . . . . . . . . . . . . . . . . . . . . . . . . . . . . . . . . . . — (1,230.8)b) on trading derivatives . . . . . . . . . . . . . . . . . . . . . . . . . . . . . . . . . . . . . . . . . . 1,087.0 900.9
5 Maximum and minimum of 100*PV01 observed during the period / yeara) on hedging4
Maximum . . . . . . . . . . . . . . . . . . . . . . . . . . . . . . . . . . . . . . . . . . . . . . . . . . . — 838.4Minimum . . . . . . . . . . . . . . . . . . . . . . . . . . . . . . . . . . . . . . . . . . . . . . . . . . . . (74.4) (1,230.8)
b) on tradingMaximum . . . . . . . . . . . . . . . . . . . . . . . . . . . . . . . . . . . . . . . . . . . . . . . . . . . 1,119.8 1,097.5Minimum . . . . . . . . . . . . . . . . . . . . . . . . . . . . . . . . . . . . . . . . . . . . . . . . . . . . 632.8 (1,439.1)
1. Options & Cross Currency Interest Rate Swaps are included in currency derivatives.2. Foreign currency Interest Rate Swaps, Forward Rate Agreements and swaptions are included in interest rate
derivatives.
F-49

3. For trading portfolio.4. The swap contracts entered for hedging purpose would have an opposite and offsetting impact with the
underlying on-balance sheet items.
As on September 30, 2005
Sr No. ParticularCurrency
derivatives1Interest ratederivatives2
Rupees in million
1 Derivatives (Notional principal amount)a) For hedging . . . . . . . . . . . . . . . . . . . . . . . . . . . . . . . . . . . . . . . . . . . . . . . . . 6,142.8 94,781.9b) For trading . . . . . . . . . . . . . . . . . . . . . . . . . . . . . . . . . . . . . . . . . . . . . . . . . . 325,438.9 1,655,335.6
2 Marked to market positions3
a) Asset (+) . . . . . . . . . . . . . . . . . . . . . . . . . . . . . . . . . . . . . . . . . . . . . . . . . . . 509.6 (790.6)b) Liability (-) . . . . . . . . . . . . . . . . . . . . . . . . . . . . . . . . . . . . . . . . . . . . . . . . . — —
3 Credit exposure . . . . . . . . . . . . . . . . . . . . . . . . . . . . . . . . . . . . . . . . . . . . . . . . . . 15,627.8 18,445.34 Likely impact of one percentage change in interest rate (100*PV01)
a) on hedging derivatives4 . . . . . . . . . . . . . . . . . . . . . . . . . . . . . . . . . . . . . . . . (69.6) 155.4b) on trading derivatives . . . . . . . . . . . . . . . . . . . . . . . . . . . . . . . . . . . . . . . . . 770.7 (493.1)
5 Maximum and minimum of 100*PV01 observed during the period / yeara) on hedging4
Maximum . . . . . . . . . . . . . . . . . . . . . . . . . . . . . . . . . . . . . . . . . . . . . . . . . . (53.2) 838.4Minimum . . . . . . . . . . . . . . . . . . . . . . . . . . . . . . . . . . . . . . . . . . . . . . . . . . . (74.4) 134.2
b) on tradingMaximum . . . . . . . . . . . . . . . . . . . . . . . . . . . . . . . . . . . . . . . . . . . . . . . . . . 939.1 357.6Minimum . . . . . . . . . . . . . . . . . . . . . . . . . . . . . . . . . . . . . . . . . . . . . . . . . . . 641.7 (1,439.1)
1. Options and cross currency interest rate swaps are included in currency derivatives.2. Foreign currency interest rate swaps, forward rate agreements and swaptions are included in interest rate
derivatives.3. For trading portfolio.4. The swap contracts entered for hedging purpose would have an opposite and offsetting impact with the
underlying on-balance sheet items.
The notional principal amount of credit derivatives outstanding at September 30, 2006 was Rs.66,149.7 million (March 31, 2006: Rs. 23,514.4 million, September 30, 2005: Rs. 9,720.0 million).
The notional principal amount of forex contracts classified as hedging amounted to Rs. 156,606.6 million(March 31, 2006: Rs. 165,041.4 million, September 30, 2005: Rs. 116,781.0 million). The notional principalamount of forex contracts classified as trading amounted to Rs. 924,712.7 million (March 31, 2006: Rs.753,273.6 million, September 30, 2005: Rs. 682,296.0 million).
The net overnight open position at September 30, 2006 was Rs. 1,397.9 million (March 31, 2006: Rs.457.8 million, September 30, 2005: Rs. 176.5 million).
33. Forward rate agreement (“FRA”)/ Interest rate swaps (“IRS”)
The notional principal amount of Rupee IRS contracts at September 30, 2006 was Rs. Nil for hedgingcontracts (March 31, 2006: Rs. Nil, September 30, 2005: Rs. 48,150.0 million) and Rs. 2,132,370.1 million fortrading contracts (March 31, 2006: Rs. 1,870,025.6 million, September 30, 2005: Rs. 1,347,685.2 million).
The fair value represents the estimated replacement cost of swap contracts at balance sheet date. AtSeptember 30, 2006 the fair value of trading rupee interest rate swap contracts was Rs. 1,765.9 million (March31, 2006: Rs. 922.4 million, September 30, 2005: Rs. 584.5 million).
F-50

Associated credit risk is the loss that the Bank would incur in case all the counter-parties to these swaps failto fulfil their contractual obligations. At September 30, 2006, the associated credit risk on trading rupee interestrate swap contracts was Rs. 16,831.2 million (March 31, 2006: Rs. 16,754.4 million, September 30, 2005: Rs.7,116.4 million).
Market risk is monitored as the loss that would be incurred by the Bank for a 100 basis points change in theinterest rates. At September 30, 2006 the market risk on trading rupee interest rate swap contracts amounts to Rs.528.5 million (March 31, 2006: Rs. 1,192.3 million, September 30, 2005: Rs. 383.4 million).
Credit risk concentration is measured as the highest net receivable under swap contracts from a particularcounter-party. At September 30, 2006 there was a credit risk concentration of Rs. 406.0 million (March 31, 2006:Rs. 476.4 million, September 30, 2005: Rs. 222.2 million) under rupee interest rate swap contracts, with ICICISecurities. As per the prevailing market practice, the Bank does not insist on collateral from the counter-partiesin these contracts.
The details of the forward rate agreements/interest rate swaps are given below.
Particulars
As onSeptember 30,
2006
As onMarch 31,
2006
As onSeptember 30,
2005
Rupees in million
i) The notional principal of rupee swap agreements1 . . . . . . . . . . . . 2,132,370.1 1,870,025.6 1,395,835.2ii) Losses which would be incurred if all counter-parties failed to
fulfil their obligations under the agreement . . . . . . . . . . . . . . . . . 16,831.2 16,754.4 7,116.4iii) Collateral required by the Bank upon entering into swaps . . . . . . — — —iv) Concentration on of credit risk arising from the rupee swaps . . . 406.0 476.4 222.2v) The fair value of rupee trading swap book2 . . . . . . . . . . . . . . . . . 1,765.94 922.4 584.5
1. Notional principal of swap agreements includes both hedge and trading portfolio.2. Fair value represents clean mark-to-market.
34. Exchange Traded Interest Rate Derivatives
The detail of exchange traded interest rate derivatives is given below.
Sr. No. Particulars
As onSeptember 30,
2006
As onMarch 31,
2006
As onSeptember 30,
2005
Rupees in million
(i) Notional principal amount of exchange traded interest ratederivatives undertaken during the period/year (instrument-wise) . . . 53,029.0a) Euro dollar futures . . . . . . . . . . . . . . . . . . . . . . . . . . . . . . . . . . . . . — 133,577.3 49,948.5b) Treasury note futures—10 year . . . . . . . . . . . . . . . . . . . . . . . . . . . — 13,496.0 2,948.5c) Treasury note futures—5 year . . . . . . . . . . . . . . . . . . . . . . . . . . . . — 3,319.4 132.0
(ii) Notional principal amount of exchange traded interest ratederivatives outstanding (instrument-wise)a) Euro dollar futures . . . . . . . . . . . . . . . . . . . . . . . . . . . . . . . . . . . . . — — 1,540.3b) Treasury note futures—10 year . . . . . . . . . . . . . . . . . . . . . . . . . . . — 1,516.9 —c) Treasury note futures—5 year . . . . . . . . . . . . . . . . . . . . . . . . . . . . — — 132.0
(iii) Notional principal amount of exchange traded interest rate derivativesoutstanding and not “highly effective” (instrument-wise) . . . . . . . . . . . N.A. N.A. N.A.
(iv) Mark-to-market value of exchange traded interest rate derivativesoutstanding and not “highly effective” (instrument-wise) . . . . . . . . N.A. N.A. N.A.
Note: All the transactions in exchange traded derivatives have been entered into by foreign branches for tradingportfolio.
F-51

35. Penalties imposed by RBI
There were no penalties imposed by RBI during the half year ended September 30, 2006. A penalty of Rs.0.5 million was imposed under Section 47A(1)(b) of the Banking Regulation Act, 1949 by RBI during the yearended March 31, 2006 citing contravention of RBI instructions relating to opening of accounts, monitoring oftransactions for adherence to Know Your Customer (“KYC”)/Anti Money Laundering (“AML”) norms, andnon-adherence to normal banking practices.
36. Comparative figures
Figures of the previous period / year have been regrouped to conform to the current period presentation.
SIGNATURES TO SCHEDULES 1 TO 18
For and on behalf of Board of Directors
N. Vaghul K. V. Kamath Lalita D. GupteChairman Managing Director & CEO Joint Managing Director
Kalpana Morparia Chanda D. Kochhar Nachiket MorJoint Managing Director Deputy Managing Director Deputy Managing Director
Vishakha Mulye Jyotin Mehta Rakesh JhaChief Financial Officer & Treasurer General Manager &
Company SecretaryGeneral Manager
Place: MumbaiDate : October 24, 2006
F-52
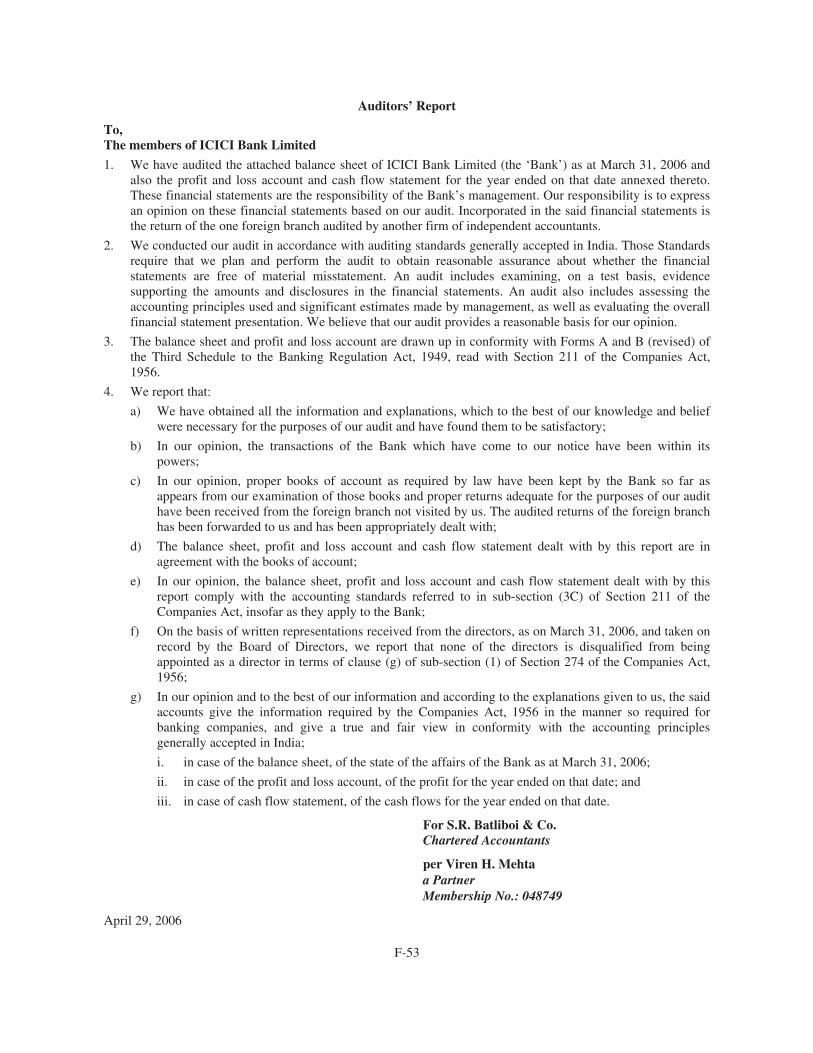
Auditors’ Report
To,The members of ICICI Bank Limited
1. We have audited the attached balance sheet of ICICI Bank Limited (the ‘Bank’) as at March 31, 2006 andalso the profit and loss account and cash flow statement for the year ended on that date annexed thereto.These financial statements are the responsibility of the Bank’s management. Our responsibility is to expressan opinion on these financial statements based on our audit. Incorporated in the said financial statements isthe return of the one foreign branch audited by another firm of independent accountants.
2. We conducted our audit in accordance with auditing standards generally accepted in India. Those Standardsrequire that we plan and perform the audit to obtain reasonable assurance about whether the financialstatements are free of material misstatement. An audit includes examining, on a test basis, evidencesupporting the amounts and disclosures in the financial statements. An audit also includes assessing theaccounting principles used and significant estimates made by management, as well as evaluating the overallfinancial statement presentation. We believe that our audit provides a reasonable basis for our opinion.
3. The balance sheet and profit and loss account are drawn up in conformity with Forms A and B (revised) ofthe Third Schedule to the Banking Regulation Act, 1949, read with Section 211 of the Companies Act,1956.
4. We report that:
a) We have obtained all the information and explanations, which to the best of our knowledge and beliefwere necessary for the purposes of our audit and have found them to be satisfactory;
b) In our opinion, the transactions of the Bank which have come to our notice have been within itspowers;
c) In our opinion, proper books of account as required by law have been kept by the Bank so far asappears from our examination of those books and proper returns adequate for the purposes of our audithave been received from the foreign branch not visited by us. The audited returns of the foreign branchhas been forwarded to us and has been appropriately dealt with;
d) The balance sheet, profit and loss account and cash flow statement dealt with by this report are inagreement with the books of account;
e) In our opinion, the balance sheet, profit and loss account and cash flow statement dealt with by thisreport comply with the accounting standards referred to in sub-section (3C) of Section 211 of theCompanies Act, insofar as they apply to the Bank;
f) On the basis of written representations received from the directors, as on March 31, 2006, and taken onrecord by the Board of Directors, we report that none of the directors is disqualified from beingappointed as a director in terms of clause (g) of sub-section (1) of Section 274 of the Companies Act,1956;
g) In our opinion and to the best of our information and according to the explanations given to us, the saidaccounts give the information required by the Companies Act, 1956 in the manner so required forbanking companies, and give a true and fair view in conformity with the accounting principlesgenerally accepted in India;
i. in case of the balance sheet, of the state of the affairs of the Bank as at March 31, 2006;
ii. in case of the profit and loss account, of the profit for the year ended on that date; and
iii. in case of cash flow statement, of the cash flows for the year ended on that date.
For S.R. Batliboi & Co.Chartered Accountants
per Viren H. Mehtaa PartnerMembership No.: 048749
April 29, 2006
F-53

Balance Sheet as on March 31, 2006
ScheduleAs on
31.03.2006As on
31.03.2005
Rupees in ‘000s
CAPITAL AND LIABILITIESCapital . . . . . . . . . . . . . . . . . . . . . . . . . . . . . . . . . . . . . . . . . . . . . . . . . . 1 12,398,345 10,867,758Reserves and Surplus . . . . . . . . . . . . . . . . . . . . . . . . . . . . . . . . . . . . . . 2 213,161,571 118,131,954Deposits . . . . . . . . . . . . . . . . . . . . . . . . . . . . . . . . . . . . . . . . . . . . . . . . . 3 1,650,831,713 998,187,775Borrowings . . . . . . . . . . . . . . . . . . . . . . . . . . . . . . . . . . . . . . . . . . . . . . 4 385,219,136 335,444,960Other liabilities and provisions . . . . . . . . . . . . . . . . . . . . . . . . . . . . . . . 5 252,278,777 213,961,606
TOTAL CAPITAL AND LIABILITIES . . . . . . . . . . . . . . . . . . . . . 2,513,889,542 1,676,594,053
ASSETSCash and balance with Reserve Bank of India . . . . . . . . . . . . . . . . . . . 6 89,343,737 63,449,004Balances with banks and money at call and short notice . . . . . . . . . . . 7 81,058,508 65,850,719Investments . . . . . . . . . . . . . . . . . . . . . . . . . . . . . . . . . . . . . . . . . . . . . . 8 715,473,944 504,873,525Advances . . . . . . . . . . . . . . . . . . . . . . . . . . . . . . . . . . . . . . . . . . . . . . . . 9 1,461,631,089 914,051,517Fixed assets . . . . . . . . . . . . . . . . . . . . . . . . . . . . . . . . . . . . . . . . . . . . . . 10 39,807,115 40,380,361Other assets . . . . . . . . . . . . . . . . . . . . . . . . . . . . . . . . . . . . . . . . . . . . . . 11 126,575,149 87,988,927
TOTAL ASSETS . . . . . . . . . . . . . . . . . . . . . . . . . . . . . . . . . . . . . . . . . 2,513,889,542 1,676,594,053
Contingent liabilities . . . . . . . . . . . . . . . . . . . . . . . . . . . . . . . . . . . . . . . 12 3,950,336,655 2,681,537,382Bills for collection . . . . . . . . . . . . . . . . . . . . . . . . . . . . . . . . . . . . . . . . . 43,384,648 23,920,922Significant Accounting policies and notes to Accounts . . . . . . . . . . . . 18
The Schedules referred to above form an integral part of the Balance Sheet.
As per our Report of even date. For and on behalf of the Board of Directors
For S. R. Batliboi & Co. N. Vaghul K. V. Kamath Lalita D. GupteChartered Accountants Chairman Managing Director & CEO Joint Managing Director
per Viren H. Mehta Kalpana Morparia Chanda D. Kochhar Nachiket Mora Partner
Membership No.: 048749Joint Managing Director Deputy Managing Director Deputy Managing Director
Vishakha Mulye Jyotin Mehta Rakesh JhaChief Financial Officer
& TreasurerGeneral Manager &Company Secretary
General Manager
Place: MumbaiDate: April 29, 2006
F-54

Profit and loss account for the year ended March 31, 2006
ScheduleYear ended31.03.2006
Year ended31.03.2005
Rupees in ‘000I. INCOME
Interest earned . . . . . . . . . . . . . . . . . . . . . . . . . . . . . . . . . . . . . . . . . . . 13 137,844,958 94,098,944Other income . . . . . . . . . . . . . . . . . . . . . . . . . . . . . . . . . . . . . . . . . . . . 14 49,831,394 34,161,439
TOTAL INCOME . . . . . . . . . . . . . . . . . . . . . . . . . . . . . . . . . . . . . . . 187,676,352 128,260,383
II. EXPENDITUREInterest expended . . . . . . . . . . . . . . . . . . . . . . . . . . . . . . . . . . . . . . . . 15 95,974,483 65,708,876Operating expenses . . . . . . . . . . . . . . . . . . . . . . . . . . . . . . . . . . . . . . . 16 44,795,170 32,991,475Provisions and contingencies . . . . . . . . . . . . . . . . . . . . . . . . . . . . . . . 17 21,505,952 9,508,016
TOTAL EXPENDITURE . . . . . . . . . . . . . . . . . . . . . . . . . . . . . . . . . 162,275,605 108,208,367
III. PROFIT/LOSSNet profit for the year . . . . . . . . . . . . . . . . . . . . . . . . . . . . . . . . . . . . . 25,400,747 20,052,016Profit brought forward . . . . . . . . . . . . . . . . . . . . . . . . . . . . . . . . . . . . 1,882,221 530,876
TOTAL PROFIT / (LOSS) . . . . . . . . . . . . . . . . . . . . . . . . . . . . . . . . 27,282,968 20,582,892
IV. APPROPRIATIONS/TRANSFERSTransfer to Statutory Reserve . . . . . . . . . . . . . . . . . . . . . . . . . . . . . . . 6,360,000 5,020,000Transfer to Reserve Fund . . . . . . . . . . . . . . . . . . . . . . . . . . . . . . . . . . 222 —Transfer to Capital Reserve . . . . . . . . . . . . . . . . . . . . . . . . . . . . . . . . 680,000 200,000Transfer to Investment Fluctuation Reserve . . . . . . . . . . . . . . . . . . . . 5,900,000 —Transfer from Investment Fluctuation Reserve . . . . . . . . . . . . . . . . . (13,203,350) —Transfer to Special Reserve . . . . . . . . . . . . . . . . . . . . . . . . . . . . . . . . 2,750,000 250,000Transfer to Revenue and other reserves . . . . . . . . . . . . . . . . . . . . . . . 13,203,350 6,000,000Proposed equity share dividend . . . . . . . . . . . . . . . . . . . . . . . . . . . . . 7,593,326 6,329,609Proposed preference share dividend . . . . . . . . . . . . . . . . . . . . . . . . . . 35 35Corporate dividend tax . . . . . . . . . . . . . . . . . . . . . . . . . . . . . . . . . . . . 1,064,969 901,027Balance carried over to balance sheet . . . . . . . . . . . . . . . . . . . . . . . . . 2,934,416 1,882,221
TOTAL . . . . . . . . . . . . . . . . . . . . . . . . . . . . . . . . . . . . . . . . . . . . . . . . . . . . 27,282,968 20,582,892
Significant accounting policies and notes to accounts . . . . . . . . . . . . . . . . 18Earning per share (Refer note B. 4)
Basic (Rs.) . . . . . . . . . . . . . . . . . . . . . . . . . . . . . . . . . . . . . . . . . . . . . . 32.49 27.55Diluted (Rs.) . . . . . . . . . . . . . . . . . . . . . . . . . . . . . . . . . . . . . . . . . . . . 32.15 27.33
Face value per share (Rs.) . . . . . . . . . . . . . . . . . . . . . . . . . . . . . . . . . . . . 10.00 10.00
The schedules referred to above form an integral part of the Profit and Loss Account.
As per our Report of even date For and on behalf of the Board of Directors
For S. R. Batliboi & Co. N. Vaghul K. V. Kamath Lalita D. GupteChartered Accountants Chairman Managing Director & CEO Joint Managing Director
per Viren H. Mehtaa Partner
Membership No.: 048749
Kalpana MorpariaJoint Managing Director
Chanda D. KochharDeputy Managing Director
Nachiket MorDeputy Managing Director
Vishakha MulyeChief Financial Officer
& Treasurer
Jyotin MehtaGeneral Manager &Company Secretary
Rakesh JhaGeneral Manager
Place: MumbaiDate: April 29, 2006
F-55

Cash flow statement for the year ended March 31, 2006
PARTICULARSYear ended31.03.2006
Year ended31.03.2005
Rupees in ‘000sCash flow from operating activitiesNet profit before taxes . . . . . . . . . . . . . . . . . . . . . . . . . . . . . . . . . . . . . . . . . . . . . . . . . . . . . . . . . . . . . . . . . . . . . 30,966,076 25,272,032Adjustments for:Depreciation and amortisation . . . . . . . . . . . . . . . . . . . . . . . . . . . . . . . . . . . . . . . . . . . . . . . . . . . . . . . . . . . . . . . 9,021,206 9,424,450Net (appreciation) / depreciation on investments . . . . . . . . . . . . . . . . . . . . . . . . . . . . . . . . . . . . . . . . . . . . . . . . . 8,301,403 5,416,494Provision in respect of non-performing assets (including prudential provision on standard assets) . . . . . . . . . . 7,947,244 (1,213,571)Provision for contingencies & others . . . . . . . . . . . . . . . . . . . . . . . . . . . . . . . . . . . . . . . . . . . . . . . . . . . . . . . . . . 226,801 85,984Dividend from subsidiaries . . . . . . . . . . . . . . . . . . . . . . . . . . . . . . . . . . . . . . . . . . . . . . . . . . . . . . . . . . . . . . . . . (3,386,929) (1,880,786)(Profit) / Loss on sale of fixed assets . . . . . . . . . . . . . . . . . . . . . . . . . . . . . . . . . . . . . . . . . . . . . . . . . . . . . . . . . . (71,222) 20,822
53,004,579 37,125,425Adjustments for:(Increase) / decrease in investments . . . . . . . . . . . . . . . . . . . . . . . . . . . . . . . . . . . . . . . . . . . . . . . . . . . . . . . . . . . (141,019,247) (43,133,937)(Increase) / decrease in advances . . . . . . . . . . . . . . . . . . . . . . . . . . . . . . . . . . . . . . . . . . . . . . . . . . . . . . . . . . . . . (552,112,941) (287,949,797)Increase / (decrease) in borrowings . . . . . . . . . . . . . . . . . . . . . . . . . . . . . . . . . . . . . . . . . . . . . . . . . . . . . . . . . . . 65,476,052 54,169,059Increase / (decrease) in deposits . . . . . . . . . . . . . . . . . . . . . . . . . . . . . . . . . . . . . . . . . . . . . . . . . . . . . . . . . . . . . . 652,643,939 317,101,929(Increase) / decrease in other assets . . . . . . . . . . . . . . . . . . . . . . . . . . . . . . . . . . . . . . . . . . . . . . . . . . . . . . . . . . . (36,704,232) (20,734,975)Increase / (decrease) in other liabilities and provisions . . . . . . . . . . . . . . . . . . . . . . . . . . . . . . . . . . . . . . . . . . . . 13,861,469 43,226,853
2,145,040 62,679,132
Refund / (payment) of direct taxes . . . . . . . . . . . . . . . . . . . . . . . . . . . . . . . . . . . . . . . . . . . . . . . . . . . . . . . . . . . . (8,620,283) (8,487,388 )
Net cash generated from operating activities (A) . . . . . . . . . . . . . . . . . . . . . . . . . . . . . . . . . . . . . . . . . . . . . . 46,529,336 91,317,169
Cash flow from investing activitiesInvestments in subsidiaries and/or joint ventures (including application money) . . . . . . . . . . . . . . . . . . . . . . . . (8,509,194) (6,430,433)Income received on such investments . . . . . . . . . . . . . . . . . . . . . . . . . . . . . . . . . . . . . . . . . . . . . . . . . . . . . . . . . 3,386,929 1,880,786Purchase of fixed assets . . . . . . . . . . . . . . . . . . . . . . . . . . . . . . . . . . . . . . . . . . . . . . . . . . . . . . . . . . . . . . . . . . . . (5,474,001) (3,795,277)Proceeds from sale of fixed assets . . . . . . . . . . . . . . . . . . . . . . . . . . . . . . . . . . . . . . . . . . . . . . . . . . . . . . . . . . . . 942,843 262,914(Purchase) / sale of held to maturity securities . . . . . . . . . . . . . . . . . . . . . . . . . . . . . . . . . . . . . . . . . . . . . . . . . . . (69,286,381) (26,370,435)
Net cash generated from investing activities (B) . . . . . . . . . . . . . . . . . . . . . . . . . . . . . . . . . . . . . . . . . . . . . . . (78,939,804) (34,452,445)
Cash flow from financing activitiesProceeds from issue of share capital (other than ESOPs) net of issue expenses . . . . . . . . . . . . . . . . . . . . . . . . . 79,039,409 31,922,933Amount received on exercise of stock options . . . . . . . . . . . . . . . . . . . . . . . . . . . . . . . . . . . . . . . . . . . . . . . . . . . 774,424 649,862Net proceeds / (repayment) of bonds (including subordinated debt) . . . . . . . . . . . . . . . . . . . . . . . . . . . . . . . . . . 869,592 (38,616,923)Dividend and dividend tax paid . . . . . . . . . . . . . . . . . . . . . . . . . . . . . . . . . . . . . . . . . . . . . . . . . . . . . . . . . . . . . . (7,174,390) (6,227,217)
Net cash generated from financing activities (C) . . . . . . . . . . . . . . . . . . . . . . . . . . . . . . . . . . . . . . . . . . . . . . 73,509,035 (12,271,345)
Effect of exchange fluctuation on translation reserve (D) . . . . . . . . . . . . . . . . . . . . . . . . . . . . . . . . . . . . . . . 3,955 —
Net increase / (decrease) in cash and cash equivalents (A) + (B) + (C) + (D) . . . . . . . . . . . . . . . . . . . . . . . . 41,102,522 44,593,379
Cash and cash equivalents at 1st April . . . . . . . . . . . . . . . . . . . . . . . . . . . . . . . . . . . . . . . . . . . . . . . . . . . . . . . 129,299,723 84,706,344
Cash and cash equivalents at 31st March . . . . . . . . . . . . . . . . . . . . . . . . . . . . . . . . . . . . . . . . . . . . . . . . . . . . 170,402,245 129,299,723
Significant accounting policies and notes to accounts (refer Schedule 18)
The Schedules referred to above form an integral part of the Balance Sheet.
As per our Report of even date For and on behalf of the Board of Directors
For S. R. Batliboi & Co. N. Vaghul K. V. Kamath Lalita D. GupteChartered Accountants Chairman Managing Director & CEO Joint Managing Director
per Viren H. Mehta Kalpana Morparia Chanda D. Kochhar Nachiket Mora Partner Joint Managing Director Deputy Managing Director Deputy Managing Director
Membership No.: 048749Vishakha Mulye Jyotin Mehta Rakesh Jha
Chief Financial Officer &Treasurer
General Manager &Company Secretary
General Manager
Place: MumbaiDate: April 29, 2006
F-56

Schedules forming part of the balance sheet
SCHEDULE 1—CAPITAL
As on31.03.2006
As on31.03.2005
Rupees in ‘000s
Authorised Capital1,000,000,000 equity shares of Rs. 10 each [March 31, 2005:1,550,000,000 equity shares of Rs. 10 each] . . . . . . . . . . . . . . . . . . . . . . . . . . . . . . . . . . 10,000,000 15,500,00055,000,000 preference shares of Rs. 100 each [March 31, 2005: Nil] . . . . . . . . . . . . . . 5,500,000 —350 preference shares of Rs. 10 million each . . . . . . . . . . . . . . . . . . . . . . . . . . . . . . . . . 3,500,000 3,500,000
Equity share capitalIssued, subscribed and paid-up capital736,716,094 equity shares of Rs. 10 each (March 31, 2005: 616,391,905 equity
shares) . . . . . . . . . . . . . . . . . . . . . . . . . . . . . . . . . . . . . . . . . . . . . . . . . . . . . . . . . . . . . 7,367,161 6,163,919Add: Issued 110,967,096 equity shares of Rs. 10 each fully paid up vide
prospectus dated December 8, 2005 (March 31, 2005: 115,866,538 equityshares vide prospectus dated April 12, 2004.)1 . . . . . . . . . . . . . . . . . . . . . . 1,109,671 1,158,665
Add: Issued 37,237,460 equity shares of Rs. 10 each fully paid up consequent toissue of 18,618,730 American Depository Shares (ADS) vide prospectusdated December 6, 2005 (includes 2,428,530 ADS issued under greenshoe option) . . . . . . . . . . . . . . . . . . . . . . . . . . . . . . . . . . . . . . . . . . . . . . . . . 372,374 —
Add: Issued 4,903,251 equity shares of Rs. 10 each fully paid up (March 31,2005: 4,457,651 equity shares) on exercise of employee stock options . . . 49,033 44,577
Less: Calls unpaid . . . . . . . . . . . . . . . . . . . . . . . . . . . . . . . . . . . . . . . . . . . . . . . . . . . . . . 266 —Add: Forfeited 67,323 equity shares (March 31, 2005: 67,323 equity shares) . . . . . . . . 372 372Share capital suspense [net][Represents application money received for Nil equity shares (March 31, 2005:
22,470 equity shares) of Rs.10 each on exercise of employee stock options] . . . . . . — 225
TOTAL EQUITY CAPITAL . . . . . . . . . . . . . . . . . . . . . . . . . . . . . . . . . . . . . . . . . . . . 8,898,345 7,367,758
Preference Share Capital2
[Represents face value of 350 preference shares of Rs. 10 million each issued topreference share holders of erstwhile ICICI Limited on amalgamation redeemableat par on April 20, 2018] . . . . . . . . . . . . . . . . . . . . . . . . . . . . . . . . . . . . . . . . . . . . . . . 3,500,000 3,500,000
TOTAL CAPITAL . . . . . . . . . . . . . . . . . . . . . . . . . . . . . . . . . . . . . . . . . . . . . . . . . . . . 12,398,345 10,867,758
1. Includes 14,285,714 equity shares of Rs.10 each fully paid up consequent to green shoe option videprospectus dated December 8, 2005 (March 31, 2005: 6,992,187 equity shares on exercise of green shoeoption vide prospectus dated April 12, 2004).
2. For these preference shares, the notification from Ministry of Finance has currently exempted the Bank fromthe restriction of Section 12 (1) of the Banking Regulation Act, 1949, which prohibits issue of preferenceshares by banks.
F-57

Schedules forming part of the balance sheet—(Continued)
SCHEDULE 2—RESERVES AND SURPLUS
As on31.03.2006
As on31.03.2005
Rupees in ‘000s
I. Statutory reserveOpening balance . . . . . . . . . . . . . . . . . . . . . . . . . . . . . . . . . . . . . . . . . . . . . . . 14,627,307 9,607,307Additions during the year . . . . . . . . . . . . . . . . . . . . . . . . . . . . . . . . . . . . . . . . 6,360,000 5,020,000Deductions during the year . . . . . . . . . . . . . . . . . . . . . . . . . . . . . . . . . . . . . . . — —Closing balance . . . . . . . . . . . . . . . . . . . . . . . . . . . . . . . . . . . . . . . . . . . . . . . . 20,987,307 14,627,307
II. Special reserveOpening balance . . . . . . . . . . . . . . . . . . . . . . . . . . . . . . . . . . . . . . . . . . . . . . . 11,940,000 11,690,000Additions during the year . . . . . . . . . . . . . . . . . . . . . . . . . . . . . . . . . . . . . . . . 2,750,000 250,000Deductions during the year . . . . . . . . . . . . . . . . . . . . . . . . . . . . . . . . . . . . . . . — —Closing balance . . . . . . . . . . . . . . . . . . . . . . . . . . . . . . . . . . . . . . . . . . . . . . . . 14,690,000 11,940,000
III. Share premiumOpening balance . . . . . . . . . . . . . . . . . . . . . . . . . . . . . . . . . . . . . . . . . . . . . . . 39,892,352 8,523,304Additions during the year1 . . . . . . . . . . . . . . . . . . . . . . . . . . . . . . . . . . . . . . . 79,157,323 31,897,100Deductions during the year2 . . . . . . . . . . . . . . . . . . . . . . . . . . . . . . . . . . . . . . 874,078 528,052Closing balance . . . . . . . . . . . . . . . . . . . . . . . . . . . . . . . . . . . . . . . . . . . . . . . . 118,175,597 39,892,352
IV. Investment fluctuation reserveOpening balance . . . . . . . . . . . . . . . . . . . . . . . . . . . . . . . . . . . . . . . . . . . . . . . 5,160,000 7,303,350Additions during the year . . . . . . . . . . . . . . . . . . . . . . . . . . . . . . . . . . . . . . . . 8,043,350 —Deductions during the year . . . . . . . . . . . . . . . . . . . . . . . . . . . . . . . . . . . . . . . 13,203,350 2,143,350Closing balance . . . . . . . . . . . . . . . . . . . . . . . . . . . . . . . . . . . . . . . . . . . . . . . . — 5,160,000
V. Capital reserveOpening balance . . . . . . . . . . . . . . . . . . . . . . . . . . . . . . . . . . . . . . . . . . . . . . . 4,850,000 4,650,000Additions during the year . . . . . . . . . . . . . . . . . . . . . . . . . . . . . . . . . . . . . . . . 680,000 200,000Deductions during the year . . . . . . . . . . . . . . . . . . . . . . . . . . . . . . . . . . . . . . . — —Closing balance . . . . . . . . . . . . . . . . . . . . . . . . . . . . . . . . . . . . . . . . . . . . . . . . 5,530,000 4,850,000
VI. Foreign currency translation reserve . . . . . . . . . . . . . . . . . . . . . . . . . . . . . . . . 3,955 —VII. Reserve fund . . . . . . . . . . . . . . . . . . . . . . . . . . . . . . . . . . . . . . . . . . . . . . . . . . 222 —VIII. Revenue and other reserves
Opening balance . . . . . . . . . . . . . . . . . . . . . . . . . . . . . . . . . . . . . . . . . . . . . . . 39,780,074 31,636,724Additions during the year . . . . . . . . . . . . . . . . . . . . . . . . . . . . . . . . . . . . . . . . 13,203,350 8,143,350Deductions during the year . . . . . . . . . . . . . . . . . . . . . . . . . . . . . . . . . . . . . . . 2,143,350 —Closing balance . . . . . . . . . . . . . . . . . . . . . . . . . . . . . . . . . . . . . . . . . . . . . . . . 50,840,074 39,780,074
IX. Balance in profit and loss account . . . . . . . . . . . . . . . . . . . . . . . . . . . . . . . . . . 2,934,416 1,882,221
TOTAL RESERVES AND SURPLUS . . . . . . . . . . . . . . . . . . . . . . . . . . . . . . . . . . 213,161,571 118,131,954
1. Includes :
a) Rs. 48,940.0 million (net of share premium in arrears of Rs. 92.4 million (March 31, 2005: Rs. Nil)consequent to public issue vide prospectus dated December 8, 2005.
b) Rs. 22,134.6 million consequent to issue of ADS vide prospectus dated December 6, 2005.c) Rs. 7,357.1 million on the exercise of the green shoe option vide prospectus dated December 8, 2005.d) Rs. 725.6 million (March 31, 2005: Rs. 602.5 million) on exercise of employee stock options.
2. Represents share issue expenses amounting to Rs. 874.1 million, written-off from the share premiumaccount as per the objects of the issue.
F-58
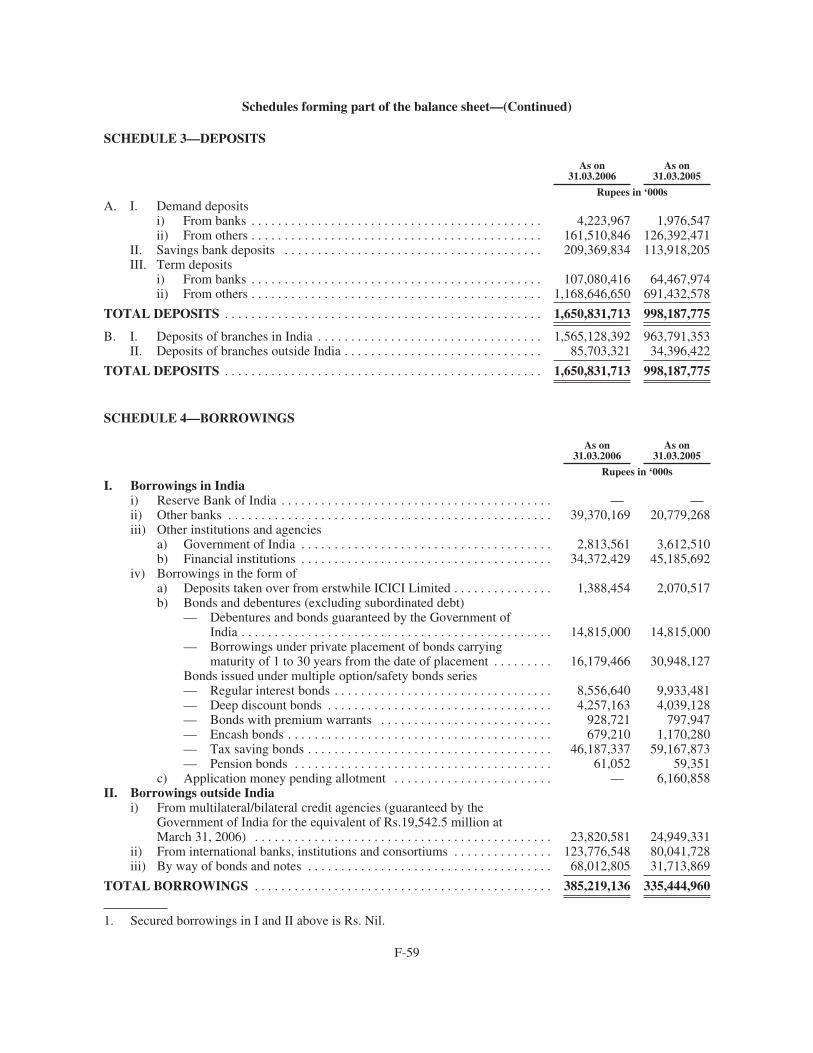
Schedules forming part of the balance sheet—(Continued)
SCHEDULE 3—DEPOSITS
As on31.03.2006
As on31.03.2005
Rupees in ‘000sA. I. Demand deposits
i) From banks . . . . . . . . . . . . . . . . . . . . . . . . . . . . . . . . . . . . . . . . . . . . 4,223,967 1,976,547ii) From others . . . . . . . . . . . . . . . . . . . . . . . . . . . . . . . . . . . . . . . . . . . . 161,510,846 126,392,471
II. Savings bank deposits . . . . . . . . . . . . . . . . . . . . . . . . . . . . . . . . . . . . . . . 209,369,834 113,918,205III. Term deposits
i) From banks . . . . . . . . . . . . . . . . . . . . . . . . . . . . . . . . . . . . . . . . . . . . 107,080,416 64,467,974ii) From others . . . . . . . . . . . . . . . . . . . . . . . . . . . . . . . . . . . . . . . . . . . . 1,168,646,650 691,432,578
TOTAL DEPOSITS . . . . . . . . . . . . . . . . . . . . . . . . . . . . . . . . . . . . . . . . . . . . . . . . 1,650,831,713 998,187,775
B. I. Deposits of branches in India . . . . . . . . . . . . . . . . . . . . . . . . . . . . . . . . . . 1,565,128,392 963,791,353II. Deposits of branches outside India . . . . . . . . . . . . . . . . . . . . . . . . . . . . . . 85,703,321 34,396,422
TOTAL DEPOSITS . . . . . . . . . . . . . . . . . . . . . . . . . . . . . . . . . . . . . . . . . . . . . . . . 1,650,831,713 998,187,775
SCHEDULE 4—BORROWINGS
As on31.03.2006
As on31.03.2005
Rupees in ‘000sI. Borrowings in India
i) Reserve Bank of India . . . . . . . . . . . . . . . . . . . . . . . . . . . . . . . . . . . . . . . . . — —ii) Other banks . . . . . . . . . . . . . . . . . . . . . . . . . . . . . . . . . . . . . . . . . . . . . . . . . 39,370,169 20,779,268iii) Other institutions and agencies
a) Government of India . . . . . . . . . . . . . . . . . . . . . . . . . . . . . . . . . . . . . . 2,813,561 3,612,510b) Financial institutions . . . . . . . . . . . . . . . . . . . . . . . . . . . . . . . . . . . . . . 34,372,429 45,185,692
iv) Borrowings in the form ofa) Deposits taken over from erstwhile ICICI Limited . . . . . . . . . . . . . . . 1,388,454 2,070,517b) Bonds and debentures (excluding subordinated debt)
— Debentures and bonds guaranteed by the Government ofIndia . . . . . . . . . . . . . . . . . . . . . . . . . . . . . . . . . . . . . . . . . . . . . . . 14,815,000 14,815,000
— Borrowings under private placement of bonds carryingmaturity of 1 to 30 years from the date of placement . . . . . . . . . 16,179,466 30,948,127
Bonds issued under multiple option/safety bonds series— Regular interest bonds . . . . . . . . . . . . . . . . . . . . . . . . . . . . . . . . . 8,556,640 9,933,481— Deep discount bonds . . . . . . . . . . . . . . . . . . . . . . . . . . . . . . . . . . 4,257,163 4,039,128— Bonds with premium warrants . . . . . . . . . . . . . . . . . . . . . . . . . . 928,721 797,947— Encash bonds . . . . . . . . . . . . . . . . . . . . . . . . . . . . . . . . . . . . . . . . 679,210 1,170,280— Tax saving bonds . . . . . . . . . . . . . . . . . . . . . . . . . . . . . . . . . . . . . 46,187,337 59,167,873— Pension bonds . . . . . . . . . . . . . . . . . . . . . . . . . . . . . . . . . . . . . . . 61,052 59,351
c) Application money pending allotment . . . . . . . . . . . . . . . . . . . . . . . . — 6,160,858II. Borrowings outside India
i) From multilateral/bilateral credit agencies (guaranteed by theGovernment of India for the equivalent of Rs.19,542.5 million atMarch 31, 2006) . . . . . . . . . . . . . . . . . . . . . . . . . . . . . . . . . . . . . . . . . . . . . 23,820,581 24,949,331
ii) From international banks, institutions and consortiums . . . . . . . . . . . . . . . 123,776,548 80,041,728iii) By way of bonds and notes . . . . . . . . . . . . . . . . . . . . . . . . . . . . . . . . . . . . . 68,012,805 31,713,869
TOTAL BORROWINGS . . . . . . . . . . . . . . . . . . . . . . . . . . . . . . . . . . . . . . . . . . . . . 385,219,136 335,444,960
1. Secured borrowings in I and II above is Rs. Nil.
F-59

Schedules forming part of the balance sheet—(Continued)
SCHEDULE 5—OTHER LIABILITIES AND PROVISIONS
As on31.03.2006
As on31.03.2005
Rupees in ‘000sI. Bills payable . . . . . . . . . . . . . . . . . . . . . . . . . . . . . . . . . . . . . . . . . . . . . . . . . . . . 33,271,959 27,944,845II. Inter-office adjustments (net) . . . . . . . . . . . . . . . . . . . . . . . . . . . . . . . . . . . . . . . 3,496,486 5,614,186III. Interest accrued . . . . . . . . . . . . . . . . . . . . . . . . . . . . . . . . . . . . . . . . . . . . . . . . . . 13,846,487 13,116,497IV. Unsecured redeemable debentures/bonds [Subordinated debt included in
Tier II Capital] . . . . . . . . . . . . . . . . . . . . . . . . . . . . . . . . . . . . . . . . . . . . . . . . . . . 101,443,755 82,088,996V. Others
a) Security deposits from clients . . . . . . . . . . . . . . . . . . . . . . . . . . . . . . . . . . . 7,709,786 12,030,416b) Sundry creditors . . . . . . . . . . . . . . . . . . . . . . . . . . . . . . . . . . . . . . . . . . . . . 58,083,459 42,262,101c) Received for disbursements under special program . . . . . . . . . . . . . . . . . . 3,007,090 2,932,942d) Provision for standard assets . . . . . . . . . . . . . . . . . . . . . . . . . . . . . . . . . . . . 5,638,250 2,248,050e) Other liabilities1 . . . . . . . . . . . . . . . . . . . . . . . . . . . . . . . . . . . . . . . . . . . . . 25,781,505 25,723,573
TOTAL OTHER LIABILITIES AND PROVISIONS . . . . . . . . . . . . . . . . . . . . . 252,278,777 213,961,606
1. Includes:
a) Proposed dividend Rs. 7,563.5 million [March 31, 2005: Rs. 6,262.1 million].b) Corporate dividend tax payable Rs. 1,060.8 million [March 31, 2005: Rs. 878.3 million].
SCHEDULE 6—CASH AND BALANCES RESERVE WITH BANK OF INDIA
As on31.03.2006
As on31.03.2005
Rupees in ‘000sI. Cash in hand (including foreign currency notes) . . . . . . . . . . . . . . . . . . . . . . . . . . 12,088,189 5,544,811II. Balances with Reserve Bank of India in current accounts . . . . . . . . . . . . . . . . . . . 77,255,548 57,904,193
TOTAL CASH AND BALANCES WITH RESERVE BANK OF INDIA 89,343,737 63,449,004
SCHEDULE 7—BALANCES WITH BANKS AND MONEY AT CALL AND SHORT NOTICE
As on31.03.2006
As on31.03.2005
Rupees in ‘000sI. In India
i) Balances with banksa) in current accounts . . . . . . . . . . . . . . . . . . . . . . . . . . . . . . . . . . . . . . . . . 4,402,861 5,228,934b) in other deposit accounts . . . . . . . . . . . . . . . . . . . . . . . . . . . . . . . . . . . . . 6,185,632 7,061,268
ii) Money at call and short noticea) with banks . . . . . . . . . . . . . . . . . . . . . . . . . . . . . . . . . . . . . . . . . . . . . . . . 6,500,000 16,100,000b) with other institutions . . . . . . . . . . . . . . . . . . . . . . . . . . . . . . . . . . . . . . . 3,000 1,900,000
TOTAL . . . . . . . . . . . . . . . . . . . . . . . . . . . . . . . . . . . . . . . . . . . . . . . . . . . . . . . . . . 17,091,493 30,290,202
II. Outside Indiai) in current accounts . . . . . . . . . . . . . . . . . . . . . . . . . . . . . . . . . . . . . . . . . . . . . 7,318,874 7,324,711ii) in other deposit accounts . . . . . . . . . . . . . . . . . . . . . . . . . . . . . . . . . . . . . . . . . 48,614,939 16,659,195iii) money at call and short notice . . . . . . . . . . . . . . . . . . . . . . . . . . . . . . . . . . . . . 8,033,202 11,576,611
TOTAL . . . . . . . . . . . . . . . . . . . . . . . . . . . . . . . . . . . . . . . . . . . . . . . . . . . . . . . . . . 63,967,015 35,560,517
TOTAL BALANCES WITH BANKS AND MONEY AT CALL AND SHORTNOTICE . . . . . . . . . . . . . . . . . . . . . . . . . . . . . . . . . . . . . . . . . . . . . . . . . . . . . . . . . . . 81,058,508 65,850,719
F-60

Schedules forming part of the balance sheet—(Continued)
SCHEDULE 8—INVESTMENTS [net of provisions]As on
31.03.2006As on
31.03.2005
Rupees in ‘000sI. Investments in India
i) Government securities . . . . . . . . . . . . . . . . . . . . . . . . . . . . . . . . . . . . . . . . . 510,744,392 344,516,800ii) Other approved securities . . . . . . . . . . . . . . . . . . . . . . . . . . . . . . . . . . . . . . . 601 301,154iii) Shares (includes equity and preference shares) . . . . . . . . . . . . . . . . . . . . . . 20,578,522 19,147,771iv) Debentures and bonds . . . . . . . . . . . . . . . . . . . . . . . . . . . . . . . . . . . . . . . . . 18,040,317 28,540,305v) Subsidiaries and/or joint ventures . . . . . . . . . . . . . . . . . . . . . . . . . . . . . . . . 16,691,698 12,848,124vi) Others (commercial paper, mutual fund units, pass through certificates,
security receipts etc.) . . . . . . . . . . . . . . . . . . . . . . . . . . . . . . . . . . . . . . . . . . 104,308,855 84,404,072
TOTAL . . . . . . . . . . . . . . . . . . . . . . . . . . . . . . . . . . . . . . . . . . . . . . . . . . . . . . . . 670,364,385 489,758,226
II. Investments outside Indiai) Government securities . . . . . . . . . . . . . . . . . . . . . . . . . . . . . . . . . . . . . . . . . 1,342,384 377,947ii) Subsidiaries and/or joint ventures abroad (includes equity and preference
shares) . . . . . . . . . . . . . . . . . . . . . . . . . . . . . . . . . . . . . . . . . . . . . . . . . . . . . . 11,915,291 7,818,846iii) Others . . . . . . . . . . . . . . . . . . . . . . . . . . . . . . . . . . . . . . . . . . . . . . . . . . . . . . 31,851,884 6,918,506
TOTAL . . . . . . . . . . . . . . . . . . . . . . . . . . . . . . . . . . . . . . . . . . . . . . . . . . . . . . . . 45,109,559 15,115,299
TOTAL INVESTMENTS . . . . . . . . . . . . . . . . . . . . . . . . . . . . . . . . . . . . . . . . . . . . . 715,473,944 504,873,525
SCHEDULE 9—ADVANCES [net of provisions]As on
31.03.2006As on
31.03.2005
Rupees in ‘000sA. i) Bills purchased and discounted . . . . . . . . . . . . . . . . . . . . . . . . . . . . . . . . . . 63,065,998 43,984,209
ii) Cash credits, overdrafts and loans repayable on demand . . . . . . . . . . . . . . 249,328,298 123,344,410iii) Term loans . . . . . . . . . . . . . . . . . . . . . . . . . . . . . . . . . . . . . . . . . . . . . . . . . . 1,117,904,639 722,588,931iv) Securitisation, finance lease and hire purchase receivables1 . . . . . . . . . . . . 31,332,154 24,133,967
TOTAL . . . . . . . . . . . . . . . . . . . . . . . . . . . . . . . . . . . . . . . . . . . . . . . . . . . . . . . . 1,461,631,089 914,051,517
B. i) Secured by tangible assets [includes advances against book debt]2 . . . . . . 1,199,732,405 778,517,712ii) Covered by Bank/Government Guarantees . . . . . . . . . . . . . . . . . . . . . . . . . 13,508,731 10,104,623iii) Unsecured . . . . . . . . . . . . . . . . . . . . . . . . . . . . . . . . . . . . . . . . . . . . . . . . . . . 248,389,953 125,429,182
TOTAL . . . . . . . . . . . . . . . . . . . . . . . . . . . . . . . . . . . . . . . . . . . . . . . . . . . . . . . . 1,461,631,089 914,051,517
C. I. Advances in Indiai) Priority Sector . . . . . . . . . . . . . . . . . . . . . . . . . . . . . . . . . . . . . . . . . . . . . . . 426,756,181 200,892,904ii) Public Sector . . . . . . . . . . . . . . . . . . . . . . . . . . . . . . . . . . . . . . . . . . . . . . . . 11,572,043 11,154,310iii) Banks . . . . . . . . . . . . . . . . . . . . . . . . . . . . . . . . . . . . . . . . . . . . . . . . . . . . . . 48,863 4,517,162iv) Others . . . . . . . . . . . . . . . . . . . . . . . . . . . . . . . . . . . . . . . . . . . . . . . . . . . . . . 898,014,748 635,303,209
TOTAL . . . . . . . . . . . . . . . . . . . . . . . . . . . . . . . . . . . . . . . . . . . . . . . . . . . . . . . . 1,336,391,835 851,867,585
II. Advances outside Indiai) Due from banks . . . . . . . . . . . . . . . . . . . . . . . . . . . . . . . . . . . . . . . . . . . . . . 18,559,863 10,375,851ii) Due from others
a) Bills purchased and discounted . . . . . . . . . . . . . . . . . . . . . . . . . . . . . . 43,769,271 24,736,630b) Syndicated loans . . . . . . . . . . . . . . . . . . . . . . . . . . . . . . . . . . . . . . . . . . 29,704,361 11,925,394c) Others . . . . . . . . . . . . . . . . . . . . . . . . . . . . . . . . . . . . . . . . . . . . . . . . . . 33,205,759 15,146,057
TOTAL . . . . . . . . . . . . . . . . . . . . . . . . . . . . . . . . . . . . . . . . . . . . . . . . . . . . . . . . 125,239,254 62,183,932
TOTAL ADVANCES . . . . . . . . . . . . . . . . . . . . . . . . . . . . . . . . . . . . . . . . . . . . . . . . 1,461,631,089 914,051,517
1. Includes receivables under lease amounting to Rs. 695.1 million (March 31, 2005: Rs. 913.6 million).2. Includes a loan of Rs. 16,028.7 million (March 31, 2005: Rs. Nil) for which security is being created.
F-61

Schedules forming part of the balance sheet—(Continued)
SCHEDULE 10—FIXED ASSETS
As on31.03.2006
As on31.03.2005
Rupees in ‘000s
I. PremisesAt cost as on March 31 of preceding year . . . . . . . . . . . . . . . . . . . . . . . . . . . . . . . 18,829,741 16,668,982Additions during the year . . . . . . . . . . . . . . . . . . . . . . . . . . . . . . . . . . . . . . . . . . . . 1,454,189 2,254,384Deductions during the year . . . . . . . . . . . . . . . . . . . . . . . . . . . . . . . . . . . . . . . . . . (84,491) (93,625)Depreciation to date . . . . . . . . . . . . . . . . . . . . . . . . . . . . . . . . . . . . . . . . . . . . . . . . (2,029,015) (1,516,102)Net block . . . . . . . . . . . . . . . . . . . . . . . . . . . . . . . . . . . . . . . . . . . . . . . . . . . . . . . . 18,170,424 17,313,639
II. Other fixed assets (including furniture and fixtures)At cost as on March 31 of preceding year . . . . . . . . . . . . . . . . . . . . . . . . . . . . . . . 16,303,939 13,587,781Additions during the year . . . . . . . . . . . . . . . . . . . . . . . . . . . . . . . . . . . . . . . . . . . . 4,361,180 2,826,608Deductions during the year . . . . . . . . . . . . . . . . . . . . . . . . . . . . . . . . . . . . . . . . . . (133,227) (110,450)Depreciation to date . . . . . . . . . . . . . . . . . . . . . . . . . . . . . . . . . . . . . . . . . . . . . . . . (10,633,404) (7,765,842)Net block . . . . . . . . . . . . . . . . . . . . . . . . . . . . . . . . . . . . . . . . . . . . . . . . . . . . . . . . 9,898,488 8,538,097
III. Assets given on leaseAt cost as on March 31 of preceding year . . . . . . . . . . . . . . . . . . . . . . . . . . . . . . . 20,122,827 20,645,237Additions during the year . . . . . . . . . . . . . . . . . . . . . . . . . . . . . . . . . . . . . . . . . . . . 544 2,838Deductions during the year . . . . . . . . . . . . . . . . . . . . . . . . . . . . . . . . . . . . . . . . . . (1,169,048) (525,248)Depreciation to date, accumulated lease adjustment and provisions . . . . . . . . . . . (7,216,120) (5,594,202)Net block . . . . . . . . . . . . . . . . . . . . . . . . . . . . . . . . . . . . . . . . . . . . . . . . . . . . . . . . 11,738,203 14,528,625
TOTAL FIXED ASSETS . . . . . . . . . . . . . . . . . . . . . . . . . . . . . . . . . . . . . . . . . . . . . . 39,807,115 40,380,361
SCHEDULE 11—OTHER ASSETS
As on31.03.2006
As on31.03.2005
Rupees in ‘000s
I. Inter-office adjustments (net) . . . . . . . . . . . . . . . . . . . . . . . . . . . . . . . . . . . . . . . . — —II. Interest accrued . . . . . . . . . . . . . . . . . . . . . . . . . . . . . . . . . . . . . . . . . . . . . . . . . . . 21,543,081 13,124,389III. Tax paid in advance/tax deducted at source (net) . . . . . . . . . . . . . . . . . . . . . . . . . 28,220,490 26,643,957IV. Stationery and stamps . . . . . . . . . . . . . . . . . . . . . . . . . . . . . . . . . . . . . . . . . . . . . . 1,663 3,609V. Non-banking assets acquired in satisfaction of claims1 . . . . . . . . . . . . . . . . . . . . 3,627,879 3,677,234VI. Others
a) Advance for capital assets . . . . . . . . . . . . . . . . . . . . . . . . . . . . . . . . . . . . . . . 1,479,423 963,017b) Outstanding fees and other Income . . . . . . . . . . . . . . . . . . . . . . . . . . . . . . . . 3,676,895 2,792,942c) Exchange fluctuation suspense with Government of India . . . . . . . . . . . . . . 24,966 244,749d) Swap suspense . . . . . . . . . . . . . . . . . . . . . . . . . . . . . . . . . . . . . . . . . . . . . . . . 71,587 794,710e) Deposits . . . . . . . . . . . . . . . . . . . . . . . . . . . . . . . . . . . . . . . . . . . . . . . . . . . . . 25,766,974 15,003,770f) Deferred tax asset (net) . . . . . . . . . . . . . . . . . . . . . . . . . . . . . . . . . . . . . . . . . 1,642,837 148,666g) Early retirement option expenses not written off . . . . . . . . . . . . . . . . . . . . . 885,979 1,269,979h) Others . . . . . . . . . . . . . . . . . . . . . . . . . . . . . . . . . . . . . . . . . . . . . . . . . . . . . . 39,633,375 23,321,905
TOTAL OTHER ASSETS . . . . . . . . . . . . . . . . . . . . . . . . . . . . . . . . . . . . . . . . . . . . . 126,575,149 87,988,927
1. Includes certain non-banking assets acquired in satisfaction of claims which are in the process of beingtransferred in the Banks’ name.
F-62

Schedules forming part of the balance sheet—(Continued)
SCHEDULE 12—CONTINGENT LIABILITIES
As on31.03.2006
As on31.03.2005
Rupees in ‘000s
I. Claims against the Bank not acknowledged as debts . . . . . . . . . . . . . . . . . 29,777,239 27,464,523II. Liability for partly paid investments . . . . . . . . . . . . . . . . . . . . . . . . . . . . . . 168,472 168,396III. Liability on account of outstanding forward exchange contracts . . . . . . . . 918,314,985 714,848,723IV. Guarantees given on behalf of constituents
a) In India . . . . . . . . . . . . . . . . . . . . . . . . . . . . . . . . . . . . . . . . . . . . . . . 170,909,502 140,444,828b) Outside India . . . . . . . . . . . . . . . . . . . . . . . . . . . . . . . . . . . . . . . . . . . 20,118,115 15,968,174
V. Acceptances, endorsements and other obligations . . . . . . . . . . . . . . . . . . . 106,867,498 74,115,736VI. Currency swaps . . . . . . . . . . . . . . . . . . . . . . . . . . . . . . . . . . . . . . . . . . . . . . 172,422,863 112,957,025VII. Interest rate swaps, currency options and interest rate futures . . . . . . . . . . 2,471,920,061 1,519,218,305VIII. Other items for which the Bank is contingently liable . . . . . . . . . . . . . . . . 59,837,920 76,351,672
TOTAL CONTINGENT LIABILITIES . . . . . . . . . . . . . . . . . . . . . . . . . . . . . . 3,950,336,655 2,681,537,382
F-63

Schedules forming part of the profit and loss account
SCHEDULE 13—INTEREST EARNED
Year ended31.03.2006
Year ended31.03.2005
Rupees in ‘000s
I. Interest/discount on advances/bills . . . . . . . . . . . . . . . . . . . . . . . . . . . . . . . . . . . . 96,849,551 67,528,301II. Income on investments . . . . . . . . . . . . . . . . . . . . . . . . . . . . . . . . . . . . . . . . . . . . . 36,927,577 22,294,366III. Interest on balances with Reserve Bank of India and other inter-bank funds . . . . 3,354,647 2,320,089IV. Others1 . . . . . . . . . . . . . . . . . . . . . . . . . . . . . . . . . . . . . . . . . . . . . . . . . . . . . . . . . 713,183 1,956,188
TOTAL INTEREST EARNED . . . . . . . . . . . . . . . . . . . . . . . . . . . . . . . . . . . . . . . . . 137,844,958 94,098,944
1. Includes interest on income tax refunds of Rs. 399.8 million (March 31, 2005: Rs. 247.3 million).
SCHEDULE 14—OTHER INCOME
Year ended31.03.2006
Year ended31.03.2005
Rupees in ‘000s
I. Commission, exchange and brokerage . . . . . . . . . . . . . . . . . . . . . . . . . . . . . . . . . . 30,019,493 19,210,001II. Profit/(loss) on sale of investments (net) . . . . . . . . . . . . . . . . . . . . . . . . . . . . . . . . 7,497,522 5,461,352III. Profit/(loss) on revaluation of investments (net) . . . . . . . . . . . . . . . . . . . . . . . . . . . (534,825) (907)IV. Profit/(loss) on sale of land, buildings and other assets (net)1 . . . . . . . . . . . . . . . . 71,222 (20,822)V. Profit/(loss) on foreign exchange transactions (net) . . . . . . . . . . . . . . . . . . . . . . . . 4,730,846 3,146,394VI. Income earned by way of dividends, etc. from subsidiary companies and/or joint
ventures abroad/ in India . . . . . . . . . . . . . . . . . . . . . . . . . . . . . . . . . . . . . . . . . . . . . 3,386,929 1,880,786VII. Miscellaneous income (including lease income) . . . . . . . . . . . . . . . . . . . . . . . . . . 4,660,207 4,484,635
TOTAL OTHER INCOME . . . . . . . . . . . . . . . . . . . . . . . . . . . . . . . . . . . . . . . . . . . . . 49,831,394 34,161,439
1. Includes profit/(loss) on sale of assets given on lease.
SCHEDULE 15—INTEREST EXPENDED
Year ended31.03.2006
Year ended31.03.2005
Rupees in ‘000s
I. Interest on deposits . . . . . . . . . . . . . . . . . . . . . . . . . . . . . . . . . . . . . . . . . . . . . . . . . 58,366,832 32,520,688II. Interest on Reserve Bank of India/inter-bank borrowings1 . . . . . . . . . . . . . . . . . . 9,254,169 2,527,689III. Others (including interest on borrowings of erstwhile ICICI Limited) . . . . . . . . . 28,353,482 30,660,499
TOTAL INTEREST EXPENDED . . . . . . . . . . . . . . . . . . . . . . . . . . . . . . . . . . . . . . . . 95,974,483 65,708,876
1. Includes interest paid on inter-bank deposits.
F-64

Schedules forming part of the profit and loss account—(Continued)
SCHEDULE 16—OPERATING EXPENSES
Year ended31.03.2006
Year ended31.03.2005
Rupees in ‘000s
I. Payments to and provisions for employees . . . . . . . . . . . . . . . . . . . . . . . . . . . . . . 10,822,935 7,374,121II. Rent, taxes and lighting . . . . . . . . . . . . . . . . . . . . . . . . . . . . . . . . . . . . . . . . . . . . . 2,348,028 1,853,347III. Printing and stationery . . . . . . . . . . . . . . . . . . . . . . . . . . . . . . . . . . . . . . . . . . . . . 1,110,432 876,632IV. Advertisement and publicity . . . . . . . . . . . . . . . . . . . . . . . . . . . . . . . . . . . . . . . . . 1,855,514 1,162,555V. Depreciation on Bank’s property (including non-banking assets) . . . . . . . . . . . . 3,471,658 2,933,725VI. Depreciation (including lease equalisation) on leased assets . . . . . . . . . . . . . . . . 2,766,260 2,969,907VII. Directors’ fees, allowances and expenses . . . . . . . . . . . . . . . . . . . . . . . . . . . . . . . 3,237 3,872VIII. Auditors’ fees and expenses . . . . . . . . . . . . . . . . . . . . . . . . . . . . . . . . . . . . . . . . . 18,456 17,632IX. Law charges . . . . . . . . . . . . . . . . . . . . . . . . . . . . . . . . . . . . . . . . . . . . . . . . . . . . . . 112,356 97,141X. Postages, telegrams, telephones, etc. . . . . . . . . . . . . . . . . . . . . . . . . . . . . . . . . . . 2,157,585 1,736,270XI. Repairs and maintenance . . . . . . . . . . . . . . . . . . . . . . . . . . . . . . . . . . . . . . . . . . . . 2,580,722 2,159,454XII. Insurance . . . . . . . . . . . . . . . . . . . . . . . . . . . . . . . . . . . . . . . . . . . . . . . . . . . . . . . . 1,080,254 597,230XIII. Direct marketing agency expenses . . . . . . . . . . . . . . . . . . . . . . . . . . . . . . . . . . . . 6,554,240 4,854,521XIV. Other expenditure . . . . . . . . . . . . . . . . . . . . . . . . . . . . . . . . . . . . . . . . . . . . . . . . . 9,913,493 6,355,068
TOTAL OPERATING EXPENSES . . . . . . . . . . . . . . . . . . . . . . . . . . . . . . . . . . . . . . 44,795,170 32,991,475
SCHEDULE 17—PROVISIONS AND CONTINGENCIES
As on31.03.2006
As on31.03.2005
Rupees in ‘000s
I. Income Tax— Current period tax . . . . . . . . . . . . . . . . . . . . . . . . . . . . . . . . . . . . . . . . . . . . . . . . 6,618,650 1,764,935— Deferred tax adjustment . . . . . . . . . . . . . . . . . . . . . . . . . . . . . . . . . . . . . . . . . . . (1,346,853) 3,425,081— Fringe benefit tax . . . . . . . . . . . . . . . . . . . . . . . . . . . . . . . . . . . . . . . . . . . . . . . . 263,532 —
II. Wealth tax . . . . . . . . . . . . . . . . . . . . . . . . . . . . . . . . . . . . . . . . . . . . . . . . . . . . . . . . 30,000 30,000III. Provision for investments (including credit substitutes) (net) . . . . . . . . . . . . . . . . . 7,766,578 5,415,587IV. Provision for advances (net)1 . . . . . . . . . . . . . . . . . . . . . . . . . . . . . . . . . . . . . . . . . 7,947,244 (1,213,571)V. Others . . . . . . . . . . . . . . . . . . . . . . . . . . . . . . . . . . . . . . . . . . . . . . . . . . . . . . . . . . . . 226,801 85,984
TOTAL PROVISIONS AND CONTINGENCIES . . . . . . . . . . . . . . . . . . . . . . . . . . . 21,505,952 9,508,016
1. Includes provision on standard assets, non-performing advances, non-performing leased assets and otherreceivables.
F-65

SCHEDULE 18—Significant accounting policies and notes to accounts
Overview
ICICI Bank Limited (“ICICI Bank” or “the Bank”), incorporated in Vadodara, India is a publicly heldbanking company engaged in providing a wide range of banking and financial services including commercialbanking and treasury operations. ICICI Bank is a banking company governed by the Banking Regulation Act,1949.
Basis of preparation
The accounting and reporting policies of ICICI Bank used in the preparation of these financial statementsconform to Generally Accepted Accounting Principles (“GAAP”) in India, the guidelines issued by ReserveBank of India (“RBI”) from time to time and practices generally prevalent within the banking industry in India.The Bank follows the accrual method of accounting, except where otherwise stated, and the historical costconvention.
The preparation of financial statements requires the management to make estimates and assumptionsconsidered in the reported amounts of assets and liabilities (including contingent liabilities) as of the date of thefinancial statements and the reported income and expenses during the reporting period. Management believesthat the estimates used in the preparation of the financial statements are prudent and reasonable. Future resultscould differ from these estimates.
Equity issue
During the year ended March 31, 2006, the Bank raised equity capital amounting to Rs. 80,006.1 million.The expenses of the issue amounting to Rs. 874.1 million have been charged to the share premium account. Thedetails of the equity capital raised are given in the table below.
DetailsNo. of equity
shares
Amountof share
premiumAggregateproceeds
Rupees in million except per share data
Fully paid equity shares of Rs. 10 each at a premium of Rs. 515 pershare . . . . . . . . . . . . . . . . . . . . . . . . . . . . . . . . . . . . . . . . . . . . . . . . . . . . . . 67,787,322 34,910.5 35,588.3
Fully paid equity shares of Rs. 10 each at a premium of Rs. 488.75 pershare1 . . . . . . . . . . . . . . . . . . . . . . . . . . . . . . . . . . . . . . . . . . . . . . . . . . . . . 28,894,060 14,122.0 14,410.9
18,618,730 American Depository Share (“ADS”) at a price of US$26.75 per share2 . . . . . . . . . . . . . . . . . . . . . . . . . . . . . . . . . . . . . . . . . . . . . 37,237,460 22,134.6 22,506.9
Fully paid equity shares of Rs. 10 each issued by exercise of the green shoeoption . . . . . . . . . . . . . . . . . . . . . . . . . . . . . . . . . . . . . . . . . . . . . . . . . . . . . . 14,285,714 7,357.1 7,500.0
Total . . . . . . . . . . . . . . . . . . . . . . . . . . . . . . . . . . . . . . . . . . . . . . . . . . . . . . . . 148,204,556 78,524.2 80,006.1
1. Unpaid calls of Rs. 0.3 million (Unpaid share premium Rs. 92.4 million).2. Includes green shoe option of 2,428,530 ADSs.
The Bank had also made an issue of 115,920,758 equity shares (including 6,992,187 equity shares issued byexercise of green shoe option) of Rs.10 each at a premium of Rs. 270 per share aggregating Rs. 32,457.8 millionunder the prospectus dated April 12, 2004. The expenses of the issue were charged to the share premium account.
ICICI Bank had sponsored an American Depositary Shares (ADSs) Offering which opened for participationon March 7, 2005 and closed on March 11, 2005. In terms of the Offering, 20,685,750 ADSs representing41,371,500 equity shares had been sold at a price of US$ 21.1 per ADS. The gross proceeds from the ADSOffering were approximately US$ 436.7 million (Rs.19,099.6 million). Pursuant to this offering existingoutstanding equity shares were exchanged for newly issued ADSs and accordingly the offering did not result inan increase in share capital of the Bank.
F-66

A. SIGNIFICANT ACCOUNTING POLICIES
1. Revenue recognition
a) Interest income is recognised in the profit and loss account as it accrues except in the case ofnon-performing assets (“NPAs”) where it is recognised, upon realisation, as per the prudential norms of RBI.
b) Commissions paid to direct marketing agents (“DMAs”) for auto loans are recorded upfront in the profitand loss account net of subvention income received from them.
c) Income from hire purchase operations is accrued by applying the implicit interest rate on outstandingbalances.
d) Income from leases is calculated by applying the interest rate implicit in the lease to the net investmentoutstanding on the lease over the primary lease period. Leases effective from April 1, 2001 are accounted asadvances at an amount equal to the net investment in the lease. The lease rentals are apportioned betweenprincipal and finance income based on a pattern reflecting a constant periodic return on the net investment ofoutstanding in respect of finance lease. The principal amount is recognised as repayment of advances and thefinance income is reported as interest income.
e) Income on discounted instruments is recognised over the tenure of the instrument on a constant yieldbasis.
f) Dividend is accounted on an accrual basis when the right to receive the dividend is established.
g) All other fee income is recognised upfront on its becoming due.
h) Net income arising from sell-down of loan assets is recognised upfront in interest income. With effectfrom February 1, 2006, net income arising from securitisation of loan assets is amortised over the life ofsecurities issued or to be issued by the special purpose vehicle/special purpose entity to which the assets are sold.
i) Guarantee commission is recognised over the period of the guarantee.
2. Investments
Investments are valued in accordance with the extant RBI guidelines on investment classification andvaluation as given below.
a) All investments are categorised into ‘Held to Maturity’, ‘Available for Sale’ and ‘Held for Trading’.Reclassifications, if any, in any category are accounted for as per RBI guidelines. Under each category, theinvestments are further classified under (a) government securities (b) other approved securities (c) shares(d) bonds and debentures, (e) subsidiaries and joint ventures and (f) others.
b) ‘Held to Maturity’ securities are carried at their acquisition cost or at amortised cost, if acquired at apremium over the face value. A provision is made for other than temporary diminution.
c) ‘Available for Sale’ and ‘Held for Trading’ securities are valued periodically as per RBI guidelines.The market/fair value for the purpose of periodical valuation of quoted investments included in the‘Available for Sale’ and ‘Held for Trading’ categories is the market price of the scrip as available from thetrades/quotes on the stock exchanges, SGL account transactions, price list of RBI or prices declared byPrimary Dealers Association of India jointly with Fixed Income Money Market and Derivatives Association(“FIMMDA”), periodically.
The market/fair value of unquoted SLR securities included in the ‘Available for Sale’ and ‘Held forTrading’ categories is as per the rates published by FIMMDA.
The valuation of non-SLR securities, other than those quoted on the stock exchanges, wherever linked to theYield-to-Maturity (“YTM”) rates, is computed with a mark-up (reflecting associated credit risk) over theYTM rates for government securities published by FIMMDA.
F-67

Unquoted equity shares are valued at the book value, if the latest balance sheet is available or at Re. 1.
Securities are valued scrip-wise and depreciation/appreciation aggregated for each category. Netappreciation, if any, in each basket, being unrealised, is ignored, while net depreciation is provided for.
d) Costs including brokerage and commission pertaining to investments, paid at the time of acquisition,are charged to the profit and loss account.
e) Broken period interest on debt instruments is treated as a revenue item.
f) Investments in subsidiaries/joint ventures are categorised as ‘Held to Maturity’ in accordance withRBI guidelines.
g) Profit on sale of investments in the ‘Held to Maturity’ category is credited to the profit and lossaccount and is thereafter appropriated (net of applicable taxes and statutory reserve requirements) to CapitalReserve.
h) At the end of each reporting period, security receipts issued by the asset reconstruction company arevalued in accordance with the guidelines applicable to non-SLR instruments prescribed by RBI from time totime. Accordingly, in case where the security receipts issued by the asset reconstruction company arelimited to the actual realisation of the financial assets assigned to the instruments in the concerned scheme,the Bank reckons the Net Asset Value (“NAV”), obtained from the asset reconstruction company from timeto time, for valuation of such investments at each reporting year end.
i) The Bank follows trade date method for accounting of its investments.
3. Provisions/Write-offs on loans and other credit facilities
a) All credit exposures are classified as per RBI guidelines, into performing and non-performing assets(“NPAs”). Further, NPAs are classified into sub-standard, doubtful and loss assets based on the criteria stipulatedby RBI. Provisions are made for sub-standard and doubtful assets at rates for prescribed by RBI. Loss assets andunsecured portion of doubtful assets are provided/written off as per the extant RBI guidelines. The Bank alsomakes additional floating provision against non-performing retail loans and additional provision against specificcorporate NPAs.
b) For restructured/rescheduled assets, provision is made in accordance with the guidelines issued by RBI,which requires the present value of the interest sacrifice be provided at the time of restructuring.
c) In the case of loan accounts classified as NPAs (other than those subjected to restructuring), the accountis reclassified as “standard” account if arrears of interest and principal are fully paid by the borrower.
In respect of non-performing loan accounts subjected to restructuring, the account is upgraded to standardonly after the specified period i.e., a period of one year after the date when first payment of interest or ofprincipal, whichever is earlier, falls due, subject to satisfactory performance during the period.
d) Amounts recovered against other debts written off in earlier years and provisions no longer considerednecessary in the context of the current status of the borrower are recognised in the profit and loss account.
e) In addition to the specific provision on NPAs, the Bank maintains a general provision on performingloans. The general provision covers the requirements of the RBI guidelines.
f) In addition to the provisions required to be held according to the asset classification status, provisions areheld for individual country exposure (other than for home country). The countries are categorised into seven riskcategories namely insignificant, low, moderate, high, very high, restricted and off-credit and provisioning madeon exposures exceeding 90 days on a graded scale ranging from 0.25% to 100%. For exposures with contractualmaturity of less than 90 days, 25% of the normal provision requirement is held. If the country exposure (net) ofthe Bank in respect of each country does not exceed 1% of the total funded assets, no provision is maintained onsuch country exposure.
F-68

4. Transfer and servicing of financial assets
The Bank transfers commercial and consumer loans through securitisation transactions. The transferredloans are de-recognised and gains/losses are recorded only if the Bank surrenders the rights to benefits specifiedin the loan contract. Recourse and servicing obligations are reduced from proceeds of the sale. Retainedbeneficial interests in the loans is measured by allocating the carrying value of the loans between the assets soldand the retained interest, based on the relative fair value at the date of the securitisation.
During the year RBI has issued guidelines on accounting for securitisation of standard assets. In accordancewith these guidelines, with effect from February 1, 2006, the Bank accounts for any loss arising on saleimmediately at the time of sale and the profit/premium arising on account of sale is amortised over the life of thesecurities issued or to be issued by the special purpose vehicle/special purpose entity to which the assets are sold.
5. Fixed assets and depreciation
a) Premises and other fixed assets are carried at cost less accumulated depreciation. Depreciation is chargedover the estimated useful life of a fixed asset on a straight-line basis. The rates of depreciation for fixed assets,which are not lower than the rates prescribed in schedule XIV of the Companies Act, 1956, are given below.
Asset Depreciation Rate
Premises owned by the Bank . . . . . . . . . . . . . . . . . . . . . . . 1.63%Improvements to leasehold premises . . . . . . . . . . . . . . . . . 1.63% or over the lease period, whichever is higherATMs . . . . . . . . . . . . . . . . . . . . . . . . . . . . . . . . . . . . . . . . . 12.50%Plant and machinery like air conditioners, xerox machines,
etc. . . . . . . . . . . . . . . . . . . . . . . . . . . . . . . . . . . . . . . . . . . 10.00%Computers . . . . . . . . . . . . . . . . . . . . . . . . . . . . . . . . . . . . . . 33.33%EDC Terminals . . . . . . . . . . . . . . . . . . . . . . . . . . . . . . . . . . 16.67%Furniture and fixtures . . . . . . . . . . . . . . . . . . . . . . . . . . . . . 15.00%Motor vehicles . . . . . . . . . . . . . . . . . . . . . . . . . . . . . . . . . . . 20.00%Others (including Software and system development
expenses) . . . . . . . . . . . . . . . . . . . . . . . . . . . . . . . . . . . . . 25.00%
b) Depreciation on leased assets is made on a straight-line basis at the higher of the rates determined withreference to the primary period of lease and the rates specified in Schedule XIV to the Companies Act, 1956.
c) Assets purchased/sold during the year are depreciated on the basis of actual number of days the asset hasbeen put to use.
d) Items costing less than Rs. 5,000/- are depreciated fully over a period of 12 months from the date ofpurchase.
6. Foreign currency transactions
a) Foreign currency income and expenditure items of domestic operations are translated at the exchangerates prevailing on the date of the transaction, income and expenditure items of integral foreign operations(representative offices) are translated at weekly average closing rate, and income and expenditure of non-integralforeign operations (foreign branches and offshore banking units) are translated at quarterly average closing rate.
b) Monetary foreign currency assets and liabilities of domestic and integral foreign operations are translatedat closing exchange rates notified by Foreign Exchange Dealers’ Association of India (“FEDAI”) at the balancesheet date and the resulting profits/losses are included in the profit and loss account.
c) Both monetary and non-monetary foreign currency assets and liabilities of non-integral foreign operationsare translated at closing exchange rates notified by FEDAI at the balance sheet date and the resulting profits/losses from exchange differences are accumulated in the foreign currency translation reserve until the disposal ofthe net investment in the non-integral foreign operations.
F-69

d) Outstanding forward exchange contracts are revalued at the exchange rates notified by FEDAI forspecified maturities and at interpolated rates for contracts of in-between maturities. The resultant gains or lossesare recognised in the profit and loss account.
e) Contingent liabilities on account of guarantees, endorsements and other obligations are stated at theexchange rates notified by FEDAI at the balance sheet date.
7. Accounting for derivative contracts
The Bank enters into derivative contracts such as foreign currency options, interest rate and currency swapsand cross currency interest rate swaps to hedge on-balance sheet/off-balance sheet assets and liabilities or fortrading purposes.
The swap contracts entered to hedge on-balance sheet assets and liabilities are structured in such a way thatthey bear an opposite and offsetting impact with the underlying on-balance sheet items. The impact of suchderivative instruments is correlated with the movement of underlying assets and accounted pursuant to theprinciples of hedge accounting.
Foreign currency and rupee derivatives, which are entered for trading purposes, are marked to market andthe resulting gain/loss, (net of provisions, if any) is recorded in the profit and loss account.
8. Employee Stock Option Scheme (“ESOS”)
The Bank has formulated an Employees Stock Option Scheme. The Scheme provides that employees aregranted an option to acquire equity shares of the Bank that vests in a graded manner. The options may beexercised within a specified period. The Bank follows the intrinsic value method as prescribed by the guidancenote on “Accounting for Stock Options” issued by the Institute of Chartered Accountants of India (“ICAI”) toaccount for its stock-based employees compensation plans. Compensation cost measured by the excess, if any, ofthe fair market price of the underlying stock over the exercise price. The grant price of the Bank’s stock option isthe last closing price on the stock exchange on the day preceding the date of grant of stock options andaccordingly there is no compensation cost under the intrinsic value method.
9. Staff retirement benefits
ICICI Bank is required to pay gratuity to employees who retire or resign after at least five years ofcontinuous service. ICICI Bank makes contributions to three separate gratuity funds, for employees inductedfrom erstwhile ICICI, employees inducted from erstwhile Bank of Madura and employees of ICICI Bank otherthan employees inducted from erstwhile ICICI and erstwhile Bank of Madura.
The gratuity funds for employees inducted from erstwhile ICICI and erstwhile Bank of Madura are separategratuity funds managed by ICICI Prudential Life Insurance Company. Actuarial valuation of the gratuity liabilityis determined by an actuary appointed by ICICI Prudential Life Insurance Company. The investments of thefunds are made according to rules prescribed by the Government of India. The accounts of the funds are auditedby independent auditors.
The gratuity fund for employees of ICICI Bank other than employees inducted from erstwhile ICICI anderstwhile Bank of Madura is administered by the Life Insurance Corporation of India. In accordance with thegratuity fund’s rules, actuarial valuation of gratuity liability is calculated based on certain assumptions regardingrate of interest, salary growth, mortality and staff turnover.
ICICI Bank contributes 15.0% of the total annual salary of each employee to a superannuation fund forICICI Bank employees. ICICI Bank’s employees get an option on retirement or resignation to receive one-thirdof the total balance and a monthly pension based on the remaining two-third balance. In the event of death of an
F-70

employee, his or her beneficiary receives the remaining accumulated balance of 66.7%. ICICI Bank also gives acash option to its employees, allowing them to receive the amount contributed by ICICI Bank in their monthlysalary during their employment.
Till March 31, 2005, the superannuation fund was administered solely by the Life Insurance Corporation ofIndia. Subsequent to March 31, 2005, the fund is being administered by both Life Insurance Corporation of Indiaand ICICI Prudential Life Insurance Company Limited. Employees have the option to retain the existing balancewith Life Insurance Corporation of India or seek a transfer to ICICI Prudential Insurance Company.
ICICI Bank is statutorily required to maintain a provident fund as a part of its retirement benefits to itsemployees. There are separate provident funds for employees inducted from erstwhile Bank of Madura (otherthan those employees who have opted for pensions), and for other employees of ICICI Bank. These funds aremanaged by in-house trustees. Each employee contributes 12.0% of his or her basic salary (10.0% for clerks andsub-staff of erstwhile Bank of Madura) and ICICI Bank contributes an equal amount to the funds. Theinvestments of the funds are made according to rules prescribed by the Government of India. The accounts of thefunds are audited by independent auditors.
10. Income taxes
Income tax expense is the aggregate amount of current tax, deferred tax and fringe benefit tax charge.Current year taxes are determined in accordance with the Income-tax Act, 1961. Deferred tax adjustmentscomprise of changes in the deferred tax assets or liabilities during the period.
Deferred tax assets and liabilities are recognised on a prudent basis for the future tax consequences oftiming differences arising between the carrying values of assets and liabilities and their respective tax basis, andcarry forward losses. Deferred tax assets and liabilities are measured using tax rates and tax laws that have beenenacted or substantially enacted prior to the balance sheet date. The impact of changes in the deferred tax assetsand liabilities is recognised in the profit and loss account.
Deferred tax assets are recognised and reassessed at each reporting date, based upon management’sjudgement as to whether realisation is considered certain. Deferred tax assets are recognised on carry forward ofunabsorbed depreciation and tax losses only if there is virtual certainty that such deferred tax asset can berealised against future profits.
11. Impairment of assets
Long-lived assets are reviewed for impairment whenever events or changes in circumstances indicate thatthe carrying amount of an asset may not be recoverable. Recoverability of assets to be held and used is measuredby a comparison of the carrying amount of an asset to future net discounted cash flows expected to be generatedby the asset. If such assets are considered to be impaired, the impairment to be recognised is measured by theamount by which the carrying amount of the assets exceeds the fair value of the assets.
12. Accounting for contingencies
The Bank estimates the probability of any loss that might be incurred on outcome of contingencies on thebasis of information available up to the date on which the financial statements are prepared. A provision isrecognised when an enterprise has a present obligation as a result of past event and it is probable that an outflowof resources will be required to settle the obligation, in respect of which a reliable estimate can be made.Provisions are determined based on management estimate required to settle the obligation at the balance sheetdate, supplemented by experience of similar transactions. These are reviewed at each balance sheet date andadjusted to reflect the current management estimates. In cases where the available information indicates that theloss on the contingency is reasonably possible but the amount of loss cannot be reasonably estimated, adisclosure is made in the financial statements. In case of remote possibility neither provision nor disclosure ismade in the financial statements.
F-71

13. Earnings Per Share (“EPS”)
Basic and diluted earnings per share are calculated by dividing the net profit or loss for the year attributableto equity shareholders by the weighted average number of equity shares outstanding during the year. Dilutedearnings per equity share has been computed using the weighted average number of equity shares and dilutivepotential equity shares outstanding during the period, except where the results are anti-dilutive.
14. Cash and cash equivalents
Cash and cash equivalents include cash in hand, balances with RBI, balances with other banks and money atcall and short notice.
B. NOTES FORMING PART OF THE ACCOUNTS
The following additional disclosures have been made taking into account RBI guidelines in this regard.
1. Capital adequacy ratio
The capital to risk weighted assets ratio (CRAR) as assessed by the Bank on the basis of the financialstatements and guidelines issued by RBI is given in the table below.
As onMarch 31, 2006
As onMarch 31, 2005
Rupees in million
Tier I capital . . . . . . . . . . . . . . . . . . . . . . . . . . . . . . . . . . . . . . . . . . . . . . . . . . . . . . . 191,815.3 102,463.2Tier II capital . . . . . . . . . . . . . . . . . . . . . . . . . . . . . . . . . . . . . . . . . . . . . . . . . . . . . . 86,610.9 56,566.1Total capital . . . . . . . . . . . . . . . . . . . . . . . . . . . . . . . . . . . . . . . . . . . . . . . . . . . . . . . 278,426.2 159,029.3Total risk weighted assets . . . . . . . . . . . . . . . . . . . . . . . . . . . . . . . . . . . . . . . . . . . 2,085,935.9 1,350,168.1CRAR (%) . . . . . . . . . . . . . . . . . . . . . . . . . . . . . . . . . . . . . . . . . . . . . . . . . . . . . . . . . 13.35% 11.78%CRAR—Tier I capital (%) . . . . . . . . . . . . . . . . . . . . . . . . . . . . . . . . . . . . . . . . . . . . 9.20% 7.59%CRAR—Tier II capital (%) . . . . . . . . . . . . . . . . . . . . . . . . . . . . . . . . . . . . . . . . . . . 4.15% 4.19%Amount of subordinated debt raised as Tier II capital during the year . . . . . . . . . . 39,730.0 4,500.0
2. Business/information ratios
The business/information ratios for the year ended March 31, 2006, and March 31, 2005 are given in thetable below.
Year endedMarch 31, 2006
Year endedMarch 31, 2005
(i) Interest income to working funds1 . . . . . . . . . . . . . . . . . . . . . . . . . . . . . . . . . . 7.03% 6.94%(ii) Non-interest income to working funds1 . . . . . . . . . . . . . . . . . . . . . . . . . . . . . . 2.54% 2.52%(iii) Operating profit to working funds1 . . . . . . . . . . . . . . . . . . . . . . . . . . . . . . . . . 2.39% 2.18%(iv) Return on assets2 . . . . . . . . . . . . . . . . . . . . . . . . . . . . . . . . . . . . . . . . . . . . . . . 1.30% 1.48%(v) Profit per employee (Rs. in million) . . . . . . . . . . . . . . . . . . . . . . . . . . . . . . . . . 1.0 1.1
1. For the purpose of computing the ratios, working funds represent the average of total assets as reported toRBI under Section 27 of the Banking Regulation Act, 1949.
2. For the purpose of computing the ratio, assets represent average total assets as reported to RBI in Form Xunder Section 27 of the banking Regulation Act, 1949.
As onMarch 31, 2006
As onMarch 31, 2005
Rupees in millions
(vi) Business per employee (average deposits plus average advances) . . . . . . . . . 90.5 88.0
F-72

3. Information about business and geographical segments
• Consumer and Commercial Banking comprising the retail and corporate banking operations of theBank.
• Investment Banking comprising the treasury activities of the Bank.
Inter-segment transactions are generally based on transfer pricing measures as determined by management.Income, expenses, assets and liabilities are either specifically identified with individual segments or are allocatedto segments on a systematic basis.
Based on such allocations, segmental balance sheet as on March 31, 2006 and March 31, 2005 andsegmental profit & loss account for the year ended March 31, 2006 and for the year ended March 31, 2005 havebeen prepared.
Consumer andcommercial banking Investment banking Total
Particulars
For theyear ended31.03.2006
For theyear ended31.03.2005
For theyear ended31.03.2006
For theyear ended31.03.2005
For theyear ended31.03.2006
For theyear ended31.03.2005
Rupees in million
1. Revenue . . . . . . . . . . . . . . 148,868.9 106,436.9 49,725.0 30,926.2 198,593.9 137,363.12. Less: Inter-segment
revenue . . . . . . . . . . . . . . (10,917.6) (9,102.7)3. Total revenue (1)–(2) . . . 187,676.3 128,260.44. Operating profit (i.e.
Profit before unallocatedexpenses, and tax) . . . . . . 33,870.5 19,760.7 13,420.2 10,183.3 47,290.7 29,944.0
5. Unallocated expenses . . . 384.0 384.06. Provisions (net) . . . . . . . . 7,320.2 814.1 8,620.5 3,473.9 15,940.7 4,288.07. Profit before tax . . . . . . . . 26,550.3 18,946.6 4,799.7 6,709.4 30,966.0 25,272.08. Income tax expenses (net
of deferred tax credit) . . . 5,565.3 5,220.0
9. Net profit(7)-(8) . . . . . . . . 25,400.7 20,052.0
10. Segment assets . . . . . . . . . 1,643,838.9 1,051,486.3 839,301.3 597,045.1 2,483,140.2 1,648,531.411. Unallocated assets . . . . . . 30,749.3 28,062.7
12. Total assets (10)+(11) . . . 2,513,889.5 1,676,594.1
13. Segment liabilities . . . . . . 1,923,206.7 1,291,932.4 590,682.8 384,661.7 2,513,889.5 1,676,594.114. Unallocated liabilities . . . — —
15. Total liabilities(13)+(14) . . . . . . . . . . . . . 2,513,889.5 1,676,594.1
Geographical segments
The Bank reports its operations under the following geographical segments.
• Domestic Operations comprises branches having operations in India.
• Foreign Operations comprises branches having operations outside India and offshore banking unithaving operations in India.
Based on above segments the assets and revenue of the Bank for the year ended March 31, 2006 have beenprepared.
F-73

Sr. No. ParticularsDomestic
OperationsForeign
Operations Total
Rs. in million1. Revenue . . . . . . . . . . . . . . . . . . . . . . . . . . . . . . . . . . . . . . . . . . . . 178,131.7 9,544.7 187,676.42. Assets . . . . . . . . . . . . . . . . . . . . . . . . . . . . . . . . . . . . . . . . . . . . . . 2,295,744.9 218,144.6 2,513,889.5
Hitherto the business operations of the Bank were largely concentrated in India. The assets and income fromforeign operations were not significant to the overall operations of the Bank and have accordingly not beendisclosed for earlier comparative year.
4. Earnings Per Share
The Bank reports basic and diluted earnings per equity share in accordance with Accounting Standard 20,“Earnings per Share”. Basic earnings per share is computed by dividing net profit after tax by the weightedaverage number of equity shares outstanding during the year. Diluted earnings per share is computed using theweighted average number of equity shares and dilutive potential equity shares outstanding during the year.
The computation of earnings per share is given below.
Year endedMarch 31, 2006
Year endedMarch 31, 2005
(Rs. in million except per share data)BasicWeighted average no. of equity shares outstanding . . . . . . . . . . . . . . . . . . . . . . . 781,693,773 727,728,042Net profit . . . . . . . . . . . . . . . . . . . . . . . . . . . . . . . . . . . . . . . . . . . . . . . . . . . . . . . . 25,400.7 20,052.0Basic earnings per share (Rs.) . . . . . . . . . . . . . . . . . . . . . . . . . . . . . . . . . . . . . . . . 32.49 27.55DilutedWeighted average no. of equity shares outstanding . . . . . . . . . . . . . . . . . . . . . . . 789,963,635 733,720,485Net profit . . . . . . . . . . . . . . . . . . . . . . . . . . . . . . . . . . . . . . . . . . . . . . . . . . . . . . . . 25,400.7 20,052.0Diluted earnings per share (Rs.) . . . . . . . . . . . . . . . . . . . . . . . . . . . . . . . . . . . . . . 32.15 27.33Nominal value per share (Rs.) . . . . . . . . . . . . . . . . . . . . . . . . . . . . . . . . . . . . . . . 10.00 10.00
The dilutive impact is due to options granted to employees by the Bank.
5. Maturity pattern
• In compiling the information of maturity pattern (refer 5. (a) and (b) below), certain estimates andassumptions have been made by the management.
• Assets and liabilities in foreign currency exclude off-balance sheet assets and liabilities.
a) The maturity pattern of assets and liabilities of the Bank as on March 31, 2006 is given below.
Maturity bucketsLoans &
advances1Investmentsecurities1 Deposits1 Borrowings1
Total foreigncurrency
assets
Total foreigncurrencyliabilities
Rupees in million1 to 14 days . . . . . . . . . . . . . . . . 75,450.2 103,983.4 149,071.4 31,237.0 41,679.5 37,847.115 to 28 days . . . . . . . . . . . . . . . 8,865.2 44,993.6 69,193.3 10,049.4 11,454.3 18,646.829 days to 3 months . . . . . . . . . 75,231.3 81,976.1 255,473.5 53,804.3 37,365.6 59,270.53 to 6 months . . . . . . . . . . . . . . 89,859.5 64,510.5 231,693.4 46,661.4 32,628.1 28,415.96 months to 1 year . . . . . . . . . . 145,066.0 93,267.8 388,402.8 53,160.2 29,919.0 57,175.51 to 3 years . . . . . . . . . . . . . . . . 591,575.5 142,607.5 520,604.7 72,646.8 37,734.5 43,054.43 to 5 years . . . . . . . . . . . . . . . . 165,878.4 41,030.3 14,002.1 94,981.8 41,477.4 67,547.5Above 5 years . . . . . . . . . . . . . . 309,705.0 143,104.7 22,390.5 22,678.2 49,596.3 12,765.4
Total . . . . . . . . . . . . . . . . . . . . . 1,461,631.1 715,473.9 1,650,831.7 385,219.1 281,854.7 324,723.1
1. Includes foreign currency balances.
F-74

b) The maturity pattern of assets and liabilities of the Bank as on March 31, 2005 is given below.
Maturity bucketsLoans &
advances1Investmentsecurities1 Deposits1 Borrowings1
Total foreigncurrency
assets
Total foreigncurrencyliabilities
Rupees in million
1 to 14 days . . . . . . . . . . . . . . . . . . . 60,518.3 76,283.4 54,262.2 4,008.0 22,857.4 9,193.815 to 28 days . . . . . . . . . . . . . . . . . . 8,069.1 20,403.1 32,683.8 12,311.5 6,607.9 12,023.629 days to 3 months . . . . . . . . . . . . 65,709.7 48,751.0 132,970.0 31,264.5 31,162.4 31,853.93 to 6 months . . . . . . . . . . . . . . . . . 50,320.5 47,302.7 159,242.9 32,491.4 17,851.7 18,568.26 months to 1 year . . . . . . . . . . . . . 84,088.2 60,431.9 195,407.5 56,986.8 13,830.7 29,450.21 to 3 years . . . . . . . . . . . . . . . . . . . 294,282.1 113,986.8 398,826.7 111,143.4 30,191.2 30,242.43 to 5 years . . . . . . . . . . . . . . . . . . . 94,524.5 27,618.4 15,087.5 53,323.6 19,326.3 40,075.9Above 5 years . . . . . . . . . . . . . . . . . 256,539.1 110,096.2 9,707.2 33,915.8 28,915.1 16,229.0
Total . . . . . . . . . . . . . . . . . . . . . . . . 914,051.5 504,873.5 998,187.8 335,445.0 170,742.7 187,637.0
1. Includes foreign currency balances.
6. Related party transactions
The Bank has transactions with its related parties comprising of subsidiaries, associates joint ventures andkey management personnel. The following represents the significant transactions between the Bank and itsrelated parties.
Insurance services
During the year ended March 31, 2006, the Bank paid insurance premium to insurance joint venturesamounting to Rs. 829.6 million (March 31, 2005: Rs. 315.4 million). During the year ended March 31, 2006 theBank received claims from insurance joint ventures amounting to Rs. 16.8 million (March 31, 2005: Rs. 8.4million).
Fees and commission
During the year ended March 31, 2006, the Bank received fees from its subsidiaries and joint venturesamounting to Rs. 2,280.5 million (March 31, 2005: Rs. 279.8 million) and commission of Rs. 9.9 million (March31, 2005: Rs. 5.3 million) on account of guarantees and letters of credit issued for subsidiaries.
Lease of premises and facilities
During the year ended March 31, 2006, the Bank charged an aggregate amount of Rs. 443.7 million (March31, 2005: Rs. 432.8 million) for lease of premises, facilities and other administrative costs to subsidiaries andjoint ventures.
Sale/Purchase of housing loan portfolio
During the year ended March 31, 2006, the Bank sold housing loan portfolio to its subsidiary amounting toRs. 37,711.0 million (March 31, 2005: Rs. 3,059.7 million). During the year ended March 31, 2006, the Bankpurchased housing portfolio from its subsidiary amounting to Rs. 18,307.7 million (March 31, 2005: Rs. Nil).
Secondment of employees
During the year ended March 31, 2006, the Bank received Rs. 3.0 million (March 31, 2005: Rs. 8.4 million)from subsidiaries and joint ventures for secondment of employees.
F-75

Purchase of investments
During the year ended March 31, 2006, the Bank purchased certain investments from its subsidiaries andjoint ventures amounting to Rs. 15,255.5 million (March 31, 2005: Rs. 32,440.1 million) and from its associatesamounting to Rs. Nil (March 31, 2005: Rs. 820.0 million).
Sale of investments
During the year ended March 31, 2006, the Bank sold certain investments to its subsidiaries and jointventures amounting to Rs. 6,757.7 million (March 31, 2005: Rs. 22,668.5 million) and to its associatesamounting to Rs. 1,545.0 million (March 31, 2005: Rs. Nil). On the sales made to subsidiaries and joint ventures,the Bank accounted for a gain of Rs. 16.7 million (March 31, 2005: Loss of Rs. 12.4 million) and on the salemade to associates, the Bank accounted for a gain of Rs. 10.1 million (March 31, 2005: Rs. Nil).
Redemption/Buyback and Conversion of investments
During the year ended March 31, 2006, certain investments in subsidiaries and joint ventures in preferenceshares were converted to equity shares amounting to Rs. Nil (March 31, 2005: Rs. 250.0 million). Considerationof Rs. 1,078.9 million (March 31, 2005: Rs. 106.9 million) was received on account of buyback/capital reductionof equity shares by subsidiaries and a gain amounting to Rs. 620.6 million (March 31, 2005: Rs. 67.4 million)was accounted in the books. Units in associates amounting to Rs. 1,162.3 million (March 31, 2005: Rs. 2,362.8million) were redeemed during the year and a gain of Rs. Nil (March 31, 2005: Rs. 19.8 million) was accountedon redemption.
Reimbursement of expenses
During the year ended March 31, 2006, the Bank reimbursed expenses to its subsidiaries amounting toRs. 3,397.8 million (March 31, 2005: Rs. 2,596.0 million).
Brokerage paid
During the year ended March 31, 2006, the Bank paid brokerage to its subsidiary amounting toRs. 13.6 million (March 31, 2005: Rs. 9.1 million).
Custodial charges received
During the year ended March 31, 2006, the Bank received custodial charges from its subsidiaries and jointventures amounting to Rs. 15.8 million (March 31, 2005: Rs. 5.7 million) and associates amounting toRs. 5.4 million (March 31, 2005: Rs. 2.2 million).
Interest paid
During the year ended March 31, 2006, the Bank paid interest to its subsidiaries and joint venturesamounting to Rs. 384.2 million (March 31, 2005: Rs. 255.7 million) and to its associates amounting to Rs. Nil(March 31, 2005: Rs. 1.1 million).
Interest received
During the year ended March 31, 2006, the Bank received interest from its subsidiaries and joint venturesamounting to Rs. 613.6 million (March 31, 2005: Rs. 376.7 million) and from its key management personnel1
Rs. 0.5 million (March 31, 2005: Rs. 0.3 million).
Other Income
During the year ended March 31, 2006, the Bank has accounted gain/loss on derivative transactions enteredinto with subsidiaries and joint ventures amounting to Rs. 245.3 million (March 31, 2005: Gain of Rs. 462.3million).
F-76

Dividend received
During the year ended March 31, 2006, the Bank received dividend from its subsidiaries and joint venturesamounting to Rs. 1,635.6 million (March 31, 2005: Rs. 714.5 million) and from its associates amounting toRs. 1,808.2 million (March 31, 2005: Rs. 1,221.8 million).
Dividend paid
During the year ended March 31, 2006, the Bank paid dividend to its key management personnel1
amounting to Rs. 3.2 million (March 31, 2005: Rs. 1.6 million).
Remuneration to whole-time directors
Remuneration paid to the whole-time directors of the Bank during the year ended March 31, 2006 wasRs. 75.9 million (March 31, 2005: Rs. 60.5 million).
Letters of Comfort
The Bank has issued letters of comfort on behalf of its foreign subsidiaries namely, ICICI Bank UK Limitedand ICICI Bank Canada Limited. The details of the same are given in the table below.
On behalf of To Purpose
ICICI Bank UK Limited . . . . . . . . . Financial Services Authority, UK(“FSA”)
To financially support ICICI BankUK Limited to ensure that it meetsall of its financial obligations asthey fall due.
ICICI Bank Canada . . . . . . . . . . . . . Office of the Superintendent ofFinancial Institutions, Canada(“OSFI”)
To infuse additional capital shouldICICI Bank Canada’s capital fallbelow the minimum requirementand provide ICICI Bank Canadaongoing financial, managerial andoperational support.
ICICI Bank Canada . . . . . . . . . . . . . Canada Deposit InsuranceCorporation (“CDIC”)
To comply with the Bank Act andthe CDIC regulations or by-lawsthere under and to indemnify CDICagainst all losses, damages,reasonable costs and expensesarising from failure of ICICI BankCanada in performing the same.
F-77

Related party balances
The balances payable to/ receivable from subsidiaries/ joint ventures/ associates/ key management personnelincluded in the balance sheet as on March 31, 2006 are given below.
ItemsSubsidiaries /Joint ventures Associates
Key managementpersonnel1 Total
Rupees in million
Deposits with ICICI Bank . . . . . . . . . . . . . . . . . . . . . . . . . 8,734.8 274.9 25.0 9,034.7Deposits of ICICI Bank2 . . . . . . . . . . . . . . . . . . . . . . . . . . 11,339.7 — — 11,339.7Call/ Term money borrowed . . . . . . . . . . . . . . . . . . . . . . . — — — —Advances . . . . . . . . . . . . . . . . . . . . . . . . . . . . . . . . . . . . . . 1,631.9 — 15.4 1,647.3Investments of ICICI Bank . . . . . . . . . . . . . . . . . . . . . . . . 29,263.2 14,228.5 — 43,491.7Investments of related parties in ICICI Bank . . . . . . . . . . 447.5 — 4.3 451.8Receivables . . . . . . . . . . . . . . . . . . . . . . . . . . . . . . . . . . . . 666.0 2.0 — 668.0Payables . . . . . . . . . . . . . . . . . . . . . . . . . . . . . . . . . . . . . . . 779.2 — — 779.2Repo . . . . . . . . . . . . . . . . . . . . . . . . . . . . . . . . . . . . . . . . . . — — — —Reverse repo . . . . . . . . . . . . . . . . . . . . . . . . . . . . . . . . . . . . — — — —Guarantees3 . . . . . . . . . . . . . . . . . . . . . . . . . . . . . . . . . . . . 3,634.0 — — 3,634.0Letters of comfort4 . . . . . . . . . . . . . . . . . . . . . . . . . . . . . . 30,059.6 — — 30,059.6Swaps/forward contracts . . . . . . . . . . . . . . . . . . . . . . . . . . 148,404.1 — — 148,404.1Participation certificate . . . . . . . . . . . . . . . . . . . . . . . . . . . 2,320.0 — — 2,320.0
1. Whole-time directors and relatives.2. Includes call money lent.3. Includes letter of undertaking.4. Excludes letter of comfort issued on behalf of foreign subsidiaries, details of which are given separately.
The maximum balance payable to/ receivable from subsidiaries/ joint ventures/ associates/ key managementpersonnel during the year ended March 31, 2006 is given below.
ItemsSubsidiaries /Joint ventures Associates
Key managementpersonnel1 Total
Rupees in million
Deposits with ICICI Bank . . . . . . . . . . . . . . . . . . . . . . . . . 11,331.7 2,160.2 46.1 13,538.0Deposits of ICICI Bank2 . . . . . . . . . . . . . . . . . . . . . . . . . . 12,223.9 — — 12,223.9Call/ Term money borrowed . . . . . . . . . . . . . . . . . . . . . . . 7,490.3 — — 7,490.3Advances . . . . . . . . . . . . . . . . . . . . . . . . . . . . . . . . . . . . . . 2,245.8 — 21.2 2,267.0Investments of ICICI Bank . . . . . . . . . . . . . . . . . . . . . . . . 29,960.3 14,726.8 — 44,687.1Investments of related parties in ICICI Bank . . . . . . . . . . 547.1 — 4.4 551.5Receivables . . . . . . . . . . . . . . . . . . . . . . . . . . . . . . . . . . . . 798.4 4.1 — 802.5Payables . . . . . . . . . . . . . . . . . . . . . . . . . . . . . . . . . . . . . . . 3,060.0 0.5 — 3,060.5Repo . . . . . . . . . . . . . . . . . . . . . . . . . . . . . . . . . . . . . . . . . . 400.3 — — 400.3Reverse repo . . . . . . . . . . . . . . . . . . . . . . . . . . . . . . . . . . . . 2,244.7 — — 2,244.7Guarantees3 . . . . . . . . . . . . . . . . . . . . . . . . . . . . . . . . . . . . 5,196.3 — — 5,196.3Letters of comfort4 . . . . . . . . . . . . . . . . . . . . . . . . . . . . . . 30,815.7 — — 30,815.7Swaps/forward contracts . . . . . . . . . . . . . . . . . . . . . . . . . . 207,739.7 — — 207,739.7Participation certificate . . . . . . . . . . . . . . . . . . . . . . . . . . . 2,320.0 — — 2,320.0
1. Whole-time directors and relatives.2. Includes call money lent.3. Includes letter of undertaking.4. Excludes letter of comfort issued on behalf of foreign subsidiaries, details of which are given separately.
F-78

The balances payable to/ receivable from subsidiaries/ joint ventures/ associates/ key management personnelincluded in the balance sheet as on March 31, 2005 are given below.
ItemsSubsidiaries /Joint ventures Associates
Key managementpersonnel1 Total
Rupees in millionDeposits with ICICI Bank . . . . . . . . . . . . . . . . . . . . . . . . . 6,593.6 0.3 37.1 6,631.0Deposits of ICICI Bank2 . . . . . . . . . . . . . . . . . . . . . . . . . . 9,798.9 — — 9,798.9Call/ Term money borrowed . . . . . . . . . . . . . . . . . . . . . . . 459.2 — — 459.2Advances . . . . . . . . . . . . . . . . . . . . . . . . . . . . . . . . . . . . . . 322.9 — 19.1 342.0Investments of ICICI Bank . . . . . . . . . . . . . . . . . . . . . . . . 20,734.1 14,470.5 — 35,204.6Investments of related parties in ICICI Bank . . . . . . . . . . 1.6 — 2.3 3.9Receivables . . . . . . . . . . . . . . . . . . . . . . . . . . . . . . . . . . . . 202.4 — — 202.4Payables . . . . . . . . . . . . . . . . . . . . . . . . . . . . . . . . . . . . . . . 885.3 — — 885.3Repo . . . . . . . . . . . . . . . . . . . . . . . . . . . . . . . . . . . . . . . . . . — — — —Reverse repo . . . . . . . . . . . . . . . . . . . . . . . . . . . . . . . . . . . . 2,244.7 — — 2,244.7Guarantees3 . . . . . . . . . . . . . . . . . . . . . . . . . . . . . . . . . . . . 4,928.3 — — 4,928.3Letters of comfort4 . . . . . . . . . . . . . . . . . . . . . . . . . . . . . . 21,318.3 — — 21,318.3Swaps/forward contracts . . . . . . . . . . . . . . . . . . . . . . . . . . 118,137.1 — — 118,137.1Participation certificate . . . . . . . . . . . . . . . . . . . . . . . . . . . 896.6 — — 896.6
1. Whole-time directors and relatives.2. Includes call money lent.3. Includes letter of undertaking.4. Excludes letter of comfort issued on behalf of foreign subsidiaries, details of which are given separately.
The maximum balance payable to/ receivable from subsidiaries/ joint ventures/ associates/ key managementpersonnel during the year ended March 31, 2005 is given below.
ItemsSubsidiaries /Joint ventures Associates
Key managementpersonnel1 Total
Rupees in millionDeposits with ICICI Bank . . . . . . . . . . . . . . . . . . . . . . . . . 19,352.2 2,405.5 196.1 21,953.8Deposits of ICICI Bank2 . . . . . . . . . . . . . . . . . . . . . . . . . . 9,798.9 — — 9,798.9Call/ Term money borrowed . . . . . . . . . . . . . . . . . . . . . . . 3,500.0 — — 3,500.0Advances . . . . . . . . . . . . . . . . . . . . . . . . . . . . . . . . . . . . . . 2,435.6 — 19.1 2,454.7Investments of ICICI Bank . . . . . . . . . . . . . . . . . . . . . . . . 40,204.6 33,399.0 — 73,603.6Investments of related parties in ICICI Bank . . . . . . . . . . 16.6 — 2.3 18.9Receivables . . . . . . . . . . . . . . . . . . . . . . . . . . . . . . . . . . . . 202.4 — — 202.4Payables . . . . . . . . . . . . . . . . . . . . . . . . . . . . . . . . . . . . . . . 1,762.1 — — 1,762.1Repo . . . . . . . . . . . . . . . . . . . . . . . . . . . . . . . . . . . . . . . . . . 128.8 — — 128.8Reverse repo . . . . . . . . . . . . . . . . . . . . . . . . . . . . . . . . . . . . 2,244.7 — — 2,244.7Guarantees3 . . . . . . . . . . . . . . . . . . . . . . . . . . . . . . . . . . . . 4,928.3 — — 4,928.3Letters of comfort4 . . . . . . . . . . . . . . . . . . . . . . . . . . . . . . 21,318.3 — — 21,318.3Swaps/forward contracts . . . . . . . . . . . . . . . . . . . . . . . . . . 230,905.2 — — 230,905.2Participation certificate . . . . . . . . . . . . . . . . . . . . . . . . . . . 896.6 — — 896.6
1. Whole-time directors and relatives.2. Includes call money lent.3. Includes letter of undertaking.4. Excludes letter of comfort issued on behalf of foreign subsidiaries, details of which are given separately.
Subsidiaries and joint ventures
ICICI Venture Funds Management Company Limited, ICICI Securities Limited, ICICI Brokerage ServicesLimited, ICICI International Limited, ICICI Trusteeship Services Limited, ICICI Home Finance Company
F-79

Limited, ICICI Investment Management Company Limited, ICICI Securities Holdings Inc., ICICI Securities Inc.,ICICI Bank UK Limited, ICICI Bank Canada, ICICI Prudential Life Insurance Company Limited, ICICIDistribution Finance Private Limited (ICICI Distribution Finance Private Limited has merged with ICICI HomeFinance Company Limited effective August 11, 2005), ICICI Lombard General Insurance Company Limited,Prudential ICICI Asset Management Company Limited, Prudential ICICI Trust Limited, ICICI Bank EurasiaLimited Liability Company and TSI Ventures (India) Private Limited.
Associates
ICICI Equity Fund, ICICI Eco-net Internet and Technology Fund, ICICI Emerging Sectors Fund, ICICIStrategic Investments Fund, ICICI Property Trust and TCW/ICICI Investment Partners L.L.C.
7. Securitisation
The Bank sells loans through securitisation and direct assignment. The information on securitisation activityof the Bank as an originator for the year ended March 31, 2006 and March 31, 2005 is given in the table below.
Year endedMarch 31, 2006
Year endedMarch 31, 2005
Rupees in million
Total number of loan assets securitised . . . . . . . . . . . . . . . . . . . . . . . . . . . . . . . . . . 909,130 942,567Total book value of loan assets securitised . . . . . . . . . . . . . . . . . . . . . . . . . . . . . . . . 94,856.2 160,071.2Sale consideration received for the securitised assets . . . . . . . . . . . . . . . . . . . . . . . 102,856.6 163,412.2Net gain on account of securitisation . . . . . . . . . . . . . . . . . . . . . . . . . . . . . . . . . . . . 4,032.4 3,976.1
The information on securitisation activity of the Bank as an originator as on March 31, 2006 and March 31,2005 is given in the table below.
As onMarch 31, 2006
As onMarch 31, 2005
Rupees in million
Outstanding credit enhancement . . . . . . . . . . . . . . . . . . . . . . . . . . . . . . . . . . . . . . . . 16,369.2 7,234.3Outstanding liquidity facility . . . . . . . . . . . . . . . . . . . . . . . . . . . . . . . . . . . . . . . . . . 2,640.4 —Outstanding servicing liability . . . . . . . . . . . . . . . . . . . . . . . . . . . . . . . . . . . . . . . . . 695.6 260.7Outstanding subordinate contributions . . . . . . . . . . . . . . . . . . . . . . . . . . . . . . . . . . . 8,369.8 17,712.7
8. Employee Stock Option Scheme
In terms of the ESOS, as amended, the maximum number of options granted to any eligible employee in afinancial year shall not exceed 0.05% of the issued equity shares of the Bank at the time of grant of the optionsand aggregate of all such options granted to the eligible employees shall not exceed 5% of the aggregate numberof the issued equity shares of the Bank on the date(s) of the grant of options.
In terms of the Scheme, 17,362,584 options (March 31, 2005: 18,215,335 options) granted to eligibleemployees were outstanding at March 31, 2006.
F-80

A summary of the status of the Bank’s stock option plan is given below.
Stock Options Outstanding
Year endedMarch 31, 2006
Year endedMarch 31, 2005
Outstanding at the beginning of the year . . . . . . . . . . . . . . . . . . . . . . . . . . . . . . . . . 18,215,335 15,964,982Add: Granted during the year . . . . . . . . . . . . . . . . . . . . . . . . . . . . . . . . . . . . . . . . . . 4,981,780 7,554,500Less: Forfeited/lapsed during the year . . . . . . . . . . . . . . . . . . . . . . . . . . . . . . . . . . . 931,280 846,496
Exercised during the year . . . . . . . . . . . . . . . . . . . . . . . . . . . . . . . . . . . . . . . . 4,903,251 4,457,6511
Outstanding at the end of the year . . . . . . . . . . . . . . . . . . . . . . . . . . . . . . . . . . . . . . 17,362,584 18,215,335
1. Excludes options exercised but not allotted.
9. Preference shares
Certain government securities amounting to Rs. 2,001.1 million (March 31, 2005: Rs. 1,952.3 million) havebeen earmarked against redemption of preference share capital, which falls due for redemption on April 20, 2018,as per the original issue terms.
10. Transfer to Investment Fluctuation Reserve (“IFR”)
An amount of Rs. 2,143.4 million being the excess balance in Investment Fluctuation Reserve (IFR) accountover the regulatory requirement was transferred to general reserve account during the year ended March 31,2005. RBI has subsequently instructed that this amount should be retained in IFR account itself. Accordingly, thesaid amount was transferred back to IFR account from the general reserve account in the first quarter of the yearended March 31, 2006, making IFR account balance Rs. 7,303.4 million.
RBI required banks to create Investment Fluctuation Reserve aggregating to 5% of their investments infixed income securities (in AFS and Trading Book) over a five-year period starting from March 31, 2002.Accordingly a further amount of Rs. 5,900.0 million was transferred to IFR during the year ended March 31,2006, making the IFR account balance Rs. 13,203.4 million. RBI has vide its circularDBOD.No.BP.BC.38/21.04.141/2005-06 dated October 10, 2005 permitted banks that have maintained capital ofat least 9% of the risk weighted assets for both credit risk and market risk for both held for trading and availablefor sale categories of investments as on March 31, 2006, to transfer the balance in the IFR ‘below the line’ in theProfit and Loss Appropriation Account to Statutory Reserve, General Reserve or balance of Profit & LossAccount.
Pursuant to the above, the entire IFR account balance of Rs. 13,203.4 million has been transferred from IFRto Revenue and other Reserves.
11. Subordinated debt
a) During the year ended March 31, 2006, the Bank raised subordinated debt amounting toRs. 39,730.0 million through private placement of bonds. The details of these bonds are given below.
Particulars Date of Issue Coupon Rate (%) Tenure Amount
Rupees in million
Tranche 3 Option I . . March 31, 2006 8.83% Annual 10 years and 15 days 2,500.0Tranche 2 Option I . . March 25, 2006 8.80% Annual 9 years 11 months and
19 days 20,000.0Tranche 1 Option I . . March 14, 2006 8.55% Annual 10 years and 1 month 2,500.0
Total . . . . . . . . . . . . . . 25,000.0
F-81

Particulars Date of Issue Coupon Rate (%) Tenure Amount
Rupees in million
Option I . . . . . . . . . . February 14, 2006 8.15% Annual 10 years 1,190.0Option II . . . . . . . . . February 14, 2006 8.25% Annual 15 years 370.0
Total . . . . . . . . . . . . . 1,560.0
Particulars Date of Issue Coupon Rate (%) Tenure Amount
Rupees in million
Option II . . . . . . . . . December 30, 2005 7.60% (semi-annually) 10 years 1,010.0Option III . . . . . . . . . December 30, 2005 7.75% (semi-annually) 12 years 1,020.0Option IV . . . . . . . . . December 30, 2005 7.80% (semi-annually) 15 years 890.0
Total . . . . . . . . . . . . . 2,920.0
Particulars Date of Issue Coupon Rate (%) Tenure Amount
Rupees in million
Option I . . . . . . . . . . September 28, 2005 1 Yr INBMK1 + 0.50%(To be reset semi-annually)
5 years and 7 months 2,250.0
Option II . . . . . . . . . September 28, 2005 7.50 10 years 2,750.0
Total . . . . . . . . . . . . . 5,000.0
1. INBMK—Indian Benchmark.
Particulars Date of Issue Coupon Rate (%) Tenure Amount
Rupees in million
Option I . . . . . . . . . . June 29, 2005 1 Yr INBMK1 + 0.50%(To be reset semi-annually)
5 years and 10months 1,100.0
Option II . . . . . . . . . June 29, 2005 7.25 5 years and 10months 770.0
Option III . . . . . . . . . June 29, 2005 7.45 10 years 3,380.0
Total . . . . . . . . . . . . . 5,250.0
1. INBMK—Indian Benchmark.
b) During the year ended March 31, 2005, the Bank raised subordinate debt amounting toRs. 4,500.0 million through private placement of bonds. The details of these bonds are given below.
Particulars Date of Issue Coupon Rate (%) Tenure Amount
Rupees in million
Option I . . . . . . . . . . February 28, 2005 1 Yr INBMK1 + 0.60%(To be reset semi-annually)
5 years and 3 months 2,650.0
Option II . . . . . . . . . February 28, 2005 7.00 5 years and 3 months 350.0Option III . . . . . . . . . February 28, 2005 7.10 7 years and 3 months 550.0Option IV . . . . . . . . . February 28, 2005 7.20 10 years and 3 months 950.0
Total . . . . . . . . . . . . . 4,500.0
1. INBMK—Indian Benchmark.
F-82

12. Investments
The details of investments and the movement of provisions held towards depreciation of investments of theBank as on March 31, 2006 and March 31, 2005 is given below.
ParticularsAs on
March 31, 2006As on
March 31, 2005
Rupees in million
(1) Value of Investments(i) Gross value of investments
(a) In India . . . . . . . . . . . . . . . . . . . . . . . . . . . . . . . . . . . . . . . . . . . . . . . . 675,324.8 496,627.7(b) Outside India . . . . . . . . . . . . . . . . . . . . . . . . . . . . . . . . . . . . . . . . . . . . 45,215.5 15,124.3
(ii) Provisions for depreciation and fair value provision(a) In India . . . . . . . . . . . . . . . . . . . . . . . . . . . . . . . . . . . . . . . . . . . . . . . . 4,960.5 6,869.5(b) Outside India . . . . . . . . . . . . . . . . . . . . . . . . . . . . . . . . . . . . . . . . . . . . 105.9 9.0
(iii) Net value of investments(a) In India . . . . . . . . . . . . . . . . . . . . . . . . . . . . . . . . . . . . . . . . . . . . . . . . 670,364.3 489,758.2(b) Outside India . . . . . . . . . . . . . . . . . . . . . . . . . . . . . . . . . . . . . . . . . . . . 45,109.6 15,115.3
(2) Movement of provisions held towards depreciation on investments(i) Opening balance . . . . . . . . . . . . . . . . . . . . . . . . . . . . . . . . . . . . . . . . . . . . 6,079.1 10,470.8(ii) Add: Provisions made during the year (including utilisation of fair
value provision) . . . . . . . . . . . . . . . . . . . . . . . . . . . . . . . . . . . . . . . . . . . . 692.3 (949.1)(iii) Less: Write-off / write-back of excess provisions during the year . . . . . . (1,705.0 ) (3,442.6)
(iv) Closing balance . . . . . . . . . . . . . . . . . . . . . . . . . . . . . . . . . . . . . . . . . . . . . 5,066.4 6,079.1
13. Investments in equity shares and equity like instruments
The details of the investments made by the Bank in equity and equity like instruments is given below.
As onMarch 31, 2006
As onMarch 31, 2005
Rupees in million
Equity shares1 . . . . . . . . . . . . . . . . . . . . . . . . . . . . . . . . . . . . . . . . . . . . . . . . . . . . . . 14,453.1 9,231.4Convertible debentures . . . . . . . . . . . . . . . . . . . . . . . . . . . . . . . . . . . . . . . . . . . . . . . 583.8 585.0Units of equity-oriented mutual funds . . . . . . . . . . . . . . . . . . . . . . . . . . . . . . . . . . . 200.6 252.7Investment in venture capital funds . . . . . . . . . . . . . . . . . . . . . . . . . . . . . . . . . . . . . 16,149.9 11,761.6Others (loans against collateral, advances to brokers)2 . . . . . . . . . . . . . . . . . . . . . . 12,956.0 6,683.6Total . . . . . . . . . . . . . . . . . . . . . . . . . . . . . . . . . . . . . . . . . . . . . . . . . . . . . . . . . . . . . 44,343.4 28,514.3
1. Includes advance application money pending allotment of Rs. 2,560.6 million (March 31, 2005:Rs. 821.3 million).
2. Includes unutilised limits sanctioned to brokers and individuals against shares amounting toRs. 3,648.5 million (March 31, 2005: Rs. 3,495.2 million).
F-83

14. Investment in non-SLR securities
i) Issuer composition of non-SLR investments
a) The issuer composition of non-SLR investments of the Bank as on March 31, 2006 is given below.
No. Issuer AmountExtent of private
placement
Extent of ‘belowinvestment
grade’ securities
Extent of‘unrated’securities2
Extent of‘unlisted’securities2
Rupees in million(a) (b) (c) (d)
1 PSUs . . . . . . . . . . . . . . . . . . . . . . . . . . . . 2,875.6 277.5 32.1 0.5 32.62 FIs . . . . . . . . . . . . . . . . . . . . . . . . . . . . . . 1,918.2 920.3 — 91.3 91.33 Banks . . . . . . . . . . . . . . . . . . . . . . . . . . . . 22,373.4 7,087.2 — — 50.04 Private corporates . . . . . . . . . . . . . . . . . . 43,351.2 17,367.6 — 17,256.5 15,879.35 Subsidiaries/ Joint ventures . . . . . . . . . . . 28,607.0 2,704.8 — 150.0 150.06 Others . . . . . . . . . . . . . . . . . . . . . . . . . . . 110,647.5 29,891.5 23,422.1 0.3 —7 Provision held towards depreciation . . . . (5,043.9) — — — —
Total . . . . . . . . . . . . . . . . . . . . . . . . . . . . 204,729.0 58,248.9 23,454.2 17,498.6 16,203.2
1. Amounts reported under columns (a), (b), (c), and (d) above are not mutually exclusive.2. This excludes investments, amounting to Rs. 2,554.8 million, in preference shares of subsidiaries, namely
ICICI Bank UK Limited and ICICI Bank Canada and Rs. 32,644.2 million invested by overseas branches /offshore banking unit.
b) The issuer composition of non-SLR investments of the Bank as on March 31, 2005 is given below.
No. Issuer AmountExtent of private
placement
Extent of ‘belowinvestment
grade’ securities
Extent of‘unrated’securities2
Extent of‘unlisted’securities2
Rupees in million(a) (b) (c) (d)
1 PSUs . . . . . . . . . . . . . . . . . . . . . . . . . . . . 6,250.0 4,620.5 — 20.5 2,933.62 FIs . . . . . . . . . . . . . . . . . . . . . . . . . . . . . . 3,264.3 342.3 — 101.3 101.33 Banks . . . . . . . . . . . . . . . . . . . . . . . . . . . . 4,684.5 2,419.8 — — 53.14 Private corporates . . . . . . . . . . . . . . . . . . 45,210.9 30,553.2 200.0 31,362.1 29,677.45 Subsidiaries/Joint ventures . . . . . . . . . . . 20,667.0 2,661.3 — 150.0 150.06 Others . . . . . . . . . . . . . . . . . . . . . . . . . . . 86,856.4 27,821.3 23,359.0 0.3 —7 Provision held towards depreciation . . . . (6,877.5) — — — —
Total . . . . . . . . . . . . . . . . . . . . . . . . . . . . 160,055.6 68,418.4 23,559.0 31,634.2 32,915.4
1. Amounts reported under columns (a), (b), (c), and (d) above are not mutually exclusive.2. This excludes investments, amounting to Rs. 2,551.3 million, in preference shares of subsidiaries, namely
ICICI Bank UK Limited and ICICI Bank Canada and Rs. 7,189.6 million invested by overseas branches /offshore banking unit.
ii) Non-performing non-SLR investments
The movement in gross non-performing non-SLR investments of the Bank as on March 31, 2006, andMarch 31, 2005 are given below.
ParticularsYear ended
March 31, 2006Year ended
March 31, 2005
Rupees in millionOpening balance . . . . . . . . . . . . . . . . . . . . . . . . . . . . . . . . . . . . . . . . . . . . . . . . . . . . 8,877.3 12,334.7Additions during the year . . . . . . . . . . . . . . . . . . . . . . . . . . . . . . . . . . . . . . . . . . . . . 2,158.0 1,570.3Reduction during the year . . . . . . . . . . . . . . . . . . . . . . . . . . . . . . . . . . . . . . . . . . . . . 8,439.4 5,027.3Closing balance . . . . . . . . . . . . . . . . . . . . . . . . . . . . . . . . . . . . . . . . . . . . . . . . . . . . . 2,595.9 8,877.3Total provisions held . . . . . . . . . . . . . . . . . . . . . . . . . . . . . . . . . . . . . . . . . . . . . . . . 1,509.3 3,166.7
F-84

15. Repurchase transactions
The details of securities sold and purchased under repos and reverse repos during the year ended March 31,2006, and March 31, 2005 are given below.
Minimumoutstanding
balanceduring the
period
Maximumoutstanding
balanceduring the
period
Daily averageoutstanding
balanceduring the
periodBalance as on
year end
Rupees in million
Year ended March 31, 2006Securities sold under repurchase transaction . . . . . . . . . . . . . — 43,134.3 15,296.0 10,000.0Securities purchased under reverse repurchase
transaction . . . . . . . . . . . . . . . . . . . . . . . . . . . . . . . . . . . . . — 33,608.7 1,214.9 —Year ended March 31, 2005Securities sold under repurchase transaction . . . . . . . . . . . . . — 34,842.0 9,683.6 13,076.3Securities purchased under reverse repurchase
transaction . . . . . . . . . . . . . . . . . . . . . . . . . . . . . . . . . . . . . — 14,520.0 586.7 —
Note: The above figures do not include securities sold and purchased under Liquidity Adjustment Facility(“LAF”) of RBI. The above figures are for Indian branches only.
16. Lending to sensitive sectors
The Bank has lending to sectors, which are sensitive to asset price fluctuations. The sensitive sectors includecapital market, real estate and commodities.
The net position of lending to capital market and commodities sector is given in the table below.
As onMarch 31, 2006
As onMarch 31, 2005
Rupees in million
Capital market sector(i) Investments made in equity shares . . . . . . . . . . . . . . . . . . . . . . . . . . . . . . . . . . 14,453.1 9,231.4(ii) Investments in bonds / convertible debentures . . . . . . . . . . . . . . . . . . . . . . . . . 583.8 585.0(iii) Investments in units of equity-oriented mutual funds . . . . . . . . . . . . . . . . . . . 200.6 252.7(iv) Advances against share to individuals for investment in equity shares
(including IPOs /ESOPS), bonds and debentures, units of equity-orientedmutual funds1 . . . . . . . . . . . . . . . . . . . . . . . . . . . . . . . . . . . . . . . . . . . . . . . . . . 5,470.1 1,563.2
(v) Secured and unsecured advances to stockbrokers and guarantees issued onbehalf of stockbrokers and market makers 7,485.9 5,120.4
Total2 . . . . . . . . . . . . . . . . . . . . . . . . . . . . . . . . . . . . . . . . . . . . . . . . . . . . . . . . 28,193.5 16,752.7
(vi) Of (v) above, the total finance extended to stockbrokers formargin trading . . . . . . . . . . . . . . . . . . . . . . . . . . . . . . . . . . . . . . . . . . . . . . . . . . — —Commodities sector . . . . . . . . . . . . . . . . . . . . . . . . . . . . . . . . . . . . . . . . . . . . . 29,849.4 10,061.0
1. Represents loans to Non-Banking Financial Companies (“NBFCs”), brokers and individuals against pledgeof shares and includes an amount of Rs. 102.7 million as on March 31, 2006 (March 31, 2005: Rs. 141.0million) pertaining to guarantee issued to a corporate for the issue of non-convertible debentures, theproceeds of which have been utilised for acquisition of shares by the corporate.
2. The total does not include exposure in unregistered Venture Capital funds amounting to Rs.16,149.9 million as of March 31, 2006 (March 31, 2005: Rs. 11,761.6 million) which forms a part of capitalmarket sector.
F-85

The net position of lending to real estate sector is given in the table below.
As on March 31, 2006 As on March 31, 2005
Rupees in millionReal estate sectorI Direct exposure . . . . . . . . . . . . . . . . . . . . . . . . . . . . . . . . . . . . . . . . 501,514.8 322,930.6(i) Residential mortgages, of which . . . . . . . . . . . . . . . . . . . . . . . . . . . 431,668.5 274,883.7
— Up to Rs. 1.5 million . . . . . . . . . . . . . . . . . . . . . . . . . . . . . . . . . . 263,796.5 166,413.1(ii) Commercial real estate1 . . . . . . . . . . . . . . . . . . . . . . . . . . . . . . . . . 69,846.0 45,618.4(iii) Investments in mortgage-backed securities (MBS) and other
securitised exposures . . . . . . . . . . . . . . . . . . . . . . . . . . . . . . . . . . . . 0.3 2,428.5— a. Residential . . . . . . . . . . . . . . . . . . . . . . . . . . . . . . . . . . . . . . . . 0.3 2,428.5— b. Commercial real estate . . . . . . . . . . . . . . . . . . . . . . . . . . . . . . — —
II Indirect exposure . . . . . . . . . . . . . . . . . . . . . . . . . . . . . . . . . . . . . . . 30,135.8 52,619.9Fund based and non-fund based exposures on National Housing
Bank (NHB) and Housing Finance Companies (HFCs) . . . . . . . 30,135.8 52,619.9
Total . . . . . . . . . . . . . . . . . . . . . . . . . . . . . . . . . . . . . . . . . . . . . . . . . . . . . 531,650.6 375,550.5
1. Commercial real estate exposure includes loans given to land and building developers for construction,corporates for their real estate requirements and to individuals for non-residential premises.
17. Credit exposure
a) As on March 31, 2006, the Bank had no single borrower exposure above 15% and no group borrowerexposure above 40% of capital funds.
b) As on March 31, 2005 the Bank had taken single borrower exposure above 15% with the approval of theBoard of Directors in the cases given below.
Name of Borrower As on March 31, 2005
% to capital funds
Bharat Heavy Electricals Limited . . . . . . . . . . . . . . . . . . . . . . . . . . . . . . . . . . . . . . . . . . . . . . . 19.50%Essar Oil Limited . . . . . . . . . . . . . . . . . . . . . . . . . . . . . . . . . . . . . . . . . . . . . . . . . . . . . . . . . . . . 17.46%Asset Reconstruction Co. of India Limited (“ARCIL”)1 . . . . . . . . . . . . . . . . . . . . . . . . . . . . . 16.73%Larsen & Toubro Limited . . . . . . . . . . . . . . . . . . . . . . . . . . . . . . . . . . . . . . . . . . . . . . . . . . . . . 16.20%
1. Includes exposure to security receipts issued by ARCIL.
18. Risk category-wise country-wise exposure
As per the extant RBI guidelines, the country exposure of the Bank is categorised into various riskcategories listed in the following table. The country exposure (net) of the Bank in respect of United Kingdom is1.11% of the total funded assets. As the net funded exposure to United Kingdom exceeds 1%, the Bank has madea provision of Rs. 63.6 million on country exposure during the year ended March 31, 2006.
Risk categoryExposure (net)
as on March 31, 2006Exposure (net)
as on March 31, 2005
Rupees in millionInsignificant . . . . . . . . . . . . . . . . . . . . . . . . . . . . . . . . . . . . . . . . . . . . . . . 118,755.5 54,349.8Low . . . . . . . . . . . . . . . . . . . . . . . . . . . . . . . . . . . . . . . . . . . . . . . . . . . . . . 44,689.4 11,408.4Moderate . . . . . . . . . . . . . . . . . . . . . . . . . . . . . . . . . . . . . . . . . . . . . . . . . . 24,372.9 4,592.1High . . . . . . . . . . . . . . . . . . . . . . . . . . . . . . . . . . . . . . . . . . . . . . . . . . . . . 3,357.7 —Very High . . . . . . . . . . . . . . . . . . . . . . . . . . . . . . . . . . . . . . . . . . . . . . . . . — —Restricted . . . . . . . . . . . . . . . . . . . . . . . . . . . . . . . . . . . . . . . . . . . . . . . . . 447.1 —Off-Credit . . . . . . . . . . . . . . . . . . . . . . . . . . . . . . . . . . . . . . . . . . . . . . . . . 223.1 656.2
Total . . . . . . . . . . . . . . . . . . . . . . . . . . . . . . . . . . . . . . . . . . . . . . . . . . . . . 191,845.7 71,006.5
—of which funded . . . . . . . . . . . . . . . . . . . . . . . . . . . . . . . . . . . . . . 138,915.0 38,885.7
F-86

19. Advances
The details of movement of gross NPAs, net NPAs and provisions are given in the table below.
ParticularsYear ended
March 31, 2006Year ended
March 31, 2005
Rupees in million
(i) Net NPAs (funded) to Net Advances (%) . . . . . . . . . . . . . . . . . . . . . . . . . . . . . 0.72% 1.65%(ii) Movement of NPAs (Gross)
(a) Opening balance . . . . . . . . . . . . . . . . . . . . . . . . . . . . . . . . . . . . . . . . . . . . 27,704.3 30,475.9(b) Additions during the year1 . . . . . . . . . . . . . . . . . . . . . . . . . . . . . . . . . . . . 10,202.3 11,157.9(c) Reductions during the year1 . . . . . . . . . . . . . . . . . . . . . . . . . . . . . . . . . . . (15,680.7) (13,929.5)(d) Closing balance2 . . . . . . . . . . . . . . . . . . . . . . . . . . . . . . . . . . . . . . . . . . . . 22,225.9 27,704.3
(iii) Movement of Net NPAs(a) Opening balance . . . . . . . . . . . . . . . . . . . . . . . . . . . . . . . . . . . . . . . . . . . . 15,052.7 13,724.0(b) Additions during the year1 . . . . . . . . . . . . . . . . . . . . . . . . . . . . . . . . . . . . 7,035.0 11,216.3(c) Reductions during the year1 . . . . . . . . . . . . . . . . . . . . . . . . . . . . . . . . . . . (11,560.9) (9,887.6)(d) Closing balance . . . . . . . . . . . . . . . . . . . . . . . . . . . . . . . . . . . . . . . . . . . . . 10,526.8 15,052.7
(iv) Movement of provisions for NPAs (excluding provisions on standard assets)(a) Opening balance3 . . . . . . . . . . . . . . . . . . . . . . . . . . . . . . . . . . . . . . . . . . . 12,368.5 16,250.14
(b) Provisions made during the year (including utilisation of fair valueprovisions) . . . . . . . . . . . . . . . . . . . . . . . . . . . . . . . . . . . . . . . . . . . . . . . . 5,601.2 18,002.1
(c) Write-off/write-back of excess provisions . . . . . . . . . . . . . . . . . . . . . . . . (6,542.2) (21,883.7)(d) Closing balance3 . . . . . . . . . . . . . . . . . . . . . . . . . . . . . . . . . . . . . . . . . . . . 11,427.5 12,368.5
1. Excludes cases added to and deleted from NPAs in the same year with such gross loans amounting to Rs.1,714.7 million (March 31, 2005: Rs. 13,759.9 million) and such net loans amounting to Rs. 1,463.2 million(March 31, 2005: Rs. 9,540.7 million).
2. Includes suspended interest and claims received from ECGC/DICGC of Rs. 271.6 million (March 31, 2005:Rs. 283.7 million) on working capital loan.
3. Excludes technical write-off amounting to Rs. 6,586.7 million (March 31, 2005: Rs. 15,763.6 million) andsuspended interest and claims received from ECGC/DICGC of Rs. 271.6 million (March 31, 2005: Rs.283.7 million).
4. Includes utilisation of fair value provisions.
20. Financial assets transferred during the year to Securitisation Company (SC) / ReconstructionCompany (RC)
The Bank has transferred certain assets to an asset reconstruction company (ARC) in terms of the guidelinesissued by RBI governing such transfer. For the purpose of the valuation of the underlying security receipts issuedby the ARCIL, the security receipts were valued at their respective NAVs as advised by the ARCIL. The detailsof the assets transferred for the years ended March 31, 2006 and March 31, 2005 are given in the table below.
Year endedMarch 31,
2006
Year endedMarch 31,
2005
Rupees in million
No. of accounts . . . . . . . . . . . . . . . . . . . . . . . . . . . . . . . . . . . . . . . . . . . . . . . . . . . . . . . . . . 15 82Aggregate value (net of provisions) of accounts sold to SC/RC . . . . . . . . . . . . . . . . . . . . . 4,794.0 13,279.3Aggregate consideration . . . . . . . . . . . . . . . . . . . . . . . . . . . . . . . . . . . . . . . . . . . . . . . . . . . 4,066.3 10,862.3Additional consideration realised in respect of accounts transferred in earlier years1 . . . . — —Aggregate gain/(loss) over net book value . . . . . . . . . . . . . . . . . . . . . . . . . . . . . . . . . . . . . (727.7) (2,417.0)
1. During the year ended March 31, 2006, ARCIL fully redeemed security receipts of four trusts and partlyredeemed security receipts of two trusts. The Bank realised Rs. 95.7 million over the gross book value inrespect of these trusts.
F-87

21. Provisions on standard asset
The provision on standard assets held by the Bank in accordance with RBI guidelines wasRs. 5,638.3 million at March 31, 2006 (March 31, 2005: Rs. 2,248.1 million).
22. Information in respect of restructured assets
a) Details of loan assets subjected to restructuring is given below.
Year endedMarch 31,
2006
Year endedMarch 31,
2005
Rupees in million
(i) Total amount of loan assets subjected to restructuring, rescheduling,renegotiation; . . . . . . . . . . . . . . . . . . . . . . . . . . . . . . . . . . . . . . . . . . . . . . . . . . . . . . . . 4,139.4 20,196.5of which under CDR . . . . . . . . . . . . . . . . . . . . . . . . . . . . . . . . . . . . . . . . . . . . . . . . . .[ (i) = (ii)+(iii)+(iv) ] . . . . . . . . . . . . . . . . . . . . . . . . . . . . . . . . . . . . . . . . . . . . . . . . . . 4,077.0 18,060.1
(ii) The amount of standard assets subjected to restructuring, reschedulingrenegotiation; . . . . . . . . . . . . . . . . . . . . . . . . . . . . . . . . . . . . . . . . . . . . . . . . . . . . . . . . 4,055.5 19,455.3of which under CDR . . . . . . . . . . . . . . . . . . . . . . . . . . . . . . . . . . . . . . . . . . . . . . . . . . 4,055.5 17,501.4
(iii) The amount of sub-standard assets subjected to restructuring, rescheduling,renegotiation; . . . . . . . . . . . . . . . . . . . . . . . . . . . . . . . . . . . . . . . . . . . . . . . . . . . . . . . . 62.4 558.7of which under CDR . . . . . . . . . . . . . . . . . . . . . . . . . . . . . . . . . . . . . . . . . . . . . . . . . . — 558.7
(iv) The amount of doubtful assets subjected to restructuring, rescheduling,renegotiation; . . . . . . . . . . . . . . . . . . . . . . . . . . . . . . . . . . . . . . . . . . . . . . . . . . . . . . . . 21.5 182.5of which under CDR . . . . . . . . . . . . . . . . . . . . . . . . . . . . . . . . . . . . . . . . . . . . . . . . . . 21.5 —
Note: Above details exclude cases that were approved by CDR Forum and disclosed in the earlier years by theBank and in which certain terms and conditions have been modified by CDR Forum during the currentyear. The above table includes cases that were restructured and disclosed in earlier years by the Bank andsubsequently referred to and admitted under the CDR scheme during the current year.
b) The gross amounts (net of write-offs) of restructuring under the CDR schemes during the year are givenbelow.
Year ended March 31, 2006 Year ended March 31, 2005
Loan Category No. Amount Interest Sacrifice No. Amount Interest Sacrifice
Rupees in million
Standard . . . . . . . . . . . . . . . . . . . . . . . . . . . . . 2 4,055.5 50.7 17 17,501.4 788.0Sub-standard . . . . . . . . . . . . . . . . . . . . . . . . . . — — — 3 558.7 —Doubtful . . . . . . . . . . . . . . . . . . . . . . . . . . . . . 1 21.5 — — — —
Total . . . . . . . . . . . . . . . . . . . . . . . . . . . . . . . . 3 4,077.0 50.7 20 18,060.1 788.0
Note: Above details exclude cases that were approved by CDR Forum and disclosed in the earlier years by theBank and in which certain terms and conditions have been modified by CDR Forum during the currentyear. The above table includes cases that were restructured and disclosed in earlier years by the Bank andsubsequently referred to and admitted under the CDR scheme during the current year.
During the year ended March 31, 2006, there has been no debt restructuring for small and mediumenterprises.
F-88

c) The Bank has restructured borrower accounts in standard, sub-standard and doubtful categories. Thegross amounts (net of write-off) of asset restructured during the year are given below.
Year ended March 31, 2006 Year ended March 31, 2005
Loan Category No. Amount Interest Sacrifice No. Amount Interest Sacrifice
Rupees in million
Standard . . . . . . . . . . . . . . . . . . . . . . . . . . . . . . — — — 16 15,745.2 685.8Sub-standard . . . . . . . . . . . . . . . . . . . . . . . . . . . 1 62.4 — 3 558.7 —Doubtful . . . . . . . . . . . . . . . . . . . . . . . . . . . . . . 1 21.5 — 5 182.5 —
Total . . . . . . . . . . . . . . . . . . . . . . . . . . . . . . . . . 2 83.9 — 24 16,484.4 685.8
Note: The above details include accounts restructured under the Corporate Debt Restructuring “CDR” schemeduring the year, other than cases that were restructured and disclosed in earlier years by the Bank andsubsequently referred to and admitted under the CDR scheme during the current year.
23. Details of non-performing assets sold, excluding those sold to SC/RC
The Bank has sold certain cases of non-performing assets in terms of the guidelines issued by RBI circularno. DBOD.NO.BP.BC.16/21.04.048/2005-06 dated July 13, 2005 on such sale. The details of assets sold aregiven below.
ParticularsYear Ended
March 31, 2006
Rupees in million
1. No. of borrower accounts sold . . . . . . . . . . . . . . . . . . . . . . . . . . . . . . . . . . . . . . . . . . . . . . . . . 3662. Aggregate outstanding (gross) . . . . . . . . . . . . . . . . . . . . . . . . . . . . . . . . . . . . . . . . . . . . . . . . . 14,384.13. Aggregate consideration received . . . . . . . . . . . . . . . . . . . . . . . . . . . . . . . . . . . . . . . . . . . . . . 2,223.2
24. Fixed Assets
Fixed assets include softwares acquired by the Bank. The movement in software assets is given below.
Year endedMarch 31, 2006
Year endedMarch 31, 2005
Rupees in million
At cost as on March 31st of preceding year . . . . . . . . . . . . . . . . . . . . . . . . . . . . . . . 2,422.6 2,057.7Additions during the year . . . . . . . . . . . . . . . . . . . . . . . . . . . . . . . . . . . . . . . . . . . . . 430.1 364.9Deductions during the year . . . . . . . . . . . . . . . . . . . . . . . . . . . . . . . . . . . . . . . . . . . — —Depreciation to date . . . . . . . . . . . . . . . . . . . . . . . . . . . . . . . . . . . . . . . . . . . . . . . . . (2,026.3) (1,396.5)
Net block . . . . . . . . . . . . . . . . . . . . . . . . . . . . . . . . . . . . . . . . . . . . . . . . . . . . . . . . . 826.4 1,026.1
25. Assets under lease
25.1 Assets under operating lease
The details of future rentals payable on operating leases are given below.
PeriodAs on
March 31, 2006As on
March 31, 2005
Rupees in million
Not later than one year . . . . . . . . . . . . . . . . . . . . . . . . . . . . . . . . . . . . . . . . . . . . . . . 126.7 234.4Later than one year and not later than five years . . . . . . . . . . . . . . . . . . . . . . . . . . . 605.9 999.5Later than five years . . . . . . . . . . . . . . . . . . . . . . . . . . . . . . . . . . . . . . . . . . . . . . . . . 2.0 311.2
Total . . . . . . . . . . . . . . . . . . . . . . . . . . . . . . . . . . . . . . . . . . . . . . . . . . . . . . . . . . . . . 734.6 1,545.1
F-89

25.2 Assets under finance lease
The details of finance leases are given below.
PeriodAs on
March 31, 2006As on
March 31, 2005
Rupees in million
Total of future minimum lease payments . . . . . . . . . . . . . . . . . . . . . . . . . . . . . . . . 817.1 1,105.5Present value of lease payments . . . . . . . . . . . . . . . . . . . . . . . . . . . . . . . . . . . . . . . 695.1 913.6Unmatured finance charges . . . . . . . . . . . . . . . . . . . . . . . . . . . . . . . . . . . . . . . . . . . 122.0 191.9
Maturity profile of total of future minimum lease payments—Not later than one year . . . . . . . . . . . . . . . . . . . . . . . . . . . . . . . . . . . . . . . . . 232.4 293.3—Later than one year and not later than five years . . . . . . . . . . . . . . . . . . . . . 584.7 804.5—Later than five years . . . . . . . . . . . . . . . . . . . . . . . . . . . . . . . . . . . . . . . . . . . — 7.7
Total . . . . . . . . . . . . . . . . . . . . . . . . . . . . . . . . . . . . . . . . . . . . . . . . . . . . . . . . . . . . . 817.1 1,105.5
25.3 The maturity profile of present value of lease payments is given below.
The details of maturity profile of present value of finance lease payments are given below.
PeriodAs on
March 31, 2006As on
March 31, 2005
Rupees in million
Not later than one year . . . . . . . . . . . . . . . . . . . . . . . . . . . . . . . . . . . . . . . . . . . . . . . 176.7 222.8Later than one year and not later than five years . . . . . . . . . . . . . . . . . . . . . . . . . . . 518.4 683.3Later than five years . . . . . . . . . . . . . . . . . . . . . . . . . . . . . . . . . . . . . . . . . . . . . . . . . — 7.5
Total . . . . . . . . . . . . . . . . . . . . . . . . . . . . . . . . . . . . . . . . . . . . . . . . . . . . . . . . . . . . . 695.1 913.6
26. Early Retirement Option (“ERO”)
The Bank had implemented an Early Retirement Option Scheme 2003 for its employees in July 2003. Allemployees who had completed 40 years of age and seven years of service with the Bank (including period ofservice with entities amalgamated with the Bank) were eligible for the ERO.
The ex-gratia payments under ERO and termination benefits and leave encashment in excess of theprovision made (net of tax benefits), aggregating to Rs. 1,910.0 million is being amortised over a period of fiveyears commencing August 1, 2003 (the date of retirement of employees exercising the Option being July 31,2003).
On account of the above ERO scheme, an amount of Rs. 384.0 million (March 31, 2005: Rs. 384.0 million)has been charged to revenue being the proportionate amount amortised for the year ended March 31, 2006.
27. Provisions for income tax
The provision for income tax (including deferred tax and fringe benefit tax) for the year ended March 31,2006 and March 31, 2005 amounted to Rs. 5,535.3 million and Rs. 5,190.0 million respectively.
F-90
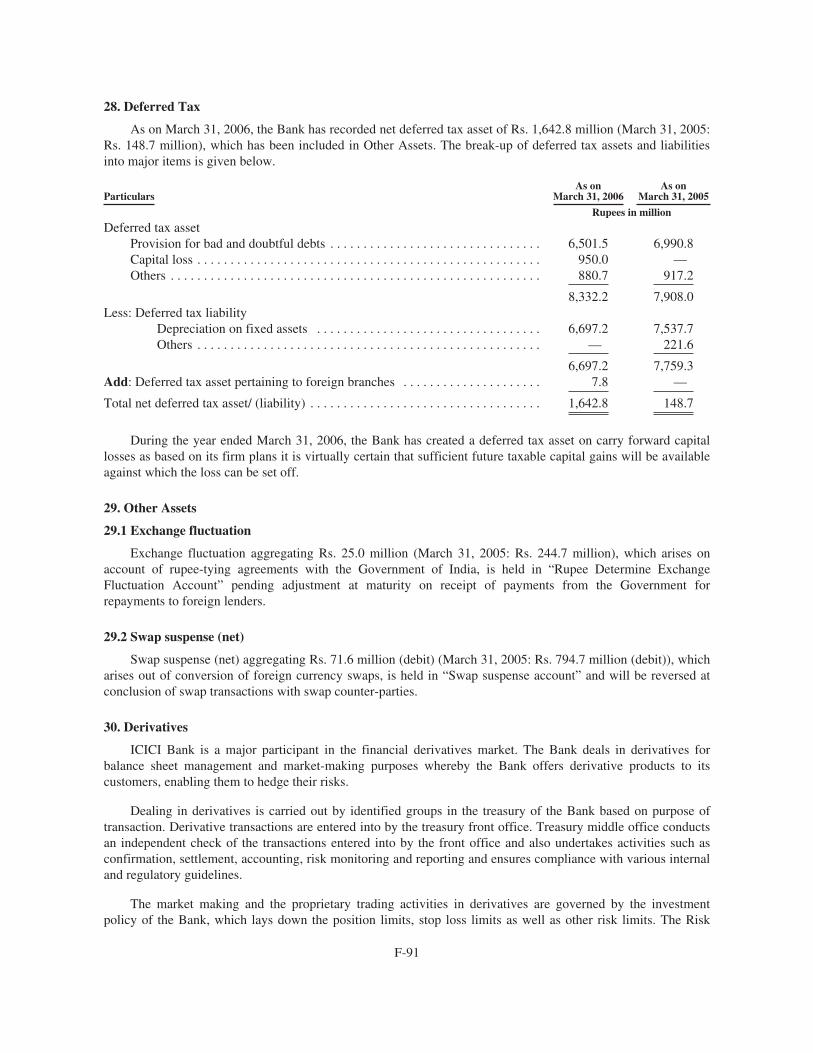
28. Deferred Tax
As on March 31, 2006, the Bank has recorded net deferred tax asset of Rs. 1,642.8 million (March 31, 2005:Rs. 148.7 million), which has been included in Other Assets. The break-up of deferred tax assets and liabilitiesinto major items is given below.
ParticularsAs on
March 31, 2006As on
March 31, 2005
Rupees in million
Deferred tax assetProvision for bad and doubtful debts . . . . . . . . . . . . . . . . . . . . . . . . . . . . . . . . 6,501.5 6,990.8Capital loss . . . . . . . . . . . . . . . . . . . . . . . . . . . . . . . . . . . . . . . . . . . . . . . . . . . . 950.0 —Others . . . . . . . . . . . . . . . . . . . . . . . . . . . . . . . . . . . . . . . . . . . . . . . . . . . . . . . . 880.7 917.2
8,332.2 7,908.0Less: Deferred tax liability
Depreciation on fixed assets . . . . . . . . . . . . . . . . . . . . . . . . . . . . . . . . . . 6,697.2 7,537.7Others . . . . . . . . . . . . . . . . . . . . . . . . . . . . . . . . . . . . . . . . . . . . . . . . . . . . — 221.6
6,697.2 7,759.3Add: Deferred tax asset pertaining to foreign branches . . . . . . . . . . . . . . . . . . . . . 7.8 —
Total net deferred tax asset/ (liability) . . . . . . . . . . . . . . . . . . . . . . . . . . . . . . . . . . . 1,642.8 148.7
During the year ended March 31, 2006, the Bank has created a deferred tax asset on carry forward capitallosses as based on its firm plans it is virtually certain that sufficient future taxable capital gains will be availableagainst which the loss can be set off.
29. Other Assets
29.1 Exchange fluctuation
Exchange fluctuation aggregating Rs. 25.0 million (March 31, 2005: Rs. 244.7 million), which arises onaccount of rupee-tying agreements with the Government of India, is held in “Rupee Determine ExchangeFluctuation Account” pending adjustment at maturity on receipt of payments from the Government forrepayments to foreign lenders.
29.2 Swap suspense (net)
Swap suspense (net) aggregating Rs. 71.6 million (debit) (March 31, 2005: Rs. 794.7 million (debit)), whicharises out of conversion of foreign currency swaps, is held in “Swap suspense account” and will be reversed atconclusion of swap transactions with swap counter-parties.
30. Derivatives
ICICI Bank is a major participant in the financial derivatives market. The Bank deals in derivatives forbalance sheet management and market-making purposes whereby the Bank offers derivative products to itscustomers, enabling them to hedge their risks.
Dealing in derivatives is carried out by identified groups in the treasury of the Bank based on purpose oftransaction. Derivative transactions are entered into by the treasury front office. Treasury middle office conductsan independent check of the transactions entered into by the front office and also undertakes activities such asconfirmation, settlement, accounting, risk monitoring and reporting and ensures compliance with various internaland regulatory guidelines.
The market making and the proprietary trading activities in derivatives are governed by the investmentpolicy of the Bank, which lays down the position limits, stop loss limits as well as other risk limits. The Risk
F-91

Management Group (“RMG”) lays down the methodology for computation and monitoring of risk. The RiskCommittee of the Board (“RCB”) reviews the Bank’s risk management policy in relation to various risks(portfolio, liquidity, interest rate, off-balance sheet and operational risks), investment policies and complianceissues in relation thereto. The RCB comprises of independent directors and the Managing Director and CEO.
Risk monitoring of the derivatives portfolio is done on a daily basis. The Bank measures and monitors riskusing Value at Risk (“VAR”) approach and the relevant greeks for options. Risk reporting on derivatives formsan integral part of the management information system and the marked to market position and the VAR of thederivatives portfolio is reported on a daily basis.
The use of derivatives for hedging purpose is governed by the hedge policy approved by Asset LiabilityManagement Committee (“ALCO”). Subject to prevailing RBI guidelines, the Bank deals in derivatives forhedging fixed rate, floating rate or foreign currency assets/liabilities. Transactions for hedging and market-making purposes are recorded separately. For hedge transactions, the Bank identifies the hedged item (asset orliability) at the inception of the transaction itself. The effectiveness is assessed at the time of inception of thehedge and periodically thereafter. During the year the Bank changed its method for testing hedge effectivenessfrom the price value of basis point (“PVBP”) or duration method to the marked to market method. Due to thischange certain derivative contracts which were hitherto accounted for as hedges, became ineffective and wereaccordingly accounted for as trading.
Hedge derivative transactions are accounted for pursuant to the principles of hedge accounting. Derivativesfor market making purpose are marked to market and the resulting gain/ loss is recorded in the profit and lossaccount. Premia on options are accounted for at the expiry of the options. The Bank makes provisions on theoutstanding positions in trading derivatives for possible adverse movements in underlying. Derivativetransactions are covered under International Swap Dealers Association (“ISDA”) master agreements with therespective counterparties. The credit exposure on account of derivative transactions is computed as perRBI guidelines and is marked against the credit limits approved for the respective counterparties.
As on March 31, 2006
Sr. No. ParticularCurrency
derivatives1Interest ratederivatives2
(Rupees in million)
1 Derivatives (Notional principal amount)a) For hedging . . . . . . . . . . . . . . . . . . . . . . . . . . . . . . . . . . . . . . . . . . . . . — 41,252.2b) For trading . . . . . . . . . . . . . . . . . . . . . . . . . . . . . . . . . . . . . . . . . . . . . 428,580.4 2,174,510.4
2 Marked to market positions3
a) Asset (+) . . . . . . . . . . . . . . . . . . . . . . . . . . . . . . . . . . . . . . . . . . . . . . . 2,150.3 1,963.2b) Liability (-) . . . . . . . . . . . . . . . . . . . . . . . . . . . . . . . . . . . . . . . . . . . . . — —
3 Credit exposure . . . . . . . . . . . . . . . . . . . . . . . . . . . . . . . . . . . . . . . . . . . . . . . . . . 21,458.8 28,170.84 Likely impact of one percentage change in interest rate (100*PV01)
a) on hedging derivatives4 . . . . . . . . . . . . . . . . . . . . . . . . . . . . . . . . . . . — (1,230.8)b) on trading derivatives . . . . . . . . . . . . . . . . . . . . . . . . . . . . . . . . . . . . . 1,087.0 900.9
5 Maximum and minimum of 100*PV01 observed during the yeara) on hedging4
Maximum . . . . . . . . . . . . . . . . . . . . . . . . . . . . . . . . . . . . . . . . . . . . . . — 838.4Minimum . . . . . . . . . . . . . . . . . . . . . . . . . . . . . . . . . . . . . . . . . . . . . . (74.4) (1,230.8)
b) on tradingMaximum . . . . . . . . . . . . . . . . . . . . . . . . . . . . . . . . . . . . . . . . . . . . . . 1,119.8 1,097.5Minimum . . . . . . . . . . . . . . . . . . . . . . . . . . . . . . . . . . . . . . . . . . . . . . 632.8 (1,439.1)
1. Options & Cross Currency Interest Rate Swaps are included in currency derivatives.2. Foreign currency Interest Rate Swaps, Forward Rate Agreements and swaptions are included in interest rate
derivatives.
F-92

3. For trading portfolio.4. The swap contracts entered for hedging purpose would have an opposite and offsetting impact with the
underlying on-balance sheet items.
As onMarch 31, 2005
Sr. No. ParticularCurrency
derivatives1Interest ratederivatives2
(Rupees in million)
1 Derivatives (Notional principal amount)a) For hedging . . . . . . . . . . . . . . . . . . . . . . . . . . . . . . . . . . . . . . . . . . . . . 8,083.1 106,428.6b) For trading . . . . . . . . . . . . . . . . . . . . . . . . . . . . . . . . . . . . . . . . . . . . . 274,325.6 1,335,689.1
2 Marked to market positions3
a) Asset (+) . . . . . . . . . . . . . . . . . . . . . . . . . . . . . . . . . . . . . . . . . . . . . . . 442.0 564.7b) Liability (-) . . . . . . . . . . . . . . . . . . . . . . . . . . . . . . . . . . . . . . . . . . . . . — —
3 Credit exposure . . . . . . . . . . . . . . . . . . . . . . . . . . . . . . . . . . . . . . . . . . . . . . . . . . 9,373.9 18,124.44 Likely impact of one percentage change in interest rate (100*PV01)
a) on hedging derivatives4 . . . . . . . . . . . . . . . . . . . . . . . . . . . . . . . . . . . (79.4) (22.1)b) on trading derivatives . . . . . . . . . . . . . . . . . . . . . . . . . . . . . . . . . . . . . 880.7 (534.5)
5 Maximum and minimum of 100*PV01 observed during the yeara) on hedging4
Maximum . . . . . . . . . . . . . . . . . . . . . . . . . . . . . . . . . . . . . . . . . . . . . . (38.2) 2.8Minimum . . . . . . . . . . . . . . . . . . . . . . . . . . . . . . . . . . . . . . . . . . . . . . (101.5) (1,675.1)
b) on tradingMaximum . . . . . . . . . . . . . . . . . . . . . . . . . . . . . . . . . . . . . . . . . . . . . . 1,280.6 180.8Minimum . . . . . . . . . . . . . . . . . . . . . . . . . . . . . . . . . . . . . . . . . . . . . . 156.6 (1,081.3)
1. Options & cross currency interest rate swaps are included in currency derivatives.2. Foreign currency interest rate swaps and forward rate agreements are included in interest rate derivatives.3. For trading portfolio.4. The swap contracts entered for hedging purpose have an opposite and offsetting impact with the underlying
on-balance sheet items.
The notional principal amount of credit derivatives outstanding at March 31, 2006 was Rs. 23,514.4 million(March 31, 2005: Rs. 3,937.1 million).
The notional principal amount of forex contracts classified as hedging amounted to Rs. 165,041.4 million(March 31, 2005: Rs. 60,340.1 million). The notional principal amount of forex contracts classified as tradingamounted to Rs. 753,273.6 million (March 31, 2005: Rs. 609,304.1 million).
The net overnight open position at March 31, 2006 is Rs. 457.8 million (March 31, 2005: Rs. 190.7 million).
31. Forward rate agreement (“FRA”)/ Interest rate swaps (“IRS”)
The notional principal amount of Rupee IRS contracts at March 31, 2006 is Rs. Nil for hedging contracts(March 31, 2005: Rs. 51,100.0 million) and Rs. 1,870,025.6 million for trading contracts (March 31, 2005:Rs. 1,114,302.0 million).
The fair value represents the estimated replacement cost of swap contracts at balance sheet date. AtMarch 31, 2006 the fair value of trading rupee interest rate swap contracts is Rs. 922.4 million (March 31, 2005:Rs. 333.6 million).
Associated credit risk is the loss that the Bank would incur in case all the counter-parties to these swaps failto fulfil their contractual obligations. At March 31, 2006, the associated credit risk on trading rupee interest rateswap contracts is Rs. 16,754.4 million (March 31, 2005: Rs. 9,865.3 million).
F-93

Market risk is monitored as the loss that would be incurred by the Bank for a 100 basis points change in theinterest rates. At March 31, 2006 the market risk on trading rupee interest rate swap contracts amounts toRs. 1,192.3 million (March 31, 2005: Rs. 137.8 million).
Credit risk concentration is measured as the highest net receivable under swap contracts from a particularcounter-party. At March 31, 2006 there is a credit risk concentration of Rs. 476.4 million (March 31, 2005:Rs. 274.6 million) under rupee interest rate swap contracts, with ICICI Securities. As per the prevailing marketpractice, the Bank does not insist on collateral from the counter-parties in these contracts.
The details of the forward rate agreements/interest rate swaps are given below.
ParticularsAs on
March 31, 2006As on
March 31, 2005
Rupees in million
(i) The notional principal of rupee swap agreements1 . . . . . . . . . . . . . . . . . . . . . 1,870,025.6 1,165,402.0(ii) Losses which would be incurred if all counter-parties failed to fulfil their
obligations under the agreements . . . . . . . . . . . . . . . . . . . . . . . . . . . . . . . . . . . 16,754.4 9,865.3(iii) Collateral required by the Bank upon entering into swaps . . . . . . . . . . . . . . . — —(iv) Concentration of credit risk arising from the rupee swaps . . . . . . . . . . . . . . . 476.4 274.6(v) The fair value of rupee trading swap book2 . . . . . . . . . . . . . . . . . . . . . . . . . . 922.4 333.6
1. Notional principal of swap agreements includes both hedge and trading portfolio.2. Fair value represents clean mark-to-market.
32. Exchange Traded Interest Rate Derivatives
The detail of exchange traded interest rate derivatives is given below.
Sr. No. ParticularAs on
March 31, 2006
(Rupees in million)
(i) Notional principal amount of exchange traded interest rate derivatives undertakenduring the year (instrument-wise)
a) Eurodollar futures . . . . . . . . . . . . . . . . . . . . . . . . . . . . . . . . . . . . . . . . . . . . . . . . . . 133,577.3b) Treasury note futures—10 year . . . . . . . . . . . . . . . . . . . . . . . . . . . . . . . . . . . . . . . . 13,496.0c) Treasury note futures—5 year . . . . . . . . . . . . . . . . . . . . . . . . . . . . . . . . . . . . . . . . . 3,319.4
(ii) Notional principal amount of exchange traded interest rate derivatives outstanding ason March 31, 2006 (instrument-wise)
a) Eurodollar futures . . . . . . . . . . . . . . . . . . . . . . . . . . . . . . . . . . . . . . . . . . . . . . . . . . —b) Treasury note futures—10 year . . . . . . . . . . . . . . . . . . . . . . . . . . . . . . . . . . . . . . . . 1,516.9c) Treasury note futures—5 year . . . . . . . . . . . . . . . . . . . . . . . . . . . . . . . . . . . . . . . . . —
(iii) Notional principal amount of exchange traded interest rate derivatives outstanding andnot “highly effective” (instrument-wise) . . . . . . . . . . . . . . . . . . . . . . . . . . . . . . . . . . . NA
(iv) Mark-to-market value of exchange traded interest rate derivatives outstanding and not“highly effective” (instrument-wise) . . . . . . . . . . . . . . . . . . . . . . . . . . . . . . . . . . . . . . NA
Note: All the transactions in exchange traded derivatives have been entered into by foreign branches for tradingportfolio.
F-94

Sr. No. ParticularAs on
March 31, 2005
(Rupees in million)
(i) Notional principal amount of exchange traded interest rate derivatives undertakenduring the year (instrument-wise)
a) Eurodollar futures . . . . . . . . . . . . . . . . . . . . . . . . . . . . . . . . . . . . . . . . . . . . . . . . . . 73,404.1b) Treasury note futures—10 year . . . . . . . . . . . . . . . . . . . . . . . . . . . . . . . . . . . . . . . . 153.1c) Treasury note futures—5 year . . . . . . . . . . . . . . . . . . . . . . . . . . . . . . . . . . . . . . . . . 1,224.9
(ii) Notional principal amount of exchange traded interest rate derivatives outstanding ason March 31, 2005 (instrument-wise)
a) Eurodollar futures . . . . . . . . . . . . . . . . . . . . . . . . . . . . . . . . . . . . . . . . . . . . . . . . . . —b) Treasury note futures—10 year . . . . . . . . . . . . . . . . . . . . . . . . . . . . . . . . . . . . . . . . 65.6c) Treasury note futures—5 year . . . . . . . . . . . . . . . . . . . . . . . . . . . . . . . . . . . . . . . . . —
(iii) Notional principal amount of exchange traded interest rate derivatives outstanding andnot “highly effective” (instrument-wise) . . . . . . . . . . . . . . . . . . . . . . . . . . . . . . . . . . . NA
(iv) Mark-to-market value of exchange traded interest rate derivatives outstanding and not“highly effective” (instrument-wise) . . . . . . . . . . . . . . . . . . . . . . . . . . . . . . . . . . . . . . NA
Note: All the transactions in exchange traded derivatives have been entered into by foreign branches for tradingportfolio.
33. Subvention income
The Bank has aligned its accounting policy for subvention income with its accounting policy for directmarketing agency/associate expenses. Accordingly, subvention income has been accounted for in the period inwhich it is received instead of over the period of the loan. As a result of the change in policy, the impact on profitafter tax for the year ended March 31, 2006 is not expected to be significant.
34. Provision
RBI has increased the requirement of general provisioning on standard loans (excluding loans to agriculturesector and small and medium enterprises) to 0.40% compared to 0.25% earlier. In accordance with the revisedguidelines on general provisioning on standard loans, the Bank has made general provision of Rs. 3,390.2 millionduring the year ended March 31, 2006. The Bank has reassessed its provision requirement on performing loansand non-performing loans on a portfolio basis during the year ended March 31, 2006. Based on this reassessment,the Bank has written back an amount of Rs. 1,692.2 million from its existing provisions against non-performingloans, which were in excess of regulatory requirements.
35. Penalties imposed by RBI
The RBI had imposed penalties (ranging from Rs. 0.5 million to Rs. 2.0 million) on certain banks includingICICI Bank on January 23, 2006 under Section 47A(1)(b) of the Banking Regulation Act, 1949. A penalty ofRs. 0.5 million (March 31, 2005: Rs. Nil) had been imposed on the Bank citing contravention of RBI instructionsrelating to opening of accounts, monitoring of transactions for adherence to Know Your Customer (“KYC”)/AntiMoney Laundering (“AML”) norms, and non-adherence to normal banking practices.
36. Comparative figures
Figures of the previous period/year have been regrouped to conform to the current year presentation.
F-95

Signatures to Schedules 1 to 18
For and on behalf of Board of Directors
N. VaghulChairman
K. V. KamathManaging Director & CEO
Lalita D. GupteJoint Managing Director
Kalpana MorpariaJoint Managing Director
Chanda D. KochharDeputy Managing Director
Nachiket MorDeputy Managing Director
Vishakha MulyeChief Financial Officer & Treasurer
Jyotin MehtaGeneral Manager &Company Secretary
Rakesh JhaGeneral Manager
Place: MumbaiDate: April 29, 2006
F-96

Auditors’ Report to the Members of ICICI Bank Limited for the Fiscal Year ended 31st March, 2005
1. We have audited the attached balance sheet of ICICI Bank Limited (the “Bank”) as at March 31, 2005 andalso the profit and loss account and cash flow statement for the year ended on that date annexed thereto.These financial statements are the responsibility of the Bank’s management. Our responsibility is to expressan opinion on these financial statements based on our audit. Incorporated in the said financial statements isthe return of the one foreign branch audited by another firm of independent accountants.
2. We conducted our audit in accordance with auditing standards generally accepted in India. Those Standardsrequire that we plan and perform the audit to obtain reasonable assurance about whether the financialstatements are free of material misstatement. An audit includes examining, on a test basis, evidencesupporting the amounts and disclosures in the financial statements. An audit also includes assessing theaccounting principles used and significant estimates made by management, as well as evaluating the overallfinancial statement presentation. We believe that our audit provides a reasonable basis for our opinion.
3. The balance sheet and profit and loss account are drawn up in conformity with Forms A and B (revised) of theThird Schedule to the Banking Regulation Act, 1949, read with Section 211 of the Companies Act, 1956.
4. We report that:
a) We have obtained all the information and explanations, which to the best of our knowledge and beliefwere necessary for the purposes of our audit and have found them to be satisfactory;
b) In our opinion, the transactions of the Bank which have come to our notice have been within itspowers;
c) In our opinion, proper books of account as required by law have been kept by the Bank so far asappears from our examination of those books and proper returns adequate for the purposes of our audithave been received from the branches not visited by us. The audited returns of the foreign branch hasbeen forwarded to us and has been appropriately dealt with;
d) The balance sheet, profit and loss account and cash flow statement dealt with by this report are inagreement with the books of account;
e) In our opinion, the balance sheet, profit and loss account and cash flow statement dealt with by thisreport comply with the accounting standards referred to in sub section (3C) of Section 211 of theCompanies Act, insofar as they apply to the Bank;
f) On the basis of written representations received from the directors, as on March 31, 2005, and taken onrecord by the Board of Directors, we report that none of the directors is disqualified from being appointedas a director in terms of clause (g) of sub section (1) of Section 274 of the Companies Act, 1956;
g) In our opinion and to the best of our information and according to the explanations given to us, the saidaccounts give the information required by the Companies Act, 1956 in the manner so required forbanking companies, and give a true and fair view in conformity with the accounting principlesgenerally accepted in India;
i. in case of the balance sheet, of the state of the affairs of the Bank as at March 31, 2005;
ii. in case of the profit and loss account, of the profit for the year ended on that date; and
iii. in case of cash flow statement, of the cash flows for the year ended on that date.
For S. R. Batliboi & Co.Chartered Accountants
per Viren H. Mehtaa PartnerMembership No.: 048749
April 30, 2005
F-97

Balance Sheet as on March 31, 2005
ScheduleAs on
31.03.2005As on
31.03.2004
Rupees in ‘000s Rupees in ‘000s
Capital and LiabilitiesCapital . . . . . . . . . . . . . . . . . . . . . . . . . . . . . . . . . . . . . . . . . . . . . . . . . . 1 10,867,758 9,664,012Reserves and Surplus . . . . . . . . . . . . . . . . . . . . . . . . . . . . . . . . . . . . . . 2 118,131,954 73,941,561Deposits . . . . . . . . . . . . . . . . . . . . . . . . . . . . . . . . . . . . . . . . . . . . . . . . . 3 998,187,775 681,085,845Borrowings . . . . . . . . . . . . . . . . . . . . . . . . . . . . . . . . . . . . . . . . . . . . . . 4 335,444,960 307,402,393Other liabilities and provisions . . . . . . . . . . . . . . . . . . . . . . . . . . . . . . . 5 213,961,606 180,194,930
Total . . . . . . . . . . . . . . . . . . . . . . . . . . . . . . . . . . . . . . . . . . . . . . . . . . . 1,676,594,053 1,252,288,741
AssetsCash and balance with Reserve Bank of India . . . . . . . . . . . . . . . . . . . 6 63,449,004 54,079,966Balances with banks and money at call and short notice . . . . . . . . . . . 7 65,850,719 30,626,378Investments . . . . . . . . . . . . . . . . . . . . . . . . . . . . . . . . . . . . . . . . . . . . . . 8 504,873,525 434,355,214Advances . . . . . . . . . . . . . . . . . . . . . . . . . . . . . . . . . . . . . . . . . . . . . . . . 9 914,051,517 626,476,288Fixed Assets . . . . . . . . . . . . . . . . . . . . . . . . . . . . . . . . . . . . . . . . . . . . . 10 40,380,361 40,564,141Other Assets . . . . . . . . . . . . . . . . . . . . . . . . . . . . . . . . . . . . . . . . . . . . . 11 87,988,927 66,186,754
Total . . . . . . . . . . . . . . . . . . . . . . . . . . . . . . . . . . . . . . . . . . . . . . . . . . . 1,676,594,053 1,252,288,741
Contingent liabilities . . . . . . . . . . . . . . . . . . . . . . . . . . . . . . . . . . . . . . 12 2,681,537,382 2,029,419,027Bills for collection . . . . . . . . . . . . . . . . . . . . . . . . . . . . . . . . . . . . . . . . 23,920,922 15,109,352Significant accounting policies and notes to accounts . . . . . . . . . . . . . 18
The Schedules referred to above form an integral part of the Balance Sheet
As per our Report of even date
For and on behalf of the Board of Directors
For S. R. Batliboi & Co.Chartered Accountants
N. VaghulChairman
K. V. KamathManaging Director & CEO
Lalita D. GupteJoint Managing Director
per Viren H. Mehtaa Partner
Kalpana MorpariaDeputy Managing
Director
Chanda D. KochharExecutive Director
Nachiket MorExecutive Director
N. S. KannanChief Financial Officer
& Treasurer
Jyotin MehtaGeneral Manager &Company Secretary
G. VenkatakrishnanGeneral Manager—Accounting andTaxation Group
Place: Mumbai
Date: April 30, 2005
F-98

Profit and Loss Account for the year ended March 31, 2005
ScheduleYear ended31.03.2005
Year ended31.03.2004
Rupees in ‘000s Rupees in ‘000sI. INCOME
Interest earned . . . . . . . . . . . . . . . . . . . . . . . . . . . . . . . . . . . . . . . . . 13 94,098,944 90,023,946Other income . . . . . . . . . . . . . . . . . . . . . . . . . . . . . . . . . . . . . . . . . 14 34,161,439 30,649,228
Total . . . . . . . . . . . . . . . . . . . . . . . . . . . . . . . . . . . . . . . . . . . . . . 128,260,383 120,673,174
II. EXPENDITUREInterest expended . . . . . . . . . . . . . . . . . . . . . . . . . . . . . . . . . . . . . . 15 65,708,876 70,152,492Operating expenses . . . . . . . . . . . . . . . . . . . . . . . . . . . . . . . . . . . . . 16 32,991,475 25,712,325Provisions and contingencies . . . . . . . . . . . . . . . . . . . . . . . . . . . . . 17 9,508,016 8,437,294
Total . . . . . . . . . . . . . . . . . . . . . . . . . . . . . . . . . . . . . . . . . . . . . . 108,208,367 104,302,111
III. PROFIT/LOSSNet profit for the year . . . . . . . . . . . . . . . . . . . . . . . . . . . . . . . . . . . 20,052,016 16,371,063Profit brought forward . . . . . . . . . . . . . . . . . . . . . . . . . . . . . . . . . . 530,876 50,520
Total . . . . . . . . . . . . . . . . . . . . . . . . . . . . . . . . . . . . . . . . . . . . . . 20,582,892 16,421,583
IV. APPROPRIATIONS/TRANSFERSStatutory Reserve . . . . . . . . . . . . . . . . . . . . . . . . . . . . . . . . . . . . . . 5,020,000 4,093,000Capital Reserve . . . . . . . . . . . . . . . . . . . . . . . . . . . . . . . . . . . . . . . . 200,000 2,650,000Investment Fluctuation Reserve . . . . . . . . . . . . . . . . . . . . . . . . . . . — 2,760,000Special Reserve . . . . . . . . . . . . . . . . . . . . . . . . . . . . . . . . . . . . . . . . 250,000 250,000Revenue and other reserves . . . . . . . . . . . . . . . . . . . . . . . . . . . . . . 6,000,000 —Proposed equity share dividend . . . . . . . . . . . . . . . . . . . . . . . . . . . 6,329,609 5,440,592Proposed preference share dividend . . . . . . . . . . . . . . . . . . . . . . . . 35 35Corporate dividend tax . . . . . . . . . . . . . . . . . . . . . . . . . . . . . . . . . . 901,027 697,080Balance carried over to balance sheet . . . . . . . . . . . . . . . . . . . . . . . 1,882,221 530,876
Total . . . . . . . . . . . . . . . . . . . . . . . . . . . . . . . . . . . . . . . . . . . . . . . . . . . . . 20,582,892 16,421,583
Significant Accounting Policies and Notes to Accounts . . . . . . . . . . . . . 18Earning per Share (Refer note B. 8 )
Basic (Rs.) . . . . . . . . . . . . . . . . . . . . . . . . . . . . . . . . . . . . . . . . . . . . 27.55 26.66Diluted (Rs.) . . . . . . . . . . . . . . . . . . . . . . . . . . . . . . . . . . . . . . . . . . 27.33 26.44
Face value per share . . . . . . . . . . . . . . . . . . . . . . . . . . . . . . . . . . . . . . . . 10.00 10.00
The Schedules referred to above form an integral part of the Profit and Loss Account
As per our Report of even date For and on behalf of the Board of Directors
For S. R. Batliboi & Co. N. Vaghul K. V. Kamath Lalita D. GupteChartered Accountants Chairman Managing Director & CEO Joint Managing Director
per Viren H. Mehta Kalpana Morparia Chanda D. Kochhar Nachiket Mora Partner
Membership No.: 048749Deputy Managing Director Executive Director Executive Director
N. S. Kannan Jyotin Mehta G. VenkatakrishnanChief Financial Officer
& TreasurerGeneral Manager &Company Secretary
General Manager—Accounting andTaxation Group
Place: Mumbai
Date: April 30, 2005
F-99

Cash flow statement for the year ended March 31, 2005
PARTICULARSYear ended31.03.2005
Year ended31.03.2004
Rupees in‘000s
Rupees in‘000s
Cash flow from operating activitiesNet profit before taxes . . . . . . . . . . . . . . . . . . . . . . . . . . . . . . . . . . . . . . . . . . . . . . . . . . . . . . . . . . . . . . . . . . 25,272,032 19,022,209
Adjustments for:Depreciation and amortisation . . . . . . . . . . . . . . . . . . . . . . . . . . . . . . . . . . . . . . . . . . . . . . . . . . . . . . . . . . . . 9,424,450 9,268,549Net (appreciation)/depreciation on investments . . . . . . . . . . . . . . . . . . . . . . . . . . . . . . . . . . . . . . . . . . . . . . 5,416,494 987,057Provision in respect of non-performing assets (including prudential provision on standard assets . . . . . . . (1,213,571) 4,591,155Provision for contingencies & others . . . . . . . . . . . . . . . . . . . . . . . . . . . . . . . . . . . . . . . . . . . . . . . . . . . . . . 85,984 207,936Income from subsidiaries (investing activity) . . . . . . . . . . . . . . . . . . . . . . . . . . . . . . . . . . . . . . . . . . . . . . . . (1,880,786) (1,261,729)Loss on sale of fixed assets . . . . . . . . . . . . . . . . . . . . . . . . . . . . . . . . . . . . . . . . . . . . . . . . . . . . . . . . . . . . . . 20,822 19,136
37,125,425 32,834,313
Adjustments for:(Increase)/decrease in Investments . . . . . . . . . . . . . . . . . . . . . . . . . . . . . . . . . . . . . . . . . . . . . . . . . . . . . . . . (43,133,937) (47,269,037)(Increase)/decrease in Advances . . . . . . . . . . . . . . . . . . . . . . . . . . . . . . . . . . . . . . . . . . . . . . . . . . . . . . . . . . (287,949,797) (90,899,851)Increase/(decrease) in Borrowings . . . . . . . . . . . . . . . . . . . . . . . . . . . . . . . . . . . . . . . . . . . . . . . . . . . . . . . . 54,169,059 11,401,514Increase/(decrease) in Deposits . . . . . . . . . . . . . . . . . . . . . . . . . . . . . . . . . . . . . . . . . . . . . . . . . . . . . . . . . . . 317,101,929 199,392,782(Increase)/decrease in Other assets . . . . . . . . . . . . . . . . . . . . . . . . . . . . . . . . . . . . . . . . . . . . . . . . . . . . . . . . (20,734,975) (7,914,593)Increase/(decrease) in Other liabilities and provisions . . . . . . . . . . . . . . . . . . . . . . . . . . . . . . . . . . . . . . . . . 43,226,853 14,154,337
62,679,132 78,865,152
Direct taxes paid . . . . . . . . . . . . . . . . . . . . . . . . . . . . . . . . . . . . . . . . . . . . . . . . . . . . . . . . . . . . . . . . . . . . . . . . . . (8,487,388) (8,531,173)
Net cash generated from operating activities (A) . . . . . . . . . . . . . . . . . . . . . . . . . . . . . . . . . . . . . . . . . . . . . . . 91,317,169 103,168,292
Cash flow from investing activitiesInvestments in subsidiaries and/or joint ventures . . . . . . . . . . . . . . . . . . . . . . . . . . . . . . . . . . . . . . . . . . . . . (6,430,433) (6,415,226)Income received on such investments . . . . . . . . . . . . . . . . . . . . . . . . . . . . . . . . . . . . . . . . . . . . . . . . . . . . . . 1,880,786 1,261,729Purchase of fixed assets . . . . . . . . . . . . . . . . . . . . . . . . . . . . . . . . . . . . . . . . . . . . . . . . . . . . . . . . . . . . . . . . . (3,795,277) (4,838,324)Proceeds from sale of fixed assets . . . . . . . . . . . . . . . . . . . . . . . . . . . . . . . . . . . . . . . . . . . . . . . . . . . . . . . . . 262,914 337,851(Purchase)/Sale of held to maturity securities . . . . . . . . . . . . . . . . . . . . . . . . . . . . . . . . . . . . . . . . . . . . . . . . (26,370,435) (11,715,313)
Net cash generated from investing activities (B) . . . . . . . . . . . . . . . . . . . . . . . . . . . . . . . . . . . . . . . . . . . . . . . . (34,452,445) (21,369,283)
Cash flow from financing activitiesProceeds from issue of share capital . . . . . . . . . . . . . . . . . . . . . . . . . . . . . . . . . . . . . . . . . . . . . . . . . . . . . . . 31,922,933 —Amount received on exercise of stock options . . . . . . . . . . . . . . . . . . . . . . . . . . . . . . . . . . . . . . . . . . . . . . . 649,862 539,078Repayment of bonds (including subordinated debt) . . . . . . . . . . . . . . . . . . . . . . . . . . . . . . . . . . . . . . . . . . . (38,616,923) (57,334,107)Dividend and dividend tax paid . . . . . . . . . . . . . . . . . . . . . . . . . . . . . . . . . . . . . . . . . . . . . . . . . . . . . . . . . . . (6,227,217) (5,187,662)
Net cash generated from financing activities (C) . . . . . . . . . . . . . . . . . . . . . . . . . . . . . . . . . . . . . . . . . . . . . . . (12,271,345) (61,982,691)
Net increase/(decrease) in cash and cash equivalents (A) + (B) + (C) . . . . . . . . . . . . . . . . . . . . . . . . . . . . . . . 44,593,379 19,816,318
Cash and cash equivalents as at 1st April . . . . . . . . . . . . . . . . . . . . . . . . . . . . . . . . . . . . . . . . . . . . . . . . . . . . . 84,706,344 64,890,026
Cash and cash equivalents as at 31st March . . . . . . . . . . . . . . . . . . . . . . . . . . . . . . . . . . . . . . . . . . . . . . . . . . . 129,299,723 84,706,344
Significant accounting policies and notes to accounts (refer to Schedule 18)
The Schedules referred to above form an integral part of the Balance Sheet
As per our Report of even date
For and on behalf of the Board of Directors
For S. R. Batliboi & Co. N. Vaghul K. V. Kamath Lalita D. GupteChartered Accountants Chairman Managing Director & CEO Joint Managing Director
per Viren H. Mehta Kalpana Morparia Chanda D. Kochhar Nachiket Mora Partner Deputy Managing Director Executive Director Executive Director
N. S. Kannan Jyotin Mehta G. VenkatakrishnanChief Financial Officer
& TreasurerGeneral Manager &Company Secretary
General Manager— Accountingand Taxation Group
Place: Mumbai
Date: April 30, 2005
F-100

Schedules forming part of the balance sheet
SCHEDULE 1—CAPITAL
As on31.03.2005
As on31.03.2004
Rupees in ‘000s
Authorised capital1,550,000,000 equity shares of Rs. 10 each (March 31, 2004: 1,550,000,000 equity
shares of Rs. 10 each) . . . . . . . . . . . . . . . . . . . . . . . . . . . . . . . . . . . . . . . . . . . . . . . . . 15,500,000 15,500,000350 preference shares of Rs. 10 million each . . . . . . . . . . . . . . . . . . . . . . . . . . . . . . . . . 3,500,000 3,500,000
Equity share capitalIssued, subscribed and paid-up capital 616,391,905 equity shares (March 31, 2004:
613,021,301 equity shares) of Rs. 10 each . . . . . . . . . . . . . . . . . . . . . . . . . . . . . . . . . 6,163,919 6,130,213Less : Calls unpaid . . . . . . . . . . . . . . . . . . . . . . . . . . . . . . . . . . . . . . . . . . . . . . . . . . . . . — —Add : Forfeited 67,323 (March 31, 2004: 13,103 equity shares) equity shares . . . . . . . 372 93Add : Issued 120,324,189 equity shares (March 31, 2004: 3,370,604 equity shares) of
Rs. 10 each(1) . . . . . . . . . . . . . . . . . . . . . . . . . . . . . . . . . . . . . . . . . . . . . . . . . . . . . . . . 1,203,242 33,706Share capital suspense [net] [Represents application money received for 22,470
equity shares (March 31, 2004: Nil equity shares) of Rs. 10 each on exercise ofemployee stock options] . . . . . . . . . . . . . . . . . . . . . . . . . . . . . . . . . . . . . . . . . . . . . . . 225 —
TOTAL . . . . . . . . . . . . . . . . . . . . . . . . . . . . . . . . . . . . . . . . . . . . . . . . . . . . . . . . . . . . . . 7,367,758 6,164,012
Preference Share Capital(2)
[Represents face value of 350 preference shares of Rs. 10 million each issued topreference share holders of erstwhile ICICI Limited on amalgamation redeemableat par on April 20, 2018] . . . . . . . . . . . . . . . . . . . . . . . . . . . . . . . . . . . . . . . . . . . . . . . 3,500,000 3,500,000
TOTAL . . . . . . . . . . . . . . . . . . . . . . . . . . . . . . . . . . . . . . . . . . . . . . . . . . . . . . . . . . 10,867,758 9,664,012
(1) Includes :-a) 108,874,351 equity shares (net of shares forfeited) issued consequent to public issue vide prospectus
dated April 12, 2004b) 6,992,187 equity shares on exercise of the Green Shoe Option.c) 4,457,651 equity shares on exercise of employee stock options (March 31, 2004: 3,370,604 equity
shares).(2) The notification from Ministry of Finance has currently exempted the Bank from the restriction of
section 12 (1) of the Banking Regulation Act, 1949, which prohibits issue of preference shares by banks.
Note: Pursuant to the sponsored ADS offering in March 2005, 41,371,500 equity shares have been converted to20,685,750 ADSs.
F-101

Schedules forming part of the balance sheet—(Continued)
SCHEDULE 2—RESERVES AND SURPLUS
As on31.03.2005
As on31.03.2004
Rupees in ‘000s
I. Statutory reserveOpening balance . . . . . . . . . . . . . . . . . . . . . . . . . . . . . . . . . . . . . . . . . . . . . . . . . 9,607,307 5,514,307Additions during the year . . . . . . . . . . . . . . . . . . . . . . . . . . . . . . . . . . . . . . . . . . 5,020,000 4,093,000Deductions during the year . . . . . . . . . . . . . . . . . . . . . . . . . . . . . . . . . . . . . . . . . — —Closing balance . . . . . . . . . . . . . . . . . . . . . . . . . . . . . . . . . . . . . . . . . . . . . . . . . . 14,627,307 9,607,307
II. Special reserveOpening balance . . . . . . . . . . . . . . . . . . . . . . . . . . . . . . . . . . . . . . . . . . . . . . . . . 11,690,000 11,440,000Additions during the year . . . . . . . . . . . . . . . . . . . . . . . . . . . . . . . . . . . . . . . . . . 250,000 250,000Deductions during the year . . . . . . . . . . . . . . . . . . . . . . . . . . . . . . . . . . . . . . . . . — —Closing balance . . . . . . . . . . . . . . . . . . . . . . . . . . . . . . . . . . . . . . . . . . . . . . . . . . 11,940,000 11,690,000
III. Share premiumOpening balance . . . . . . . . . . . . . . . . . . . . . . . . . . . . . . . . . . . . . . . . . . . . . . . . . 8,523,304 8,045,721Additions during the year(1) . . . . . . . . . . . . . . . . . . . . . . . . . . . . . . . . . . . . . . . . 31,897,100 477,583Deductions during the year(2) . . . . . . . . . . . . . . . . . . . . . . . . . . . . . . . . . . . . . . . 528,052 —Closing balance . . . . . . . . . . . . . . . . . . . . . . . . . . . . . . . . . . . . . . . . . . . . . . . . . . 39,892,352 8,523,304
IV. Investment fluctuation reserveOpening balance . . . . . . . . . . . . . . . . . . . . . . . . . . . . . . . . . . . . . . . . . . . . . . . . . 7,303,350 1,273,350Additions during the year . . . . . . . . . . . . . . . . . . . . . . . . . . . . . . . . . . . . . . . . . . — 6,030,000Deductions during the year . . . . . . . . . . . . . . . . . . . . . . . . . . . . . . . . . . . . . . . . . 2,143,350 —Closing balance . . . . . . . . . . . . . . . . . . . . . . . . . . . . . . . . . . . . . . . . . . . . . . . . . . 5,160,000 7,303,350
V. Capital reserveOpening balance . . . . . . . . . . . . . . . . . . . . . . . . . . . . . . . . . . . . . . . . . . . . . . . . . 4,650,000 2,000,000Additions during the year . . . . . . . . . . . . . . . . . . . . . . . . . . . . . . . . . . . . . . . . . . 200,000 2,650,000Deductions during the year . . . . . . . . . . . . . . . . . . . . . . . . . . . . . . . . . . . . . . . . . — —Closing balance . . . . . . . . . . . . . . . . . . . . . . . . . . . . . . . . . . . . . . . . . . . . . . . . . . 4,850,000 4,650,000
VI. Revenue and other reservesOpening balance . . . . . . . . . . . . . . . . . . . . . . . . . . . . . . . . . . . . . . . . . . . . . . . . . 31,636,724 34,906,724Additions during the year . . . . . . . . . . . . . . . . . . . . . . . . . . . . . . . . . . . . . . . . . . 8,143,350 —Deductions during the year . . . . . . . . . . . . . . . . . . . . . . . . . . . . . . . . . . . . . . . . . — 3,270,000Closing balance . . . . . . . . . . . . . . . . . . . . . . . . . . . . . . . . . . . . . . . . . . . . . . . . . . 39,780,074 31,636,724
VII. Balance in profit and loss account . . . . . . . . . . . . . . . . . . . . . . . . . . . . . . . . . . . 1,882,221 530,876
TOTAL . . . . . . . . . . . . . . . . . . . . . . . . . . . . . . . . . . . . . . . . . . . . . . . . . . . . . . . . . . . . . 118,131,954 73,941,561
(1) Includes:a) Rs. 29,396.1 million (net of share premium in arrears of Rs. Nil (March 31, 2004: Rs. Nil) consequent to
public issue vide prospectus dated April 12, 2004.b) Rs. 1,887.9 million on the exercise of the Green Shoe Option.c) Rs. 602.5 million (March 31, 2004: Rs. 477.6 million) on exercise of employee stock options.d) Rs. 2.5 million (March 31, 2004: Rs. Nil) on account of share application money on exercise of employee
stock options.e) Rs. 8.1 million (March 31, 2004: Rs. Nil) on account of shares forfeited as per terms of public issue vide
prospectus dated April 12, 2004.(2) Represents share issue expenses amounting to Rs. 528.1 million, written-off from the share premium
account as per the object of the issue.
F-102

Schedules forming part of the balance sheet—(Continued)
SCHEDULE 3—DEPOSITS
As on31.03.2005
As on31.03.2004
Rupees in ‘000sA.I. Demand deposits
i) From banks . . . . . . . . . . . . . . . . . . . . . . . . . . . . . . . . . . . . . . . . . . . . . . . . . . 1,976,547 1,345,603ii) From others . . . . . . . . . . . . . . . . . . . . . . . . . . . . . . . . . . . . . . . . . . . . . . . . . . 126,392,471 71,244,990
II. Savings bank deposits . . . . . . . . . . . . . . . . . . . . . . . . . . . . . . . . . . . . . . . . . . . . 113,918,205 83,720,260III. Term deposits
i) From banks . . . . . . . . . . . . . . . . . . . . . . . . . . . . . . . . . . . . . . . . . . . . . . . . . . 64,467,974 50,418,828ii) From others . . . . . . . . . . . . . . . . . . . . . . . . . . . . . . . . . . . . . . . . . . . . . . . . . . 691,432,578 474,356,164
TOTAL . . . . . . . . . . . . . . . . . . . . . . . . . . . . . . . . . . . . . . . . . . . . . . . . . . . . . . . . . . . 998,187,775 681,085,845
B.I. Deposits of branches in India . . . . . . . . . . . . . . . . . . . . . . . . . . . . . . . . . . . . . . 963,791,353 670,287,519II. Deposits of branches outside India . . . . . . . . . . . . . . . . . . . . . . . . . . . . . . . . . . 34,396,422 10,798,326
TOTAL . . . . . . . . . . . . . . . . . . . . . . . . . . . . . . . . . . . . . . . . . . . . . . . . . . . . . . . . . . . 998,187,775 681,085,845
SCHEDULE 4—BORROWINGS
As on31.03.2005
As on31.03.2004
Rupees in ‘000sI. Borrowings in India
i) Reserve Bank of India . . . . . . . . . . . . . . . . . . . . . . . . . . . . . . . . . . . . . . . . . . . — —ii) Other banks . . . . . . . . . . . . . . . . . . . . . . . . . . . . . . . . . . . . . . . . . . . . . . . . . . . 20,779,268 16,568,829iii) Other institutions and agencies
a) Government of India . . . . . . . . . . . . . . . . . . . . . . . . . . . . . . . . . . . . . . . . 3,612,510 4,411,459b) Financial Institutions . . . . . . . . . . . . . . . . . . . . . . . . . . . . . . . . . . . . . . . . 45,185,692 40,531,000
iv) Borrowings in the form ofa) Deposits taken over from erstwhile ICICI Limited . . . . . . . . . . . . . . . . 2,070,517 3,098,362b) Bonds and debentures (excluding subordinated debt)
—Debentures and bonds guaranteed by the government of India . . . 14,815,000 14,815,000—Borrowings under private placement of bonds carrying maturity
of one to thirty years from the date of placement . . . . . . . . . . . . . . 30,948,127 48,150,574Bonds issued under multiple option/safety bonds series
—Regular interest bonds . . . . . . . . . . . . . . . . . . . . . . . . . . . . . . . . . . . 9,933,481 10,953,604—Deep discount bonds . . . . . . . . . . . . . . . . . . . . . . . . . . . . . . . . . . . . 4,039,128 4,069,486—Bonds with premium warrants . . . . . . . . . . . . . . . . . . . . . . . . . . . . 797,947 685,670—Encash bonds . . . . . . . . . . . . . . . . . . . . . . . . . . . . . . . . . . . . . . . . . . 1,170,280 1,431,105—Tax saving bonds . . . . . . . . . . . . . . . . . . . . . . . . . . . . . . . . . . . . . . . 59,167,873 84,889,030—Pension bonds . . . . . . . . . . . . . . . . . . . . . . . . . . . . . . . . . . . . . . . . . 59,351 56,896
c) Application money pending allotment . . . . . . . . . . . . . . . . . . . . . . . . . . 6,160,858 —II. Borrowings outside India
i) From multilateral/bilateral credit agencies (guaranteed by the government ofIndia for the equivalent of Rs. 20,448.6 million) . . . . . . . . . . . . . . . . . . . . . . 24,949,331 24,403,563
ii) From international banks, institutions and consortiums . . . . . . . . . . . . . . . . . 80,041,728 35,111,989iii) By way of bonds and notes . . . . . . . . . . . . . . . . . . . . . . . . . . . . . . . . . . . . . . 31,713,869 18,225,826
TOTAL . . . . . . . . . . . . . . . . . . . . . . . . . . . . . . . . . . . . . . . . . . . . . . . . . . . . . . . . . . . . 335,444,960 307,402,393
Secured borrowings in I and II above is Rs. Nil.
F-103

Schedules forming part of the balance sheet—(Continued)
SCHEDULE 5—OTHER LIABILITIES AND PROVISIONS
As on31.03.2005
As on31.03.2004
Rupees in ‘000sI. Bills payable . . . . . . . . . . . . . . . . . . . . . . . . . . . . . . . . . . . . . . . . . . . . . . . . . . . . . 27,944,845 16,852,843II. Inter-office adjustments (net) . . . . . . . . . . . . . . . . . . . . . . . . . . . . . . . . . . . . . . . . 5,614,186 3,419,337III. Interest accrued . . . . . . . . . . . . . . . . . . . . . . . . . . . . . . . . . . . . . . . . . . . . . . . . . . . 13,116,497 13,561,305IV. Unsecured Redeemable Debentures/Bonds . . . . . . . . . . . . . . . . . . . . . . . . . . . . .
(Subordinated for Tier II Capital) . . . . . . . . . . . . . . . . . . . . . . . . . . . . . . . . . . . . 82,088,996 91,058,612V. Others
a) Security deposits from clients . . . . . . . . . . . . . . . . . . . . . . . . . . . . . . . . . . . . . 12,030,416 9,510,841b) Sundry creditors . . . . . . . . . . . . . . . . . . . . . . . . . . . . . . . . . . . . . . . . . . . . . . . . 42,262,101 24,970,428c) Received for disbursements under special program . . . . . . . . . . . . . . . . . . . . . 2,932,942 2,730,091d) Provision for standard assets . . . . . . . . . . . . . . . . . . . . . . . . . . . . . . . . . . . . . . 2,248,050 3,828,050e) Other Liabilities* . . . . . . . . . . . . . . . . . . . . . . . . . . . . . . . . . . . . . . . . . . . . . . . 25,723,573 14,263,423
TOTAL . . . . . . . . . . . . . . . . . . . . . . . . . . . . . . . . . . . . . . . . . . . . . . . . . . . . . . . . . . . . 213,961,606 180,194,930
* Includesa) Proposed dividend Rs. 6,262.1 million (March 31, 2004: Rs. 5,439.9 million).b) Corporate dividend Tax payable Rs. 878.3 million (March 31, 2004: Rs. 697.0 million).
SCHEDULE 6—CASH AND CASH BALANCES WITH RESERVE BANK OF INDIA
As on31.03.2005
As on31.03.2004
Rupees in ‘000sI. Cash in hand (including foreign currency notes) . . . . . . . . . . . . . . . . . . . . . . . . . . . . 5,544,811 4,467,734II. Balances with Reserve Bank of India in current accounts . . . . . . . . . . . . . . . . . . . . . 57,904,193 49,612,232
TOTAL . . . . . . . . . . . . . . . . . . . . . . . . . . . . . . . . . . . . . . . . . . . . . . . . . . . . . . . . . . . . . . 63,449,004 54,079,966
SCHEDULE 7—BALANCES WITH BANKS AND MONEY AT CALL AND SHORT NOTICE
As on31.03.2005
As on31.03.2004
Rupees in ‘000sI. In India
i) Balances with banksa) in current accounts . . . . . . . . . . . . . . . . . . . . . . . . . . . . . . . . . . . . . . . . . . . . . . . 5,228,934 3,411,303b) in other deposit accounts . . . . . . . . . . . . . . . . . . . . . . . . . . . . . . . . . . . . . . . . . . 7,061,268 10,238,969
ii) Money at call and short noticea) with banks . . . . . . . . . . . . . . . . . . . . . . . . . . . . . . . . . . . . . . . . . . . . . . . . . . . . . 16,100,000 —b) with other institutions . . . . . . . . . . . . . . . . . . . . . . . . . . . . . . . . . . . . . . . . . . . . 1,900,000 —
TOTAL . . . . . . . . . . . . . . . . . . . . . . . . . . . . . . . . . . . . . . . . . . . . . . . . . . . . . . . . . . . . . . 30,290,202 13,650,272
II. Outside Indiai) in current accounts . . . . . . . . . . . . . . . . . . . . . . . . . . . . . . . . . . . . . . . . . . . . . . . . . 7,324,711 2,877,153ii) in other deposit accounts . . . . . . . . . . . . . . . . . . . . . . . . . . . . . . . . . . . . . . . . . . . . 16,659,195 9,948,286iii) money at call and short notice . . . . . . . . . . . . . . . . . . . . . . . . . . . . . . . . . . . . . . . 11,576,611 4,150,667
TOTAL . . . . . . . . . . . . . . . . . . . . . . . . . . . . . . . . . . . . . . . . . . . . . . . . . . . . . . . . . . . . . . 35,560,517 16,976,106
GRAND TOTAL (I + II) . . . . . . . . . . . . . . . . . . . . . . . . . . . . . . . . . . . . . . . . . . . . . . . . 65,850,719 30,626,378
F-104

Schedules forming part of the balance sheet—(Continued)
SCHEDULE 8—INVESTMENTS [net of provisions]
As on31.03.2005
As on31.03.2004
Rupees in ‘000s
I. Investments in Indiai) Government securities . . . . . . . . . . . . . . . . . . . . . . . . . . . . . . . . . . . . . . . . . 344,516,800 298,876,781ii) Other approved securities . . . . . . . . . . . . . . . . . . . . . . . . . . . . . . . . . . . . . . 301,154 301,155iii) Shares . . . . . . . . . . . . . . . . . . . . . . . . . . . . . . . . . . . . . . . . . . . . . . . . . . . . . 19,147,771 16,842,660iv) Debentures and Bonds . . . . . . . . . . . . . . . . . . . . . . . . . . . . . . . . . . . . . . . . . 28,540,305 55,490,989v) Subsidiaries and/or joint ventures . . . . . . . . . . . . . . . . . . . . . . . . . . . . . . . . 12,848,124 11,037,612vi) Others (CPs, Mutual Fund Units, Pass through Certificates, Security
Receipts etc.) . . . . . . . . . . . . . . . . . . . . . . . . . . . . . . . . . . . . . . . . . . . . . . . . 84,404,072 48,196,306
TOTAL . . . . . . . . . . . . . . . . . . . . . . . . . . . . . . . . . . . . . . . . . . . . . . . . . . . 489,758,226 430,745,503
II. Investments outside Indiai) Government securities . . . . . . . . . . . . . . . . . . . . . . . . . . . . . . . . . . . . . . . . . 377,947 132,924ii) Subsidiaries and/or joint ventures abroad* . . . . . . . . . . . . . . . . . . . . . . . . . 7,818,846 3,198,926iii) Others . . . . . . . . . . . . . . . . . . . . . . . . . . . . . . . . . . . . . . . . . . . . . . . . . . . . . 6,918,506 277,861
TOTAL . . . . . . . . . . . . . . . . . . . . . . . . . . . . . . . . . . . . . . . . . . . . . . . . . . . 15,115,299 3,609,711
GRAND TOTAL (I + II) . . . . . . . . . . . . . . . . . . . . . . . . . . . . . . . . . . . . . 504,873,525 434,355,214
* Includes investment in preference shares.
F-105

Schedules forming part of the balance sheet—(Continued)
SCHEDULE 9—ADVANCES [net of provisions]
As on31.03.2005
As on31.03.2004
Rupees in ‘000s
A. i) Bills purchased and discounted . . . . . . . . . . . . . . . . . . . . . . . . . . . . . . . . . . 43,984,209 12,308,603ii) Cash credits, overdrafts and loans repayable on demand . . . . . . . . . . . . . . 123,344,410 60,978,735iii) Term loans . . . . . . . . . . . . . . . . . . . . . . . . . . . . . . . . . . . . . . . . . . . . . . . . . . 722,588,931 539,807,424iv) Securitization, Finance lease and Hire Purchase receivables* . . . . . . . . . . 24,133,967 13,381,526
TOTAL . . . . . . . . . . . . . . . . . . . . . . . . . . . . . . . . . . . . . . . . . . . . . . . . . . . . 914,051,517 626,476,288
B. i) Secured by tangible assets (includes advances against Book Debt) . . . . . . 778,517,712 573,528,527ii) Covered by Bank/Government Guarantees . . . . . . . . . . . . . . . . . . . . . . . . . 10,104,623 6,154,561iii) Unsecured . . . . . . . . . . . . . . . . . . . . . . . . . . . . . . . . . . . . . . . . . . . . . . . . . . 125,429,182 46,793,200
TOTAL . . . . . . . . . . . . . . . . . . . . . . . . . . . . . . . . . . . . . . . . . . . . . . . . . . . 914,051,517 626,476,288
C.I. Advances in Indiai) Priority Sector . . . . . . . . . . . . . . . . . . . . . . . . . . . . . . . . . . . . . . . . . . . . . . . 200,892,904 145,307,396ii) Public Sector . . . . . . . . . . . . . . . . . . . . . . . . . . . . . . . . . . . . . . . . . . . . . . . . 11,154,310 7,071,294iii) Banks . . . . . . . . . . . . . . . . . . . . . . . . . . . . . . . . . . . . . . . . . . . . . . . . . . . . . . 4,517,162 433,504iv) Others . . . . . . . . . . . . . . . . . . . . . . . . . . . . . . . . . . . . . . . . . . . . . . . . . . . . . 635,303,209 463,026,182
TOTAL . . . . . . . . . . . . . . . . . . . . . . . . . . . . . . . . . . . . . . . . . . . . . . . . . . . 851,867,585 615,838,376
II. Advances outside Indiai) Due from banks . . . . . . . . . . . . . . . . . . . . . . . . . . . . . . . . . . . . . . . . . . . . . . 10,375,851 —ii) Due from others
a) Bills purchased and discounted . . . . . . . . . . . . . . . . . . . . . . . . . . . . . . 24,736,630 5,958,406b) Syndicated loans . . . . . . . . . . . . . . . . . . . . . . . . . . . . . . . . . . . . . . . . . 11,925,394 1,962,537c) Others . . . . . . . . . . . . . . . . . . . . . . . . . . . . . . . . . . . . . . . . . . . . . . . . . 15,146,057 2,716,969
TOTAL . . . . . . . . . . . . . . . . . . . . . . . . . . . . . . . . . . . . . . . . . . . . . . . . . . . 62,183,932 10,637,912
TOTAL ADVANCES . . . . . . . . . . . . . . . . . . . . . . . . . . . . . . . . . . . . . . . . . . . . . . . . 914,051,517 626,476,288
* Includes receivables under lease amounting to Rs. 913.6 million (March 31, 2004: Rs. 1,417.8 million)
F-106

Schedules forming part of the balance sheet—(Continued)
SCHEDULE 10—FIXED ASSETS
As on31.03.2005
As on31.03.2004
Rupees in ‘000sI. Premises
At cost as March 31st of preceding year . . . . . . . . . . . . . . . . . . . . . . . . . . . . . . . . . 16,668,982 16,061,840Additions during the year . . . . . . . . . . . . . . . . . . . . . . . . . . . . . . . . . . . . . . . . . . . . 2,254,384 939,989Deductions during the year . . . . . . . . . . . . . . . . . . . . . . . . . . . . . . . . . . . . . . . . . . . (93,625) (332,847)Depreciation to date . . . . . . . . . . . . . . . . . . . . . . . . . . . . . . . . . . . . . . . . . . . . . . . . (1,516,102) (1,020,673)
Net block . . . . . . . . . . . . . . . . . . . . . . . . . . . . . . . . . . . . . . . . . . . . . . . . . . . . . . . . . 17,313,639 15,648,309
II. Other fixed assets (including furniture and fixtures)*At cost as on March 31st of preceding year . . . . . . . . . . . . . . . . . . . . . . . . . . . . . . . 13,587,781 10,612,849Additions during the year . . . . . . . . . . . . . . . . . . . . . . . . . . . . . . . . . . . . . . . . . . . . 2,826,608 3,121,078Deductions during the year . . . . . . . . . . . . . . . . . . . . . . . . . . . . . . . . . . . . . . . . . . . (110,450) (146,146)Depreciation to date . . . . . . . . . . . . . . . . . . . . . . . . . . . . . . . . . . . . . . . . . . . . . . . . (7,765,842) (5,303,877)
Net block . . . . . . . . . . . . . . . . . . . . . . . . . . . . . . . . . . . . . . . . . . . . . . . . . . . . . . . . . 8,538,097 8,283,904
III. Assets given on LeaseAt cost as on March 31st of preceding year . . . . . . . . . . . . . . . . . . . . . . . . . . . . . . . 20,645,237 21,455,141Additions during the year . . . . . . . . . . . . . . . . . . . . . . . . . . . . . . . . . . . . . . . . . . . . 2,838 777,257Deductions during the year . . . . . . . . . . . . . . . . . . . . . . . . . . . . . . . . . . . . . . . . . . . (525,248) (1,587,161)Depreciation to date, accumulated lease adjustment and provisions . . . . . . . . . . . (5,594,202) (4,013,309)
Net block . . . . . . . . . . . . . . . . . . . . . . . . . . . . . . . . . . . . . . . . . . . . . . . . . . . . . . . . . 14,528,625 16,631,928
TOTAL . . . . . . . . . . . . . . . . . . . . . . . . . . . . . . . . . . . . . . . . . . . . . . . . . . . . . 40,380,361 40,564,141
* Includes amount capitalized on software: Cost as on 31.03.2004 Rs. 2,057.7 million. Additions during the yearRs. 364.9 million. Accumulated depreciation Rs. 1,396.5 million. Net value Rs. 1,026.1 million.
SCHEDULE 11—OTHER ASSETS
As on31.03.2005
As on31.03.2004
Rupees in ‘000sI. Inter-office adjustments (net) . . . . . . . . . . . . . . . . . . . . . . . . . . . . . . . . . . . . . . . . . — —II. Interest accrued . . . . . . . . . . . . . . . . . . . . . . . . . . . . . . . . . . . . . . . . . . . . . . . . . . . . 13,124,389 10,031,028III. Tax paid in advance/tax deducted at source (net) . . . . . . . . . . . . . . . . . . . . . . . . . . 26,643,957 19,951,503IV. Stationery and Stamps . . . . . . . . . . . . . . . . . . . . . . . . . . . . . . . . . . . . . . . . . . . . . . . 3,609 3,600V. Non-banking assets acquired in satisfaction of claims* . . . . . . . . . . . . . . . . . . . . . 3,677,234 5,047,938VI. Others
a) Advance for capital assets . . . . . . . . . . . . . . . . . . . . . . . . . . . . . . . . . . . . . . . . 963,017 939,922b) Outstanding fees and other Income . . . . . . . . . . . . . . . . . . . . . . . . . . . . . . . . . 2,792,942 1,484,556c) Exchange fluctuation suspense with Government of India . . . . . . . . . . . . . . . 244,749 577,818d) Swap suspense . . . . . . . . . . . . . . . . . . . . . . . . . . . . . . . . . . . . . . . . . . . . . . . . . 794,710 677,012e) Deposits . . . . . . . . . . . . . . . . . . . . . . . . . . . . . . . . . . . . . . . . . . . . . . . . . . . . . . 15,003,770 8,951,335f) Deferred tax asset (net) . . . . . . . . . . . . . . . . . . . . . . . . . . . . . . . . . . . . . . . . . . 148,666 4,429,685g) Early retirement option expenses not written off . . . . . . . . . . . . . . . . . . . . . . 1,269,979 1,653,979h) Others . . . . . . . . . . . . . . . . . . . . . . . . . . . . . . . . . . . . . . . . . . . . . . . . . . . . . . . 23,321,905 12,438,378
TOTAL . . . . . . . . . . . . . . . . . . . . . . . . . . . . . . . . . . . . . . . . . . . . . . . . . . . . . 87,988,927 66,186,754
* Includes certain non-banking assets acquired in satisfaction of claims which are in the process of beingtransferred in the Banks’ name.
F-107

Schedules forming part of the balance sheet—(Continued)
SCHEDULE 12—CONTINGENT LIABILITIES
As on31.03.2005
As on31.03.2004
Rupees in ‘000s
I. Claims against the Bank not acknowledged as debts . . . . . . . . . . . . . . . . . . 27,464,523 25,017,852II. Liability for partly paid investments . . . . . . . . . . . . . . . . . . . . . . . . . . . . . . . 168,396 1,241,429III. Liability on account of outstanding forward exchange contracts . . . . . . . . . 714,848,723 557,043,848IV. Guarantees given on behalf of constituents
a) In India . . . . . . . . . . . . . . . . . . . . . . . . . . . . . . . . . . . . . . . . . . . . . . . . . 140,444,828 113,855,978b) Outside India . . . . . . . . . . . . . . . . . . . . . . . . . . . . . . . . . . . . . . . . . . . . . 15,968,174 6,433,971
V. Acceptances, endorsements and other obligations . . . . . . . . . . . . . . . . . . . . 74,115,736 65,141,996VI. Currency Swaps . . . . . . . . . . . . . . . . . . . . . . . . . . . . . . . . . . . . . . . . . . . . . . . 112,957,025 44,484,809VII. Interest rate swaps, currency options and interest rate futures . . . . . . . . . . . 1,519,218,305 1,177,640,840VIII.Other items for which the Bank is contingently liable . . . . . . . . . . . . . . . . . 76,351,672 38,558,304
TOTAL . . . . . . . . . . . . . . . . . . . . . . . . . . . . . . . . . . . . . . . . . . . . . . . . 2,681,537,382 2,029,419,027
F-108

Schedules forming part of the profit and loss account
SCHEDULE 13—INTEREST EARNED
Year ended31.03.2005
Year ended31.03.2004
Rupees in ‘000s
I. Interest/discount on advances/bills . . . . . . . . . . . . . . . . . . . . . . . . . . . . . . . . . . . . . 67,528,301 60,738,528II. Income on investments . . . . . . . . . . . . . . . . . . . . . . . . . . . . . . . . . . . . . . . . . . . . . . 22,294,366 25,400,941III. Interest on balances with Reserve Bank of India and other inter-bank funds . . . . . 2,320,089 2,106,345IV. Others* . . . . . . . . . . . . . . . . . . . . . . . . . . . . . . . . . . . . . . . . . . . . . . . . . . . . . . . . . . 1,956,188 1,778,132
TOTAL . . . . . . . . . . . . . . . . . . . . . . . . . . . . . . . . . . . . . . . . . . . . . . . . . . . . . 94,098,944 90,023,946
* Includes interest on income tax refunds Rs. 247.3 million (March 31, 2004: Rs. 406.1 million).
SCHEDULE 14—OTHER INCOME
Year ended31.03.2005
Year ended31.03.2004
Rupees in ‘000s
I. Commission, exchange and brokerage . . . . . . . . . . . . . . . . . . . . . . . . . . . . . . . . . . 19,210,001 10,717,982II. Profit/(Loss) on sale of investments (net) . . . . . . . . . . . . . . . . . . . . . . . . . . . . . . . . 5,461,352 12,246,330III. Profit/(Loss) on revaluation of investments (net) . . . . . . . . . . . . . . . . . . . . . . . . . . (907) —IV. Profit/(Loss) on sale of land, buildings and other assets (net)* . . . . . . . . . . . . . . . (20,822) (19,136)V. Profit/(Loss) on foreign exchange transactions (net) . . . . . . . . . . . . . . . . . . . . . . . 3,146,394 1,926,267VI. Income earned by way of dividends, etc. from subsidiary companies and/or joint
ventures abroad/in India . . . . . . . . . . . . . . . . . . . . . . . . . . . . . . . . . . . . . . . . . . . . . 1,880,786 1,261,730VII. Miscellaneous Income (including lease income) . . . . . . . . . . . . . . . . . . . . . . . . . . 4,484,635 4,516,055
TOTAL . . . . . . . . . . . . . . . . . . . . . . . . . . . . . . . . . . . . . . . . . . . . . . . . . . . . . 34,161,439 30,649,228
* Includes profit/(loss) on sale of assets given on lease.
SCHEDULE 15—INTEREST EXPENDED
Year ended31.03.2005
Year ended31.03.2004
Rupees in ‘000s
I. Interest on deposits . . . . . . . . . . . . . . . . . . . . . . . . . . . . . . . . . . . . . . . . . . . . . . . . . 32,520,688 30,230,202II. Interest on Reserve Bank of India/inter-bank borrowings . . . . . . . . . . . . . . . . . . . 2,527,689 2,293,656III. Others (including interest on borrowings of erstwhile ICICI Limited)* . . . . . . . . 30,660,499 37,628,634
TOTAL . . . . . . . . . . . . . . . . . . . . . . . . . . . . . . . . . . . . . . . . . . . . . . . . . . . . . 65,708,876 70,152,492
* Includes expenses incurred to raise funds amounting to Rs. 252.6 million (March 31, 2004 : Rs. 297.4 million).
F-109

Schedules forming part of the profit and loss account—(Continued)
SCHEDULE 16—OPERATING EXPENSES
Year ended31.03.2005
Year ended31.03.2004
Rupees in ‘000s
I. Payments to and provisions for employees . . . . . . . . . . . . . . . . . . . . . . . . . . . . . 7,374,121 5,460,573II. Rent, taxes and lighting . . . . . . . . . . . . . . . . . . . . . . . . . . . . . . . . . . . . . . . . . . . . 1,853,347 1,492,502III. Printing and Stationery . . . . . . . . . . . . . . . . . . . . . . . . . . . . . . . . . . . . . . . . . . . . . 876,632 861,008IV. Advertisement and publicity . . . . . . . . . . . . . . . . . . . . . . . . . . . . . . . . . . . . . . . . . 1,162,555 686,788V. Depreciation on Bank’s property (including non banking assets) . . . . . . . . . . . . 2,933,725 2,609,344VI. Depreciation (including lease equalisation) on Leased assets . . . . . . . . . . . . . . . 2,969,907 2,785,069VII. Directors’ fees, allowances and expenses . . . . . . . . . . . . . . . . . . . . . . . . . . . . . . . 3,872 3,650VIII. Auditors’ fees and expenses . . . . . . . . . . . . . . . . . . . . . . . . . . . . . . . . . . . . . . . . . 17,632 16,750IX. Law Charges . . . . . . . . . . . . . . . . . . . . . . . . . . . . . . . . . . . . . . . . . . . . . . . . . . . . . 97,141 86,895X. Postages, Telegrams, Telephones, etc. . . . . . . . . . . . . . . . . . . . . . . . . . . . . . . . . . 1,736,270 1,415,019XI. Repairs and maintenance . . . . . . . . . . . . . . . . . . . . . . . . . . . . . . . . . . . . . . . . . . . 2,159,454 1,895,723XII. Insurance . . . . . . . . . . . . . . . . . . . . . . . . . . . . . . . . . . . . . . . . . . . . . . . . . . . . . . . . 597,230 334,991XIII. Direct marketing agency expenses . . . . . . . . . . . . . . . . . . . . . . . . . . . . . . . . . . . . 4,854,521 2,937,004XIV. Other expenditure . . . . . . . . . . . . . . . . . . . . . . . . . . . . . . . . . . . . . . . . . . . . . . . . . 6,355,068 5,127,009
TOTAL . . . . . . . . . . . . . . . . . . . . . . . . . . . . . . . . . . . . . . . . . . . . . . . . . . . . . . 32,991,475 25,712,325
SCHEDULE 17—PROVISIONS AND CONTINGENCIESYear ended31.03.2005
Year ended31.03.2004
Rupees in ‘000s
I. Income Tax—Current period tax . . . . . . . . . . . . . . . . . . . . . . . . . . . . . . . . . . . . . . . . . . . . . 1,764,935 2,695,947—Deferred tax adjustment . . . . . . . . . . . . . . . . . . . . . . . . . . . . . . . . . . . . . . . . 3,425,081 (68,800 )
II. Wealth Tax . . . . . . . . . . . . . . . . . . . . . . . . . . . . . . . . . . . . . . . . . . . . . . . . . . . . . . 30,000 24,000III. Provision for investments (including credit substitutes) (net) . . . . . . . . . . . . . . . 5,415,587 987,056IV. Provision for advances (net)* . . . . . . . . . . . . . . . . . . . . . . . . . . . . . . . . . . . . . . . . (1,213,571) 4,591,155V. Others . . . . . . . . . . . . . . . . . . . . . . . . . . . . . . . . . . . . . . . . . . . . . . . . . . . . . . . . . . 85,984 207,936
TOTAL . . . . . . . . . . . . . . . . . . . . . . . . . . . . . . . . . . . . . . . . . . . . . . . . . . . . . . 9,508,016 8,437,294
* Includes provision on non performing advances, non performing leased assets, other receivables and standardassets.
F-110

Schedules forming part of the Accounts
SCHEDULE 18—SIGNIFICANT ACCOUNTING POLICIES AND NOTES TO ACCOUNTS
Overview
ICICI Bank Limited (“ICICI Bank” or “the Bank”), incorporated in Vadodara, India is a publicly held bankengaged in providing a wide range of banking and financial services including commercial banking and treasuryoperations. ICICI Bank is a banking company governed by the Banking Regulation Act, 1949.
Basis of Preparation
The accounting and reporting policies of ICICI Bank used in the preparation of these financial statementsconform to Generally Accepted Accounting Principles (“GAAP”) in India, the guidelines issued by ReserveBank of India (“RBI”) from time to time and practices generally prevailing within the banking industry in India.The Bank follows the accrual method of accounting, except where otherwise stated, and the historical costconvention.
The preparation of financial statements requires the management to make estimates and assumptionsconsidered in the reported amounts of assets and liabilities (including contingent liabilities) as of the date of thefinancial statements and the reported income and expenses during the reporting period. Management believesthat the estimates used in the preparation of the financial statements are prudent and reasonable. Future resultscould differ from these estimates.
Equity issue
During the year, the Bank made an issue of 115,920,758 equity shares (including 6,992,187 equity sharesissued by exercise of green shoe option) of Rs.10 each at a premium of Rs. 270 per share aggregatingRs. 32,457.8 million under the Prospectus dated April 12, 2004. The expenses of the issue have been charged tothe Share Premium Account, in accordance with the objects of the Issue stated in the Prospectus.
ICICI Bank had sponsored American Depositary Shares (ADSs) Offering which opened for participation onMarch 7, 2005 and closed on March 11, 2005. In terms of the Offering, 20,685,750 ADSs representing41,371,500 equity shares had been sold at a price of US$ 21.1 per ADS. The gross proceeds from the ADSOffering were approximately US$ 436.7 million (Rs.19,099.6 million). The net consideration per share (afterdeduction of expenses in connection with the offering) was Rs. 453.16.
A. SIGNIFICANT ACCOUNTING POLICIES
1. Revenue recognition
a) Interest income is recognised in the profit and loss account as it accrues except in the case ofnon-performing assets where it is recognised, upon realisation, as per the prudential norms of RBI. Accrual ofincome is also suspended considering economic conditions and other risk factors, on certain other loans,including certain projects under implementation, where the implementation has been significantly delayed or inthe opinion of the management significant uncertainties exist as to the final financial closure and/or date ofcompletion of the project.
b) Commissions paid to direct marketing agents (“DMAs”) for auto loans, is recorded upfront in the profitand loss account net of subvention income received from them.
c) Income from hire purchase operations is accrued by applying the interest rate implicit on outstandingbalances.
F-111

d) Income from leases is calculated by applying the interest rate implicit in the lease to the net investmentoutstanding on the lease over the primary lease period. Leases effected from April 1, 2001 have been accountedas per Accounting Standard 19 on “Accounting for Leases” issued by Institute of Chartered Accountants of India(“ICAI”). Accordingly, leases effective from April 1, 2001 are accounted as advances at an amount equal to thenet investment in the lease. The lease rentals are apportioned between principal and finance income based on apattern reflecting a constant periodic return on the net investment of outstanding in respect of finance lease. Theprincipal amount is recognised as repayment of advances and the finance income is reported as interest income.
e) Income on discounted instruments is recognised over the tenure of the instrument on a constant yieldbasis.
f) Dividend is accounted on an accrual basis when the right to receive the dividend is established.
g) Fees received as a compensation of future interest sacrifice is amortised over the remaining period of thefacility.
h) Arranger’s fee is accrued proportionately where more than 75% of the total amount of finance has beenarranged.
i) All other fee income is recognised upfront on their becoming due.
j) Income arising from sell down/securitization of loan assets is recognised upfront, net of future servicingcost for assets sold, expected prepayment and projected delinquencies and included in interest income.
k) Guarantee commission is recognised over the period of the guarantee.
2. Investments
Investments are valued in accordance with the extant Reserve Bank of India guidelines on investmentclassification and valuation as under:
a) All investments are categorised into ‘Held to Maturity’, ‘Available for Sale’ and ‘Held for Trading.Reclassifications, if any, in any category are accounted for as per Reserve Bank of India guidelines. Undereach category, the investments are further classified under (a) government securities (b) other approvedsecurities (c) shares (d) bonds and debentures, (e) subsidiaries and joint ventures and (f) others.
b) ‘Held to Maturity’ securities are carried at their acquisition cost or at amortised cost, if acquired at apremium over the face value. A provision is made for other than temporary diminution.
c) ‘Available for Sale’ and ‘Held for Trading’ securities are valued periodically as per Reserve Bank ofIndia guidelines. The market/fair value for the purpose of periodical valuation of quoted investmentsincluded in the “Available for Sale” and “Held for Trading” categories is the market price of the scrip asavailable from the trades/quotes on the stock exchanges, SGL account transactions, price list of ReserveBank of India or prices declared by Primary Dealers Association of India jointly with Fixed Income MoneyMarket and Derivatives Association (“FIMMDA”), periodically.
The market/fair value of unquoted SLR securities included in the ‘Available for Sale’ and ‘Held forTrading’ categories is as per the rates published by FIMMDA.
The valuation of non-SLR securities, other than those quoted on the stock exchanges, wherever linkedto the Yield-to-Maturity (“YTM”) rates, is with a mark-up (reflecting associated credit risk) over the YTMrates for government securities published by FIMMDA.
Unquoted equity shares are valued at the book value, if the latest balance sheet is available or at Re. 1.
F-112

Securities are valued scrip-wise and depreciation/appreciation aggregated for each category. Netappreciation in each basket if any, being unrealised, is ignored, while net depreciation is provided for.
d) Costs such as brokerage, commission etc., pertaining to investments, paid at the time of acquisition,are charged to revenue.
e) Broken period interest on debt instruments is treated as a revenue item.
f) Investments in subsidiaries/joint ventures are categorised as Held to Maturity in accordance withReserve Bank of India guidelines.
g) Profit on sale of investments in the ‘Held to Maturity’ category is credited to the revenue accountand is thereafter appropriated (net of applicable taxes and statutory reserve requirements) to CapitalReserve.
h) At the end of each reporting period, security receipts issued by asset reconstruction company arevalued in accordance with the guidelines applicable to non-SLR instruments prescribed by Reserve Bank ofIndia from time to time. Accordingly, in case where the security receipts issued by the asset reconstructioncompany are limited to the actual realisation of the financial assets assigned to the instruments in theconcerned scheme, the Bank reckons the Net Asset Value (“NAV”), obtained from asset reconstructioncompany from time to time, for valuation of such investments at each reporting year end.
3. Provisions/Write-offs on loans and other credit facilities
a) All credit exposures are classified as per Reserve Bank of India guidelines, into performing andnon-performing assets (“NPAs”). Further, NPAs are classified into sub-standard, doubtful and loss assets basedon the criteria stipulated by Reserve Bank of India. Provisions are made on substandard and doubtful assets atrates prescribed by Reserve Bank of India. Loss assets and unsecured portion of doubtful assets are provided/written off as per the extant Reserve Bank of India guidelines. Additional provisions are made against specificnon-performing assets over and above what is stated above, if in the opinion of the management, increasedprovisions are necessary.
In accordance with Reserve Bank of India guidelines on graded higher provisioning norms for the securedportion of doubtful assets, the Bank makes a 100% provision on the secured portion of assets classified asdoubtful for more than three years. Further, as permitted by the said guidelines, assets classified as doubtful formore than three years at March 31, 2004 are fully provided for in a graded manner over three years (i.e. 60% byMarch 31, 2005, 75% by March 31, 2006 and 100% by March 31, 2007).
b) For restructured/rescheduled assets, provision is made in accordance with the guidelines issued byReserve Bank of India, which requires the present value of the interest sacrifice be provided at the time ofrestructuring.
c) In the case of other than restructured loan accounts classified as NPAs, the account is reclassified as“standard” account if arrears of interest and principal are fully paid by the borrower.
In respect of non-performing loan accounts subjected to restructuring, asset category is upgraded to standardif the borrower demonstrates, over a minimum period of one year, the ability to repay the loan in accordance withthe contractual terms.
d) The Bank has incorporated the assets taken over from erstwhile ICICI Limited (“ICICI”) in its books atcarrying values as appearing in the books of ICICI with a provision made based on a fair valuation exercisecarried out by an independent firm. To the extent provisions are required in respect of the assets taken over fromICICI, the provision created on fair valuation of the assets at the time of the amalgamation is used.
F-113

e) Amounts recovered against other debts written off in earlier years and provisions no longer considerednecessary in the context of the current status of the borrower are recognised in the profit and loss account.
f) In addition to the specific provision on NPAs, the Bank maintains a general provision on performingloans. The general provision adequately covers the requirements of the Reserve Bank of India guidelines.
g) In addition to the provisions required to be held according to the asset classification status, provisions areheld for individual country exposure (other than for home country). The countries are categorised into seven riskcategories namely insignificant, low, moderate, high, very high, restricted and off-credit and provisioning madeon exposures exceeding 90 days on a graded scale ranging from 0.25% to 100%. For exposures with contractualmaturity of less than 90 days, 25% of the normal provision requirement is held. If the country exposure (net) ofthe Bank in respect of each country does not exceed 1% of the total funded assets, no provision is maintained onsuch country exposure.
4. Transfer and servicing of financial assets
The Bank transfers commercial and consumer loans through securitization transactions. The transferredloans are de-recognised and gains/losses are recorded only if the Bank surrenders the rights to benefits specifiedin the loan contract. Recourse and servicing obligations are reduced from proceeds of the sale. Retainedbeneficial interests in the loans is measured by allocating the carrying value of the loans between the assets soldand the retained interest, based on the relative fair value at the date of the securitization.
5. Fixed assets and depreciation
a) Premises and other fixed assets are carried at cost less accumulated depreciation. Depreciation is chargedover the estimated useful life of a fixed asset on a “straight line” basis. The rates of depreciation for fixed assets,which are not lower than the rates prescribed in schedule XIV of the Companies Act, 1956, are as follows:
Asset Depreciation Rate
Premises owned by the Bank . . . . . . . . . . . . . . . . . . . . . 1.63%Improvements to leasehold premises . . . . . . . . . . . . . . . 1.63% or over the lease period, whichever is higherATMs . . . . . . . . . . . . . . . . . . . . . . . . . . . . . . . . . . . . . . . 12.50%Plant and machinery like air conditioners, xerox
machines, etc. . . . . . . . . . . . . . . . . . . . . . . . . . . . . . . . 10%Furniture and fixtures . . . . . . . . . . . . . . . . . . . . . . . . . . . 15%Motor vehicles . . . . . . . . . . . . . . . . . . . . . . . . . . . . . . . . 20%Computers . . . . . . . . . . . . . . . . . . . . . . . . . . . . . . . . . . . 33.33%EDC Terminals . . . . . . . . . . . . . . . . . . . . . . . . . . . . . . . 16.67%Others (including software and system development
expenses) . . . . . . . . . . . . . . . . . . . . . . . . . . . . . . . . . . 25%
b) Depreciation on leased assets is made on a straight-line basis at the higher of the rates determined withreference to the primary period of lease and the rates specified in Schedule XIV to the Companies Act, 1956.
c) Assets purchased/sold during the year are depreciated on the basis of actual number of days the asset hasbeen put to use.
d) Items costing less than Rs. 5,000/- are depreciated fully over a period of 12 months from the date ofpurchase.
F-114

6. Foreign currency transactions
a) Foreign currency income and expenditure items of domestic operations are translated at the exchangerates prevailing on the date of the transaction, income and expenditure items of integral foreign operations(representative offices) are translated at weekly average closing rate, and income and expenditure of non integralforeign operations (foreign branches and off-shore banking units) are translated at quarterly average closing rate.
b) Monetary foreign currency assets and liabilities of domestic and integral foreign operations are translatedat closing exchange rates notified by Foreign Exchange Dealers’ Association of India (“FEDAI”) at the balancesheet date and the resulting profits/losses are included in the profit and loss account.
c) Both monetary and non-monetary foreign currency assets and liabilities of non integral foreign operationsare translated at closing exchange rates notified by FEDAI at the balance sheet date and the resulting profits/losses exchange differences are accumulated in the foreign currency translation reserve until the disposal of thenet investment in the non integral foreign operations
d) Outstanding forward exchange contracts are stated at contracted rates and are revalued at the exchangerates notified by FEDAI for specified maturities and at interpolated rates for contracts of in-between maturities.The resultant gains or losses are recognised in the profit and loss account.
e) Contingent liabilities on account of guarantees, endorsements and other obligations are stated at theexchange rates notified by FEDAI at the balance sheet date.
7. Accounting for derivative contracts
The Bank enters into derivative contracts such as foreign currency options, interest rate and currency swapsand cross currency interest rate swaps to hedge on-balance sheet/off-balance sheet assets and liabilities or fortrading purposes.
The swap contracts entered to hedge on-balance sheet assets and liabilities are structured in such a way thatthey bear an opposite and offsetting impact with the underlying on-balance sheet items. The impact of suchderivative instruments is correlated with the movement of underlying assets and accounted pursuant to theprinciples of hedge accounting.
Foreign currency and rupee derivatives, which are entered for trading purposes, are marked to market andthe resulting gain/loss, (net of provisions, if any) is recorded in the profit and loss account.
8. Employee Stock Option Scheme (“ESOS”)
The Bank has formulated an Employees Stock Option Scheme. The Scheme provides that employees aregranted an option to acquire equity shares of the Bank that vests in graded manner. The options may be exercisedwithin a specified period. The Bank follows the intrinsic value method for computing the compensation cost, ifany, for all options granted.
9. Staff retirement benefits
For employees covered under group gratuity scheme of Life Insurance Corporation of India (“LIC”)/ICICIPrudential Life Insurance Company Limited (“ICICI Prulife”), gratuity charge to profit and loss account is on thebasis of premium charged. For employees covered under group superannuation scheme of LIC, thesuperannuation charged to profit and loss account is on the basis of premium charged by LIC. Provision forgratuity for other employees and leave encashment liability are determined as per actuarial valuation at year-end.Defined contributions for provident fund are charged to the profit and loss account based on contributions madein terms of the scheme.
F-115

The Bank provides for pension, a deferred retirement plan, covering certain employees. The plan providesfor a pension payment on a monthly basis to these employees on their retirement based on the respectiveemployee’s salary and years of employment with the Bank. Employees covered by the pension plan are noteligible for benefits under the provident fund plan, a defined contribution plan. The pension plan is fundedthrough periodic contributions to a fund set-up by the Bank and administered by a Board of Trustees. Suchcontributions are actuarially determined.
10. Income taxes
Income tax expense is the aggregate amount of current tax and deferred tax charge. Current year taxes aredetermined in accordance with the Income Tax Act, 1961. Deferred tax adjustments comprise of changes in thedeferred tax assets or liabilities during the period.
Deferred tax assets and liabilities are recognised for the future tax consequences of timing differencesarising between the carrying values of assets and liabilities and their respective tax basis and operating carryforward losses. Deferred tax assets are recognised only after giving due consideration to prudence. Deferred taxassets and liabilities are measured using tax rates and tax laws that have been enacted or substantially enacted bythe balance sheet date. The impact on account of changes in the deferred tax assets and liabilities is alsorecognised in the profit and loss account.
Deferred tax assets are recognised and reassessed at each reporting date, based upon management’sjudgment as to whether realisation is considered reasonably certain. Deferred tax assets are recognised on carryforward of unabsorbed depreciation and tax losses only if there is virtual certainty that such deferred tax asset canbe realised against future profits.
11. Impairment of assets
Long-lived assets and certain intangible assets are reviewed for impairment whenever events or changes incircumstances indicate that the carrying amount of an asset may not be recoverable. Recoverability of assets to beheld and used is measured by a comparison of the carrying amount of an asset to future net discounted cash flowsexpected to be generated by the asset. If such assets are considered to be impaired, the impairment to berecognized is measured by the amount by which the carrying amount of the assets exceeds the fair value of theassets.
As on March 31, 2005 there were no events or changes in circumstances which indicate any impairment inthe carrying value of the assets covered by AS 28.
12. Accounting for contingencies
The Bank estimates the probability of any loss that might be incurred on outcome of contingencies on thebasis of information available up to the date on which the financial statements are prepared. A provision isrecognized when an enterprise has a present obligation as a result of past event and it is probable that an outflowof resources will be required to settle the obligation, in respect of which a reliable estimate can be made.Provisions are determined based on management estimate required to settle the obligation at the balance sheetdate, supplemented by experience of similar transactions. These are reviewed at each balance sheet date andadjusted to reflect the current management estimates. In cases where the available information indicates that theloss on the contingency is reasonably possible but the amount of loss cannot be reasonably estimated, adisclosure is made in the financial statements. In case of remote possibility neither provision nor disclosure ismade in the financials.
13. Earnings per share
Basic and diluted earnings per share are calculated by dividing the net profit or loss for the periodattributable to equity shareholders by the weighted average number of equity shares outstanding during the
F-116

period. Diluted earnings per equity share has been computed using the weighted average number of equity sharesand dilutive potential equity shares outstanding during the period, except where the results are anti-dilutive.
14. Cash and cash equivalents
Cash and cash equivalents include cash in hand, balances with Reserve Bank of India, balances with otherbanks and money at call and short notice.
B. NOTES FORMING PART OF THE ACCOUNTS
1. Information about business and geographical segments
a) The Bank reports its operations under the following business segments:
• Consumer and Commercial Banking comprising the retail and corporate banking operations of theBank.
• Investment Banking comprising the treasury of the Bank.
Inter-segment transactions are generally based on transfer pricing measures as determined by management.Income, expenses, assets and liabilities are either specifically identified with individual segments or are allocatedto segments on a systematic basis.
Based on such allocations, segmental balance sheet as on March 31, 2005 and March 31, 2004 andsegmental profit & loss account for the year ended March 31, 2005 and for the year ended March 31, 2004 havebeen prepared.
Consumer andcommercial banking Investment banking Total
Particulars
For theyear ended31.03.2005
For theyear ended31.03.2004
For theyear ended31.03.2005
For theyear ended31.03.2004
For theyear ended31.03.2005
For theyear ended31.03.2004
Rupees inmillion
Rupees inmillion
Rupees inmillion
Rupees inmillion
Rupees inmillion
Rupees inmillion
Revenue . . . . . . . . . . . . . . . . . . . 106,436.9 95,819.3 30,926.2 35,902.8 137,363.1 131,722.1Less: Inter segment revenue . . . . — — — — (9,102.7) (11,049.0)Total revenue (1)-(2) . . . . . . . . . — — — — 128,260.4 120,673.1Operating profit (i.e. Profit
before unallocated expenses,and tax) . . . . . . . . . . . . . . . . . . 19,760.7 12,984.2 10,183.3 12,080.1 29,944.0 25,064.3
Unallocated expenses . . . . . . . . . — — — — 384.0 256.0Provisions (net) . . . . . . . . . . . . . 814.1 5,542.8 3,473.9 243.4 4,288.0 5,786.2Profit before tax . . . . . . . . . . . . . 18,946.6 7,441.4 6,709.4 11,836.7 25,272.0 19,022.1Income tax expenses (net)/
(net of deferred tax credit) . . . — — — — 5,220.0 2,651.1Net profit (7)-(8) . . . . . . . . . . . . . — — — — 20,052.0 16,371.0Segment assets . . . . . . . . . . . . . . 1,051,486.3 771,726.4 597,045.1 454,527.0 1,648,531.4 1,226,253.4Unallocated assets . . . . . . . . . . . — — — — 28,062.7 26,035.3Total assets (10)+(11) . . . . . . . . . — — — — 1,676,594.1 1,252,288.7Segment liabilities . . . . . . . . . . . 1,291,932.4 978,706.4 384,661.7 273,582.3 1,676,594.1 1,252,288.7Unallocated liabilities . . . . . . . . . — — — — — —Total liabilities (13)+(14) . . . . . . — — — — 1,676,594.1 1,252,288.7
The business operations of the Bank are largely concentrated in India. The assets and income from foreignoperations are not significant to the overall operations of the Bank and have accordingly not been disclosed.
F-117

2. Preference shares
Certain government securities amounting to Rs. 1,952.3 million (March 31, 2004: Rs. 1,455.1 million) havebeen earmarked against redemption of preference share capital, which falls due for redemption on April 20, 2018,as per the original issue terms.
3. Subordinated debt
Subordinated debt includes index bonds amounting to Rs. 117.1 million (March 31, 2004: Rs. 105.1 million)which carry a detachable warrant entitling bondholders to a right to receive an amount linked to the BSESensitive Index (“Sensex”) per terms of the issue. During the year the Bank has raised subordinate debtamounting to Rs. 4,500.0 million under private placement bonds issued on February 28, 2005. Details of thesame are as follows:
Particulars Coupon Rate (%) Tenure Amount
Rupees in millions
Option I . . . . . . . . . . . . . . . . . . 1 Yr INBMK + 60 bps(To be reset six monthly) 5 years and 3 months 2,650.0
Option II . . . . . . . . . . . . . . . . . . 7.00 5 years and 3 months 350.0Option III . . . . . . . . . . . . . . . . . 7.10 7 years and 3 months 550.0Option IV . . . . . . . . . . . . . . . . . 7.20 10 years and 3 months 950.0
Total . . . . . . . . . . . . . . . . . . . . . 4,500.0
4. Employee Stock Option Scheme (“ESOS”)
In terms of the ESOS, as amended, the maximum number of options granted to any eligible employee in afinancial year shall not exceed 0.05% of the issued equity shares of the Bank at the time of grant of the optionsand aggregate of all such options granted to the eligible employees shall not exceed 5% of the aggregate numberof the issued equity shares of the Bank on the date (s) of the grant of options.
In terms of the Scheme, 18,215,335 options (March 31, 2004: 15,964,982 options) granted to eligibleemployees were outstanding at March 31, 2005.
A summary of the status of the Bank’s option plan is given below:
Year endedMarch 31,
2005
Year endedMarch 31,
2004
Option sharesoutstanding
Option sharesoutstanding
Outstanding at the beginning of the year . . . . . . . . . . . . . . . . . . . . . . . . . . . . . . . . . . . 15,964,982 12,610,275Add: Granted during the year . . . . . . . . . . . . . . . . . . . . . . . . . . . . . . . . . . . . . . . . . . . . 7,554,500 7,491,800Less : Forfeited/lapsed during the year . . . . . . . . . . . . . . . . . . . . . . . . . . . . . . . . . . . . . 846,496 766,489Exercised during the year . . . . . . . . . . . . . . . . . . . . . . . . . . . . . . . . . . . . . . . . . . . . . . . 4,457,651 3,370,604Outstanding at the end of the year* . . . . . . . . . . . . . . . . . . . . . . . . . . . . . . . . . . . . . . . 18,215,335 15,964,982
* Excludes options exercised but not allowed
5. Early Retirement Option (“ERO”)
The Bank had implemented an Early Retirement Option Scheme 2003 for its employees in July 2003. Allemployees who had completed 40 years of age and seven years of service with the Bank (including period ofservice with entities amalgamated with the Bank) were eligible for the ERO.
F-118

The ex-gratia payments under ERO and termination benefits and leave encashment in excess of theprovision made (net of tax benefits), aggregating to Rs. 1,910.0 million (March 31, 2004: Rs. 1,910.0 million) arebeing amortised over a period of five years commencing August 1, 2003 (the date of retirement of employeesexercising the Option being July 31, 2003).
On account of the above ERO scheme, an amount of Rs. 384.0 million (March 31, 2004: Rs. 256.0 million)has been charged to revenue being the proportionate amount amortised for the year ended March 31, 2005.
6. Deferred Tax
On March 31, 2005, the Bank has recorded net deferred tax asset of Rs. 148.7 million (March 31, 2004:Rs. 4,429.7 million) which has been included in Other Assets. The break-up of deferred tax assets and liabilitiesinto major items is given below:
Particulars
Year endedMarch 31,
2005
Year endedMarch 31,
2004
Rupees in million
Deferred tax assetProvision for bad and doubtful debts . . . . . . . . . . . . . . . . . . . . . . . . . . . . . . . . . . . . . . . . . . 6,990.8 13,434.1Others . . . . . . . . . . . . . . . . . . . . . . . . . . . . . . . . . . . . . . . . . . . . . . . . . . . . . . . . . . . . . . . . . . 917.2 202.4
7,908.0 13,636.5Less: Deferred tax liabilityDepreciation on fixed assets . . . . . . . . . . . . . . . . . . . . . . . . . . . . . . . . . . . . . . . . . . . . . . . . 7,537.7 8,970.6Others . . . . . . . . . . . . . . . . . . . . . . . . . . . . . . . . . . . . . . . . . . . . . . . . . . . . . . . . . . . . . . . . . . 221.6 236.2
7,759.3 9,206.8Net Deferred Tax Asset/(Liability) . . . . . . . . . . . . . . . . . . . . . . . . . . . . . . . . . . . . . . . . . . . 148.7 4,429.7
7. Related party transactions
The Bank has transactions with its related parties comprising subsidiaries (including joint ventures),associates (including joint ventures) and key management personnel. The following represents the significanttransactions between the Bank and such related parties:
Insurance services
During the year ended March 31, 2005, the Bank paid insurance premium to insurance joint venturesamounting to Rs. 315.4 million (March 31, 2004: Rs. 157.2 million). During the year ended March 31, 2005 theBank received claims from insurance subsidiaries amounting to Rs. 8.4 million (March 31, 2004: Rs. 85.6million).
Fees
During the year ended March 31, 2005, the Bank received fees from its insurance joint ventures amountingto Rs. 279.8 million (March 31, 2004: Rs. 65.3 million) and commission of Rs. 5.3 million on account ofguarantees and LCs issued for subsidiaries (March 31, 2004: Rs. 1.0 million).
Lease of premises and facilities
During the year ended March 31, 2005, the Bank charged an aggregate amount of Rs. 432.8 million(March 31, 2004: Rs. 361.9 million) for lease of premises, facilities and other administrative costs to subsidiariesand joint ventures.
F-119

Sale of housing loan portfolio
During the year ended March 31, 2005, the Bank sold housing loan portfolio to its subsidiary amounting toRs. 3,059.7 million (March 31, 2004: Rs. 18,317.2 million).
Secondment of employees
During the year ended March 31, 2005, the Bank received Rs. 8.4 million (March 31, 2004: Rs. 14.2million) from subsidiaries and joint ventures for secondment of employees.
Purchase of investments
During the year ended March 31, 2005, the Bank purchased certain investments from its subsidiaries andjoint ventures amounting to Rs. 32,440.1 million (March 31, 2004: Rs. 49,814.2 million) and from its associateamounting to Rs. 820.0 million (March 31, 2004: Rs. 9,629.6 million).
Sale of investments
During the year ended March 31, 2005, the Bank sold certain investments to its subsidiaries and jointventures amounting to Rs. 22,668.5 million (March 31, 2004: Rs. 3,234.1 million). On the sales made tosubsidiaries and joint ventures, the Bank accounted for a loss of Rs. 12.4 million (March 31, 2004: Gain ofRs. 199.2 million).
Redemption/Buyback and Conversion of investments
During the year ended March 31, 2005, certain investments in subsidiaries and joint ventures in preferenceshares were converted to equity shares amounting to Rs. 250.0 million (March 31, 2004: Rs. Nil). Considerationof Rs. 106.9 million (March 31, 2004: Rs. 197.2 million) was received on account of buyback of equity shares bya subsidiary and a gain amounting to Rs. 67.4 million (March 31, 2004: Rs. 9.8 million) was accounted in thebooks. Equity units in associates amounting to Rs. 2,362.8 million (March 31, 2004: Rs. 350.0 million) wereredeemed during the year and a gain of Rs. 19.8 million (March 31, 2004: Rs. Nil) was accounted on redemption.
Reimbursement of expenses
During the year ended March 31, 2005, the Bank reimbursed expenses to its subsidiaries amounting toRs. 2,596.0 million (March 31, 2004: Rs. 2,075.7 million).
Brokerage paid
During the year ended March 31, 2005, the Bank paid brokerage to its subsidiary amounting toRs. 9.1 million (March 31, 2004: Rs. 5.7 million).
Custodial charges received
During the year ended March 31, 2005, the Bank received custodial charges from its subsidiaries and jointventures amounting to Rs. 5.7 million and associates amounting to Rs. 2.2 million (March 31, 2004: Rs. 4.7million).
Interest paid
During the year ended March 31, 2005, the Bank paid interest to its subsidiaries and joint venturesamounting to Rs. 255.7 million (March 31, 2004: Rs. 67.9 million) and to its associates amounting toRs. 1.1 million (March 31, 2004: Rs. 9.5 million).
F-120
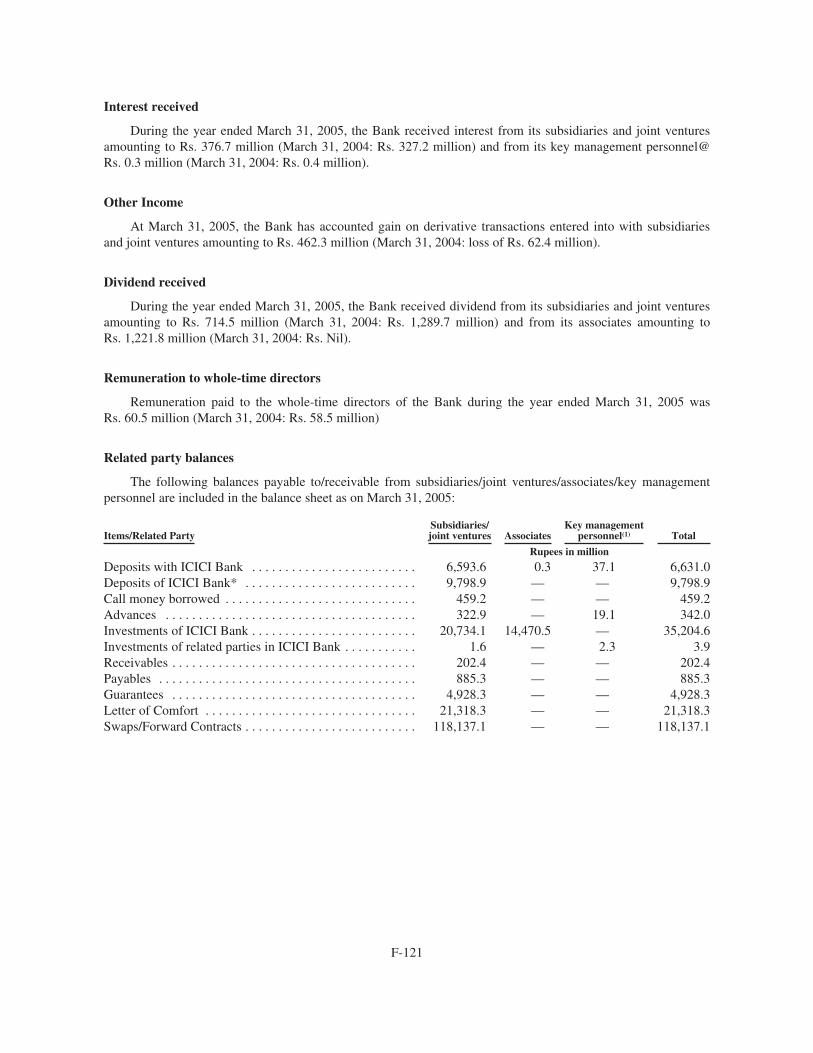
Interest received
During the year ended March 31, 2005, the Bank received interest from its subsidiaries and joint venturesamounting to Rs. 376.7 million (March 31, 2004: Rs. 327.2 million) and from its key management personnel@Rs. 0.3 million (March 31, 2004: Rs. 0.4 million).
Other Income
At March 31, 2005, the Bank has accounted gain on derivative transactions entered into with subsidiariesand joint ventures amounting to Rs. 462.3 million (March 31, 2004: loss of Rs. 62.4 million).
Dividend received
During the year ended March 31, 2005, the Bank received dividend from its subsidiaries and joint venturesamounting to Rs. 714.5 million (March 31, 2004: Rs. 1,289.7 million) and from its associates amounting toRs. 1,221.8 million (March 31, 2004: Rs. Nil).
Remuneration to whole-time directors
Remuneration paid to the whole-time directors of the Bank during the year ended March 31, 2005 wasRs. 60.5 million (March 31, 2004: Rs. 58.5 million)
Related party balances
The following balances payable to/receivable from subsidiaries/joint ventures/associates/key managementpersonnel are included in the balance sheet as on March 31, 2005:
Items/Related PartySubsidiaries/joint ventures Associates
Key managementpersonnel(1) Total
Rupees in million
Deposits with ICICI Bank . . . . . . . . . . . . . . . . . . . . . . . . . 6,593.6 0.3 37.1 6,631.0Deposits of ICICI Bank* . . . . . . . . . . . . . . . . . . . . . . . . . . 9,798.9 — — 9,798.9Call money borrowed . . . . . . . . . . . . . . . . . . . . . . . . . . . . . 459.2 — — 459.2Advances . . . . . . . . . . . . . . . . . . . . . . . . . . . . . . . . . . . . . . 322.9 — 19.1 342.0Investments of ICICI Bank . . . . . . . . . . . . . . . . . . . . . . . . . 20,734.1 14,470.5 — 35,204.6Investments of related parties in ICICI Bank . . . . . . . . . . . 1.6 — 2.3 3.9Receivables . . . . . . . . . . . . . . . . . . . . . . . . . . . . . . . . . . . . . 202.4 — — 202.4Payables . . . . . . . . . . . . . . . . . . . . . . . . . . . . . . . . . . . . . . . 885.3 — — 885.3Guarantees . . . . . . . . . . . . . . . . . . . . . . . . . . . . . . . . . . . . . 4,928.3 — — 4,928.3Letter of Comfort . . . . . . . . . . . . . . . . . . . . . . . . . . . . . . . . 21,318.3 — — 21,318.3Swaps/Forward Contracts . . . . . . . . . . . . . . . . . . . . . . . . . . 118,137.1 — — 118,137.1
F-121

The following balances represent the maximum balance payable to/receivable from subsidiaries/jointventures/ associates/key management personnel during the year ended March 31, 2005:
Items/Related PartySubsidiaries/joint ventures Associates
Key managementpersonnel(1) Total
Rupees in millionDeposits with ICICI Bank . . . . . . . . . . . . . . . . . . . . . . . . . 19,352.2 2,405.5 196.1 21,953.8Deposits of ICICI Bank* . . . . . . . . . . . . . . . . . . . . . . . . . . 9,798.9 — — 9,798.9Call money borrowed . . . . . . . . . . . . . . . . . . . . . . . . . . . . . 3,500.0 — — 3,500.0Advances . . . . . . . . . . . . . . . . . . . . . . . . . . . . . . . . . . . . . . 2,435.6 — 19.1 2,454.7Investments of ICICI Bank . . . . . . . . . . . . . . . . . . . . . . . . . 40,204.6 33,399.0 — 73,603.6Investments of related parties in ICICI Bank . . . . . . . . . . . 16.6 — 2.3 18.9Receivables . . . . . . . . . . . . . . . . . . . . . . . . . . . . . . . . . . . . . 202.4 — — 202.4Payables . . . . . . . . . . . . . . . . . . . . . . . . . . . . . . . . . . . . . . . 1,762.1 — — 1,762.1Guarantees . . . . . . . . . . . . . . . . . . . . . . . . . . . . . . . . . . . . . 4,928.3 — — 4,928.3Letter of Comfort . . . . . . . . . . . . . . . . . . . . . . . . . . . . . . . . 21,318.3 — — 21,318.3Swaps/Forward Contracts . . . . . . . . . . . . . . . . . . . . . . . . . . 230,905.2 — — 230,905.2
The following balances payable to/receivable from subsidiaries/joint ventures/associates/key managementpersonnel are included in the balance sheet as on March 31, 2004:
Items/Related PartySubsidiaries/joint ventures Associates
Key managementpersonnel(1) Total
Rupees in millionDeposits with ICICI Bank . . . . . . . . . . . . . . . . . . . . . . . . . 2,021.2 37.3 23.1 2,081.6Deposits of ICICI Bank* . . . . . . . . . . . . . . . . . . . . . . . . . . 131.2 — — 131.2Call money borrowed . . . . . . . . . . . . . . . . . . . . . . . . . . . . . — — — —Advances . . . . . . . . . . . . . . . . . . . . . . . . . . . . . . . . . . . . . . 2,426.0 — 10.2 2,436.2Investments of ICICI Bank . . . . . . . . . . . . . . . . . . . . . . . . . 14,303.6 15,942.5 — 30,246.1Investments of related parties in ICICI Bank . . . . . . . . . . . 15.0 — 2.0 17.0Receivables . . . . . . . . . . . . . . . . . . . . . . . . . . . . . . . . . . . . . 315.1 808.0 — 1,123.1Payables . . . . . . . . . . . . . . . . . . . . . . . . . . . . . . . . . . . . . . . 739.4 0.5 — 739.9Guarantees . . . . . . . . . . . . . . . . . . . . . . . . . . . . . . . . . . . . . 100.0 — — 100.0Letter of Comfort . . . . . . . . . . . . . . . . . . . . . . . . . . . . . . . . 10,291.7 — — 10,291.7Swaps/Forward Contracts . . . . . . . . . . . . . . . . . . . . . . . . . . 155,481.0 — — 155,481.0
The following balances represent the maximum balance payable to/receivable from subsidiaries/jointventures/ associates/key management personnel during the year ended March 31, 2004:
Items/Related PartySubsidiaries/joint ventures Associates
Key managementpersonnel(1) Total
Rupees in millionDeposits with ICICI Bank . . . . . . . . . . . . . . . . . . . . . . . . . 11,897.6 450.1 94.0 12,441.7Deposits of ICICI Bank* . . . . . . . . . . . . . . . . . . . . . . . . . . 2,500.0 — — 2,500.0Call money borrowed . . . . . . . . . . . . . . . . . . . . . . . . . . . . . 5,974.9 — — 5,974.9Advances . . . . . . . . . . . . . . . . . . . . . . . . . . . . . . . . . . . . . . 3,614.7 — 14.8 3,629.5Investments of ICICI Bank . . . . . . . . . . . . . . . . . . . . . . . . . 20,712.5 30,342.1 — 51,054.6Investments of related parties in ICICI Bank . . . . . . . . . . . 50.0 — 2.0 52.0Receivables . . . . . . . . . . . . . . . . . . . . . . . . . . . . . . . . . . . . . 2,062.6 808.0 — 2,870.6Payables . . . . . . . . . . . . . . . . . . . . . . . . . . . . . . . . . . . . . . . 1,061.3 0.5 — 1,061.8Guarantees . . . . . . . . . . . . . . . . . . . . . . . . . . . . . . . . . . . . . 100.0 — — 100.0Letter of Comfort . . . . . . . . . . . . . . . . . . . . . . . . . . . . . . . . 11,341.7 — — 11,341.7Swaps/Forward Contracts . . . . . . . . . . . . . . . . . . . . . . . . . . 165,731.5 — — 165,731.5
(1) wholetime directors and relatives* includes call money lent
F-122

Subsidiaries and joint ventures
ICICI Venture Funds Management Company Limited, ICICI Securities Limited, ICICI Brokerage ServicesLimited, ICICI International Limited, ICICI Trusteeship Services Limited, ICICI Home Finance CompanyLimited, ICICI Investment Management Company Limited, ICICI Securities Holdings Inc., ICICI Securities Inc.,ICICI Bank UK Limited, ICICI Bank Canada, ICICI Prudential Life Insurance Company Limited, ICICIDistribution Finance Private Limited, ICICI Lombard General Insurance Company Limited, Prudential ICICIAsset Management Company Limited and Prudential ICICI Trust Limited.
Associates
ICICI Equity Fund, ICICI Eco-net Internet and Technology Fund, ICICI Emerging Sectors Fund, ICICIStrategic Investments Fund, ICICI Property Trust and TCW/ICICI Investment Partners L.L.C.
8. Earnings Per Share (“EPS”)
The Bank reports basic and diluted earnings per equity share in accordance with Accounting Standard 20,“Earnings per Share”. Basic earnings per share is computed by dividing net profit after tax by the weightedaverage number of equity shares outstanding during the year. Diluted earnings per share is computed using theweighted average number of equity shares and dilutive potential equity shares outstanding during the year.
The computation of earnings per share is given below:
March 31,2005
March 31,2004
Rupees in millionexcept per share data
Basic (annualized)Weighted average no. of equity shares outstanding . . . . . . . . . . . . . . . . . . . . . . . . . . 727,728,042 614,157,868Net profit . . . . . . . . . . . . . . . . . . . . . . . . . . . . . . . . . . . . . . . . . . . . . . . . . . . . . . . . . . . 20,052.0 16,371.0Basic earnings per share (Rs.) . . . . . . . . . . . . . . . . . . . . . . . . . . . . . . . . . . . . . . . . . . . 27.55 26.66Diluted (annualized)Weighted average no. of equity shares outstanding . . . . . . . . . . . . . . . . . . . . . . . . . . 733,720,485 619,201,380Net profit . . . . . . . . . . . . . . . . . . . . . . . . . . . . . . . . . . . . . . . . . . . . . . . . . . . . . . . . . . . 20,052.0 16,371.0Diluted earnings per share (Rs.) . . . . . . . . . . . . . . . . . . . . . . . . . . . . . . . . . . . . . . . . . 27.33 26.44Nominal value per share (Rs.) . . . . . . . . . . . . . . . . . . . . . . . . . . . . . . . . . . . . . . . . . . . 10.00 10.00
The dilutive impact is mainly due to options issued to employees by the Bank.
9. Assets under lease
9.1 Assets under operating lease
The future lease rentals are given below:
PeriodMarch 31,
2005March 31,
2004
Rupees in million
Not later than one year . . . . . . . . . . . . . . . . . . . . . . . . . . . . . . . . . . . . . . . . . . . . 234.4 229.6Later than one year and not later than five years . . . . . . . . . . . . . . . . . . . . . . . . 999.5 974.9Later than five years . . . . . . . . . . . . . . . . . . . . . . . . . . . . . . . . . . . . . . . . . . . . . . 311.2 571.0
Total . . . . . . . . . . . . . . . . . . . . . . . . . . . . . . . . . . . . . . . . . . . . . . . . . . . . . . 1,545.1 1,775.5
F-123

9.2 Assets under finance lease
The future lease rentals are given below:
PeriodMarch 31,
2005March 31,
2004
Rupees in million
Total of future minimum lease payments . . . . . . . . . . . . . . . . . . . . . . . . . . . . . . 1,105.5 1,792.9Present value of lease payments . . . . . . . . . . . . . . . . . . . . . . . . . . . . . . . . . . . . . 913.6 1,417.8Unmatured finance charges . . . . . . . . . . . . . . . . . . . . . . . . . . . . . . . . . . . . . . . . . 191.9 375.1Maturity profile of total of future minimum lease payments
Not later than one year . . . . . . . . . . . . . . . . . . . . . . . . . . . . . . . . . . . . . . . . 293.3 397.0Later than one year and not later than five years . . . . . . . . . . . . . . . . . . . . 804.5 1,255.6Later than five years . . . . . . . . . . . . . . . . . . . . . . . . . . . . . . . . . . . . . . . . . . 7.7 140.3
Total . . . . . . . . . . . . . . . . . . . . . . . . . . . . . . . . . . . . . . . . . . . . . . . . . . 1,105.5 1,792.9
Maturity profile of present value of lease payments
PeriodMarch 31,
2005March 31,
2004
Rupees in million
Not later than one year . . . . . . . . . . . . . . . . . . . . . . . . . . . . . . . . . . . . . . . . . . . . 222.8 276.5Later than one year and not later than five years . . . . . . . . . . . . . . . . . . . . . . . . 683.3 1,008.7Later than five years . . . . . . . . . . . . . . . . . . . . . . . . . . . . . . . . . . . . . . . . . . . . . . 7.5 132.6
Total . . . . . . . . . . . . . . . . . . . . . . . . . . . . . . . . . . . . . . . . . . . . . . . . . . . . . . . . . . 913.6 1,417.8
10. Additional disclosures
The following additional disclosures have been made taking into account Reserve Bank of India guidelinesin this regard.
10.1 Capital adequacy ratio
The capital to risk weighted assets ratio (CRAR) as assessed by the Bank on the basis of the attachedfinancial statements and guidelines issued by Reserve Bank of India is given in the table below:
March 31,2005
March 31,2004
Rupees in million
Tier I capital* . . . . . . . . . . . . . . . . . . . . . . . . . . . . . . . . . . . . . . . . . . . . . . . . . . . . . . . . . . 102,463.2 55,250.9Tier II capital . . . . . . . . . . . . . . . . . . . . . . . . . . . . . . . . . . . . . . . . . . . . . . . . . . . . . . . . . . 56,566.1 38,756.9Total capital . . . . . . . . . . . . . . . . . . . . . . . . . . . . . . . . . . . . . . . . . . . . . . . . . . . . . . . . . . . 159,029.3 94,007.8Total risk weighted assets . . . . . . . . . . . . . . . . . . . . . . . . . . . . . . . . . . . . . . . . . . . . . . . . 1,350,168.1 907,340.2Capital ratios (percent)Tier I . . . . . . . . . . . . . . . . . . . . . . . . . . . . . . . . . . . . . . . . . . . . . . . . . . . . . . . . . . . . . . . . . 7.59 % 6.09 %Tier II . . . . . . . . . . . . . . . . . . . . . . . . . . . . . . . . . . . . . . . . . . . . . . . . . . . . . . . . . . . . . . . . 4.19 % 4.27 %Total capital . . . . . . . . . . . . . . . . . . . . . . . . . . . . . . . . . . . . . . . . . . . . . . . . . . . . . . . . . . . 11.78 % 10.36 %
* Tier I Capital includes the preference shares, which are due for redemption in 2018, as reduced by the amountof corpus created in accordance with Reserve Bank of India guidelines
F-124

10.2 Business/information ratios
The business/information ratios for the year ended March 31, 2005 and March 31, 2004 are given in thetable below:
March 31,2005
March 31,2004
Rupees in million(i) Interest income to working funds (percent) . . . . . . . . . . . . . . . . . . . . . . . . . . . . . . . . . . 6.94% 7.83%(ii) Non-interest income to working funds (percent) . . . . . . . . . . . . . . . . . . . . . . . . . . . . . . 2.52% 2.70%(iii) Operating profit to working funds (percent) . . . . . . . . . . . . . . . . . . . . . . . . . . . . . . . . . . 2.18% 2.09%(iv) Return on assets (percent) . . . . . . . . . . . . . . . . . . . . . . . . . . . . . . . . . . . . . . . . . . . . . . . . 1.59% 1.31%(v) Business per employee (average deposits plus average advances) (not annualized for
period end) . . . . . . . . . . . . . . . . . . . . . . . . . . . . . . . . . . . . . . . . . . . . . . . . . . . . . . . . . . . 88.0 101.0(vi) Profit per employee . . . . . . . . . . . . . . . . . . . . . . . . . . . . . . . . . . . . . . . . . . . . . . . . . . . . . 1.1 1.2(vii) Net non-performing advances (funded) to net advances (percent) . . . . . . . . . . . . . . . . . 1.65% 2.21%
For the purpose of computing the above ratios, working funds represent the average of total assets asreported to Reserve Bank of India under section 27 of the Banking Regulation Act, 1949.
10.3 Maturity pattern
a) Rupee denominated assets and liabilities as on March 31, 2005
The maturity pattern of rupee denominated assets and liabilities of the Bank as on March 31, 2005 is givenbelow:
Maturity bucketsLoans &advances
Investmentsecurities Deposits Borrowings
Rupees in million1 to 14 days . . . . . . . . . . . . . . . . . . . . . . . . . . . . . . . . . . . . . . . . . 59,136.0 76,070.3 49,629.2 561.015 to 28 days . . . . . . . . . . . . . . . . . . . . . . . . . . . . . . . . . . . . . . . . 4,554.5 20,350.1 26,173.0 6,798.729 days to 3 months . . . . . . . . . . . . . . . . . . . . . . . . . . . . . . . . . . . 39,053.9 48,422.0 125,531.9 6,848.73 to 6 months . . . . . . . . . . . . . . . . . . . . . . . . . . . . . . . . . . . . . . . . 38,964.9 47,302.7 152,494.5 20,711.16 months to 1 year . . . . . . . . . . . . . . . . . . . . . . . . . . . . . . . . . . . . 71,963.6 59,469.5 187,367.2 35,576.91 to 3 years . . . . . . . . . . . . . . . . . . . . . . . . . . . . . . . . . . . . . . . . . 264,250.1 113,827.6 391,052.9 88,710.73 to 5 years . . . . . . . . . . . . . . . . . . . . . . . . . . . . . . . . . . . . . . . . . 81,015.7 22,237.7 9,783.2 18,552.0Above 5 years . . . . . . . . . . . . . . . . . . . . . . . . . . . . . . . . . . . . . . . 227,896.5 109,861.7 9,268.4 18,230.2
Total . . . . . . . . . . . . . . . . . . . . . . . . . . . . . . . . . . . . . . . . . . . . . . 786,835.2 497,541.6 951,300.3 195,989.3
b) Rupee denominated assets and liabilities as on March 31, 2004
The maturity pattern of rupee denominated assets and liabilities of the Bank as on March 31, 2004 is givenbelow:
Maturity bucketsLoans &advances
Investmentsecurities Deposits Borrowings
Rupees in million1 to 14 days . . . . . . . . . . . . . . . . . . . . . . . . . . . . . . . . . . . . . . . . . 19,489.5 52,498.7 53,572.2 5,689.315 to 28 days . . . . . . . . . . . . . . . . . . . . . . . . . . . . . . . . . . . . . . . . 4,243.7 27,561.2 16,595.3 6,264.229 days to 3 months . . . . . . . . . . . . . . . . . . . . . . . . . . . . . . . . . . . 11,939.4 32,787.9 72,534.5 6,935.93 to 6 months . . . . . . . . . . . . . . . . . . . . . . . . . . . . . . . . . . . . . . . . 19,139.5 32,634.2 85,839.2 19,097.46 months to 1 year . . . . . . . . . . . . . . . . . . . . . . . . . . . . . . . . . . . . 74,568.2 41,563.7 107,581.2 32,956.41 to 3 years . . . . . . . . . . . . . . . . . . . . . . . . . . . . . . . . . . . . . . . . . 170,886.0 117,415.4 294,475.0 102,112.93 to 5 years . . . . . . . . . . . . . . . . . . . . . . . . . . . . . . . . . . . . . . . . . 87,005.4 22,746.1 19,556.9 22,224.5Above 5 years . . . . . . . . . . . . . . . . . . . . . . . . . . . . . . . . . . . . . . . 173,744.3 107,148.0 7,897.7 24,741.6
Total . . . . . . . . . . . . . . . . . . . . . . . . . . . . . . . . . . . . . . . . . . . . . . 561,016.0 434,355.2 658,052.0 220,022.2
F-125

c) Forex denominated assets and liabilities as on March 31, 2005
The maturity pattern of forex denominated assets and liabilities as on March 31, 2005 is given below:
Maturity bucketsLoans &advances
Investmentsecurities Deposits Borrowings
Balances withbanks and
money at calland short
notice
Rupees in million
1 to 14 days . . . . . . . . . . . . . . . . . . . . . . . . . . . . . . . 1,382.3 213.1 4,633.0 3,447.0 20,666.015 to 28 days . . . . . . . . . . . . . . . . . . . . . . . . . . . . . . 3,514.6 53.0 6,510.8 5,512.8 3,040.329 days to 3 months . . . . . . . . . . . . . . . . . . . . . . . . 26,655.8 329.0 7,438.1 24,415.8 4,177.63 to 6 months . . . . . . . . . . . . . . . . . . . . . . . . . . . . . . 11,355.6 — 6,748.4 11,780.3 6,496.16 months to 1 year . . . . . . . . . . . . . . . . . . . . . . . . . . 12,124.6 962.4 8,040.3 21,409.9 743.71 to 3 years . . . . . . . . . . . . . . . . . . . . . . . . . . . . . . . 30,032.0 159.2 7,773.8 22,432.7 —3 to 5 years . . . . . . . . . . . . . . . . . . . . . . . . . . . . . . . 13,508.8 5,380.7 5,304.3 34,771.6 436.8Above 5 years . . . . . . . . . . . . . . . . . . . . . . . . . . . . . 28,642.6 234.5 438.8 15,685.6 —
Total . . . . . . . . . . . . . . . . . . . . . . . . . . . . . . . . . . . . 127,216.3 7,331.9 46,887.5 139,455.7 35,560.5
d) Forex denominated assets and liabilities as on March 31, 2004
The maturity pattern of forex denominated assets and liabilities as on March 31, 2004 is given below:
Maturity bucketsLoans &advances
Balances withbanks and
money at calland short
notice Deposits Borrowings
Rupees in million
1 to 14 days . . . . . . . . . . . . . . . . . . . . . . . . . . . . . . . . . . . . . . . . . . 190.7 11,584.7 1,732.0 1,540.615 to 28 days . . . . . . . . . . . . . . . . . . . . . . . . . . . . . . . . . . . . . . . . . 404.0 1,862.4 543.7 3,668.829 days to 3 months . . . . . . . . . . . . . . . . . . . . . . . . . . . . . . . . . . . 2,091.2 2,535.6 1,623.1 6,664.23 to 6 months . . . . . . . . . . . . . . . . . . . . . . . . . . . . . . . . . . . . . . . . 1,810.0 993.4 3,655.5 8,007.36 months to 1 year . . . . . . . . . . . . . . . . . . . . . . . . . . . . . . . . . . . . 12,969.6 — 5,131.6 11,519.31 to 3 years . . . . . . . . . . . . . . . . . . . . . . . . . . . . . . . . . . . . . . . . . . 15,350.3 — 7,114.4 15,488.43 to 5 years . . . . . . . . . . . . . . . . . . . . . . . . . . . . . . . . . . . . . . . . . . 9,623.9 — 1,663.5 22,985.5Above 5 years . . . . . . . . . . . . . . . . . . . . . . . . . . . . . . . . . . . . . . . . 23,020.6 — 1,570.0 17,506.0
Total . . . . . . . . . . . . . . . . . . . . . . . . . . . . . . . . . . . . . . . . . . . . . . . 65,460.3 16,976.1 23,033.8 87,380.1
Notes
• In compiling the information of maturity pattern (refer 10.3 (a), 10.3 (b), 10.3 (c), 10.3 (d) above),certain estimates and assumptions have been made by the management.
• Assets and liabilities in foreign currency exclude off-balance sheet assets and liabilities.
F-126

10.4 Advances
(i) Lending to sensitive sectors
The Bank has lending to sectors, which are sensitive to asset price fluctuations. Such sectors include capitalmarket, real estate and commodities. The net position of lending to sensitive sectors is given in the table below:
March 31,2005
March 31,2004
Rupees in million
Capital market sector* . . . . . . . . . . . . . . . . . . . . . . . . . . . . . . . . . . . . . . . . . . . . . . . . . . . . . . . 6,683.6 5,932.2Real estate sector . . . . . . . . . . . . . . . . . . . . . . . . . . . . . . . . . . . . . . . . . . . . . . . . . . . . . . . . . . . 43,497.0 25,172.3Commodities sector . . . . . . . . . . . . . . . . . . . . . . . . . . . . . . . . . . . . . . . . . . . . . . . . . . . . . . . . . 10,061.0 1,032.0
* represents loans to NBFCs, brokers and individuals against pledge of shares and includes an amount ofRs. 141.0 million as on March 31, 2005 (March 31, 2004: Rs. 3,026.5 million) pertaining to guaranteeissued to a corporate for the issue of non-convertible debentures, the proceeds of which have been utilisedfor acquisition of shares by the corporate
(ii) Movement of gross non-performing advances during the year
April 1, 2004 toMarch 31, 2005
April 1, 2003 toMarch 31, 2004
Rupees in million
Opening Balance . . . . . . . . . . . . . . . . . . . . . . . . . . . . . . . . . . . . . . . . . . . . . . . . . . . . 30,475.9 50,273.8Add: Additions during the year** . . . . . . . . . . . . . . . . . . . . . . . . . . . . . . . . . . . . . . 11,157.9 7,773.4
41,633.8 58,047.2Less: Reductions during the year . . . . . . . . . . . . . . . . . . . . . . . . . . . . . . . . . . . . . . . (13,929.5) (27,571.3)
Closing Balance* . . . . . . . . . . . . . . . . . . . . . . . . . . . . . . . . . . . . . . . . . . . . . . . . . . . 27,704.3 30,475.9
* includes suspended interest and claims received from ECGC/DICGC of Rs. 283.7 million (March 31, 2004:Rs. 501.8 million) on working capital loan.
** excludes cases added to and deleted from NPAs in the same year amounting to Rs. 13,759.9 million(March 31, 2004: Rs. 6,853.7 million).
(iii) Provision for non-performing advancesApril 1, 2004 toMarch 31, 2005
April 1, 2003 toMarch 31, 2004
Rupees in million
Opening Balance* . . . . . . . . . . . . . . . . . . . . . . . . . . . . . . . . . . . . . . . . . . . . . . . . . . . 16,250.1 22,036.1Add: Provisions made during the year (including utilization of fair value
provisions) . . . . . . . . . . . . . . . . . . . . . . . . . . . . . . . . . . . . . . . . . . . . . . . . . . . . . . 18,002.1 7,318.1
34,252.2 29,354.2Less: write-offs/recovery . . . . . . . . . . . . . . . . . . . . . . . . . . . . . . . . . . . . . . . . . . . . . (21,883.7) (13,104.1)
Closing Balance* . . . . . . . . . . . . . . . . . . . . . . . . . . . . . . . . . . . . . . . . . . . . . . . . . . . 12,368.5 16,250.1
* excludes technical write-off amounting to Rs. 15,763.6 million (March 31, 2004: Rs. 23,696.2 million).
F-127

(iv) Financial assets transferred during the year to Securitisation Company (SC)/Reconstruction Company (RC)
The Bank has transferred certain assets to an asset reconstruction company (ARC) in terms of the guidelinesissued by Reserve Bank of India governing such transfer. For the purpose of the valuation of the underlyingsecurity receipts issued by ARC, for the year ended March 31, 2004 NAV is taken at acquisition cost since ARChad not intimated the NAV and the transfers had been effected close to the year end. For the year endedMarch 31, 2005, the security receipts were valued at their respective NAVs as advised by the ARC. The detailsof the assets transferred for the relevant year are given in the table below:
April 1, 2004 toMarch 31, 2005
April 1, 2003 toMarch 31, 2004
Rupees in million
A. No. of accounts . . . . . . . . . . . . . . . . . . . . . . . . . . . . . . . . . . . . . . 82 54B. Aggregate value (net of provisions) of accounts sold to
SC/RC . . . . . . . . . . . . . . . . . . . . . . . . . . . . . . . . . . . . . . . . . . . . . 13,279.3 12,506.2C. Aggregate consideration . . . . . . . . . . . . . . . . . . . . . . . . . . . . . . . 10,862.3 12,439.5D. Additional consideration realised in respect of accounts
transferred in earlier years . . . . . . . . . . . . . . . . . . . . . . . . . . . . . — —E. Aggregate gain/(loss) over net sale value . . . . . . . . . . . . . . . . . . (2,417.0) (66.7 )
10.5 Information in respect of restructured assets
The Bank has restructured borrower accounts in standard, sub-standard and doubtful category. The grossamounts (net of write off) of restructuring during the year in respect of these accounts are given below:
April 1, 2004 toMarch 31, 2005
April 1, 2003 toMarch 31, 2004
Rupees in million
Standard assets subjected to restructuring . . . . . . . . . . . . . . . . . . . . . . . . . . . . . . . . 15,745.2 49,469.4Sub-standard assets subjected to restructuring . . . . . . . . . . . . . . . . . . . . . . . . . . . . . 558.7 1,409.0Doubtful assets subjected to restructuring . . . . . . . . . . . . . . . . . . . . . . . . . . . . . . . . 182.5 783.4
Total amount . . . . . . . . . . . . . . . . . . . . . . . . . . . . . . . . . . . . . . . . . . . . . . . . . . . . . . . 16,486.4 51,661.8
Above table includes accounts restructured under the Corporate Debt Restructuring (CDR) scheme duringthe year, other than cases that were restructured and disclosed in earlier years by the Bank and subsequently werereferred to and admitted under the CDR scheme during the current year.
April 1, 2004 toMarch 31, 2005
April 1, 2003 toMarch 31, 2004
Rupees in million
Standard assets subjected to CDR . . . . . . . . . . . . . . . . . . . . . . . . . . . . . . . . . . . . . . 17,501.4 53,761.9Sub-standard assets subjected to CDR . . . . . . . . . . . . . . . . . . . . . . . . . . . . . . . . . . . 558.7 823.0Doubtful assets subjected to CDR . . . . . . . . . . . . . . . . . . . . . . . . . . . . . . . . . . . . . . — —
Total amount . . . . . . . . . . . . . . . . . . . . . . . . . . . . . . . . . . . . . . . . . . . . . . . . . . . . . . . 18,060.1 54,584.9
Above details exclude cases that were approved by CDR Forum and disclosed in the earlier years by theBank and in which certain terms and conditions have been modified by CDR Forum during the current year.
F-128

10.6 InvestmentsMarch 31, 2005 March 31, 2004
In IndiaOutside
India In IndiaOutside
India
Rupees in million
Gross value . . . . . . . . . . . . . . . . . . . . . . . . . . . . . . . . . . . . . . . . . . . . 496,627.7 15,124.3 441,233.8 3,674.1Less: Provision for depreciation and fair value provision . . . . . . . . 6,869.5 9.0 10,488.3 64.4
Net value . . . . . . . . . . . . . . . . . . . . . . . . . . . . . . . . . . . . . . . . . . . . . . 489,758.2 15,115.3 430,745.5 3,609.7
Provision for depreciation on investmentsApril 1, 2004 toMarch 31, 2005
April 1, 2003 toMarch 31, 2004
Rupees in million
Opening balance . . . . . . . . . . . . . . . . . . . . . . . . . . . . . . . . . . 10,470.8 15,212.4Add : Provision made during the period (including
utilization of fair value provision) . . . . . . . . . . . . . . . . . . (949.1 ) (4,741.6)Less : Transfer from investment fluctuation reserve . . . . . . — —Add : Write-off during the period . . . . . . . . . . . . . . . . . . . . . (3,442.6) —
Closing balance . . . . . . . . . . . . . . . . . . . . . . . . . . . . . . . . . . . 6,079.1 10,470.8
10.7 Investments in equity shares and equity like instrumentsMarch 31, 2005 March 31, 2004
Rupees in million
Equity shares* . . . . . . . . . . . . . . . . . . . . . . . . . . . . . . . . . . . . 9,231.4 7,185.8Convertible debentures . . . . . . . . . . . . . . . . . . . . . . . . . . . . . 585.0 614.4Units of equity oriented mutual funds . . . . . . . . . . . . . . . . . 252.7 202.7Investment in venture capital funds . . . . . . . . . . . . . . . . . . . 11,761.6 11,606.6Others (loans against collateral, advances to brokers)** . . . 6,683.6 5,932.2
Total . . . . . . . . . . . . . . . . . . . . . . . . . . . . . . . . . . . . . . . . . . . 28,514.3 25,541.7
* Includes advance application money pending allotment of Rs. 821.3 million (March 31, 2004: Rs. 565.7million)
** Includes unutilized limits sanctioned to brokers of Rs. 3,495.2 million (March 31, 2004: Rs. 761.1 million)
F-129

10.8 Investment in non-SLR securities
i) Issuer composition of non-SLR investments
a) The issuer composition of non-SLR investments of the Bank as on March 31, 2005 is given below:
No Issuer AmountExtent of private
placement
Extent of‘below
investmentgrade’
securities
Extent of‘unrated’securities
Extent of‘unlisted’securities
Rupees in million(a) (b) (c) (d)
1 PSUs . . . . . . . . . . . . . . . . . . . . . . . . . . . . . . . 6,250.0 4,620.5 — 20.5 2,933.62 FIs . . . . . . . . . . . . . . . . . . . . . . . . . . . . . . . . . 3,264.3 342.3 — 101.3 101.33 Banks . . . . . . . . . . . . . . . . . . . . . . . . . . . . . . . 4,684.5 2,419.8 — — 53.14 Private corporate . . . . . . . . . . . . . . . . . . . . . . 45,210.8 30,553.2 200.0 31,362.1 29,677.45 Subsidiaries/Joint ventures . . . . . . . . . . . . . . 20,667.0 2,661.3 — 150.0 150.06 Others . . . . . . . . . . . . . . . . . . . . . . . . . . . . . . 86,856.3 27,821.3 23,359.0 0.3 —7 Provision held towards depreciation . . . . . . . (6,877.5 ) — — — —
Total . . . . . . . . . . . . . . . . . . . . . . . . . . . . . . . . 160,055.4 68,418.4 23,559.0 31,634.2 32,915.4
Amounts reported under columns (a), (b), (c), and (d) above are not mutually exclusive* This excludes investments, amounting to Rs. 2,551.3 million, in preference shares of subsidiaries, namely
ICICI Bank UK Limited and ICICI Bank Canada and Rs. 7,189.6 million invested by overseas branches/offshore banking unit.
b) The issuer composition of non-SLR investments of the Bank as on March 31, 2004 is given below:
No. Issuer AmountExtent of private
placement
Extent of‘below
investmentgrade’
securities
Extent of‘unrated’securities
Extent of‘unlisted’securities
Rupees in million(a) (b) (c) (d)
1 PSUs . . . . . . . . . . . . . . . . . . . . . . . . . . . . . . . 8,447.3 6,558.0 146.4 328.9 6,161.42 FIs . . . . . . . . . . . . . . . . . . . . . . . . . . . . . . . . 9,355.6 4,454.8 — 101.3 5,424.53 Banks . . . . . . . . . . . . . . . . . . . . . . . . . . . . . . 1,504.1 90.0 — — 342.34 Private corporate . . . . . . . . . . . . . . . . . . . . . 68,123.5 50,359.2 200.0 50,394.2 50,558.55 Subsidiaries/Joint ventures . . . . . . . . . . . . . 14,236.5 724.1 — 400.0 400.06 Others . . . . . . . . . . . . . . . . . . . . . . . . . . . . . . 44,062.8 12,558.5 12,508.2 240.9 —7 Provision held towards depreciation . . . . . . (10,552.6) — — — —
Total . . . . . . . . . . . . . . . . . . . . . . . . . . . . . . . 135,177.2 74,744.6 12,854.6 51,465.3 62,886.7
Amounts reported under columns (a), (b), (c), and (d) above are not mutually exclusive* This excludes investments, amounting to Rs. 324.1 million, in preference shares of subsidiaries, namely
ICICI Bank Canada and Rs. 132.9 million invested by overseas branches/offshore banking unit.
F-130

ii) Non performing non-SLR investments
The non performing non-SLR investments of the Bank as on March 31, 2005 is given below:
Particulars Amount
Rupees in million
Opening balance . . . . . . . . . . . . . . . . . . . . . . . . . . . . . . . . . . . . . . . . . . . . . . . . . . . . . . 12,334.7Additions during the year . . . . . . . . . . . . . . . . . . . . . . . . . . . . . . . . . . . . . . . . . . . . . . . 1,570.3Reductions during the year . . . . . . . . . . . . . . . . . . . . . . . . . . . . . . . . . . . . . . . . . . . . . . 5,027.3Closing balance . . . . . . . . . . . . . . . . . . . . . . . . . . . . . . . . . . . . . . . . . . . . . . . . . . . . . . . 8,877.3
Total provisions held . . . . . . . . . . . . . . . . . . . . . . . . . . . . . . . . . . . . . . . . . . . . . . . . . . . 3,166.7
iii) Non performing non-SLR investments
The non performing non-SLR investments of the Bank as on March 31, 2004 is given below:
Particulars Amount
Rupees in million
Opening balance . . . . . . . . . . . . . . . . . . . . . . . . . . . . . . . . . . . . . . . . . . . . . . . . . . . . . . 10,749.3Additions during the year . . . . . . . . . . . . . . . . . . . . . . . . . . . . . . . . . . . . . . . . . . . . . . . 6,086.3Reductions during the year . . . . . . . . . . . . . . . . . . . . . . . . . . . . . . . . . . . . . . . . . . . . . . 4,501.3Closing balance . . . . . . . . . . . . . . . . . . . . . . . . . . . . . . . . . . . . . . . . . . . . . . . . . . . . . . . 12,334.7
Total provisions held . . . . . . . . . . . . . . . . . . . . . . . . . . . . . . . . . . . . . . . . . . . . . . . . . . . 5,409.6
10.9 Repurchase transactions
The details of securities sold and purchased under repos and reverse repos during the year ended March 31,2005 are given below:
Minimumoutstanding
balanceduring the
period
Maximumoutstanding
balanceduring the
period
Dailyaverage
outstandingbalance
during theperiod
Balance ason March 31,
2005
Rupees in million
Securities sold under repurchase transaction . . . . . . . . . . . . . . — 34,842.0 9,683.6 13,076.3Securities purchased under reverse repurchase transaction . . . — 14,520.0 586.7 —
The details of securities sold and purchased under repos and reverse repos during the year ended March 31,2004 are given below:
Minimumoutstanding
balanceduring the
year
Maximumoutstanding
balanceduring the
year
Dailyaverage
outstandingbalance
during theyear
Balance ason March 31,
2004
Rupees in million
Securities sold under repurchase transaction . . . . . . . . . . . . . . — 25,519.0 6,416.3 —Securities purchased under reverse repurchase transaction . . . — 5,850.0 858.8 2,431.8
F-131

10.10 Credit exposure
As at March 31, 2005 the Bank has taken single borrower exposure above 15% with the approval of theBoard of Directors in the following cases:
Name of Borrower March 31, 2005
% to capital funds
Borrower A . . . . . . . . . . . . . . . . . . . . . . . . . . . . . . . . . . . . . . . . . . . . . . . . . . . . . . . . . . . . . . . . . . . 19.50%Borrower B . . . . . . . . . . . . . . . . . . . . . . . . . . . . . . . . . . . . . . . . . . . . . . . . . . . . . . . . . . . . . . . . . . . 17.46%Borrower C . . . . . . . . . . . . . . . . . . . . . . . . . . . . . . . . . . . . . . . . . . . . . . . . . . . . . . . . . . . . . . . . . . . 16.73%Borrower D . . . . . . . . . . . . . . . . . . . . . . . . . . . . . . . . . . . . . . . . . . . . . . . . . . . . . . . . . . . . . . . . . . . 16.20%
10.11 Risk category-wise country-wise exposure
As per the extant Reserve Bank of India guidelines, the country exposure of the Bank is categorised intovarious risk categories listed in the following table. Since the country exposure (net) of the Bank in respect ofeach country does not exceed 1% of the total funded assets, no provision is required to be maintained on countryexposures.
Risk categoryExposure (net) as on
March 31, 2005Exposure (net) as on
March 31, 2004
Rupees in million
Insignificant . . . . . . . . . . . . . . . . . . . . . . . . . . . . . . . . . . . . . . . 54,349.8 62,651.1Low . . . . . . . . . . . . . . . . . . . . . . . . . . . . . . . . . . . . . . . . . . . . . 11,408.4 2,217.7Moderate . . . . . . . . . . . . . . . . . . . . . . . . . . . . . . . . . . . . . . . . . 4,592.1 1,735.4High . . . . . . . . . . . . . . . . . . . . . . . . . . . . . . . . . . . . . . . . . . . . . — 8.6Very High . . . . . . . . . . . . . . . . . . . . . . . . . . . . . . . . . . . . . . . . — —Off-Credit . . . . . . . . . . . . . . . . . . . . . . . . . . . . . . . . . . . . . . . . 656.2 —Total . . . . . . . . . . . . . . . . . . . . . . . . . . . . . . . . . . . . . . . . . . . . 71,006.5 66,612.8—of which funded . . . . . . . . . . . . . . . . . . . . . . . . . . . . . . . . . . 38,885.7 46,950.6
10.12 Interest rate swaps (“IRS”)
The notional principal amount of Rupee IRS contracts as at March 31, 2005 is Rs. 51.10 billion for hedgingcontracts (March 31, 2004: Rs. 34.15 billion) and Rs. 1,114.30 billion for trading contracts (March 31, 2004:Rs. 947.83 billion).
The fair value represents the estimated replacement cost of swap contracts as at balance sheet date. AtMarch 31, 2005 the fair value of trading rupee interest rate swap contracts is Rs. 0.33 billion (March 31, 2004:Rs. 0.67 billion).
Associated credit risk is the loss that the Bank would incur in case all the counter-parties to these swaps failto fulfill their contractual obligations. As at March 31, 2005, the associated credit risk on trading rupee interestrate swap contracts is Rs. 9.87 billion (March 31, 2004: Rs. 8.96 billion).
Market risk is monitored as the loss that would be incurred by the Bank for a 100 basis points rise in theinterest rates. As at March 31, 2005 the market risk on trading rupee interest rate swap contracts amounts toRs. 0.14 billion (March 31, 2004: Rs. 0.06 billion).
Credit risk concentration is measured as the highest net receivable under swap contracts from a particularcounter party. As at March 31, 2005 there is a credit risk concentration of Rs. 0.27 billion (March 31, 2004:Rs. 0.68 billion) under rupee interest rate swap contracts, with ICICI Securities Ltd. As per the prevailing marketpractice, the Bank does not insist on collateral from the counter parties of these contracts.
F-132

10.13 Rupee and foreign currency derivatives
ICICI Bank is a leading participant in the financial derivatives market. The Bank deals in derivatives forbalance sheet management and market making purposes whereby the Bank offers derivative products to itscustomers, enabling them to hedge their risks.
Dealing in derivatives is centralised in the treasury of the Bank. Derivative transactions are entered into bythe treasury front office. Treasury middle office conducts an independent check of the transactions entered intoby the front office and also undertakes activities such as confirmation, settlement, accounting, risk monitoringand reporting and ensures compliance with various internal and regulatory guidelines.
The market making and the proprietary trading activities in derivatives are governed by the investmentpolicy of the Bank, which lays down the position limits, stop loss limits as well as other risk limits. The RiskManagement Group (RMG) lays down the methodology for computation and monitoring of risk. Risk Committeeof the Board (RCB) reviews the Bank’s risk management policy in relation to various risks (portfolio, liquidity,interest rate, off-balance sheet and operational risks), investment policies and strategy and regulatory andcompliance issues in relation thereto. The RCB comprises of independent as well as whole time directors.
Risk monitoring on derivatives portfolio is done on a daily basis. The Bank measures and monitors riskusing Value at Risk (VAR) approach and the relevant greeks for options. Risk reporting on derivatives forms anintegral part of the management information system and the marked to market position and the VAR of thederivatives portfolio is reported on a daily basis.
The use of derivatives for hedging purpose is governed by the hedge policy approved by Asset LiabilityManagement Committee (ALCO). Subject to prevailing Reserve Bank of India guidelines, the Bank deals inderivatives for hedging fixed rate, floating rate or foreign currency assets/liabilities. Transactions for hedging andmarket making purposes are recorded separately. For hedge transactions, the Bank identifies the hedged item(asset or liability) at the inception of the transaction itself. The Bank uses different methodologies for measuringthe hedge effectiveness such as duration and price value of basis point (PVBP). The effectiveness is assessed atthe time of inception of the hedge and periodically thereafter.
Hedge derivative transactions are accounted for pursuant to the principles of hedge accounting. Derivativesfor market making purpose are marked to market and the resulting gain/loss is recorded in the profit and lossaccount. Premia on options are accounted for at the expiry of the options. The Bank makes provisions on theoutstanding positions in trading derivatives for possible adverse movements in underlying. Derivativetransactions are covered under ISDA master agreements with the respective counter parties. The credit exposureon account of derivative transactions is computed as per Reserve Bank of India guidelines and is marked againstthe credit limits approved for the respective counter parties.
F-133

March 31, 2005
Sr. No. ParticularCurrency
derivatives*Interest ratederivatives
(Rupees in millions)
1 Derivatives (Notional principal amount)
a) For hedging . . . . . . . . . . . . . . . . . . . . . . . . . . . . . . . . . . . . . . . . . . . . . . . . . . 8,083.1 106,428.6b) For trading . . . . . . . . . . . . . . . . . . . . . . . . . . . . . . . . . . . . . . . . . . . . . . . . . . . 274,325.6 1,335,689.1
2 Marked to market positions
a) Asset (+) . . . . . . . . . . . . . . . . . . . . . . . . . . . . . . . . . . . . . . . . . . . . . . . . . . . . . 442.0 564.7b) Liability (-) . . . . . . . . . . . . . . . . . . . . . . . . . . . . . . . . . . . . . . . . . . . . . . . . . . . — —
3 Credit exposure . . . . . . . . . . . . . . . . . . . . . . . . . . . . . . . . . . . . . . . . . . . . . . . . . 9,373.9 18,124.4
4 Likely impact of one percentage change in interest rate (100*PV01)**
a) on hedging derivatives *** . . . . . . . . . . . . . . . . . . . . . . . . . . . . . . . . . . . . . . (79.4) (22.1)b) on trading derivatives . . . . . . . . . . . . . . . . . . . . . . . . . . . . . . . . . . . . . . . . . . . 880.7 (534.5)
5 Maximum and minimum of 100*PV01 observed during the year**
a) on hedging***Maximum . . . . . . . . . . . . . . . . . . . . . . . . . . . . . . . . . . . . . . . . . . . . . . . . . . . . . . (38.2) 2.8Minimum . . . . . . . . . . . . . . . . . . . . . . . . . . . . . . . . . . . . . . . . . . . . . . . . . . . . . . (101.5) (1,675.1)
b) on tradingMaximum . . . . . . . . . . . . . . . . . . . . . . . . . . . . . . . . . . . . . . . . . . . . . . . . . . . . . . 1,280.6 180.8Minimum . . . . . . . . . . . . . . . . . . . . . . . . . . . . . . . . . . . . . . . . . . . . . . . . . . . . . . 156.6 (1,081.3)
* Foreign currency IRS & FRAs are included in Interest Rate Derivatives** Impact of one percent increase in interest rates*** The swap contracts entered for hedging purpose have an opposite and offsetting impact with the underlying
on-balance sheet items.
Effective April 1, 2004, the Bank has accounted for the unrealised gain on rupee interest rate derivatives(net of provisions, if any) as compared to its earlier policy of ignoring such unrealised gains. As a result the profitafter tax for the current year is higher by Rs. 296.3 million.
11. Investments in jointly controlled entities
Investments include Rs. 83.8 million (March 2004: Rs. 6,690.1 million) representing the Bank’s interests inthe following jointly controlled entities:
Sr. No. Name of CompanyCountry/residence
Percentageholding*
1 Prudential ICICI Asset Management Company Limited . . . . . . . . . . . . . . . . . . . . . . India 44.99%*2 Prudential ICICI Trust Limited . . . . . . . . . . . . . . . . . . . . . . . . . . . . . . . . . . . . . . . . . India 44.80%*
* indicates holding by ICICI Bank Limited along with its subsidiaries
F-134

The aggregate amounts of assets and liabilities as on March 31, 2005 and income and expenses for the yearthen ended relating to the Bank’s interests in the above entities are given below:
Liabilities Amount Assets Amount
Rupees in million Rupees in million
Capital and Reserves . . . . . . . . . . . . . . 346.4 Cash and bank balances . . . . . . . . . . 1.5Other liabilities . . . . . . . . . . . . . . . . . . . 179.0 Investments . . . . . . . . . . . . . . . . . . . . 356.3
Fixed assets . . . . . . . . . . . . . . . . . . . 38.0Other assets . . . . . . . . . . . . . . . . . . . 129.6
Total . . . . . . . . . . . . . . . . . . . . . . . . . . . 525.4 Total . . . . . . . . . . . . . . . . . . . . . . . . . 525.4
Expenses Amount Income Amount
Rupees in million Rupees in million
Interest expenses . . . . . . . . . . . . . . . . . — Interest income . . . . . . . . . . . . . . . . . 0.1Other expenses . . . . . . . . . . . . . . . . . . . 341.5 Other income . . . . . . . . . . . . . . . . . . 460.7Provisions . . . . . . . . . . . . . . . . . . . . . . . 41.6
Total . . . . . . . . . . . . . . . . . . . . . . . . . . . 383.1 Total . . . . . . . . . . . . . . . . . . . . . . . . . 460.8
The aggregate amounts of assets and liabilities as on March 31, 2004 and income and expenses for the yearthen ended relating to the Bank’s interests in the above entities are given below:
Liabilities Amount Liabilities Amount
Rupees in million Rupees in million
Capital and Reserves . . . . . . . . . . . . . . 3,739.5 Cash and bank balances . . . . . . . . . . 847.3Other liabilities . . . . . . . . . . . . . . . . . . . 3,633.6 Investments . . . . . . . . . . . . . . . . . . . . 15,126.4Liabilities on life policies in force . . . . 10,610.5 Fixed assets . . . . . . . . . . . . . . . . . . . 502.4
Other assets . . . . . . . . . . . . . . . . . . . 1,507.5
Total . . . . . . . . . . . . . . . . . . . . . . . . . . . 17,983.6 Total . . . . . . . . . . . . . . . . . . . . . . . . . 17,983.6
Expenses Amount Income Amount
Rupees in million Rupees in million
Interest expenses . . . . . . . . . . . . . . . . . 2.2 Interest income . . . . . . . . . . . . . . . . . 405.3Other expenses Other income
—Premium ceded and change inliability for life policies inforce . . . . . . . . . . . . . . . . . . . . . 4,888.2 Insurance premium/commission . . . 11,176.0Others . . . . . . . . . . . . . . . . . . . . 8,662.5 Others . . . . . . . . . . . . . . . . . . . . . . . . 824.2
Provisions . . . . . . . . . . . . . . . . . . . . . . . 135.2
Total . . . . . . . . . . . . . . . . . . . . . . . . . . . 13,688.1 Total . . . . . . . . . . . . . . . . . . . . . . . . . 12,405.5
12. Provision for non-performing assets
In its memorandum dated DBOD.BP.BC 99/21.04.048/2003-2004 dated June 21, 2004 Reserve Bank ofIndia has introduced graded higher provisioning norms which would require a bank to make 100% provision onthe secured portion of doubtful assets outstanding for more than three years in doubtful category instead of theearlier requirement of 50% provision. However, Reserve Bank of India has allowed banks to make 100%provision on the existing assets which are in doubtful category for more than three years as on March 31, 2004,until March 31, 2007 in a graded manner (i.e. 60% as on March 31, 2005, 75% as on March 31, 2006 and 100%as on March 31, 2007). Accordingly the Bank has adopted the revised Reserve Bank of India guidelines.
The impact of the adoption of the revised guidelines on the profit and loss account is not significant.
F-135

13. Subvention income
Effective April 1, 2004 the commissions paid to direct marketing agents (DMAs) of auto loans, net ofsubvention income received from them, is recorded upfront in the profit and loss account. For disbursementsmade until March 31, 2004, the gross commissions paid to direct marketing agents (DMAs) of auto loans wererecorded upfront in the profit and loss account and subvention income received from them is being amortisedover the life of the loan. The impact of the change is not significant.
14. Transfer of investments from AFS to HTM category
During the year ended March 31, 2005, the Bank has transferred investments amounting toRs. 213,489.4 million from Available for Sale category to Held to Maturity category in accordance with ReserveBank of India memorandum: DBOD.No.BP.BC.37/21.04.141/2004-05 dated September 2, 2004. The differencebetween the book value of each investment and the lower of its acquisition cost and market value on the date oftransfer, amounting to Rs. 1,828.2 million has been provided for in the profit and loss account.
15. Others
a. Exchange fluctuation
Exchange fluctuation aggregating Rs. 244.7 million (March 31, 2004: Rs. 577.8 million), which arises onaccount of rupee-tying agreements with the government of India, is held in “Exchange Fluctuation Suspense withGovernment Account” pending adjustment at maturity on receipt of payments from the Government forrepayments to foreign lenders.
b. Swap suspense (net)
Swap suspense (net) aggregating Rs. 794.7 million (debit) (March 31, 2004: Rs. 677.0 million (debit)),which arises out of conversion of foreign currency swaps, is held in “Swap suspense account” and will bereversed at conclusion of swap transactions with swap counter parties.
16. Comparative figures
Figures of the previous year have been regrouped to conform to the current year’s presentation.
SIGNATURES TO SCHEDULES 1 TO 18
For and on behalf of the Board of Directors
N. Vaghul K. V. Kamath Lalita D. GupteChairman Managing Director & CEO Joint Managing Director
Kalpana Morparia Nachiket Mor Chanda D. KochharDeputy Managing Director Executive Director Executive Director
N. S. Kannan Jyotin Mehta G. VenkatakrishnanChief Financial Officer & Treasurer General Manager &
Company SecretaryGeneral Manager—Accounting
and Taxation Group
Place: MumbaiDate: April 30, 2005
F-136

Auditors’ Report to the Members of ICICI Bank Ltd.
1. We have audited the attached balance sheet of ICICI Bank Ltd. (the “Bank”) as at March 31, 2004 and alsothe profit and loss account and cash flow statement for the year ended on that date annexed thereto. Thesefinancial statements are the responsibility of the Bank’s management. Our responsibility is to express anopinion on these financial statements based on our audit. Incorporated in the said financial statements is thereturn of one foreign branch audited by another firm of independent accountants.
2. We conducted our audit in accordance with auditing standards generally accepted in India. Those Standardsrequire that we plan and perform the audit to obtain reasonable assurance about whether the financialstatements are free of material misstatement. An audit includes examining, on a test basis, evidencesupporting the amounts and disclosures in the financial statements. An audit also includes assessing theaccounting principles used and significant estimates made by management, as well as evaluating the overallfinancial statement presentation. We believe that our audit provides a reasonable basis for our opinion.
3. The balance sheet and profit and loss account are drawn up in conformity with Forms A and B (revised) ofthe Third Schedule to the Banking Regulation Act, 1949, read with Section 211 of the Companies Act,1956.
4. We report that:
(a) We have obtained all the information and explanations, which to the best of our knowledge and beliefwere necessary for the purposes of our audit and have found them to be satisfactory;
(b) In our opinion, the transactions of the Bank which have come to our notice have been within itspowers;
(c) In our opinion, proper books of account as required by law have been kept by the Bank so far asappears from our examination of those books and proper returns adequate for the purposes of our audithave been received from the foreign branch not visited by us. The audited returns of the foreign branchhas been forwarded to us and has been appropriately dealt with;
(d) The balance sheet, profit and loss account and cash flow statement dealt with by this report are inagreement with the books of account;
(e) In our opinion, the balance sheet, profit and loss account and cash flow statement dealt with by thisreport comply with the accounting standards referred to in sub-section (3C) of Section 211 of theCompanies Act, insofar as they apply to the Bank;
(f) On the basis of written representations received from the directors, as on March 31, 2004, and taken onrecord by the Board of Directors, we report that none of the directors is disqualified from beingappointed as a director in terms of clause (g) of sub-section (1) of Section 274 of the Companies Act,1956;
(g) In our opinion and to the best of our information and according to the explanations given to us, the saidaccounts give the information required by the Companies Act, 1956 in the manner so required forbanking companies, and give a true and fair view in conformity with the accounting principlesgenerally accepted in India;
i. in case of the balance sheet, of the state of the affairs of the Bank as at March 31, 2004;
ii. in case of the profit and loss account, of the profit for the year ended on that date; and
iii. in case of cash flow statement, of the cash flows for the year ended on that date.
For S.R. Batliboi & Co.Chartered Accountants
Per Viren H. Mehtaa PartnerMembership No.: 048749
April 30, 2004
F-137

Balance Sheet as on March 31, 2004
Schedule As on 31.03.2004 As on 31.03.2003
Rupees in ‘000s Rupees in ‘000s
CAPITAL AND LIABILITIESCapital . . . . . . . . . . . . . . . . . . . . . . . . . . . . . . . . . . . . . . . . . . . . . . 1 9,664,012 9,626,600Reserves and Surplus . . . . . . . . . . . . . . . . . . . . . . . . . . . . . . . . . . 2 73,941,561 63,206,538Deposits . . . . . . . . . . . . . . . . . . . . . . . . . . . . . . . . . . . . . . . . . . . . . 3 681,085,845 481,693,063Borrowings . . . . . . . . . . . . . . . . . . . . . . . . . . . . . . . . . . . . . . . . . . 4 307,402,393 343,024,203Other liabilities and provisions . . . . . . . . . . . . . . . . . . . . . . . . . . . 5 180,194,930 170,569,258
TOTAL . . . . . . . . . . . . . . . . . . . . . . . . . . . . . . . . . . . . . . . . . . . . . 1,252,288,741 1,068,119,662
ASSETSCash and balance with Reserve Bank of India . . . . . . . . . . . . . . . 6 54,079,966 48,861,445Balances with banks and money at call and short notice . . . . . . . 7 30,626,378 16,028,581Investments . . . . . . . . . . . . . . . . . . . . . . . . . . . . . . . . . . . . . . . . . . 8 427,428,614 354,623,002Advances . . . . . . . . . . . . . . . . . . . . . . . . . . . . . . . . . . . . . . . . . . . . 9 620,955,196 532,794,144Fixed Assets . . . . . . . . . . . . . . . . . . . . . . . . . . . . . . . . . . . . . . . . . 10 40,564,141 40,607,274Other Assets . . . . . . . . . . . . . . . . . . . . . . . . . . . . . . . . . . . . . . . . . 11 78,634,446 75,205,216
TOTAL . . . . . . . . . . . . . . . . . . . . . . . . . . . . . . . . . . . . . . . . . . . . . 1,252,288,741 1,068,119,662
Contingent liabilities . . . . . . . . . . . . . . . . . . . . . . . . . . . . . . . . . . . . . . . 12 2,029,419,027 894,385,070
Bills for collection . . . . . . . . . . . . . . . . . . . . . . . . . . . . . . . . . . . . . . . . . 15,109,352 13,367,843
Significant Accounting Policies and Notes to Accounts . . . . . . . . . . . 18
The Schedules referred to above form an integral part of the Balance Sheet
As per our Report of even date
For and on behalf of the Board of Directors
For S. R. Batliboi & Co N. Vaghul K. V. Kamath Lalita D. GupteChartered Accountants Chairman Managing Director & CEO Joint Managing Director
per Viren H. Mehta Kalpana Morparia Nachiket Mor Chanda D. Kochhara Partner Deputy Managing Director Executive Director Executive Director
N. S. Kannan Jyotin Mehta G. VenkatakrishnanChief Financial Officer
& TreasurerGeneral Manager &Company Secretary
General Manager—Accounting andTaxation Group
Place: MumbaiDate: April 30, 2004
F-138

Profit and Loss Account for the year ended March 31, 2004
ScheduleYear ended31.03.2004
Year ended31.03.2003
Rupees in ‘000sINCOME
Interest earned . . . . . . . . . . . . . . . . . . . . . . . . . . . . . . . . . . . . . . . . . . . 13 88,940,406 93,680,561Other income . . . . . . . . . . . . . . . . . . . . . . . . . . . . . . . . . . . . . . . . . . . . 14 30,649,228 19,677,741Profit on sale of shares of ICICI Bank Limited held by erstwhile
ICICI Limited . . . . . . . . . . . . . . . . . . . . . . . . . . . . . . . . . . . . . . . . . 11,910,517
TOTAL . . . . . . . . . . . . . . . . . . . . . . . . . . . . . . . . . . . . . . . . . . . 119,589,634 125,268,819
EXPENDITUREInterest expended . . . . . . . . . . . . . . . . . . . . . . . . . . . . . . . . . . . . . . . . 15 70,152,492 79,439,989Operating expenses . . . . . . . . . . . . . . . . . . . . . . . . . . . . . . . . . . . . . . . 16 25,712,325 20,116,900Provisions and contingencies . . . . . . . . . . . . . . . . . . . . . . . . . . . . . . . 17 7,353,754 13,650,139
TOTAL . . . . . . . . . . . . . . . . . . . . . . . . . . . . . . . . . . . . . . . . . . . 103,218,571 113,207,028
PROFIT/LOSSNet profit for the period/year . . . . . . . . . . . . . . . . . . . . . . . . . . . . . . . 16,371,063 12,061,791Profit brought forward . . . . . . . . . . . . . . . . . . . . . . . . . . . . . . . . . . . . 50,520 195,614
TOTAL . . . . . . . . . . . . . . . . . . . . . . . . . . . . . . . . . . . . . . . . . . . 16,421,583 12,257,405
APPROPRIATIONS/TRANSFERSStatutory Reserve . . . . . . . . . . . . . . . . . . . . . . . . . . . . . . . . . . . . . . . . 4,093,000 3,020,000Transfer from Debenture Redemption Reserve . . . . . . . . . . . . . . . . . — (100,000)Capital Reserve . . . . . . . . . . . . . . . . . . . . . . . . . . . . . . . . . . . . . . . . . . 2,650,000 2,000,000Investment Fluctuation Reserve . . . . . . . . . . . . . . . . . . . . . . . . . . . . . 2,760,000 1,000,000Special Reserve . . . . . . . . . . . . . . . . . . . . . . . . . . . . . . . . . . . . . . . . . . 250,000 500,000Revenue and other Reserves . . . . . . . . . . . . . . . . . . . . . . . . . . . . . . . . — 600,000Proposed equity share Dividend . . . . . . . . . . . . . . . . . . . . . . . . . . . . . 5,440,592 4,597,758Proposed preference share Dividend . . . . . . . . . . . . . . . . . . . . . . . . . 35 35Corporate dividend tax . . . . . . . . . . . . . . . . . . . . . . . . . . . . . . . . . . . . 697,080 589,092Balance carried over to Balance Sheet . . . . . . . . . . . . . . . . . . . . . . . . 530,876 50,520
TOTAL . . . . . . . . . . . . . . . . . . . . . . . . . . . . . . . . . . . . . . . . . . . 16,421,583 12,257,405
Significant Accounting Policies and Notes to Accounts . . . . . . . . . . . . . . 18Earning per Share (Refer note B. 8)
Basic (Rs.) . . . . . . . . . . . . . . . . . . . . . . . . . . . . . . . . . . . . . . . . . . . . . . 26.66 19.68Diluted (Rs.) . . . . . . . . . . . . . . . . . . . . . . . . . . . . . . . . . . . . . . . . . . . . 26.44 19.65
The Schedules referred to above form an integral part of the profit and loss account.
As per our Report of even date
For and on behalf of the Board of Directors
For S. R. Batliboi & Co N. Vaghul K. V. Kamath Lalita D. GupteChartered Accountants Chairman Managing Director & CEO Joint Managing Director
per Viren H. Mehta Kalpana Morparia Nachiket Mor Chanda D. Kochhara Partner Deputy Managing Director Executive Director Executive Director
N. S. Kannan Jyotin Mehta G. VenkatakrishnanChief Financial Officer
& TreasurerGeneral Manager &Company Secretary
General Manager—Accounting andTaxation Group
Place: MumbaiDate: April 30, 2004
F-139

Schedules forming part of the balance sheet
SCHEDULE 1—CAPITAL
As on31.03.2004
As on31.03.2003
Rupees in ‘000s
Authorised Capital1,550,000,000 equity shares of Rs. 10 each (March 31, 2003: 1,550,000,000 equity
shares of Rs. 10 each) . . . . . . . . . . . . . . . . . . . . . . . . . . . . . . . . . . . . . . . . . . . . . . . . . 15,500,000 15,500,000350 preference shares of Rs. 10 million each . . . . . . . . . . . . . . . . . . . . . . . . . . . . . . . . . 3,500,000 3,500,000Issued, Subscribed and Paid-up Capital 613,021,301 (March 31, 2003: 613,031,404)
equity shares of Rs. 10 each(1) . . . . . . . . . . . . . . . . . . . . . . . . . . . . . . . . . . . . . . . . . . . 6,130,213 6,130,314Less: Calls unpaid . . . . . . . . . . . . . . . . . . . . . . . . . . . . . . . . . . . . . . . . . . . . . . . . . . . . . . (3,744)Add: Forfeited 13,103 (March 31, 2003: Nil) equity shares . . . . . . . . . . . . . . . . . . . . . 93 —Add: Issued 3,370,604 (March 31, 2003: 3,000) equity shares of Rs. 10 each on
exercise of employee stock options . . . . . . . . . . . . . . . . . . . . . . . . . . . . . . . . . . . . . . . 33,706 30
TOTAL . . . . . . . . . . . . . . . . . . . . . . . . . . . . . . . . . . . . . . . . . . . . . . . . . . . . . . . . . . . . . 6,164,012 6,126,600
Preference Share Capital(2)
(Represents face value of 350 preference shares of Rs. 10 million each issued topreference share holders of erstwhile ICICI Limited on amalgamation redeemableat par on April 20, 2018) . . . . . . . . . . . . . . . . . . . . . . . . . . . . . . . . . . . . . . . . . . . . . . . 3,500,000 3,500,000
TOTAL . . . . . . . . . . . . . . . . . . . . . . . . . . . . . . . . . . . . . . . . . . . . . . . . . . . . . . . . . . . . . 9,664,012 9,626,600
(1) Includes :-(a) 31,818,180 underlying equity shares consequent to the ADS issue(b) 23,539,800 equity shares issued to the equity share holders of Bank of Madura Limited on
amalgamation(c) 264,465,582 equity shares issued to the equity share holders (excluding ADS holders) of ICICI Limited
on amalgamation(d) 128,207,142 underlying equity shares issued to the ADS holders of ICICI Limited on amalgamation
(2) The notification from Ministry of Finance has currently exempted the Bank from the restriction ofsection 12 (1) of the Banking Regulation Act, 1949, which prohibits issue of preference shares by banks.
F-140

Schedules forming part of the balance sheet—(Continued)
SCHEDULE 2—RESERVES AND SURPLUS
As on31.03.2004
As on31.03.2003
Rupees in ‘000s
Statutory reserveOpening balance . . . . . . . . . . . . . . . . . . . . . . . . . . . . . . . . . . . . . . . . . . . . . . . . . . . . . . . 5,514,307 2,494,307Additions during the year . . . . . . . . . . . . . . . . . . . . . . . . . . . . . . . . . . . . . . . . . . . . . . . . 4,093,000 3,020,000Deductions during the year . . . . . . . . . . . . . . . . . . . . . . . . . . . . . . . . . . . . . . . . . . . . . . . — —Closing balance . . . . . . . . . . . . . . . . . . . . . . . . . . . . . . . . . . . . . . . . . . . . . . . . . . . . . . . . 9,607,307 5,514,307
Debenture redemption reserveOpening balance . . . . . . . . . . . . . . . . . . . . . . . . . . . . . . . . . . . . . . . . . . . . . . . . . . . . . . . — 100,000Additions during the year . . . . . . . . . . . . . . . . . . . . . . . . . . . . . . . . . . . . . . . . . . . . . . . . — —Deductions during the year . . . . . . . . . . . . . . . . . . . . . . . . . . . . . . . . . . . . . . . . . . . . . . . — 100,000Closing balance . . . . . . . . . . . . . . . . . . . . . . . . . . . . . . . . . . . . . . . . . . . . . . . . . . . . . . . . — —
Special reserveOpening balance . . . . . . . . . . . . . . . . . . . . . . . . . . . . . . . . . . . . . . . . . . . . . . . . . . . . . . . 11,440,000 10,940,000Additions during the year . . . . . . . . . . . . . . . . . . . . . . . . . . . . . . . . . . . . . . . . . . . . . . . . 250,000 500,000Deductions during the year . . . . . . . . . . . . . . . . . . . . . . . . . . . . . . . . . . . . . . . . . . . . . . . — —Closing balance . . . . . . . . . . . . . . . . . . . . . . . . . . . . . . . . . . . . . . . . . . . . . . . . . . . . . . . . 11,690,000 11,440,000
Share premiumOpening balance* . . . . . . . . . . . . . . . . . . . . . . . . . . . . . . . . . . . . . . . . . . . . . . . . . . . . . . 8,045,721 8,021,352Additions during the year (on exercise of employee stock options) . . . . . . . . . . . . . . . . 477,583 285Deductions during the year . . . . . . . . . . . . . . . . . . . . . . . . . . . . . . . . . . . . . . . . . . . . . . . — —Closing balance . . . . . . . . . . . . . . . . . . . . . . . . . . . . . . . . . . . . . . . . . . . . . . . . . . . . . . . . 8,523,304 8,021,637
Investment fluctuation reserveOpening balance . . . . . . . . . . . . . . . . . . . . . . . . . . . . . . . . . . . . . . . . . . . . . . . . . . . . . . . 1,273,350 273,350Additions during the year . . . . . . . . . . . . . . . . . . . . . . . . . . . . . . . . . . . . . . . . . . . . . . . . 6,030,000 1,000,000Deductions during the year . . . . . . . . . . . . . . . . . . . . . . . . . . . . . . . . . . . . . . . . . . . . . . . — —Closing balance . . . . . . . . . . . . . . . . . . . . . . . . . . . . . . . . . . . . . . . . . . . . . . . . . . . . . . . . 7,303,350 1,273,350
Capital reserveOpening balance . . . . . . . . . . . . . . . . . . . . . . . . . . . . . . . . . . . . . . . . . . . . . . . . . . . . . . . 2,000,000 —Additions during the year . . . . . . . . . . . . . . . . . . . . . . . . . . . . . . . . . . . . . . . . . . . . . . . . 2,650,000 2,000,000Deductions during the year . . . . . . . . . . . . . . . . . . . . . . . . . . . . . . . . . . . . . . . . . . . . . . . — —Closing balance . . . . . . . . . . . . . . . . . . . . . . . . . . . . . . . . . . . . . . . . . . . . . . . . . . . . . . . . 4,650,000 2,000,000
Revenue and other reservesOpening balance . . . . . . . . . . . . . . . . . . . . . . . . . . . . . . . . . . . . . . . . . . . . . . . . . . . . . . . 34,906,724 34,306,724Additions during the year . . . . . . . . . . . . . . . . . . . . . . . . . . . . . . . . . . . . . . . . . . . . . . . . — 600,000Deductions during the year . . . . . . . . . . . . . . . . . . . . . . . . . . . . . . . . . . . . . . . . . . . . . . . 3,270,000 —Closing balance . . . . . . . . . . . . . . . . . . . . . . . . . . . . . . . . . . . . . . . . . . . . . . . . . . . . . . . . 31,636,724 34,906,724Balance in profit and loss account . . . . . . . . . . . . . . . . . . . . . . . . . . . . . . . . . . . . . . . . . 530,876 50,520
TOTAL . . . . . . . . . . . . . . . . . . . . . . . . . . . . . . . . . . . . . . . . . . . . . . . . . . . . . . . . . . . . . 73,941,561 63,206,538
* Net of Share Premium in arrears Rs. Nil (March 31, 2003 Rs. 24.1 million)
F-141

Schedules forming part of the balance sheet—(Continued)
SCHEDULE 3—DEPOSITS
As on31.03.2004
As on31.03.2003
Rupees in ‘000sDemand deposits
From banks . . . . . . . . . . . . . . . . . . . . . . . . . . . . . . . . . . . . . . . . . . . . . . . . . . . . . 1,345,603 919,592From others . . . . . . . . . . . . . . . . . . . . . . . . . . . . . . . . . . . . . . . . . . . . . . . . . . . . . 71,244,990 35,974,853
Savings bank deposits . . . . . . . . . . . . . . . . . . . . . . . . . . . . . . . . . . . . . . . . . . . . . . . . . 83,720,260 37,932,081Term deposits
From banks . . . . . . . . . . . . . . . . . . . . . . . . . . . . . . . . . . . . . . . . . . . . . . . . . . . . . 50,418,828 53,585,875From others . . . . . . . . . . . . . . . . . . . . . . . . . . . . . . . . . . . . . . . . . . . . . . . . . . . . . 474,356,164 353,280,662
TOTAL . . . . . . . . . . . . . . . . . . . . . . . . . . . . . . . . . . . . . . . . . . . . . . . . . . . . . . . . . . . 681,085,845 481,693,063
Deposits of branches in India . . . . . . . . . . . . . . . . . . . . . . . . . . . . . . . . . . . . . . . . . . . 670,287,519 481,693,063Deposits of branches outside India . . . . . . . . . . . . . . . . . . . . . . . . . . . . . . . . . . . . . . . 10,798,326 —
TOTAL . . . . . . . . . . . . . . . . . . . . . . . . . . . . . . . . . . . . . . . . . . . . . . . . . . . . . . . . . . . 681,085,845 481,693,063
SCHEDULE 4—BORROWINGS
As on31.03.2004
As on31.03.2003
Rupees in ‘000sBorrowings in IndiaReserve Bank of India . . . . . . . . . . . . . . . . . . . . . . . . . . . . . . . . . . . . . . . . . . . . . — —Other banks . . . . . . . . . . . . . . . . . . . . . . . . . . . . . . . . . . . . . . . . . . . . . . . . . . . . . 16,568,829 24,469,090Other institutions and agencies
Government of India . . . . . . . . . . . . . . . . . . . . . . . . . . . . . . . . . . . . . . . . . . 4,411,459 5,210,408Financial Institutions . . . . . . . . . . . . . . . . . . . . . . . . . . . . . . . . . . . . . . . . . . 40,531,000 25,658,489
Borrowings in the form ofDeposits taken over from erstwhile ICICI Limited . . . . . . . . . . . . . . . . . . . 3,098,362 5,062,808Commercial paper . . . . . . . . . . . . . . . . . . . . . . . . . . . . . . . . . . . . . . . . . . . . — —Bonds and debentures (excluding subordinated debt)
Debentures and bonds guaranteed by the government of India . . . . . 14,815,000 14,815,000Tax free bonds . . . . . . . . . . . . . . . . . . . . . . . . . . . . . . . . . . . . . . . . . . . — 800,000Borrowings under private placement of bonds carrying maturity of
one to thirty years from the date of placement . . . . . . . . . . . . . . . . 48,150,574 91,339,109Bonds issued under multiple option/safety bonds series
—Regular interest bonds . . . . . . . . . . . . . . . . . . . . . . . . . . . . . . . 10,953,604 16,722,052—Deep discount bonds . . . . . . . . . . . . . . . . . . . . . . . . . . . . . . . . 4,069,486 6,098,808—Bonds with premium warrants . . . . . . . . . . . . . . . . . . . . . . . . 685,670 588,947—Encash bonds . . . . . . . . . . . . . . . . . . . . . . . . . . . . . . . . . . . . . . 1,431,105 1,892,690—Tax saving bonds . . . . . . . . . . . . . . . . . . . . . . . . . . . . . . . . . . . 84,889,030 80,125,313—Easy installment bonds . . . . . . . . . . . . . . . . . . . . . . . . . . . . . . — 31,337—Pension bonds . . . . . . . . . . . . . . . . . . . . . . . . . . . . . . . . . . . . . 56,896 54,469
Application money pending allotment . . . . . . . . . . . . . . . . . . . . . . . . — 11,238,896Borrowings outside India
From multilateral/bilateral credit agencies (guaranteed by the government ofIndia equivalent of Rs. 19,794.3 million) . . . . . . . . . . . . . . . . . . . . . . . . . . . . 24,403,563 25,417,795
From international banks, institutions and consortiums . . . . . . . . . . . . . . . . . . . 35,111,989 27,947,996By way of bonds and notes . . . . . . . . . . . . . . . . . . . . . . . . . . . . . . . . . . . . . . . . . 18,225,826 5,550,996
TOTAL . . . . . . . . . . . . . . . . . . . . . . . . . . . . . . . . . . . . . . . . . . . . . . . . . . . . . . . . . . . 307,402,393 343,024,203
Secured borrowings in I and II above is Rs. NIL
F-142

Schedules forming part of the balance sheet—(Continued)
SCHEDULE 5—OTHER LIABILITIES AND PROVISIONS
As on31.03.2004
As on31.03.2003
Rupees in ‘000s
Bills payable . . . . . . . . . . . . . . . . . . . . . . . . . . . . . . . . . . . . . . . . . . . . . . . . . . . . . . . . 16,852,843 10,305,536Inter-office adjustments (net) . . . . . . . . . . . . . . . . . . . . . . . . . . . . . . . . . . . . . . . . . . . 3,419,337 —Interest accrued . . . . . . . . . . . . . . . . . . . . . . . . . . . . . . . . . . . . . . . . . . . . . . . . . . . . . . 13,561,305 16,191,657Unsecured Redeemable Debentures/Bonds (Subordinated for Tier II Capital) . . . . . 91,058,612 97,495,259Others
Security deposits from clients . . . . . . . . . . . . . . . . . . . . . . . . . . . . . . . . . . . . . . . 9,510,841 3,540,625Sundry creditors . . . . . . . . . . . . . . . . . . . . . . . . . . . . . . . . . . . . . . . . . . . . . . . . . 24,970,428 15,411,986Received for disbursements under special program . . . . . . . . . . . . . . . . . . . . . . 2,730,091 2,548,454Other Liabilities (including provisions)* . . . . . . . . . . . . . . . . . . . . . . . . . . . . . . 18,091,473 25,075,741
TOTAL . . . . . . . . . . . . . . . . . . . . . . . . . . . . . . . . . . . . . . . . . . . . . . . . . . . . . . . . . . . 180,194,930 170,569,258
* Includes:(a) Proposed dividend Rs. 5,439.9 million (March 31, 2003 Rs. 4,597.8 million)(b) Corporate dividend Tax payable Rs. 697.0 million (March 31, 2003 Rs. 589.1 million)(c) Provision for standard assets Rs. 3,828.1 million (March 31, 2003 Rs. 3,078.1 million)
SCHEDULE 6—CASH AND BALANCES WITH RESERVE BANK OF INDIA
As on31.03.2004
As on31.03.2003
Rupees in ‘000s
Cash in hand (including foreign currency notes) . . . . . . . . . . . . . . . . . . . . . . . . . . . . . . 4,467,734 3,364,709Balances with Reserve Bank of India in current accounts . . . . . . . . . . . . . . . . . . . . . . . 49,612,232 45,496,736
TOTAL . . . . . . . . . . . . . . . . . . . . . . . . . . . . . . . . . . . . . . . . . . . . . . . . . . . . . . . . . . . . . 54,079,966 48,861,445
SCHEDULE 7—BALANCES WITH BANKS AND MONEY AT CALL AND SHORT NOTICE
As on31.03.2004
As on31.03.2003
Rupees in ‘000s
In IndiaBalances with banks
in Current Accounts . . . . . . . . . . . . . . . . . . . . . . . . . . . . . . . . . . . . . . . . . . . . 3,411,303 2,150,990in Other Deposit Accounts . . . . . . . . . . . . . . . . . . . . . . . . . . . . . . . . . . . . . . . 10,238,969 5,954,857
Money at call and short noticewith banks . . . . . . . . . . . . . . . . . . . . . . . . . . . . . . . . . . . . . . . . . . . . . . . . . . . . — 1,925,000with other institutions . . . . . . . . . . . . . . . . . . . . . . . . . . . . . . . . . . . . . . . . . . . — 3,227,500
TOTAL . . . . . . . . . . . . . . . . . . . . . . . . . . . . . . . . . . . . . . . . . . . . . . . . . . . . . . . . . . . . . 13,650,272 13,258,347
Outside Indiain Current Accounts . . . . . . . . . . . . . . . . . . . . . . . . . . . . . . . . . . . . . . . . . . . . . . . . 2,877,153 910,655in Other Deposit Accounts . . . . . . . . . . . . . . . . . . . . . . . . . . . . . . . . . . . . . . . . . . . 9,948,286 637,790Money at call and short notice . . . . . . . . . . . . . . . . . . . . . . . . . . . . . . . . . . . . . . . . 4,150,667 1,221,789
TOTAL . . . . . . . . . . . . . . . . . . . . . . . . . . . . . . . . . . . . . . . . . . . . . . . . . . . . . . . . . . . . . 16,976,106 2,770,234
GRAND TOTAL (I + II) . . . . . . . . . . . . . . . . . . . . . . . . . . . . . . . . . . . . . . . . . . . . . . . 30,626,378 16,028,581
F-143

Schedules forming part of the balance sheet—(Continued)
SCHEDULE 8—INVESTMENTS (net of provisions)
As on31.03.2004
As on31.03.2003
Rupees in ‘000sInvestments in India
Government securities . . . . . . . . . . . . . . . . . . . . . . . . . . . . . . . . . . . . . . . . . . . . . 298,876,781 255,485,754Other approved securities . . . . . . . . . . . . . . . . . . . . . . . . . . . . . . . . . . . . . . . . . . 301,155 344,477Shares . . . . . . . . . . . . . . . . . . . . . . . . . . . . . . . . . . . . . . . . . . . . . . . . . . . . . . . . . 16,842,660 16,424,107Debentures and Bonds . . . . . . . . . . . . . . . . . . . . . . . . . . . . . . . . . . . . . . . . . . . . . 55,490,989 56,899,185Subsidiaries and/or joint ventures . . . . . . . . . . . . . . . . . . . . . . . . . . . . . . . . . . . . 11,037,612 7,806,824Others (CPs, Mutual Fund Units, Pass through Certificates, Security Receipts
etc.) . . . . . . . . . . . . . . . . . . . . . . . . . . . . . . . . . . . . . . . . . . . . . . . . . . . . . . . . . 41,269,706 17,576,975
TOTAL . . . . . . . . . . . . . . . . . . . . . . . . . . . . . . . . . . . . . . . . . . . . . . . . . . . . . . . . . . . 423,818,903 354,537,322
Investments outside IndiaGovernment securities . . . . . . . . . . . . . . . . . . . . . . . . . . . . . . . . . . . . . . . . . . . . . 132,924 —Subsidiaries and/or joint ventures abroad . . . . . . . . . . . . . . . . . . . . . . . . . . . . . . 3,198,926 14,488Others . . . . . . . . . . . . . . . . . . . . . . . . . . . . . . . . . . . . . . . . . . . . . . . . . . . . . . . . . 277,861 71,192
TOTAL . . . . . . . . . . . . . . . . . . . . . . . . . . . . . . . . . . . . . . . . . . . . . . . . . . . . . . . . . . . 3,609,711 85,680
GRAND TOTAL (I + II) . . . . . . . . . . . . . . . . . . . . . . . . . . . . . . . . . . . . . . . . . . . . . 427,428,614 354,623,002
SCHEDULE 9—ADVANCES (net of provisions)
As on31.03.2004
As on31.03.2003
Rupees in ‘000sBills purchased and discounted . . . . . . . . . . . . . . . . . . . . . . . . . . . . . . . . . . . . . . 12,308,603 4,376,415Cash credits, overdrafts and loans repayable on demand . . . . . . . . . . . . . . . . . . 60,978,735 31,340,244Term loans . . . . . . . . . . . . . . . . . . . . . . . . . . . . . . . . . . . . . . . . . . . . . . . . . . . . . . 534,286,332 489,028,169
Securitization, Finance lease and Hire Purchase receivables . . . . . . . . . . . . . . . . . . . 13,381,526 8,049,316
TOTAL . . . . . . . . . . . . . . . . . . . . . . . . . . . . . . . . . . . . . . . . . . . . . . . . . . . . . . . . . . . 620,955,196 532,794,144
Secured by tangible assets (includes advances against Book Debt) . . . . . . . . . . 568,010,325 500,684,919Covered by Bank/Government Guarantees . . . . . . . . . . . . . . . . . . . . . . . . . . . . . 6,154,561 16,998,486Unsecured . . . . . . . . . . . . . . . . . . . . . . . . . . . . . . . . . . . . . . . . . . . . . . . . . . . . . . 46,790,310 15,110,739
TOTAL . . . . . . . . . . . . . . . . . . . . . . . . . . . . . . . . . . . . . . . . . . . . . . . . . . . . . . . . . . . 620,955,196 532,794,144
Advances in IndiaPriority Sector . . . . . . . . . . . . . . . . . . . . . . . . . . . . . . . . . . . . . . . . . . . . . . . . . . . 145,307,396 89,376,024Public Sector . . . . . . . . . . . . . . . . . . . . . . . . . . . . . . . . . . . . . . . . . . . . . . . . . . . . 7,071,294 18,974,073Banks . . . . . . . . . . . . . . . . . . . . . . . . . . . . . . . . . . . . . . . . . . . . . . . . . . . . . . . . . . 433,504 1,013,245Others . . . . . . . . . . . . . . . . . . . . . . . . . . . . . . . . . . . . . . . . . . . . . . . . . . . . . . . . . 457,505,090 422,894,675
TOTAL . . . . . . . . . . . . . . . . . . . . . . . . . . . . . . . . . . . . . . . . . . . . . . . . . . . . . . . . . . . 610,317,284 532,258,017
Advances outside IndiaDue from banks . . . . . . . . . . . . . . . . . . . . . . . . . . . . . . . . . . . . . . . . . . . . . . . . . . — —Due from othersBills purchased and discounted . . . . . . . . . . . . . . . . . . . . . . . . . . . . . . . . . . . . . . 5,958,406 —Syndicated loans . . . . . . . . . . . . . . . . . . . . . . . . . . . . . . . . . . . . . . . . . . . . . . . . . 1,962,537 —Others . . . . . . . . . . . . . . . . . . . . . . . . . . . . . . . . . . . . . . . . . . . . . . . . . . . . . . . . . 2,716,969 536,127
TOTAL . . . . . . . . . . . . . . . . . . . . . . . . . . . . . . . . . . . . . . . . . . . . . . . . . . . . . . . . . . . 10,637,912 536,127
GRAND TOTAL (C. I and II) . . . . . . . . . . . . . . . . . . . . . . . . . . . . . . . . . . . . . . . . . 620,955,196 532,794,144
F-144

Schedules forming part of the balance sheet—(Continued)
SCHEDULE 10—FIXED ASSETS
As on31.03.2004
As on31.03.2003
Rupees in ‘000s
PremisesAt cost as on 31st March of preceding year . . . . . . . . . . . . . . . . . . . . . . . . . . . . 16,061,840 14,431,673Additions during the year . . . . . . . . . . . . . . . . . . . . . . . . . . . . . . . . . . . . . . . . . . 939,989 *3,683,243Deductions during the year . . . . . . . . . . . . . . . . . . . . . . . . . . . . . . . . . . . . . . . . . (332,847) *(2,053,076)Depreciation to date . . . . . . . . . . . . . . . . . . . . . . . . . . . . . . . . . . . . . . . . . . . . . . (1,020,673) (659,371)
Net block . . . . . . . . . . . . . . . . . . . . . . . . . . . . . . . . . . . . . . . . . . . . . . . . . . . . . . . 15,648,309 15,402,469
Other fixed assets (including furniture and fixtures)At cost as on 31st March of preceding year . . . . . . . . . . . . . . . . . . . . . . . . . . . . 10,612,849 7,133,585Additions during the year . . . . . . . . . . . . . . . . . . . . . . . . . . . . . . . . . . . . . . . . . . 3,121,078 **3,779,516Deductions during the year . . . . . . . . . . . . . . . . . . . . . . . . . . . . . . . . . . . . . . . . . (146,146) **(300,252)Depreciation to date . . . . . . . . . . . . . . . . . . . . . . . . . . . . . . . . . . . . . . . . . . . . . . (5,303,877) (3,109,580)
Net block . . . . . . . . . . . . . . . . . . . . . . . . . . . . . . . . . . . . . . . . . . . . . . . . . . . . . . . 8,283,904 7,503,269
Assets given on LeaseAt cost as on 31st March of preceding year . . . . . . . . . . . . . . . . . . . . . . . . . . . . 21,455,141 **23,377,605Additions during the year . . . . . . . . . . . . . . . . . . . . . . . . . . . . . . . . . . . . . . . . . . 777,257 343,565Deductions during the year . . . . . . . . . . . . . . . . . . . . . . . . . . . . . . . . . . . . . . . . . (1,587,161) (2,266,029)Depreciation to date, accumulated lease adjustment and provisions . . . . . . . . . (4,013,309) (3,753,605)
Net block . . . . . . . . . . . . . . . . . . . . . . . . . . . . . . . . . . . . . . . . . . . . . . . . . . . . . . . 16,631,928 17,701,536
TOTAL . . . . . . . . . . . . . . . . . . . . . . . . . . . . . . . . . . . . . . . . . . . . . . . . . . . 40,564,141 40,607,274
* Includes adjustment amounting to Rs. 1,614.9 million on account of transfer to non banking assets inSchedule 11
** Includes repossessed Leased Asset Rs. 96.0 million
F-145

Schedules forming part of the balance sheet—(Continued)
SCHEDULE 11—OTHER ASSETS
As on31.03.2004
As on31.03.2003
Rupees in ‘000s
Inter-office adjustments (net) . . . . . . . . . . . . . . . . . . . . . . . . . . . . . . . . . . . . . . . . . . . . . — 1,034,655Interest accrued . . . . . . . . . . . . . . . . . . . . . . . . . . . . . . . . . . . . . . . . . . . . . . . . . . . . . . . . 15,552,120 19,582,564Tax paid in advance/tax deducted at source (net) . . . . . . . . . . . . . . . . . . . . . . . . . . . . . . 19,951,503 14,140,278Stationery and Stamps . . . . . . . . . . . . . . . . . . . . . . . . . . . . . . . . . . . . . . . . . . . . . . . . . . . 3,600 8,084Non-banking assets acquired in satisfaction of claims* . . . . . . . . . . . . . . . . . . . . . . . . . 5,047,938 4,538,354Others
Advance for capital assets . . . . . . . . . . . . . . . . . . . . . . . . . . . . . . . . . . . . . . . . . . . . 939,922 1,562,088Outstanding fees and other Income . . . . . . . . . . . . . . . . . . . . . . . . . . . . . . . . . . . . . 1,484,556 1,776,206Exchange fluctuation suspense with government of India . . . . . . . . . . . . . . . . . . . 577,818 923,573Swap suspense . . . . . . . . . . . . . . . . . . . . . . . . . . . . . . . . . . . . . . . . . . . . . . . . . . . . . 677,012 128,667Recoverable from subsidiary companies . . . . . . . . . . . . . . . . . . . . . . . . . . . . . . . . 161,296 182,276Others** . . . . . . . . . . . . . . . . . . . . . . . . . . . . . . . . . . . . . . . . . . . . . . . . . . . . . . . . . 34,238,681 31,328,471
TOTAL . . . . . . . . . . . . . . . . . . . . . . . . . . . . . . . . . . . . . . . . . . . . . . . . . . . . . 78,634,446 75,205,216
* Includes:a. Assets amounting to Rs. Nil (March 31, 2003 Rs. 1,614.9 million) transferred from premises in Schedule 10b. Certain non-banking assets acquired in satisfaction of claims which are in the process of being transferred in
the Banks’ namec. Repossessed leased assets amounting to Rs. Nil (March 31, 2003 Rs. Nil)** Includes:a. Net Deferred Tax Asset of Rs. 4,429.7 million (March 31, 2003 Rs. 4,888.3 million)b. Unamortised costs on account of the early retirement option scheme offered to the employees of the bank of
Rs. 1,654.0 million (March 31, 2003 Rs. Nil)
SCHEDULE 12—CONTINGENT LIABILITIES
As on31.03.2004
As on31.03.2003
Rupees in ‘000s
Claims against the Bank not acknowledged as debts . . . . . . . . . . . . . . . . . . . . . . . . 25,017,852 20,251,450Liability for partly paid investments . . . . . . . . . . . . . . . . . . . . . . . . . . . . . . . . . . . . 1,241,429 1,804,936Liability on account of outstanding forward exchange contracts . . . . . . . . . . . . . . 557,043,848 251,030,498Guarantees given on behalf of constituents
In India . . . . . . . . . . . . . . . . . . . . . . . . . . . . . . . . . . . . . . . . . . . . . . . . . . . . . . . 113,855,978 106,120,760Outside India . . . . . . . . . . . . . . . . . . . . . . . . . . . . . . . . . . . . . . . . . . . . . . . . . . 6,433,971 227,521
Acceptances, endorsements and other obligations . . . . . . . . . . . . . . . . . . . . . . . . . . 65,141,996 43,251,942Currency Swaps . . . . . . . . . . . . . . . . . . . . . . . . . . . . . . . . . . . . . . . . . . . . . . . . . . . . 44,484,809 29,013,220Interest Rate Swaps & Currency options . . . . . . . . . . . . . . . . . . . . . . . . . . . . . . . . . 1,177,640,840 413,544,698Other items for which the Bank is contingently liable . . . . . . . . . . . . . . . . . . . . . . . 38,558,304 29,140,045
TOTAL . . . . . . . . . . . . . . . . . . . . . . . . . . . . . . . . . . . . . . . . . . . . . . . . . . 2,029,419,027 894,385,070
F-146

Schedules forming part of the profit and loss account
SCHEDULE 13—INTEREST EARNED
Year ended31.03.2004
Year ended31.03.2003
Rupees in ‘000s
Interest/discount on advances/bills . . . . . . . . . . . . . . . . . . . . . . . . . . . . . . . . . . . . . . . . . 60,738,528 60,162,439Income on investments . . . . . . . . . . . . . . . . . . . . . . . . . . . . . . . . . . . . . . . . . . . . . . . . . . 24,317,401 29,104,415Interest on balances with Reserve Bank of India and other inter-bank funds . . . . . . . . . 2,106,345 2,355,668Others* . . . . . . . . . . . . . . . . . . . . . . . . . . . . . . . . . . . . . . . . . . . . . . . . . . . . . . . . . . . . . . 1,778,132 2,058,039
TOTAL . . . . . . . . . . . . . . . . . . . . . . . . . . . . . . . . . . . . . . . . . . . . . . . . . . . . . . . . . 88,940,406 93,680,561
* Includes interest on income tax refunds Rs. 406.1 million (March 31, 2003: Rs. 242.9 million)
SCHEDULE 14—OTHER INCOME
Year ended31.03.2004
Year ended31.03.2003
Rupees in ‘000s
Commission, exchange and brokerage . . . . . . . . . . . . . . . . . . . . . . . . . . . . . . . . . . . . . . 10,717,982 7,917,880Profit/(Loss) on sale of investments (net) . . . . . . . . . . . . . . . . . . . . . . . . . . . . . . . . . . . . 12,246,330 4,923,328Profit/(Loss) on revaluation of investments (net) . . . . . . . . . . . . . . . . . . . . . . . . . . . . . . — 1,076Profit/(Loss) on sale of land, buildings and other assets (net) . . . . . . . . . . . . . . . . . . . . (31,966) (65,038)Profit/(Loss) on foreign exchange transactions (net) (including premium
amortization) . . . . . . . . . . . . . . . . . . . . . . . . . . . . . . . . . . . . . . . . . . . . . . . . . . . . . . . . 1,926,267 102,425Income earned by way of dividends, etc. from subsidiary companies and/or joint
ventures abroad/in India . . . . . . . . . . . . . . . . . . . . . . . . . . . . . . . . . . . . . . . . . . . . . . . 1,261,730 1,094,239Miscellaneous Income (including lease income) . . . . . . . . . . . . . . . . . . . . . . . . . . . . . . 4,528,885 5,703,831
TOTAL . . . . . . . . . . . . . . . . . . . . . . . . . . . . . . . . . . . . . . . . . . . . . . . . . . . . . . . . . 30,649,228 19,677,741
SCHEDULE 15—INTEREST EXPENDEDYear ended31.03.2004
Year ended31.03.2003
Rupees in ‘000s
Interest on Deposits . . . . . . . . . . . . . . . . . . . . . . . . . . . . . . . . . . . . . . . . . . . . . . . . . . . . . 30,230,202 24,797,095Interest on Reserve Bank of India/inter-bank borrowings . . . . . . . . . . . . . . . . . . . . . . . 2,293,656 1,833,699Others (including interest on borrowings of erstwhile ICICI Limited)* . . . . . . . . . . . . 37,628,634 52,809,195
TOTAL . . . . . . . . . . . . . . . . . . . . . . . . . . . . . . . . . . . . . . . . . . . . . . . . . . . . . . . . . . . . . 70,152,492 79,439,989
* Includes expenses incurred to raise funds amounting to Rs. 297.4 million (March 31, 2003: Rs. 622.3million)
F-147

Schedules forming part of the profit and loss account—(Continued)
SCHEDULE 16—OPERATING EXPENSESYear ended31.03.2004
Year ended31.03.2003
Rupees in ‘000s
Payments to and provisions for employees . . . . . . . . . . . . . . . . . . . . . . . . . . . . . . . . . . . 5,460,573 4,030,246Rent, taxes and lighting . . . . . . . . . . . . . . . . . . . . . . . . . . . . . . . . . . . . . . . . . . . . . . . . . . 1,492,502 1,115,796Printing and Stationery . . . . . . . . . . . . . . . . . . . . . . . . . . . . . . . . . . . . . . . . . . . . . . . . . . 861,008 747,174Advertisement and publicity . . . . . . . . . . . . . . . . . . . . . . . . . . . . . . . . . . . . . . . . . . . . . . 686,788 581,767Depreciation on Bank’s property (including non banking assets) . . . . . . . . . . . . . . . . . 2,609,344 1,914,703Depreciation (including lease equalisation) on Leased assets . . . . . . . . . . . . . . . . . . . . 2,785,069 3,144,712Directors’ fees, allowances and expenses . . . . . . . . . . . . . . . . . . . . . . . . . . . . . . . . . . . . 3,650 1,317Auditors’ fees and expenses . . . . . . . . . . . . . . . . . . . . . . . . . . . . . . . . . . . . . . . . . . . . . . 16,750 15,000Law Charges . . . . . . . . . . . . . . . . . . . . . . . . . . . . . . . . . . . . . . . . . . . . . . . . . . . . . . . . . . 86,895 85,153Postages, Telegrams, Telephones, etc. . . . . . . . . . . . . . . . . . . . . . . . . . . . . . . . . . . . . . . 1,415,019 1,041,519Repairs and maintenance . . . . . . . . . . . . . . . . . . . . . . . . . . . . . . . . . . . . . . . . . . . . . . . . . 1,895,723 1,448,654Insurance . . . . . . . . . . . . . . . . . . . . . . . . . . . . . . . . . . . . . . . . . . . . . . . . . . . . . . . . . . . . . 334,991 251,809Other expenditure . . . . . . . . . . . . . . . . . . . . . . . . . . . . . . . . . . . . . . . . . . . . . . . . . . . . . . 8,064,013 5,739,050
TOTAL . . . . . . . . . . . . . . . . . . . . . . . . . . . . . . . . . . . . . . . . . . . . . . . . . . . . . . . . . 25,712,325 20,116,900
SCHEDULE 17—PROVISIONS AND CONTINGENCIES
Year ended31.03.2004
Year ended31.03.2003
Rupees in ‘000s
Income Tax—Current period tax . . . . . . . . . . . . . . . . . . . . . . . . . . . . . . . . . . . . . . . . . . . . . . . . . 2,695,947 2,145,480—Deferred tax adjustment . . . . . . . . . . . . . . . . . . . . . . . . . . . . . . . . . . . . . . . . . . . . (68,800) (6,425,900)
Wealth Tax . . . . . . . . . . . . . . . . . . . . . . . . . . . . . . . . . . . . . . . . . . . . . . . . . . . . . . . . . . . . 24,000 22,500Provision for investments (including credit substitutes) (net) . . . . . . . . . . . . . . . . . . . . . (96,484) 3,094,311Provision for advances (net)* . . . . . . . . . . . . . . . . . . . . . . . . . . . . . . . . . . . . . . . . . . . . . . 3,841,155 13,209,848Prudential provision on standard assets . . . . . . . . . . . . . . . . . . . . . . . . . . . . . . . . . . . . . . 750,000 1,540,000Others . . . . . . . . . . . . . . . . . . . . . . . . . . . . . . . . . . . . . . . . . . . . . . . . . . . . . . . . . . . . . . . . 207,936 63,900
Total . . . . . . . . . . . . . . . . . . . . . . . . . . . . . . . . . . . . . . . . . . . . . . . . . . . . . . . . . . . . . . . . . 7,353,754 13,650,139
* Includes provision on non performing advances, non performing leased assets and other receivables
F-148
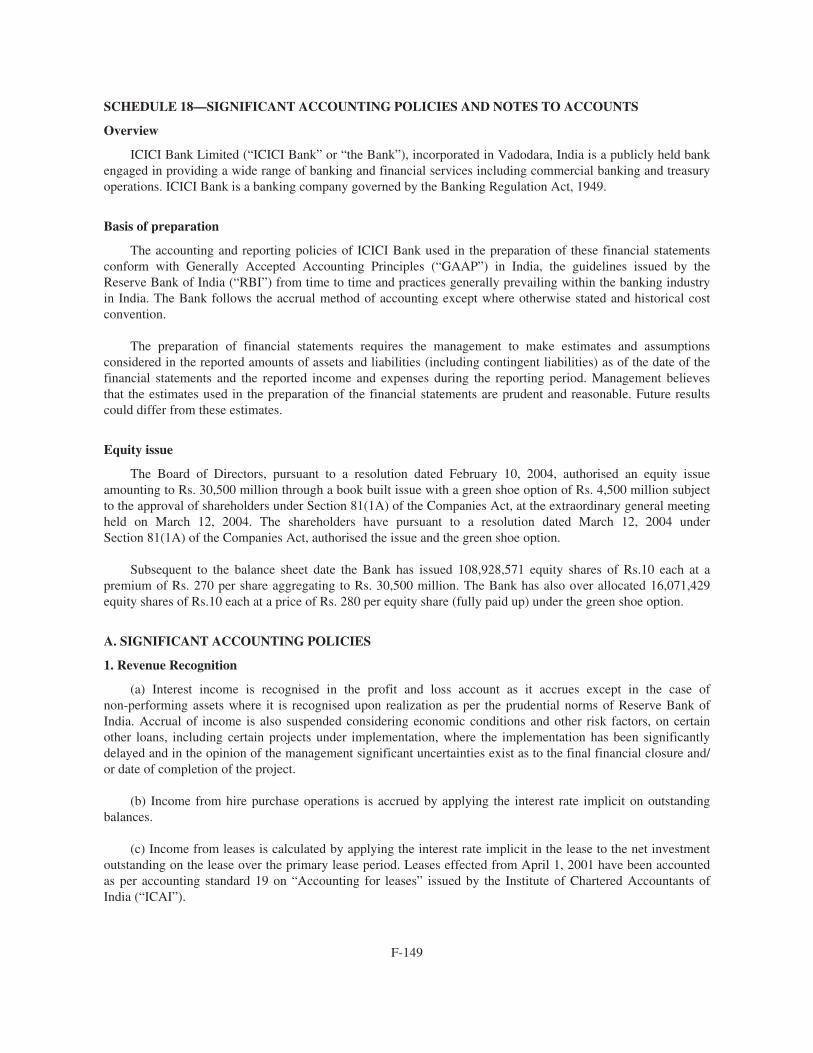
SCHEDULE 18—SIGNIFICANT ACCOUNTING POLICIES AND NOTES TO ACCOUNTS
Overview
ICICI Bank Limited (“ICICI Bank” or “the Bank”), incorporated in Vadodara, India is a publicly held bankengaged in providing a wide range of banking and financial services including commercial banking and treasuryoperations. ICICI Bank is a banking company governed by the Banking Regulation Act, 1949.
Basis of preparation
The accounting and reporting policies of ICICI Bank used in the preparation of these financial statementsconform with Generally Accepted Accounting Principles (“GAAP”) in India, the guidelines issued by theReserve Bank of India (“RBI”) from time to time and practices generally prevailing within the banking industryin India. The Bank follows the accrual method of accounting except where otherwise stated and historical costconvention.
The preparation of financial statements requires the management to make estimates and assumptionsconsidered in the reported amounts of assets and liabilities (including contingent liabilities) as of the date of thefinancial statements and the reported income and expenses during the reporting period. Management believesthat the estimates used in the preparation of the financial statements are prudent and reasonable. Future resultscould differ from these estimates.
Equity issue
The Board of Directors, pursuant to a resolution dated February 10, 2004, authorised an equity issueamounting to Rs. 30,500 million through a book built issue with a green shoe option of Rs. 4,500 million subjectto the approval of shareholders under Section 81(1A) of the Companies Act, at the extraordinary general meetingheld on March 12, 2004. The shareholders have pursuant to a resolution dated March 12, 2004 underSection 81(1A) of the Companies Act, authorised the issue and the green shoe option.
Subsequent to the balance sheet date the Bank has issued 108,928,571 equity shares of Rs.10 each at apremium of Rs. 270 per share aggregating to Rs. 30,500 million. The Bank has also over allocated 16,071,429equity shares of Rs.10 each at a price of Rs. 280 per equity share (fully paid up) under the green shoe option.
A. SIGNIFICANT ACCOUNTING POLICIES
1. Revenue Recognition
(a) Interest income is recognised in the profit and loss account as it accrues except in the case ofnon-performing assets where it is recognised upon realization as per the prudential norms of Reserve Bank ofIndia. Accrual of income is also suspended considering economic conditions and other risk factors, on certainother loans, including certain projects under implementation, where the implementation has been significantlydelayed and in the opinion of the management significant uncertainties exist as to the final financial closure and/or date of completion of the project.
(b) Income from hire purchase operations is accrued by applying the interest rate implicit on outstandingbalances.
(c) Income from leases is calculated by applying the interest rate implicit in the lease to the net investmentoutstanding on the lease over the primary lease period. Leases effected from April 1, 2001 have been accountedas per accounting standard 19 on “Accounting for leases” issued by the Institute of Chartered Accountants ofIndia (“ICAI”).
F-149

(d) Income on discounted instruments is recognised over the tenure of the instrument on a constant yieldbasis.
(e) Dividend is accounted on an accrual basis when the right to receive the dividend is established.
(f) Fees received as a compensation of future interest sacrifice is amortised over the remaining period of thefacility.
(g) Arranger’s fee is accrued proportionately where more than 75% of the total amount of finance has beenarranged.
(h) All other fees are recognised upfront on their becoming due.
(i) Income arising from sell down of loan assets is recognised upfront net of future servicing cost of assetssold, expected prepayment premia and projected delinquencies and included in interest income.
(j) Guarantee commission is recognised over the period of the guarantee.
2. Investments
Investments are valued in accordance with the extant Reserve Bank of India guidelines on investmentclassification and valuation as under:
(a) All investments are categorised into ‘Held to Maturity’, ‘Available for sale’ and ‘Trading’.Reclassifications, if any, in any category are accounted for as per Reserve Bank of India guidelines. Undereach category the investments are further classified under (a) Government securities (b) other approvedsecurities (c) shares (d) bonds and debentures, (e) subsidiaries and joint ventures and (f) others.
(b) ‘Held to Maturity’ securities are carried at their acquisition cost or at amortised cost if acquired at apremium over the face value. A provision is made for other than temporary diminution.
(c) ‘Available for sale’ and ‘Trading’ securities are valued periodically as per Reserve Bank of Indiaguidelines.
The market/fair value for the purpose of periodical valuation of quoted investments included in the“Available for Sale” and “Held for Trading” categories is the market price of the scrip as available from thetrades/quotes on the stock exchanges, SGL account transactions, price list of Reserve Bank of India orprices declared by Primary Dealers Association of India jointly with Fixed Income Money Market andDerivatives Association (“FIMMDA”), periodically.
The market/fair value of unquoted SLR securities included in the ‘Available for Sale’ and ‘Trading’categories is as per the rates put out by FIMMDA.
The valuation of non-SLR securities, other than those quoted on the stock exchanges, wherever linkedto the Yield-to-Maturity (“YTM”) rates, is with a mark-up (reflecting associated credit risk) over the YTMrates for government securities put out by FIMMDA.
The unquoted equity shares are valued at the book value, if the latest balance sheet is available or at Re. 1.
Securities are valued scrip-wise and depreciation/appreciation aggregated for each category. Netappreciation in each basket if any, being unrealised, is ignored, while net depreciation is provided for.
(d) Costs such as brokerage, commission etc., pertaining to investments, paid at the time of acquisition,are charged to revenue.
(e) Broken period interest on debt instruments is treated as a revenue item.
F-150

(f) Investments in subsidiaries/joint ventures are categorised as “Held to Maturity” in accordance withReserve Bank of India guidelines.
(g) Profit on sale of investment in the ‘Held to Maturity’ category is credited to the revenue accountand thereafter is appropriated, (net of applicable taxes and statutory reserve requirements) to capital reserve.
(h) At each reporting year-end, security receipts issued by the asset reconstruction company are valuedin accordance with the guidelines applicable to non-SLR instruments prescribed by Reserve Bank of Indiafrom time to time. Accordingly, in case where the security receipts issued by the asset reconstructioncompany are limited to the actual realisation of the financial assets assigned to the instruments in theconcerned scheme, the Bank reckons the Net Asset Value (NAV), obtained from the asset reconstructioncompany from time to time, for valuation of such investments at each reporting period end.
3. Provisions/Write-offs on loans and other credit facilities
(a) All credit exposures are classified as per Reserve Bank of India guidelines, into performing andnon-performing assets. Further, non-performing assets are classified into sub-standard, doubtful and loss assetsbased on the criteria stipulated by Reserve Bank of India. Provisions are made on substandard and doubtful assetsat rates equal to or higher than those prescribed by Reserve Bank of India. The secured portion of the substandardand doubtful assets is provided for at 50% over a three-year period instead of five and a half years as prescribedby Reserve Bank of India. Loss assets and unsecured portion of doubtful assets are fully provided/written off.Additional provisions are made against specific non-performing assets over and above what is stated above, if inthe opinion of the management, increased provisions are necessary.
(b) For restructured/rescheduled assets, provision is made in accordance with the guidelines issued byReserve Bank of India, which requires the present value of the interest sacrifice be provided at the time ofrestructuring.
(c) In the case of other than restructured loan accounts classified as NPAs, the account is reclassified as“standard” account if arrears of interest and principal are fully paid by the borrower.
In respect of non-performing loan accounts subject to restructuring, asset category is upgraded to standardaccount if the borrower demonstrates, over a minimum period of one year, the ability to repay the loan inaccordance with the contractual terms.
(d) The Bank has incorporated the assets taken over from erstwhile ICICI Limited (“ICICI”) in its books atcarrying values as appearing in the books of ICICI with a provision made based on the fair valuation exercisecarried out by an independent firm. To the extent future provisions are required on the assets taken over fromICICI, the provision created on fair valuation of the assets at the time of the amalgamation is used.
(e) Amounts recovered against other debts written off in earlier years and provisions no longer considerednecessary in the context of the current status of the borrower are recognised in the Profit and Loss Account.
(f) In addition to the general provision of 0.25% made on standard assets in accordance with Reserve Bankof India guidelines the Bank maintains general provisions to cover potential credit losses which are inherent inany loan portfolio but not identified. For standard assets, additional general provisions are determined havingregard to overall portfolio quality, asset growth, economic conditions and other risk factors.
(g) In addition to the provisions required to be held according to the asset classification status, provisionsare held for individual country exposure (other than for home country). The countries are categorised into sevenrisk categories namely insignificant, low, moderate, high, very high, restricted and off-credit and provisioningmade on exposures exceeding 90 days on a graded scale ranging from 0.25% to 100%. For exposures withcontractual maturity of less than 90 days, 25% of the normal provision requirement is held. If the countryexposure (net) of the Bank in respect of each country does not exceed 2% of the total funded assets, no provisionis maintained on such country exposure.
F-151

4. Fixed assets and depreciation
(a) Premises and other fixed assets are carried at cost less accumulated depreciation. Depreciation is chargedover the estimated useful life of a fixed asset on a “straight line” basis. The rates of depreciation for fixed assets,which are not lower than the rates prescribed in schedule XIV of the Companies Act, 1956, are as follows:
Asset Depreciation Rate
Premises owned by the Bank . . . . . . . . . . . . . . . . . . . . . 1.63%Improvements to leasehold premises . . . . . . . . . . . . . . . 1.63% or over the lease period, whichever is higherATMs . . . . . . . . . . . . . . . . . . . . . . . . . . . . . . . . . . . . . . . 12.50%Plant and machinery like air conditioners, xerox
machines, etc. . . . . . . . . . . . . . . . . . . . . . . . . . . . . . . . 10%Furniture and fixtures . . . . . . . . . . . . . . . . . . . . . . . . . . . 15%Motor vehicles . . . . . . . . . . . . . . . . . . . . . . . . . . . . . . . . 20%Computers . . . . . . . . . . . . . . . . . . . . . . . . . . . . . . . . . . . 33.33%Others (including software and system development
expenses) . . . . . . . . . . . . . . . . . . . . . . . . . . . . . . . . . . 25%
(b) Depreciation on leased assets is made on a straight-line basis at the higher of the rates determined withreference to the primary period of lease and the rates specified in Schedule XIV to the Companies Act, 1956.
(c) Assets purchased/sold during the year are depreciated on the basis of actual number of days the asset hasbeen put to use.
(d) Items costing less than Rs. 5,000/- are depreciated at the rate of 100%.
5. Foreign currency transactions
(a) Income and expenditure items are translated at the exchange rates prevailing on the date of thetransaction. Monetary assets and liabilities are translated at closing exchange rates notified by the ForeignExchange Dealers’ Association of India (“FEDAI”) at the balance sheet date and the resulting profits/losses areincluded in the profit and loss account.
(b) Outstanding forward exchange contracts are stated at contracted rates and are revalued at the exchangerates notified by FEDAI for specified maturities and at interpolated rates for contracts of in-between maturities.The resultant gains or losses are recognised in the profit and loss account.
(c) Contingent Liabilities on account of guarantees, endorsements and other obligations are stated at theexchange rates notified by FEDAI at the balance sheet date.
6. Accounting for derivative contracts
The Bank enters into derivative contracts such as foreign currency options, interest rate and currency swapsand cross currency interest rate swaps to hedge on-balance sheet assets and liabilities or for trading purposes.
The swap contracts entered to hedge on-balance sheet assets and liabilities are structured in such a way thatthey bear an opposite and offsetting impact with the underlying on-balance sheet items. The impact of suchderivative instruments are correlated with the movement of underlying assets and accounted pursuant to theprinciples of hedge accounting.
Trading swaps and foreign currency options, outstanding at the balance sheet date are marked to market, andthe resulting loss, if any, is recorded in the profit and loss account.
F-152

7. Employee Stock Option Scheme (“ESOS”)
The Bank has formulated an Employees Stock Option Scheme. The scheme provides that employees aregranted an option to acquire equity shares of the Bank that vests in graded manner. The options may be exercisedwithin a specified period. The Bank follows the intrinsic value method for computing the compensation cost, ifany, for all options granted.
8. Staff retirement benefits
For employees covered under group gratuity scheme and group superannuation scheme of LIC, gratuity andsuperannuation charge to profit and loss account is on the basis of premium charged by LIC. Provision forgratuity and pension for other employees and leave encashment liability are determined as per actuarialvaluation. Defined contributions for Provident Fund are charged to the Profit and Loss account based oncontributions made in terms of the scheme.
The Bank provides for pension, a deferred retirement plan covering certain employees. The plan providesfor a pension payment on a monthly basis to these employees on their retirement based on the respectiveemployee’s salary and years of employment with the Bank. Employees covered by the pension plan are noteligible for benefits under the provident fund plan, a defined contribution plan. The pension plan is fundedthrough periodic contributions to a fund set-up by the Bank and administered by a Board of Trustees. Suchcontributions are actuarially determined.
9. Income taxes
Income tax expense is the aggregate amount of current tax and deferred tax charge. Current year taxes aredetermined in accordance with the Income Tax Act, 1961. Deferred tax adjustments comprise of changes in thedeferred tax assets or liabilities during the period.
Deferred tax assets and liabilities are recognised for the future tax consequences of timing differencesarising between the carrying values of assets and liabilities and their respective tax basis and operating carryforward losses. Deferred tax assets are recognised only after giving due consideration to prudence. Deferred taxasset and liabilities are measured using tax rates and tax laws that have been enacted or substantially enacted bythe balance sheet date. The impact on account of changes in the deferred tax assets and liabilities is alsorecognised in the income statement.
Deferred tax assets are recognised and reassessed at each year end, based upon management’s judgment asto whether realisation is considered reasonably certain. Deferred tax assets are recognised on carry forward ofunabsorbed depreciation and tax losses only if there is virtual certainty that such deferred tax asset can berealised against future profits.
10. Translation of the financial statements of foreign offices
In accordance with the guidelines issued by Reserve Bank of India, all assets, liabilities, income andexpenditure of the foreign representative offices and branches of the Bank have been converted at the closing rateprevailing on the balance sheet date. The resultant gains or losses are recognised in the profit and loss account.
B. NOTES FORMING PART OF THE ACCOUNTS
1. Information about business and geographical segments
The Bank reports its operations into the following segments:
• Consumer and Commercial Banking comprising the retail and corporate banking business of the Bank.
• Investment Banking comprising the treasury of the Bank.
F-153

Inter segment transactions are generally based on transfer pricing measures as determined by management.Income, expenses, assets and liabilities are either specifically identified with individual segments or are allocatedto segments on a systematic basis.
Based on such allocations, segmental Balance Sheet as on March 31, 2004 and segmental Profit & Lossaccount for the year ended March 31, 2004 have been prepared.
Consumer andcommercial banking Investment banking Total
Particulars
For theyear ended31st March,
2004
For theyear ended31st March,
2003
For theyear ended31st March,
2004
For theyear ended31st March,
2003
For theyear ended31st March,
2004
For theyear ended31st March,
2003
Rupees in million
Revenue . . . . . . . . . . . . . . . . . . . . 95,819.3 92,717.0 34,819.3 29,157.5 130,638.6 121,874.5Less: Inter segment revenue . . . . — — — — (11,049.0) (8,515.6)Total revenue (1)-(2) . . . . . . . . . . — — — — 119,589.6 113,358.9Operating profit (i.e. Profit before
unallocated expenses,extraordinary profit, andtax) . . . . . . . . . . . . . . . . . . . . . . 12,984.2 9,456.0 10,996.6 4,346.1 23,980.8 13,802.1
Unallocated expenses . . . . . . . . . . 256.0Profit on sale of shares of ICICI
Bank Limited held by erstwhileICICI Limited . . . . . . . . . . . . . . — — — 11,910.0 — 11,910.0
Provisions (net) . . . . . . . . . . . . . . 5,542.8 17,305.7 (840.1) 602.4 4,702.7 17,908.1Profit before tax . . . . . . . . . . . . . . 7,441.4 (7,849.7) 11,836.7 15,653.7 19,022.1 7,804.0Income tax expenses (net)/(net
deferred tax credit) . . . . . . . . . . — — — — 2,651.1 (4,257.8)Net profit (8)-(9) . . . . . . . . . . . . . — — — — 16,371.0 12,061.8Segment assets . . . . . . . . . . . . . . . 771,726.4 685,550.8 454,527.0 363,550.4 1,226,253.4 1,049,101.2Unallocated assets . . . . . . . . . . . . — — — — 26,035.3 19,018.5Total assets (11)+(12) . . . . . . . . . — — — — 1,252,288.7 1,068,119.7Segment liabilities . . . . . . . . . . . . 978,706.4 800,361.9 273,582.3 267,757.8 1,252,288.7 1,068,119.7Unallocated liabilities . . . . . . . . . — — — — — —Total liabilities (14)+(15) . . . . . . . 978,706.4 800,361.9 273,582.3 267,757.8 1,252,288.7 1,068,119.7
The business operations of the Bank are largely concentrated in India. Activities outside India are restrictedto resource mobilisation in international markets. The assets and income from foreign operations are notsignificant to the overall operations of the Bank and have accordingly not been disclosed.
2. Preference shares
Certain government securities amounting to Rs. 1,455.1 million (March 31, 2003: Rs. 1,244.8 million) havebeen earmarked against redemption of preference share capital, which falls due for redemption on April 20, 2018as per the original issue terms.
3. Subordinated debt
Subordinated debt includes index bonds amounting to Rs. 110.4 million (March 31, 2003: Rs. 95.8 million)which carry a detachable warrant entitling bondholders to a right to receive an amount linked to the BSESensitive Index (Sensex) per terms of the issue. The liability of the Bank arising out of changes in the Sensex hasbeen hedged by earmarking its investments of an equivalent amount in the UTI Index Equity Fund whose valueis based on the Sensex. The Bank has not issued any subordinated debt during the year.
F-154
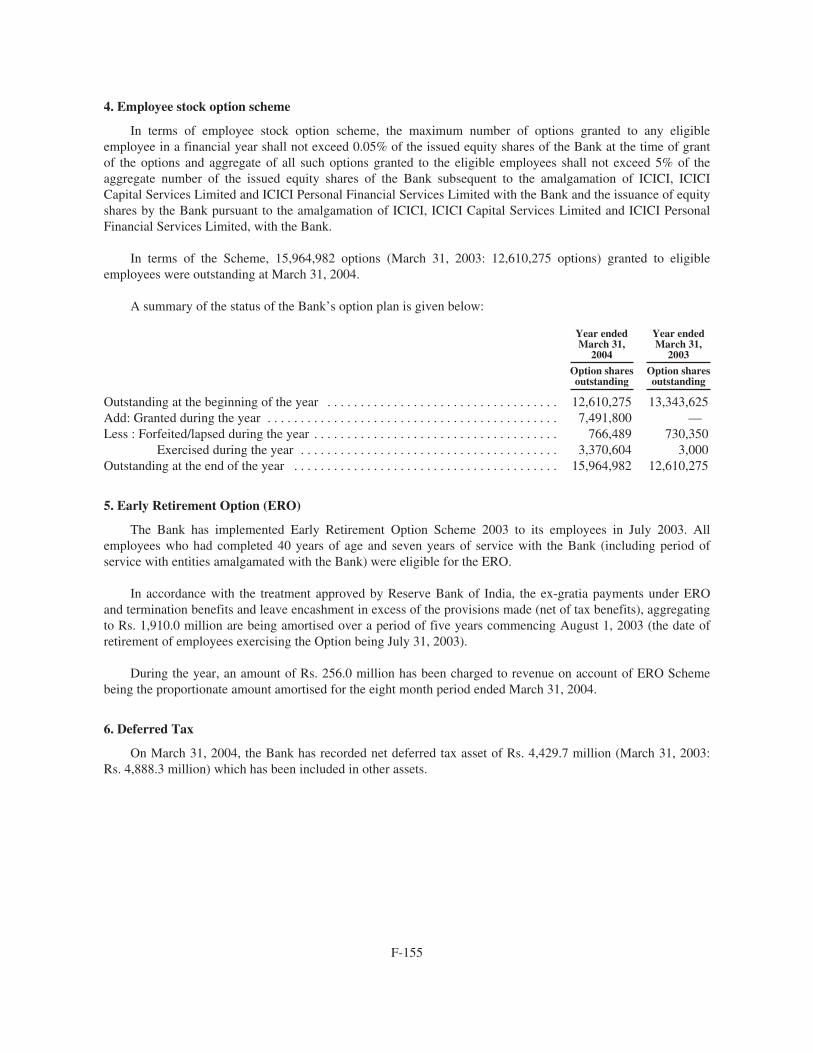
4. Employee stock option scheme
In terms of employee stock option scheme, the maximum number of options granted to any eligibleemployee in a financial year shall not exceed 0.05% of the issued equity shares of the Bank at the time of grantof the options and aggregate of all such options granted to the eligible employees shall not exceed 5% of theaggregate number of the issued equity shares of the Bank subsequent to the amalgamation of ICICI, ICICICapital Services Limited and ICICI Personal Financial Services Limited with the Bank and the issuance of equityshares by the Bank pursuant to the amalgamation of ICICI, ICICI Capital Services Limited and ICICI PersonalFinancial Services Limited, with the Bank.
In terms of the Scheme, 15,964,982 options (March 31, 2003: 12,610,275 options) granted to eligibleemployees were outstanding at March 31, 2004.
A summary of the status of the Bank’s option plan is given below:
Year endedMarch 31,
2004
Year endedMarch 31,
2003
Option sharesoutstanding
Option sharesoutstanding
Outstanding at the beginning of the year . . . . . . . . . . . . . . . . . . . . . . . . . . . . . . . . . . . 12,610,275 13,343,625Add: Granted during the year . . . . . . . . . . . . . . . . . . . . . . . . . . . . . . . . . . . . . . . . . . . . 7,491,800 —Less : Forfeited/lapsed during the year . . . . . . . . . . . . . . . . . . . . . . . . . . . . . . . . . . . . . 766,489 730,350
Exercised during the year . . . . . . . . . . . . . . . . . . . . . . . . . . . . . . . . . . . . . . . 3,370,604 3,000Outstanding at the end of the year . . . . . . . . . . . . . . . . . . . . . . . . . . . . . . . . . . . . . . . . 15,964,982 12,610,275
5. Early Retirement Option (ERO)
The Bank has implemented Early Retirement Option Scheme 2003 to its employees in July 2003. Allemployees who had completed 40 years of age and seven years of service with the Bank (including period ofservice with entities amalgamated with the Bank) were eligible for the ERO.
In accordance with the treatment approved by Reserve Bank of India, the ex-gratia payments under EROand termination benefits and leave encashment in excess of the provisions made (net of tax benefits), aggregatingto Rs. 1,910.0 million are being amortised over a period of five years commencing August 1, 2003 (the date ofretirement of employees exercising the Option being July 31, 2003).
During the year, an amount of Rs. 256.0 million has been charged to revenue on account of ERO Schemebeing the proportionate amount amortised for the eight month period ended March 31, 2004.
6. Deferred Tax
On March 31, 2004, the Bank has recorded net deferred tax asset of Rs. 4,429.7 million (March 31, 2003:Rs. 4,888.3 million) which has been included in other assets.
F-155

A composition of deferred tax assets and liabilities into major items is given below:
ParticularsMarch 31,
2004March 31,
2003
Rupees in million
Deferred tax assetAmortization of premium on investments . . . . . . . . . . . . . . . . . . . . . . . . . . . . . . . . . . . . . . . — 527.4Provision for bad and doubtful debts . . . . . . . . . . . . . . . . . . . . . . . . . . . . . . . . . . . . . . . . . . . 13,434.1 12,988.7Others . . . . . . . . . . . . . . . . . . . . . . . . . . . . . . . . . . . . . . . . . . . . . . . . . . . . . . . . . . . . . . . . . . . 202.4 855.3
13,636.5 14,371.4Less: Deferred tax liability
Depreciation on fixed assets . . . . . . . . . . . . . . . . . . . . . . . . . . . . . . . . . . . . . . . . . . 8,970.6 9,246.9Others . . . . . . . . . . . . . . . . . . . . . . . . . . . . . . . . . . . . . . . . . . . . . . . . . . . . . . . . . . . 236.2 236.2
9,206.8 9,483.1Net Deferred Tax Asset/(Liability) . . . . . . . . . . . . . . . . . . . . . . . . . . . . . . . . . . . . . . . . . . . 4,429.7 4,888.3
7. Related party transactions
The Bank has transactions with its subsidiaries (including joint ventures), associates (including jointventures) and directors. The following represent the significant transactions between the Bank and such relatedparties:
Insurance services
During the year ended March 31, 2004 the Bank paid insurance premium to insurance joint venturesamounting to Rs. 157.2 million (2003: Rs. 163.7 million). During the year ended March 31, 2004 the Bankreceived claims from insurance subsidiaries amounting to Rs. 85.6 million (2003: Rs. 58.0 million).
Fees
During the year ended March 31, 2004 the Bank received fees from its insurance joint ventures amountingto Rs. 65.3 million (2003: Rs. 17.1 million).
Lease of premises and facilities
During the year ended March 31, 2004, the Bank received for lease of premises, facilities and otheradministrative costs from subsidiaries and joint ventures amounting to Rs. 361.9 million (2003: Rs. 247.4million).
Sale of housing loan portfolio
During the year ended March 31, 2004, the Bank has sold housing loan portfolio to its subsidiariesamounting to Rs. 18,317.2 million (2003: Rs. NIL).
Secondment of employees
During the year ended March 31, 2004, the Bank received Rs. 14.2 million (2003: Rs. 27.7 million) fromsubsidiaries and joint ventures for secondment of employees.
Sale of investments
During the year ended March 31, 2004, the Bank sold certain investments to its associates amounting toRs. 3,234.1 million (2003: Rs. 2,369.2 million). On the sales made to the associates, the Bank accounted for again of Rs. 199.2 million (2003: Rs. 542.7 million).
F-156

Reimbursement of expenses
During the year ended March 31, 2004, the Bank reimbursed expenses to its subsidiaries amounting toRs. 2,075.7 million (2003: Rs. 1,422.3 million).
Brokerage paid
During the year ended March 31, 2004, the Bank paid brokerage to its subsidiaries amounting toRs. 5.7 million (2003: Rs. 1.5 million).
Custodial charges received
During the year ended March 31, 2004, the Bank received custodial charges from its associates amountingto Rs. 4.7 million (2003: Rs. 7.6 million).
Interest paid
During the year ended March 31, 2004, the Bank paid interest to its subsidiaries and joint venturesamounting to Rs. 67.9 million (2003: Rs. 118.8 million) and to its associates amounting to Rs. 9.5 million (2003:Rs. 0.9 million).
Interest received
During the year ended March 31, 2004 the Bank received interest from its subsidiaries and joint venturesamounting to Rs. 327.2 million (2003: Rs. 471.2 million) and from its Key Management Personnel(1)
Rs. 0.4 million (2003: Rs. 0.5 million).
Dividend received
During the year ended March 31, 2004 the Bank received dividend from its subsidiaries and joint venturesamounting to Rs. 1,289.7 million (2003: Rs. 1,094.2 million).
Remuneration to directors
Remuneration paid to the executive directors of the Bank during the year ended March 31, 2004 wasRs. 58.5 million (2003: Rs. 41.0 million)
Related party balances
The following balances payable to/receivable from subsidiaries/joint ventures/associates/key managementpersonnel are included in the balance sheet as on March 31, 2004:
Items/related partySubsidiaries/joint ventures Associates
Key managementpersonnel(1) Total
Rupees in million
Deposits . . . . . . . . . . . . . . . . . . . . . . . . . . . . . . . . . . . . . . 2,021.2 37.3 23.1 2,081.6Advances . . . . . . . . . . . . . . . . . . . . . . . . . . . . . . . . . . . . . 2,426.0 800.0 10.2 3,236.2Investments . . . . . . . . . . . . . . . . . . . . . . . . . . . . . . . . . . . . 14,303.6 15,942.5 — 30,246.1Receivables . . . . . . . . . . . . . . . . . . . . . . . . . . . . . . . . . . . . 315.1 8.0 — 323.1Payables . . . . . . . . . . . . . . . . . . . . . . . . . . . . . . . . . . . . . . 739.4 0.5 — 739.9
(1) wholetime directors and relatives
F-157

The following balances payable to/receivable from subsidiaries/joint ventures/associates/key managementpersonnel are included in the balance sheet as on March 31, 2003:
Items/related partySubsidiaries/joint
ventures AssociatesKey management
personnel(1) Total
Rupees in million
Deposits . . . . . . . . . . . . . . . . . . . . . . . . . . . . . . . . . . . . . . . 2,343.0 4.4 20.3 2,367.7Advances . . . . . . . . . . . . . . . . . . . . . . . . . . . . . . . . . . . . . . . 4,124.1 — 14.8 4,138.9Investments . . . . . . . . . . . . . . . . . . . . . . . . . . . . . . . . . . . . . 7,888.4 16,038.8 — 23,927.2Receivables . . . . . . . . . . . . . . . . . . . . . . . . . . . . . . . . . . . . . 349.4 0.4 — 349.8Payables . . . . . . . . . . . . . . . . . . . . . . . . . . . . . . . . . . . . . . . 194.5 0.9 — 195.4
(1) wholetime directors and relatives
Subsidiaries and joint ventures
ICICI Venture Funds Management Company Limited, ICICI Securities Limited, ICICI Brokerage ServicesLimited, ICICI International Limited, ICICI Trusteeship Services Limited, ICICI Home Finance CompanyLimited, ICICI Investment Management Company Limited, ICICI Securities Holdings Inc., ICICI Securities Inc.,ICICI Bank UK Limited, ICICI Bank Canada, ICICI Prudential Life Insurance Company Limited, ICICIDistribution Finance Private. Limited and ICICI Lombard General Insurance Company Limited, Prudential ICICIAsset Management Company Limited, Prudential ICICI Trust Limited.
Associates
ICICI Equity Fund, ICICI Eco-net Internet and Technology Fund, ICICI Emerging Sectors Fund, ICICIStrategic Investments Fund, ICICI Property Trust, and TCW/ICICI Investment Partners L.L.C.
8. Earnings Per Share (“EPS”)
The Bank reports basic and diluted earnings per equity share in accordance with Accounting Standard-20,“Earnings per Share”. Basic earning per share is computed by dividing net profit after tax by the weightedaverage number of equity shares outstanding during the year. Diluted earning per share is computed using theweighted average number of equity shares and dilutive potential equity shares outstanding during the year.
The computation of Earnings per share is given below:
March 31,2004
March 31,2003
Rupees in millionexcept per share data
BasicWeighted average no. of equity shares outstanding (Nos) . . . . . . . . . . . . . . . . . . . . . 614,157,868 613,031,569Net profit . . . . . . . . . . . . . . . . . . . . . . . . . . . . . . . . . . . . . . . . . . . . . . . . . . . . . . . . . . . 16,371.0 12,061.8Basic earnings per share (Rs.) . . . . . . . . . . . . . . . . . . . . . . . . . . . . . . . . . . . . . . . . . . . 26.66 19.68
Diluted Earning per shareWeighted average no. of equity shares . . . . . . . . . . . . . . . . . . . . . . . . . . . . . . . . . . . . 619,201,380 613,750,295Net profit . . . . . . . . . . . . . . . . . . . . . . . . . . . . . . . . . . . . . . . . . . . . . . . . . . . . . . . . . . . 16,371.0 12,061.8Diluted earnings per share (Rs.) . . . . . . . . . . . . . . . . . . . . . . . . . . . . . . . . . . . . . . . . . 26.44 19.65Nominal value per share (Rs.) . . . . . . . . . . . . . . . . . . . . . . . . . . . . . . . . . . . . . . . . . . . 10.00 10.00
The dilutive impact is mainly due to options issued to employees by the Bank.
F-158

9. Assets under lease
9.1 Assets under operating lease
The future lease rentals are given below:
PeriodMarch 31,
2004March 31,
2003
Rupees in million
Not later than one year . . . . . . . . . . . . . . . . . . . . . . . . . . . . . . . . . . . . . . . . . . . . . . . . . . . . . . 229.6 108.5Later than one year and not later than five years . . . . . . . . . . . . . . . . . . . . . . . . . . . . . . . . . . 974.9 537.9Later than five years . . . . . . . . . . . . . . . . . . . . . . . . . . . . . . . . . . . . . . . . . . . . . . . . . . . . . . . . 571.0 472.0
Total . . . . . . . . . . . . . . . . . . . . . . . . . . . . . . . . . . . . . . . . . . . . . . . . . . . . . . . . . . . . . . . . 1,775.5 1,118.4
9.2 Assets under finance lease
The future lease rentals are given below:
PeriodMarch 31,
2004March 31,
2003
Rupees in million
Total of future minimum lease payments . . . . . . . . . . . . . . . . . . . . . . . . . . . . . . . . . . . . . . . . 1,792.9 1,161.0Present value of lease payments . . . . . . . . . . . . . . . . . . . . . . . . . . . . . . . . . . . . . . . . . . . . . . . 1,417.8 818.1Unmatured finance charges . . . . . . . . . . . . . . . . . . . . . . . . . . . . . . . . . . . . . . . . . . . . . . . . . . . 375.1 342.9Maturity profile of total of future minimum lease paymentsNot later than one year . . . . . . . . . . . . . . . . . . . . . . . . . . . . . . . . . . . . . . . . . . . . . . . . . . . . . . 397.0 166.0Later than one year and not later than five years . . . . . . . . . . . . . . . . . . . . . . . . . . . . . . . . . . 1,255.6 831.9Later than five years . . . . . . . . . . . . . . . . . . . . . . . . . . . . . . . . . . . . . . . . . . . . . . . . . . . . . . . . 140.3 163.1
Total . . . . . . . . . . . . . . . . . . . . . . . . . . . . . . . . . . . . . . . . . . . . . . . . . . . . . . . . . . . . . . . . 1,792.9 1,161.0
10. Additional disclosures
The following additional disclosures have been made taking into account Reserve Bank of India guidelinesin this regard.
10.1 Capital adequacy ratio
The Capital to Weighted Risk Assets Ratio (CRAR) as assessed by the Bank on the basis of the attachedfinancial statements and guidelines issued by Reserve Bank of India is given in the table below:
March 31,2004
March 31,2003
Rupees in million
Tier I capital* . . . . . . . . . . . . . . . . . . . . . . . . . . . . . . . . . . . . . . . . . . . . . . . . . . . . . . . . . . . 55,250.9 58,072.3Tier II capital . . . . . . . . . . . . . . . . . . . . . . . . . . . . . . . . . . . . . . . . . . . . . . . . . . . . . . . . . . . . 38,756.9 33,387.5Total capital . . . . . . . . . . . . . . . . . . . . . . . . . . . . . . . . . . . . . . . . . . . . . . . . . . . . . . . . . . . . . 94,007.8 91,459.8Total risk weighted assets . . . . . . . . . . . . . . . . . . . . . . . . . . . . . . . . . . . . . . . . . . . . . . . . . . 907,340.2 823,805.4Capital ratios (percent)Tier I . . . . . . . . . . . . . . . . . . . . . . . . . . . . . . . . . . . . . . . . . . . . . . . . . . . . . . . . . . . . . . . . . . 6.09 % 7.05 %Tier II . . . . . . . . . . . . . . . . . . . . . . . . . . . . . . . . . . . . . . . . . . . . . . . . . . . . . . . . . . . . . . . . . . 4.27 % 4.05 %Total capital . . . . . . . . . . . . . . . . . . . . . . . . . . . . . . . . . . . . . . . . . . . . . . . . . . . . . . . . . . . . . 10.36 % 11.10 %
* Tier I Capital includes the preference shares, which are due for redemption in 2018, as reduced by theamount of corpus created in accordance with Reserve Bank of India guidelines
F-159

10.2 Business/information ratios
The business/information ratios for the period ended March 31, 2004 and March 31, 2003 are given in thetable below:
March 31,2004
March 31,2003
Rupees in millionInterest income to working funds (percent) . . . . . . . . . . . . . . . . . . . . . . . . . . . . . . . . . . . . . . 7.83% 9.07%Non-interest income to working funds (percent) . . . . . . . . . . . . . . . . . . . . . . . . . . . . . . . . . . 2.70% 1.91%Operating profit to working funds (percent) . . . . . . . . . . . . . . . . . . . . . . . . . . . . . . . . . . . . . . 2.09% 2.49%Return on assets (percent) . . . . . . . . . . . . . . . . . . . . . . . . . . . . . . . . . . . . . . . . . . . . . . . . . . . . 1.31% 1.13%Business per employee (average deposits plus average advances) . . . . . . . . . . . . . . . . . . . . . 101.0 112.0Profit per employee . . . . . . . . . . . . . . . . . . . . . . . . . . . . . . . . . . . . . . . . . . . . . . . . . . . . . . . . . 1.2 1.1Net non-performing advances (funded) to net advances (percent) . . . . . . . . . . . . . . . . . . . . . 2.21% 5.21%
For the purpose of computing the above ratios, working funds represent the average of total assets asreported to Reserve Bank of India under section 27 of the Banking Regulation Act, 1949.
10.3 Maturity pattern
(a) Rupee denominated assets and liabilities as on March 31, 2004
The maturity pattern of rupee denominated assets and liabilities of the Bank as on March 31, 2004 is givenbelow:
Maturity bucketsLoans &advances
Investmentsecurities Deposits Borrowings
Rupees in million1 to 14 days . . . . . . . . . . . . . . . . . . . . . . . . . . . . . . . . . . . . . . . . . 21,863.1 52,235.7 53,572.2 5,689.315 to 28 days . . . . . . . . . . . . . . . . . . . . . . . . . . . . . . . . . . . . . . . . 4,243.7 27,548.3 16,595.3 6,264.229 days to 3 months . . . . . . . . . . . . . . . . . . . . . . . . . . . . . . . . . . . 11,904.6 32,787.9 72,534.5 6,935.93 to 6 months . . . . . . . . . . . . . . . . . . . . . . . . . . . . . . . . . . . . . . . . 18,735.3 32,621.3 85,839.2 19,097.46 months to 1 year . . . . . . . . . . . . . . . . . . . . . . . . . . . . . . . . . . . . 74,242.4 41,537.8 107,581.2 32,956.41 to 3 years . . . . . . . . . . . . . . . . . . . . . . . . . . . . . . . . . . . . . . . . . 167,247.8 117,207.9 294,475.0 102,112.93 to 5 years . . . . . . . . . . . . . . . . . . . . . . . . . . . . . . . . . . . . . . . . . 86,467.4 22,447.7 19,556.9 22,224.5Above 5 years . . . . . . . . . . . . . . . . . . . . . . . . . . . . . . . . . . . . . . . 170,790.7 101,042.0 7,897.7 24,741.7
Total . . . . . . . . . . . . . . . . . . . . . . . . . . . . . . . . . . . . . . . . . . 555,495.0 427,428.6 658,052.0 220,022.3
(b) Rupee denominated assets and liabilities as on March 31, 2003
The maturity pattern of rupee denominated assets and liabilities of the Bank as on March 31, 2003 is givenbelow:
Maturity bucketsLoans &advances
Investmentsecurities Deposits Borrowings
Rupees in million1 to 14 days . . . . . . . . . . . . . . . . . . . . . . . . . . . . . . . . . . . . . . . . . 14,165.3 32,828.6 40,141.0 6,715.715 to 28 days . . . . . . . . . . . . . . . . . . . . . . . . . . . . . . . . . . . . . . . . 1,810.0 21,956.9 14,275.7 3,035.429 days to 3 months . . . . . . . . . . . . . . . . . . . . . . . . . . . . . . . . . . . 18,592.5 36,459.5 67,790.7 17,445.03 to 6 months . . . . . . . . . . . . . . . . . . . . . . . . . . . . . . . . . . . . . . . . 17,052.9 18,736.1 26,369.2 18,111.56 months to 1 year . . . . . . . . . . . . . . . . . . . . . . . . . . . . . . . . . . . . 40,059.6 43,943.5 102,763.0 49,366.11 to 3 years . . . . . . . . . . . . . . . . . . . . . . . . . . . . . . . . . . . . . . . . . 148,660.2 110,286.9 198,621.2 129,667.83 to 5 years . . . . . . . . . . . . . . . . . . . . . . . . . . . . . . . . . . . . . . . . . 81,199.1 22,173.4 10,631.5 22,079.9Above 5 years . . . . . . . . . . . . . . . . . . . . . . . . . . . . . . . . . . . . . . . 142,587.7 68,238.2 6,885.0 28,231.6
Total . . . . . . . . . . . . . . . . . . . . . . . . . . . . . . . . . . . . . . . . . . 464,127.3 354,623.1 467,477.3 274,653.0
F-160

(c) Forex denominated assets and liabilities as on March 31, 2004
The maturity pattern of forex denominated assets and liabilities as on March 31, 2004 is given below:
Maturity bucketsLoans &advances
Balances withbanks and moneyat call and short
notice Deposits Borrowings
Rupees in million
1 to 14 days . . . . . . . . . . . . . . . . . . . . . . . . . . . . . . . . . . . . . . . 190.7 11,584.7 1,732.0 1,540.615 to 28 days . . . . . . . . . . . . . . . . . . . . . . . . . . . . . . . . . . . . . . 404.0 1,862.4 543.7 3,668.829 days to 3 months . . . . . . . . . . . . . . . . . . . . . . . . . . . . . . . . . 2,091.2 2,535.6 1,623.1 6,664.23 to 6 months . . . . . . . . . . . . . . . . . . . . . . . . . . . . . . . . . . . . . . 1,810.0 993.4 3,655.5 8,007.36 months to 1 year . . . . . . . . . . . . . . . . . . . . . . . . . . . . . . . . . . 12,969.6 — 5,131.6 11,519.31 to 3 years . . . . . . . . . . . . . . . . . . . . . . . . . . . . . . . . . . . . . . . 15,350.3 — 7,114.4 15,488.43 to 5 years . . . . . . . . . . . . . . . . . . . . . . . . . . . . . . . . . . . . . . . 9,623.9 — 1,663.5 22,985.5Above 5 years . . . . . . . . . . . . . . . . . . . . . . . . . . . . . . . . . . . . . 23,020.5 — 1,570.0 17,506.0
Total . . . . . . . . . . . . . . . . . . . . . . . . . . . . . . . . . . . . . . . . 65,460.2 16,976.1 23,033.8 87,380.1
(d) Forex denominated assets and liabilities as on March 31, 2003
The maturity pattern of forex denominated assets and liabilities as on March 31, 2003 is given below:
Maturity bucketsLoans &advances
Balances withbanks and
money at calland short
notice Deposits Borrowings
Rupees in million
1 to 14 days . . . . . . . . . . . . . . . . . . . . . . . . . . . . . . . . . . . . . . . . . . 341.3 2,770.2 677.7 1,579.215 to 28 days . . . . . . . . . . . . . . . . . . . . . . . . . . . . . . . . . . . . . . . . . 545.0 — 233.6 1.029 days to 3 months . . . . . . . . . . . . . . . . . . . . . . . . . . . . . . . . . . . 1,202.8 — 1,063.9 6,620.93 to 6 months . . . . . . . . . . . . . . . . . . . . . . . . . . . . . . . . . . . . . . . . 2,003.3 — 1,610.2 8,591.36 months to 1 year . . . . . . . . . . . . . . . . . . . . . . . . . . . . . . . . . . . . 6,889.3 — 3,603.0 10,132.71 to 3 years . . . . . . . . . . . . . . . . . . . . . . . . . . . . . . . . . . . . . . . . . . 17,575.2 — 7,026.7 9,834.93 to 5 years . . . . . . . . . . . . . . . . . . . . . . . . . . . . . . . . . . . . . . . . . . 11,553.8 — 0.7 13,099.4Above 5 years . . . . . . . . . . . . . . . . . . . . . . . . . . . . . . . . . . . . . . . . 28,556.1 — — 18,511.8
Total . . . . . . . . . . . . . . . . . . . . . . . . . . . . . . . . . . . . . . . . . . 68,666.8 2,770.2 14,215.8 68,371.2
Notes
• In compiling the information of maturity pattern (refer 10.3 (a), 10.3 (b), 10.3 (c), 10.3 (d) above),certain estimates and assumptions have been made by the management, which have been relied uponby the auditors.
• Assets and liabilities in foreign currency exclude off-balance sheet assets and liabilities.
F-161

10.4 Advances
(i) Lending to sensitive sectors
The Bank has lending to sectors, which are sensitive to asset price fluctuations. Such sectors include capitalmarket, real estate and commodities. The net position of lending to sensitive sectors is given in the table below:
March 31,2004
March 31,2003
Rupees in million
Capital market sector* . . . . . . . . . . . . . . . . . . . . . . . . . . . . . . . . . . . . . . . . . . . . . . . . . . . . . . . 2,489.3 1,400.2Real estate sector . . . . . . . . . . . . . . . . . . . . . . . . . . . . . . . . . . . . . . . . . . . . . . . . . . . . . . . . . . . 25,172.3 20,941.8Commodities sector . . . . . . . . . . . . . . . . . . . . . . . . . . . . . . . . . . . . . . . . . . . . . . . . . . . . . . . . . 1,032.0 1,663.6
* Represents loans to NBFC brokers and individuals against pledge of shares
(ii) Movement of gross non-performing advances during the year
April 1, 2003 toMarch 31, 2004
April 1, 2002 toMarch 31, 2003
Rupees in million
Opening Balance . . . . . . . . . . . . . . . . . . . . . . . . . . . . . . . . . . . . . . . . . . . . . . . . . . . . 50,273.8 50,130.3Add: Additions during the year . . . . . . . . . . . . . . . . . . . . . . . . . . . . . . . . . . . . . . . . 14,194.3 11,937.7
64,468.1 62,068.0
Less: Reductions during the year . . . . . . . . . . . . . . . . . . . . . . . . . . . . . . . . . . . . . . . (33,992.2) (11,794.2)
Closing Balance* . . . . . . . . . . . . . . . . . . . . . . . . . . . . . . . . . . . . . . . . . . . . . . . . . . . 30,475.9 50,273.8
* Includes suspended interest and claims received from ECGC/DICGC of Rs. 501.8 million (previous yearRs 490.3 million) on working capital loans
(iii) Provision for non-performing advances
April 1, 2003 toMarch 31, 2004
April 1, 2002 toMarch 31, 2003
Rupees in million
Opening Balance . . . . . . . . . . . . . . . . . . . . . . . . . . . . . . . . . . . . . . . . . . . . . . . . . . . . 22,036.1 23,838.1Add: Provisions made during the year (including utilization of fair value
provisions) . . . . . . . . . . . . . . . . . . . . . . . . . . . . . . . . . . . . . . . . . . . . . . . . . . . . . . 7,318.1 6,704.8
29,354.2 30,542.9
Less: write-offs/recovery . . . . . . . . . . . . . . . . . . . . . . . . . . . . . . . . . . . . . . . . . . . . . (13,104.1) (8,506.8)
Closing Balance* . . . . . . . . . . . . . . . . . . . . . . . . . . . . . . . . . . . . . . . . . . . . . . . . . . . 16,250.1 22,036.1
F-162

(iv) Financial assets transferred during the year to Securitisation Company (SC)/Reconstruction Company (RC)
The Bank has transferred certain assets to an asset reconstruction company (ARC) in terms of the guidelinesissued by Reserve Bank of India governing such transfer. For the purpose of year end valuation of the underlyingsecurity receipts issued by ARC, pursuant to the accounting policy vide para 2 (h) of part A, their NAV is takenat the purchase consideration of the assets transferred since ARC has not intimated the NAV and the transfershave been effected close to March 31, 2004. The details of the assets transferred are given in the table below:
April 1, 2003 toMarch 31, 2004
Rupees inmillion
No. of accounts . . . . . . . . . . . . . . . . . . . . . . . . . . . . . . . . . . . . . . . . . . . . . . . . . . . . . . . . . . . . . . . . . 54Aggregate value (net of provisions) of accounts sold to SC/RC . . . . . . . . . . . . . . . . . . . . . . . . . . . . 12,506.2Aggregate consideration . . . . . . . . . . . . . . . . . . . . . . . . . . . . . . . . . . . . . . . . . . . . . . . . . . . . . . . . . . 12,439.5Additional consideration realised in respect of accounts transferred in earlier years . . . . . . . . . . . . NILAggregate gain/(loss) over net sale value . . . . . . . . . . . . . . . . . . . . . . . . . . . . . . . . . . . . . . . . . . . . . (66.7 )
(v) Information in respect of restructured assets
The Bank has restructured borrower accounts in standard, sub-standard and doubtful category. The grossamounts (net of write off) of restructuring during the year in respect of these accounts are given below:
April 1, 2003 toMarch 31, 2004
April 1, 2002 toMarch 31, 2003
Rupees in million
Standard assets subjected to restructuring . . . . . . . . . . . . . . . . . . . . . . . . . . . . . . . . 49,469.4 58,898.2Sub-standard assets subjected to restructuring . . . . . . . . . . . . . . . . . . . . . . . . . . . . . 1,409.0 1,766.4Doubtful assets subjected to restructuring . . . . . . . . . . . . . . . . . . . . . . . . . . . . . . . . 783.4 3,032.0
Total amount . . . . . . . . . . . . . . . . . . . . . . . . . . . . . . . . . . . . . . . . . . . . . . . . . 51,661.8 63,696.6
Excludes cases that were restructured and disclosed in the earlier years by the bank and subsequently confirmed/amended on being referred to and approved by the Corporate Debt Restructuring (CDR) scheme.
April 1, 2003 toMarch 31, 2004
April 1, 2002 toMarch 31, 2003
Rupees in million
Standard assets subjected to CDR . . . . . . . . . . . . . . . . . . . . . . . . . . . . . . . . . . . . . . 53,761.9 40,595.9Sub-standard assets subjected to CDR . . . . . . . . . . . . . . . . . . . . . . . . . . . . . . . . . . . 823.0 137.1Doubtful assets subjected to CDR . . . . . . . . . . . . . . . . . . . . . . . . . . . . . . . . . . . . . . — —
Total amount . . . . . . . . . . . . . . . . . . . . . . . . . . . . . . . . . . . . . . . . . . . . . . . . . 54,584.9 40,733.0
10.5 InvestmentsMarch 31, 2004 March 31, 2003
In India Outside India In India Outside India
Rupees in million
Gross value . . . . . . . . . . . . . . . . . . . . . . . . . . . . . . . . . . . . . . 433,052.1 3,674.1 370,454.5 356.7Less: Provision for depreciation and fair value provision . . . 9,233.2 64.4 15,917.2 271.0
Net value . . . . . . . . . . . . . . . . . . . . . . . . . . . . . . . . . . . . . . . . 423,818.9 3,609.7 354,537.3 85.7
F-163

Provision for depreciation on investmentsApril 1, 2003 toMarch 31, 2004
April 1, 2002 toMarch 31, 2003
Rupees in million
Opening balance . . . . . . . . . . . . . . . . . . . . . . . . . . . . . . . . . . . . . . . . . . . . . . . . . . . . 14,161.5 17,330.0Add : Provision made during the period (including utilization of fair value
provision) . . . . . . . . . . . . . . . . . . . . . . . . . . . . . . . . . . . . . . . . . . . . . . . . . . . . . . . (4,945.8) (3,168.5)Less : Transfer from investment fluctuation reserve . . . . . . . . . . . . . . . . . . . . . . . . — —Write-off during the period . . . . . . . . . . . . . . . . . . . . . . . . . . . . . . . . . . . . . . . . . . . . — —
Closing balance . . . . . . . . . . . . . . . . . . . . . . . . . . . . . . . . . . . . . . . . . . . . . . . . . . . . . 9,215.7 14,161.5
10.6 Investments in equity shares and equity like instrumentsMarch 31,
2004March 31,
2003
Rupees in million
Equity shares . . . . . . . . . . . . . . . . . . . . . . . . . . . . . . . . . . . . . . . . . . . . . . . . . . . . . . . . . . . . . . 6,818.2 6,330.2Convertible debentures . . . . . . . . . . . . . . . . . . . . . . . . . . . . . . . . . . . . . . . . . . . . . . . . . . . . . . 604.4 1,898.2Units of equity oriented mutual funds . . . . . . . . . . . . . . . . . . . . . . . . . . . . . . . . . . . . . . . . . . . 202.7 578.9Investment in venture capital funds . . . . . . . . . . . . . . . . . . . . . . . . . . . . . . . . . . . . . . . . . . . . 11,606.6 3,352.6Others (loans against collateral, advances to brokers) . . . . . . . . . . . . . . . . . . . . . . . . . . . . . . 5,515.8 1,400.2
Total . . . . . . . . . . . . . . . . . . . . . . . . . . . . . . . . . . . . . . . . . . . . . . . . . . . . . . . . . . . . . . . . 24,747.7 13,560.1
10.7 Repurchase transactions
The details of securities sold and purchased under repos and reverse repos during the period are givenbelow:
Minimumoutstanding
balanceduring the
year
Maximumoutstanding
balanceduring the
year
Daily averageoutstanding
balanceduring the
year
Balance as onMarch 31,
2004
Rupees in million
Securities sold under repurchase transaction . . . . . . . . . . . . . — 25,519.0 6,416.3 —Securities purchased under reverse repurchase
transaction . . . . . . . . . . . . . . . . . . . . . . . . . . . . . . . . . . . . . — 5,850.0 858.8 2,431.8
10.8 Investments in jointly controlled entities
Investments include Rs. 6,690.1 million (March 2003: 4,026.1 million) representing the Bank’s interests inthe following jointly controlled entities:
Sr. No. Name of the companyCountry/
Residence Percentage holding
1 ICICI Prudential Life Insurance Company Limited India 74.00%2 ICICI Lombard General Insurance Company Limited India 74.00%3 Prudential ICICI Asset Management Company Limited India **44.99%4 Prudential ICICI Trust Limited India **44.80%
** Indicates holding by ICICI Bank Limited along with its subsidiaries
F-164

The aggregate amounts of assets, liabilities, income and expenses as on March 31, 2004 and for the yearthen ended relating to the Bank’s interests in the above entities follow:
Liabilities Amount Assets Amount
Rupees in million Rupees in million
Capital and Reserves . . . . . . . . . . . . . 3,739.5 Cash and bank balances . . . . . . . . . 847.3Other liabilities . . . . . . . . . . . . . . . . . . 3,633.6 Investments . . . . . . . . . . . . . . . . . . . 15,126.4Liabilities on life policies in force . . . 10,610.5 Fixed assets . . . . . . . . . . . . . . . . . . 502.4
Other assets . . . . . . . . . . . . . . . . . . 1,507.5
Total . . . . . . . . . . . . . . . . . . . . . 17,983.6 Total 17,983.6
Expenses Amount Income Amount
Rupees in million Rupees in million
Interest expenses . . . . . . . . . . . . . . . . . 2.2 Interest income . . . . . . . . . . . . . . . . . 405.3Other expenses Other income . . . . . . . . . . . . . . . . . . .—Premium ceded and change in
liability for life policies in force . . . 4,888.2 —Insurance premium/commission . . 11,176.0—Others . . . . . . . . . . . . . . . . . . . . . . . 8,662.5 —Others . . . . . . . . . . . . . . . . . . . . . . . 824.2Provisions . . . . . . . . . . . . . . . . . . . . . . 135.2
Total . . . . . . . . . . . . . . . . . . . . . . . . . . 13,688.1 Total . . . . . . . . . . . . . . . . . . . . . . . . . . 12,405.5
10.9 Risk category-wise country-wise exposure
As per the extant Reserve Bank of India guidelines, the country exposure of the Bank is categorised intovarious risk categories listed in the following table. Since the country exposure (net) of the Bank in respect ofeach country does not exceed 2% of the total funded assets, no provision is required to be maintained on countryexposures.
Risk categoryExposure (net) ason March 31, 2004
Exposure (net) ason March 31, 2003
Rupees in million
Insignificant . . . . . . . . . . . . . . . . . . . . . . . . . . . . . . . . . . . . . . . . . . . . . . . . . . . 46,114.1 3,559.5Low . . . . . . . . . . . . . . . . . . . . . . . . . . . . . . . . . . . . . . . . . . . . . . . . . . . . . . . . . . 643.5 205.9Moderate . . . . . . . . . . . . . . . . . . . . . . . . . . . . . . . . . . . . . . . . . . . . . . . . . . . . . . 184.5 13.5High . . . . . . . . . . . . . . . . . . . . . . . . . . . . . . . . . . . . . . . . . . . . . . . . . . . . . . . . . 8.6 12.5
Total . . . . . . . . . . . . . . . . . . . . . . . . . . . . . . . . . . . . . . . . . . . . . . . . . . . . 46,950.7 3,791.4
10.10 Interest rate swaps (“IRS”)
The notional principal amount of Rupee IRS contracts as at March 31, 2004 is Rs. 34,150.0 million forhedging contracts (March 31, 2003: 29,730.0 million) and Rs. 947,837.8 million for trading contracts (March 31,2003: Rs. 348,337.8 million).
The fair value represents the estimated replacement cost of swap contracts as at balance sheet date. AtMarch 31, 2004 the fair value of trading rupee interest rate swap contracts is Rs. 669.2 million (March 31, 2003Rs. 308.8 million).
Associated credit risk is the loss that the Bank would incur in case all the counter parties to these swaps failto fulfill their contractual obligations. As at March 31, 2004, the associated credit risk on trading rupee interestrate swap contracts is Rs. 8,955.5 million (March 31, 2003: Rs. 2,358.6 million).
F-165

Market risk is monitored as the loss that would be incurred by the Bank for a 100 basis points rise in theinterest rates. As at March 31, 2004 the market risk on trading rupee interest rate swap contracts amounts toRs. 63.2 million (March 31, 2003: Rs. 38.1 million).
Credit risk concentration is measured as the highest net receivable under swap contracts from a particularcounter party. As at March 31, 2004 there is a credit risk concentration of Rs. 682.7 million (March 31, 2003:Rs. 246.7 million) under rupee interest rate swap contracts, with Standard Chartered Bank.
As per the prevailing market practice, collateral is not insisted on from the counter parties of these contracts.
11. Others
a. Credit exposure to
% age tocapitalfunds
% age tototal
exposure
% age tocapitalfunds
% age tototal
exposure
As at March 31,2004
As at March 31,2003
Single largest borrower . . . . . . . . . . . . . . . . . . . . . . . . . . . . . . . . . . . . . . . . 24.9% 2.2% 22.3% 2.4%Largest borrower group . . . . . . . . . . . . . . . . . . . . . . . . . . . . . . . . . . . . . . . 53.1% 4.6% 44.2% 4.8%Top ten single borrowers
No.1 . . . . . . . . . . . . . . . . . . . . . . . . . . . . . . . . . . . . . . . . . . . . . . . . . . 24.9% 2.2% 22.3% 2.4%No.2 . . . . . . . . . . . . . . . . . . . . . . . . . . . . . . . . . . . . . . . . . . . . . . . . . . 20.7% 1.8% 21.1% 2.3%No.3 . . . . . . . . . . . . . . . . . . . . . . . . . . . . . . . . . . . . . . . . . . . . . . . . . . 19.9% 1.7% 13.8% 1.5%No.4 . . . . . . . . . . . . . . . . . . . . . . . . . . . . . . . . . . . . . . . . . . . . . . . . . . 15.7% 1.4% 11.8% 1.3%No.5 . . . . . . . . . . . . . . . . . . . . . . . . . . . . . . . . . . . . . . . . . . . . . . . . . . 14.8% 1.3% 10.9% 1.2%No.6 . . . . . . . . . . . . . . . . . . . . . . . . . . . . . . . . . . . . . . . . . . . . . . . . . . 13.3% 1.2% 10.0% 1.1%No.7 . . . . . . . . . . . . . . . . . . . . . . . . . . . . . . . . . . . . . . . . . . . . . . . . . . 13.1% 1.1% 8.9% 1.0%No.8 . . . . . . . . . . . . . . . . . . . . . . . . . . . . . . . . . . . . . . . . . . . . . . . . . . 13.0% 1.1% 8.9% 1.0%No.9 . . . . . . . . . . . . . . . . . . . . . . . . . . . . . . . . . . . . . . . . . . . . . . . . . . 12.4% 1.1% 8.6% 0.9%No.10 . . . . . . . . . . . . . . . . . . . . . . . . . . . . . . . . . . . . . . . . . . . . . . . . . 10.5% 0.9% 8.2% 0.9%
Top ten borrower groupsNo.1 . . . . . . . . . . . . . . . . . . . . . . . . . . . . . . . . . . . . . . . . . . . . . . . . . . 53.1% 4.6% 44.2% 4.8%No.2 . . . . . . . . . . . . . . . . . . . . . . . . . . . . . . . . . . . . . . . . . . . . . . . . . . 47.1% 4.1% 28.1% 3.1%No.3 . . . . . . . . . . . . . . . . . . . . . . . . . . . . . . . . . . . . . . . . . . . . . . . . . . 25.7% 2.2% 28.1% 3.1%No.4 . . . . . . . . . . . . . . . . . . . . . . . . . . . . . . . . . . . . . . . . . . . . . . . . . . 24.4% 2.1% 25.2% 2.7%No.5 . . . . . . . . . . . . . . . . . . . . . . . . . . . . . . . . . . . . . . . . . . . . . . . . . . 22.7% 2.0% 19.1% 2.1%No.6 . . . . . . . . . . . . . . . . . . . . . . . . . . . . . . . . . . . . . . . . . . . . . . . . . . 21.0% 1.8% 18.5% 2.0%No.7 . . . . . . . . . . . . . . . . . . . . . . . . . . . . . . . . . . . . . . . . . . . . . . . . . . 16.4% 1.4% 14.3% 1.6%No.8 . . . . . . . . . . . . . . . . . . . . . . . . . . . . . . . . . . . . . . . . . . . . . . . . . . 16.2% 1.4% 11.8% 1.3%No.9 . . . . . . . . . . . . . . . . . . . . . . . . . . . . . . . . . . . . . . . . . . . . . . . . . . 15.7% 1.4% 11.4% 1.2%No.10 . . . . . . . . . . . . . . . . . . . . . . . . . . . . . . . . . . . . . . . . . . . . . . . . . 13.1% 1.2% 11.0% 1.2%
% age tototal
exposure
% age tototal
exposure
March 31,2004
March 31,2003
Five largest industrial sectorsNo.1 . . . . . . . . . . . . . . . . . . . . . . . . . . . . . . . . . . . . . . . . . . . . . . . . . . . . . . . . . . . . . . . . . 7.5% 10.1%No.2 . . . . . . . . . . . . . . . . . . . . . . . . . . . . . . . . . . . . . . . . . . . . . . . . . . . . . . . . . . . . . . . . . 7.3% 9.6%No.3 . . . . . . . . . . . . . . . . . . . . . . . . . . . . . . . . . . . . . . . . . . . . . . . . . . . . . . . . . . . . . . . . . 6.2% 8.5%No.4 . . . . . . . . . . . . . . . . . . . . . . . . . . . . . . . . . . . . . . . . . . . . . . . . . . . . . . . . . . . . . . . . . 5.3% 5.2%No.5 . . . . . . . . . . . . . . . . . . . . . . . . . . . . . . . . . . . . . . . . . . . . . . . . . . . . . . . . . . . . . . . . . 5.0% 4.9%
F-166

b. Exchange fluctuation
Exchange fluctuation aggregating Rs. 577.8 million (March 31, 2003: Rs. 923.6 million), which arises onaccount of rupee-tying agreements with the government of India, is held in “Exchange Fluctuation Suspense withGovernment Account” pending adjustment at maturity on receipt of payments from the Government forrepayments to foreign lenders.
c. Swap suspense (net)
Swap Suspense (net) aggregating Rs. 677.0 million (debit) (March 31, 2003: Rs. 128.7 million (debit)),which arises out of conversion of foreign currency swaps, is held in “Swap Suspense Account” and will bereversed at conclusion of swap transactions with swap counter parties.
d. Exchange Risk Administration Scheme
Under the Exchange Risk Administration Scheme (“ERAS”), the government of India has agreed to extendsupport to the Exchange Risk Administration Fund (“ERAF”), when it is in deficit and recoup its contribution inthe event of surplus. The Bank can claim from the positive balance in the ERAF account maintained by theIndustrial Development Bank of India (IDBI) to the extent of the deficit in the ERAS Exchange FluctuationAccount. If the balance in the ERAF account with IDBI is insufficient, a claim will be made on the governmentof India through IDBI. The government of India has foreclosed the scheme vide their letter F. No 6 (3)/2002-IF.1dated January 28, 2003. The total amount payable to the government of India under the scheme amounting toRs. 50.0 million has been included in Other Liabilities.
12. Proposed dividend
Proposed dividend includes the amount of dividend payable to the shareholders of the equity issue made inApril 2004 (excluding the shares over-allocated under the green shoe option).
13. Cash and cash equivalents
Cash and cash equivalents include cash in hand, balances with Reserve Bank of India, balances with otherbanks and money at call and short notice.
14. Contingent liability
The Income-tax authorities have disallowed deduction in respect of specific provisions for bad debts madeby erstwhile ICICI Limited in prior years on account of retrospective amendment to section 36 (1) (vii) of theIncome Tax Act, 1961 (the “Act”). The total potential tax impact of such disallowances is Rs. 2,765.9 million,which is included in the contingent liability and is disputed by the Bank in appeals. Based on a legal opinion, theBank is of the view that the disputed amount would alternatively be deductible under the provisions of the Act asbusiness loss. Further, as the provision is tax deductible in the year of write off, the Bank is eligible to create adeferred tax asset and accordingly, there is no revenue impact.
15. Comparative figures
Figures of the previous period have been regrouped to conform to the current year’s presentation.
F-167

SIGNATURES TO SCHEDULES 1 TO 18
For and on behalf of the Board of Directors
N. Vaghul K. V. Kamath Lalita D. GupteChairman Managing Director & CEO Joint Managing Director
Kalpana Morparia Nachiket Mor Chanda D. KochharDeputy Managing Director Executive Director Executive Director
N. S. Kannan Jyotin Mehta G. VenkatakrishnanChief Financial Officer & Treasurer General Manager &
Company SecretaryGeneral Manager—
Accounting andTaxation Group
Place: MumbaiDate: April 30, 2004
F-168

Cash flow statement for the year ended March 31, 2004
ParticularsYear ended31.03.2004
Year ended31.03.2003
(Rupees in ‘000s)Cash flow from operating activitiesNet profit before taxes . . . . . . . . . . . . . . . . . . . . . . . . . . . . . . . . . . . . . . . . . . . . . . . . . . . . . . . . . . . . . . . . . . . . . . 19,022,209 7,803,872Adjustments for:Depreciation on fixed assets . . . . . . . . . . . . . . . . . . . . . . . . . . . . . . . . . . . . . . . . . . . . . . . . . . . . . . . . . . . . . . . . . 5,394,413 5,059,415Net (appreciation)/depreciation on investments . . . . . . . . . . . . . . . . . . . . . . . . . . . . . . . . . . . . . . . . . . . . . . . . . . (96,484) 3,094,311Provision in respect of non-performing assets (including prudential provision on standard assets) . . . . . . . . . . . 4,591,155 14,749,848Provision for contingencies & others . . . . . . . . . . . . . . . . . . . . . . . . . . . . . . . . . . . . . . . . . . . . . . . . . . . . . . . . . . 207,936 63,900Income from subsidiaries (investing activity) . . . . . . . . . . . . . . . . . . . . . . . . . . . . . . . . . . . . . . . . . . . . . . . . . . . . (1,261,729) (1,094,240)Loss on sale of fixed assets . . . . . . . . . . . . . . . . . . . . . . . . . . . . . . . . . . . . . . . . . . . . . . . . . . . . . . . . . . . . . . . . . . 31,966 65,038
27,889,466 29,742,144
Adjustments for:(Increase)/decrease in Investments . . . . . . . . . . . . . . . . . . . . . . . . . . . . . . . . . . . . . . . . . . . . . . . . . . . . . . . . . . . . (63,609,871) 55,305,151(Increase)/decrease in Advances . . . . . . . . . . . . . . . . . . . . . . . . . . . . . . . . . . . . . . . . . . . . . . . . . . . . . . . . . . . . . . (91,992,620) (74,578,831)Increase/(decrease) in Borrowings . . . . . . . . . . . . . . . . . . . . . . . . . . . . . . . . . . . . . . . . . . . . . . . . . . . . . . . . . . . . (836,834 ) (36,519,614)Increase/(decrease) in Deposits . . . . . . . . . . . . . . . . . . . . . . . . . . . . . . . . . . . . . . . . . . . . . . . . . . . . . . . . . . . . . . . 199,392,782 160,841,952(Increase)/decrease in Other assets . . . . . . . . . . . . . . . . . . . . . . . . . . . . . . . . . . . . . . . . . . . . . . . . . . . . . . . . . . . . 2,450,798 (24,500,144)Increase/(decrease) in Other liabilities and provisions . . . . . . . . . . . . . . . . . . . . . . . . . . . . . . . . . . . . . . . . . . . . . 14,154,337 3,266,612
59,558,592 83,815,126Direct taxes paid . . . . . . . . . . . . . . . . . . . . . . . . . . . . . . . . . . . . . . . . . . . . . . . . . . . . . . . . . . . . . . . . . . . . . . . . . . (8,531,173) (6,438,190)
Net cash generated from operating activities (A) . . . . . . . . . . . . . . . . . . . . . . . . . . . . . . . . . . . . . . . . . . . . . . 78,916,885 107,119,080
Cash flow from investing activitiesInvestments in subsidiaries and/or joint ventures . . . . . . . . . . . . . . . . . . . . . . . . . . . . . . . . . . . . . . . . . . . . . . . . . (6,415,226) (1,739,493)Income received on such investments . . . . . . . . . . . . . . . . . . . . . . . . . . . . . . . . . . . . . . . . . . . . . . . . . . . . . . . . . . 1,261,729 1,094,240Purchase of fixed assets . . . . . . . . . . . . . . . . . . . . . . . . . . . . . . . . . . . . . . . . . . . . . . . . . . . . . . . . . . . . . . . . . . . . . (5,762,528) (4,516,874)Proceeds from sale of fixed assets . . . . . . . . . . . . . . . . . . . . . . . . . . . . . . . . . . . . . . . . . . . . . . . . . . . . . . . . . . . . . 369,695 102,090(Purchase)/Sale of hold to maturity (HTM) securities . . . . . . . . . . . . . . . . . . . . . . . . . . . . . . . . . . . . . . . . . . . . . . (2,684,030) (52,372,174)
Net cash generated from investing activities (B) . . . . . . . . . . . . . . . . . . . . . . . . . . . . . . . . . . . . . . . . . . . . . . . (13,230,360) (57,432,211)
Cash flow from financing activitiesAmount received on exercise of stock options & calls in arrears . . . . . . . . . . . . . . . . . . . . . . . . . . . . . . . . . . . . . 539,078 315Repayment of bonds (including subordinated debt) . . . . . . . . . . . . . . . . . . . . . . . . . . . . . . . . . . . . . . . . . . . . . . . (41,221,623) (112,660,657)Dividend and dividend tax paid . . . . . . . . . . . . . . . . . . . . . . . . . . . . . . . . . . . . . . . . . . . . . . . . . . . . . . . . . . . . . . . (5,187,662 ) —
Net cash generated from financing activities (C) . . . . . . . . . . . . . . . . . . . . . . . . . . . . . . . . . . . . . . . . . . . . . . . (45,870,207) (112,660,342)Cash and cash equivalents on amalgamation (D) . . . . . . . . . . . . . . . . . . . . . . . . . . . . . . . . . . . . . . . . . . . . . . — —
Net increase/(decrease) in cash and cash equivalents (A) + (B) + (C) + (D) . . . . . . . . . . . . . . . . . . . . . . . . . 19,816,318 (62,973,473)
Cash and cash equivalents as at 1st April . . . . . . . . . . . . . . . . . . . . . . . . . . . . . . . . . . . . . . . . . . . . . . . . . . . . 64,890,026 127,863,499Cash and cash equivalents as at 31st March . . . . . . . . . . . . . . . . . . . . . . . . . . . . . . . . . . . . . . . . . . . . . . . . . . 84,706,344 64,890,026
Cash and Cash equivalents represent ‘Cash and balance with Reserve Bank of India’ and ‘Balances with banks and money at call and shortnotice’.
The Schedules referred to above form an integral part of the Balance Sheet
As per our Report of even dateFor and on behalf of the Board of Directors
For S. R. Batliboi & Co. N. Vaghul K. V. Kamath Lalita D. GupteChartered Accountants Chairman Managing Director & CEO Joint Managing Director
per Viren H. Mehta Kalpana Morparia Chanda D. Kochhar Nachiket Mora Partner Deputy Managing Director Executive Director Executive Director
N. S. Kannan Jyotin Mehta G. VenkatakrishnanChief Financial Officer
& TreasurerGeneral Manager &Company Secretary
General Manager— Accountingand Taxation Group
Place: MumbaiDate: April 30, 2004
F-169

ISSUER
ICICI Bank LimitedICICI Bank Towers
Bandra-Kurla ComplexMumbai 400051
India
LEGAL ADVISORS
To the Issuer as to United States law
Davis Polk & Wardwell15, avenue Matignon
75008 ParisFrance
To the Initial Purchasers as toUnited States law
To the Initial Purchasers as to Indian law To the Trustee as toNew York law
Latham & Watkins99 Bishopsgate
London EC2M 3XFUnited Kingdom
Amarchand & Mangaldas & Suresh A. Shroff & Co.Peninsula Chambers, Peninsula Corporate Park
Ganpatrao Kadam MargLower Parel, Mumbai—400013
India
Clifford Chance29th Floor, Jardine House
One Connaught PlaceHong Kong
INDEPENDENT ACCOUNTANTS
B.S.R. & Co.Chartered Accountants
KPMG House, Kamala Mills Compound448, Senapati Bapat Marg
Lower Parel, Mumbai—400 013India
TRUSTEE & PAYING AGENT
The Bank of New York101 Barclay Street
New York, New York 10286U.S.A.
CALCULATION AGENT
The Bank of New York, London Branch48th Floor, One Canada Square
London E14 5ALUnited Kingdom

US$ 750,000,000
ICICI Bank Limited
6.375% Fixed to Floating Rate Subordinated Notes due April 30, 2022
OFFERING MEMORANDUM
Citigroup
Deutsche Bank Securities
Merrill Lynch International
January 9, 2007