ica2014 presentation final - confex€¦ · • earthquake magnitude and intensity –...
TRANSCRIPT

w w w . I C A 2 0 1 4 . o r g
The effect of observation errors on the assessment of insurance losses due to seismic activity
with an application in South Africa
Presented by: Samantha PretoriusICA 2014 – Washington DC
2 April 2014

Agenda• Background• Earthquake magnitude and intensity
– Frequency-magnitude Gutenberg-Richer relation and its parameters
– Uncertainty– Measuring Intensity
• Earthquakes and the insurance industry• Seismic Risk Assessment
– Background– Application: South Africa – Sensitivity tests
• Parameter uncertainty and Insured Risks
2

Earthquakes in South Africa
3
Tulbagh, Western Cape, 1969M= 6.3, MMI = VIII

Earthquakes in South Africa Mining related
4
Welkom 1976. M=5.2, MMI = VII

Earthquakes in South AfricaMining related
5
Stilfontein, 2005. M=5.3
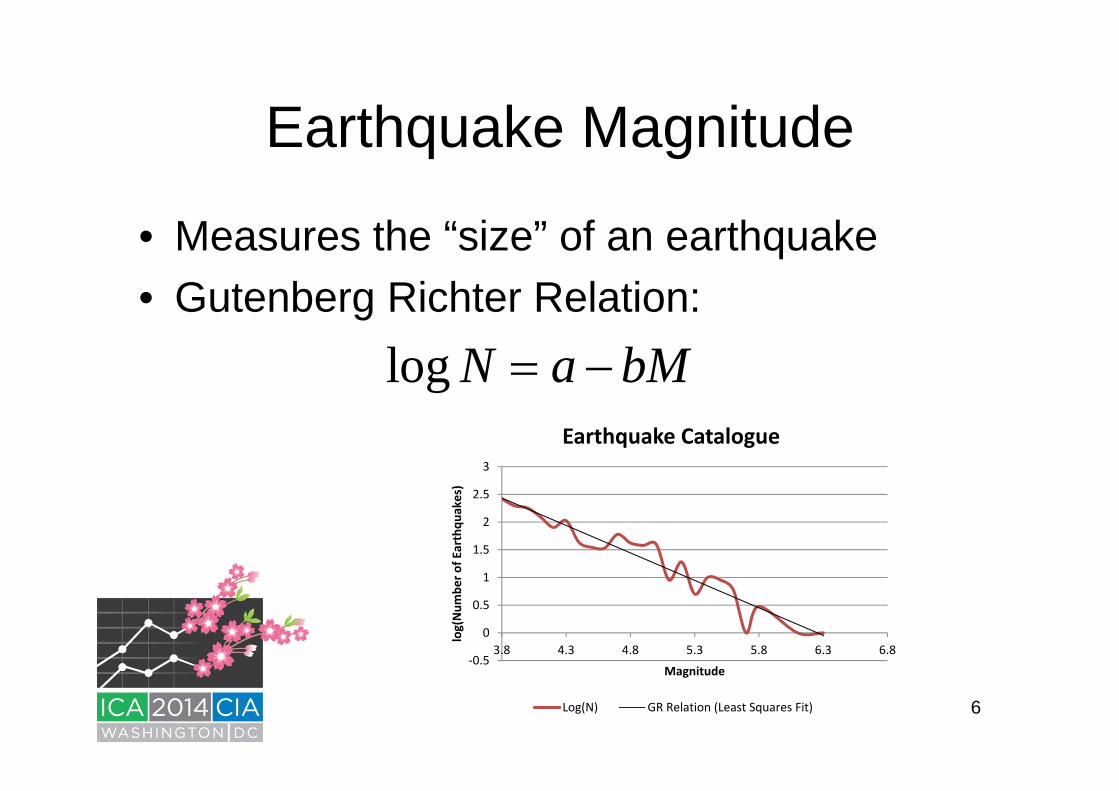
Earthquake Magnitude
• Measures the “size” of an earthquake• Gutenberg Richter Relation:
log N a bM
6
‐0.5
0
0.5
1
1.5
2
2.5
3
3.8 4.3 4.8 5.3 5.8 6.3 6.8
log(Num
ber o
f Earthqu
akes)
Magnitude
Earthquake Catalogue
Log(N) GR Relation (Least Squares Fit)

Parameter Estimation
• Least squares method (includes Mmin)• Maximum likelihood method• Include more information: Mmax
• Systematic error: Mobs = Mreal + error
7

Earthquake Occurrence Models
8
0
0.5
1
1.5
2
2.5
3
3.8 4.3 4.8 5.3 5.8
log(Num
ber o
f earthqu
akes)
Comparison of estimators
Actual Classic‐ bounded
Classic Classic, bounded + Normal Errors (with σ=0.2)
Classic, bounded + Laplace errors (with σ=0.3)

Earthquake Intensity
• Modified Mercalli Intensity Scale
9

Prediction of Damage by Earthquake
• Damage Probability Matrix (DPM)• Connects MMI Intensity with damage for a particular
building class
104 5 6 7 8 9 10 11 120
10
20
30
40
50
60
70
80
BUILDING CLASS #7: Reinforced Concrete Shear Wall with Moment Resisting Frame, High Rise
Intensity MMI
Cen
tral D
amag
e Fa
ctor
[%]
Central Damage Factor Central Damage Factor +/- SD
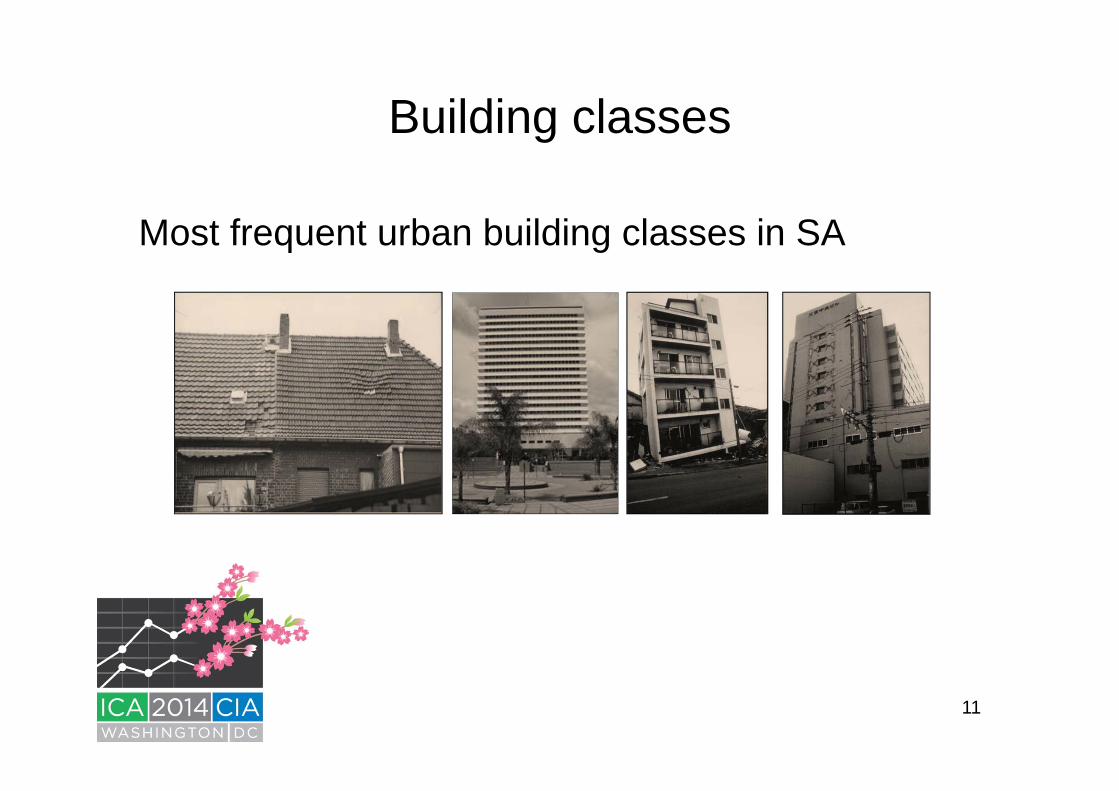
Building classes
Most frequent urban building classes in SA
11
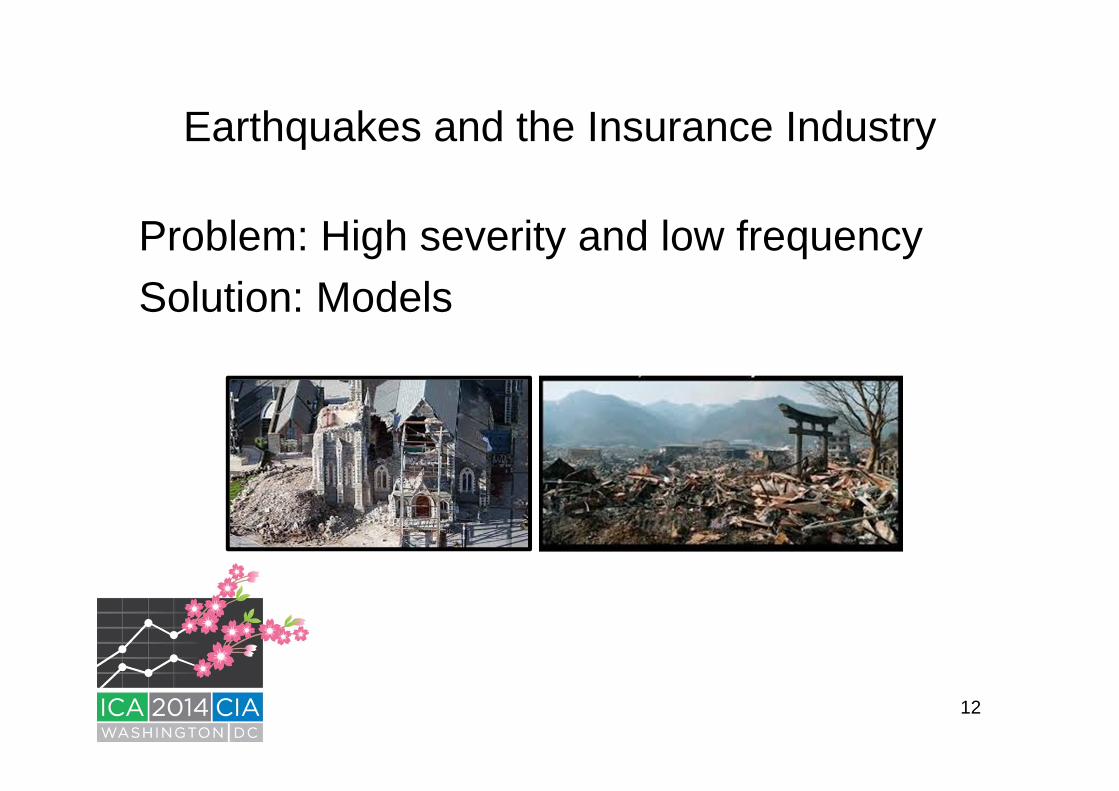
Earthquakes and the Insurance Industry
Problem: High severity and low frequencySolution: Models
12

Earthquakes and the Insurance Industry
• Catastrophe modelling:– Location– Frequency of occurrence– Severity
• Probabilistic Seismic Risk Assessment (PSRA)
13

Earthquakes and the Insurance Industry
PSRA
Ground Acceleration (Seismicity)
Intensity (MMI)
Damage to buildings
14
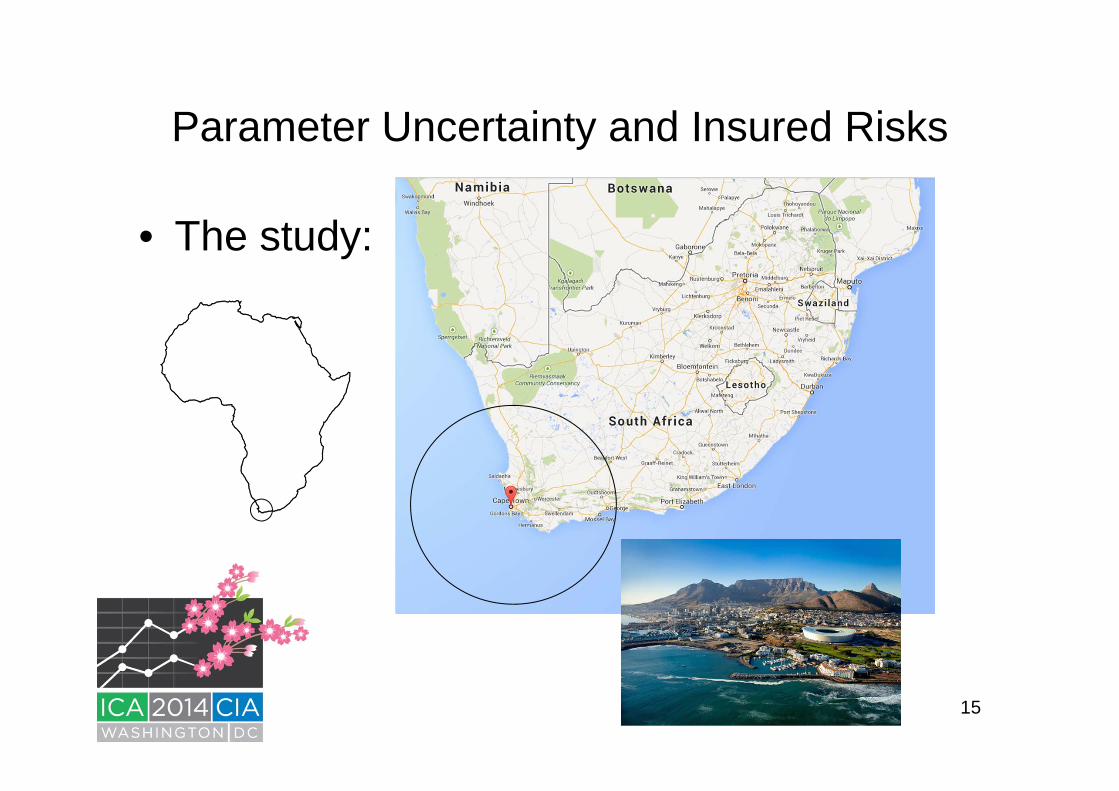
Parameter Uncertainty and Insured Risks
• The study:
15

Parameter Uncertainty and Insured Risks
• Data base:Characteristic ValueStart date 1901End date 2013
3.8
7.0
4.2Number of events larger than 3.8 1307Estimated average events largerthan 3.8 per year
12
minmmaxm
m
16
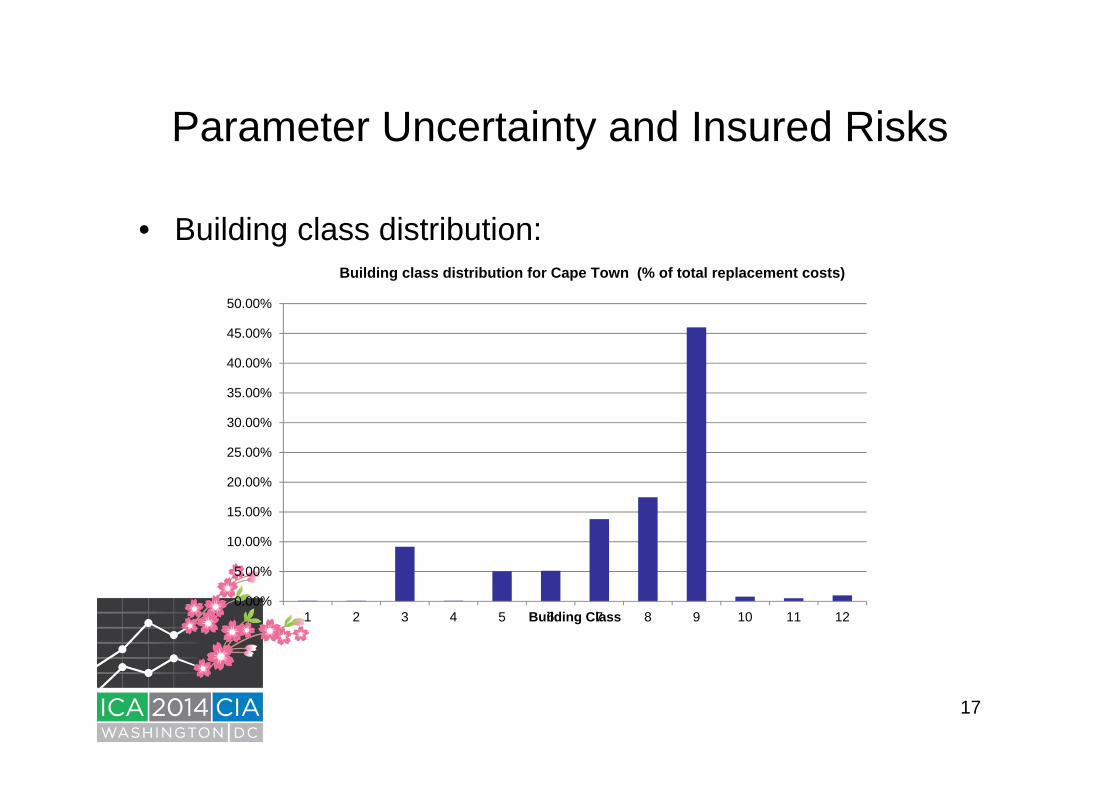
Parameter Uncertainty and Insured Risks
• Building class distribution:
17
0.00%
5.00%
10.00%
15.00%
20.00%
25.00%
30.00%
35.00%
40.00%
45.00%
50.00%
1 2 3 4 5 6 7 8 9 10 11 12Building Class
Building class distribution for Cape Town (% of total replacement costs)

Parameter Uncertainty and Insured Risks:Investigation 1: Varying b values
18
0
5
10
15
20
25
0.000 0.002 0.004 0.006 0.008 0.010 0.012 0.014 0.016
Weighted Mean Losses (%
of total m
onetary value)
Annual Probability
Probabilities of Mean losses for Cape Town
b=0.95
b=1
b=1.05

Parameter Uncertainty and Insured Risks:Investigation 2: Varying activity rate
19
0
5
10
15
20
25
0.000 0.002 0.004 0.006 0.008 0.010 0.012 0.014 0.016
Weighted Mean Losses (%
of total m
onetary value)
Annual Probability
Probabilities of Mean losses for Cape Town
λ=8
λ=12
λ=16

Parameter Uncertainty and Insured Risks:Investigation 3: Differing methodologies for estimating the b value
20
0
5
10
15
20
25
0.000 0.002 0.004 0.006 0.008 0.010 0.012
Weighted Mean Losses (%
of total m
onetary value)
Annual Probability
Probabilities of Mean losses for Cape Town
Classic (b = 1.0391) Classic, bounded (b=1.0355)
Classic, bounded + Normal Errors (b=1.0514) Classic, bounded + Laplace errors (b=1.0156)

Summary• Seismic risk characteristics• Earthquakes and insurance• PSRA• Losses are sensitive to seismic parameters
– particularly for areas of low seismicity• The best method to use is determined by
the underlying data
21