ib diploma programme …...ib diploma programme programme du diplÔme du bi programa del diploma del...
TRANSCRIPT

IB DIPLOMA PROGRAMME
PROGRAMME DU DIPLÔME DU BI
PROGRAMA DEL DIPLOMA DEL BI
M06/3/GEOGR/HP2/ENG/TZ0/XX/Q+
GeoGraphy
hiGher level
paper 2
Wednesday 3 May 2006 (morning)
INsTRUcTIONs TO cANDIDATEs
Do not open this examination paper until instructed to do so.Answer four questions: two from section A; one from section B; one other from any section (A, B or c).Each question must be selected from a different theme.
2 hours 30 minutes
2206-5202 18 pages
22065202
– 2 – M06/3/GEOGR/HP2/ENG/TZ0/XX/Q+
2206-5202
SeCTioN a
Answer at least two questions from this section and each question must be taken from a different theme. (Do
not answer both an essay and a structured question on the same theme.)
Case studies and examples should be used to illustrate answers and, where appropriate, they should be
specifically located. Include well drawn, large, relevant maps, sketches, tables and diagrams as often as applicable.
a1. Drainage basins and their management
Either
(a) essay
To what extent do you agree that river landforms can be classified as either erosional or depositional? [20 marks]
(This question continues on the following page)
– 3 –
Turn over
M06/3/GEOGR/HP2/ENG/TZ0/XX/Q+
2206-5202
(Question A1 continued)
Or
(b) Structured question
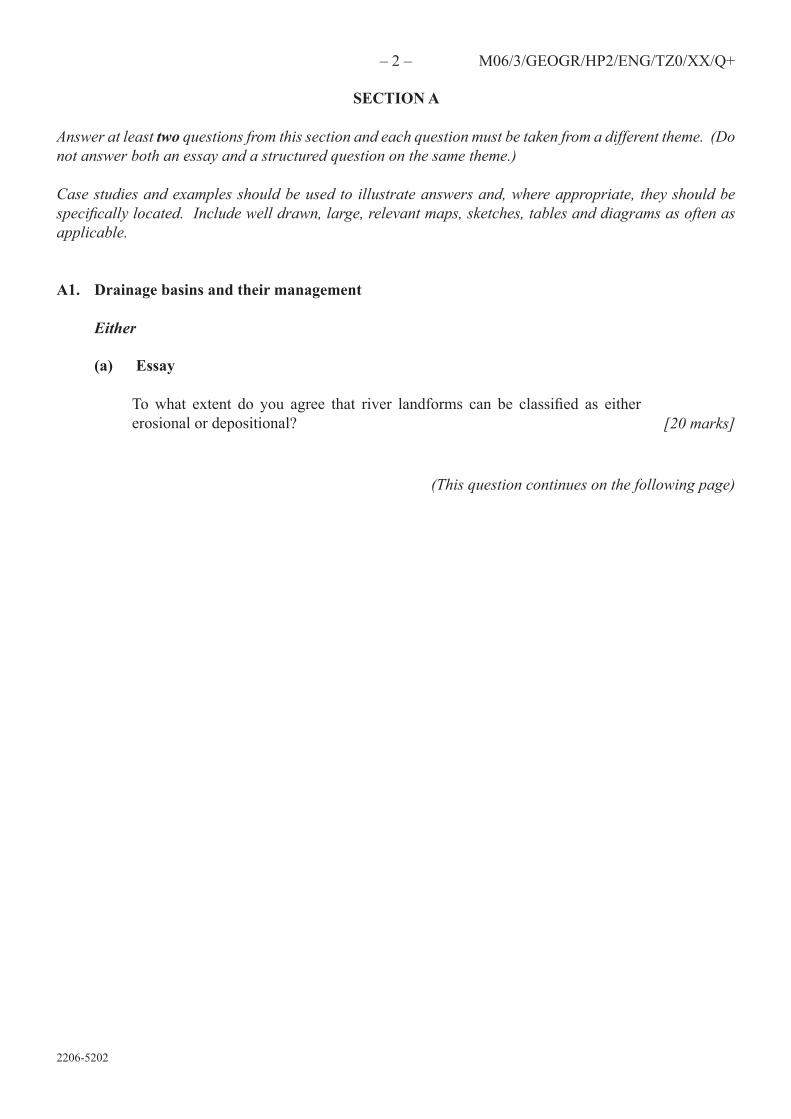
The diagram below shows factors that contribute to flash flooding.
(i) Define the term flash flood. [1 mark]
(ii) Identify factors A and B and briefly explain how they contribute to flash flooding. [4 marks]
(iii) Explain how human activity can increase the risk of flash flooding. [5 marks]
(iv) Referring to one specific case study, assess the effectiveness of water management strategies. [10 marks]
preCipiTaTioN FaCTorS laNDSCape FaCTorS
Factor A
Rainfall intensity
Rainfall duration
Factor B
River basin shape
Vegetation cover
FLAsH FLOOD

– � – M06/3/GEOGR/HP2/ENG/TZ0/XX/Q+
2206-5202
a2. Coasts and their management
Either
(a) essay
Referring to examples, examine how human activity affects erosional processes and landforms in coastal areas. [20 marks]
(This question continues on the following page)

– 5 –
Turn over
M06/3/GEOGR/HP2/ENG/TZ0/XX/Q+
2206-5202
(Question A2 continued)
Or
(b) Structured question
The map shows the coastline near Kingston on the island of Jamaica. The diagram shows how the beach at point A on the map changes in response to different conditions.
Port Royal Mountains
City of Kingston
Long Mt.
Harbor View
Airport
A
Port Royal
Red Hills
Portmore
PortHenderson
Kingston Harbour
Sea
5kilometers0
T h e P a l i s a d o e s
N
(i) state the name of the landform represented by the Palisadoes (shown on the map). [1 mark]
(ii) Provide a possible explanation for the formation of the Palisadoes. [4 marks]
(iii) Referring to the diagram, explain the changes which occur on the beach at point A during a typical 2�-hour period. [5 marks]
(iv) Referring to examples, evaluate the coastal management strategies that may be used in low-lying coastal areas. [10 marks]
Volume of sand on beach
increasesWind from sE
sand moved offshore
sand moved onshore
Wind from NW
Volume of sand on beach
decreases
Night time Day time
[source: M D Hendry, (1983), caribbean Geography Vol 1 # 1 (May 1983)]
– 6 – M06/3/GEOGR/HP2/ENG/TZ0/XX/Q+
2206-5202
a3. arid environments and their management
Either
(a) essay
“In the centre of deserts, wind action is dominant. On the margins of deserts, the action of water is dominant.”
Evaluate these statements with reference to arid and semi-arid landforms. [20 marks]
(This question continues on the following page)

– � –
Turn over
M06/3/GEOGR/HP2/ENG/TZ0/XX/Q+
2206-5202
(Question A3 continued)
Or
(b) Structured question
Diagram A shows the rainfall for a number of Us urban areas, some of which are located in arid areas. Diagram B shows the outdoor and indoor water consumption in litres per person per day for the same urban areas.
0 200 400 600 800 1000 1200 1400
0 250 500 750 1000
[source: P W Mayer, W B DeOreo, et al., (1999) Residential End Uses of Water]
(i) Describe the relationship between the set of values in Diagrams A and B. [2 marks]
(ii) With reference to Diagram A, explain why rainfall values alone are insufficient to define aridity. [3 marks]
(iii) Describe and give possible reasons for the water consumption patterns shown in Diagram B. [2+3 marks]
(iv) Using at least one example, examine why access to water resources is an increasingly important international issue in arid regions. [10 marks]
Scottsdale, AZ
Las Virgenes, CA
Phoenix, AZ
Tempe, AZ
Denver, CO
Walnut Valley, CA
Boulder, CO
San Diego, CA
Eugene, OR
Tampa, FL
Seattle, WA
Outdoor water consumption
Indoor water consumption
Average annual rainfall (mm)
Average water consumption (litres per person per day)
Diagram A
Diagram B
Scottsdale, AZ
Las Virgenes, CA
Phoenix, AZ
Tempe, AZ
Denver, CO
Walnut Valley, CA
Boulder, CO
San Diego, CA
Eugene, OR
Tampa, FL
Seattle, WA
arid locations

– 8 – M06/3/GEOGR/HP2/ENG/TZ0/XX/Q+
2206-5202
a4. lithospheric processes and hazards
Either
(a) essay
Using examples, examine how different types of volcanic eruption have different impacts on people. [20 marks]
Or
(b) Structured question
If you choose to answer this question refer to the diagrams in the Resources Booklet.
Diagrams A and B show two types of mass movement.
(i) Define the term mass movement. [2 marks]
(ii) Identify the type of mass movement taking place in each of the diagrams A and B. [2 marks]
(iii) Explain the processes of mass movement taking place in diagram A and describe their effects on the natural and human landscape. [4+2 marks]
(iv) Discuss the relative contribution of natural and human factors to mass movements of the type shown in diagram B. [10 marks]
– 9 –
Turn over
M06/3/GEOGR/HP2/ENG/TZ0/XX/Q+
2206-5202
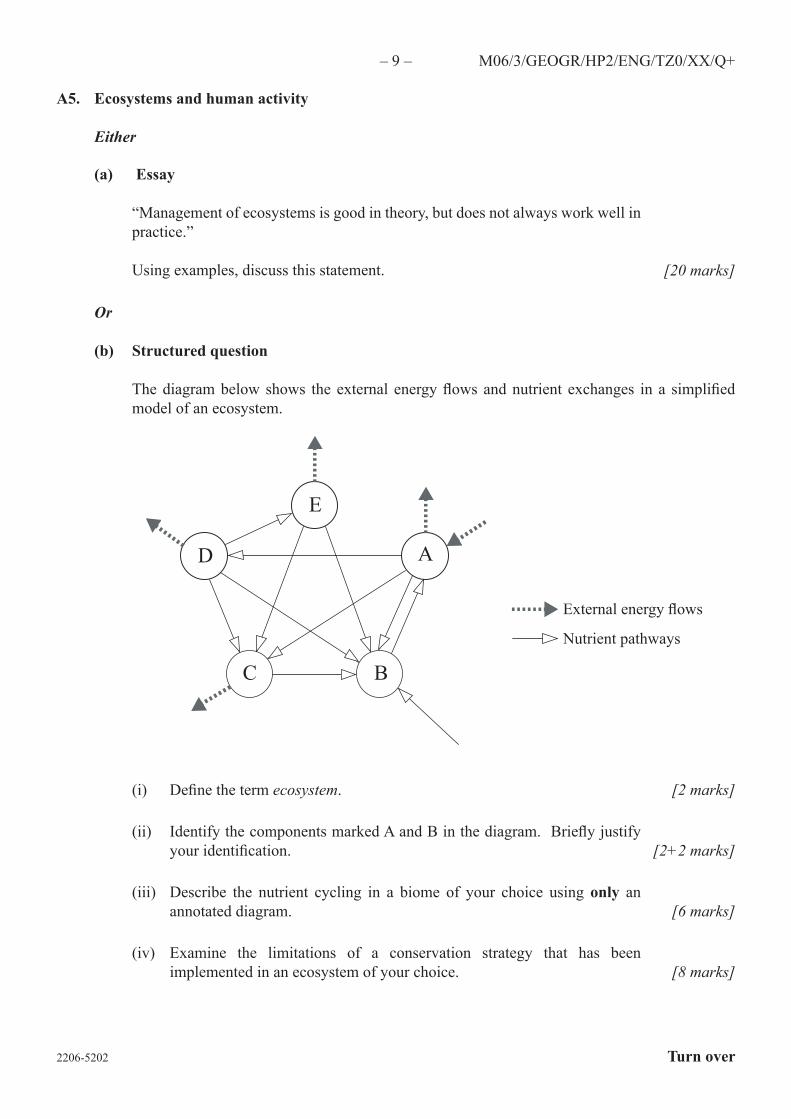
a5. ecosystems and human activity
Either
(a) essay
“Management of ecosystems is good in theory, but does not always work well in practice.”
Using examples, discuss this statement. [20 marks]
Or
(b) Structured question
The diagram below shows the external energy flows and nutrient exchanges in a simplified model of an ecosystem.
E
D
C
A
B
(i) Define the term ecosystem. [2 marks]
(ii) Identify the components marked A and B in the diagram. Briefly justify your identification. [2+2 marks]
(iii) Describe the nutrient cycling in a biome of your choice using only an annotated diagram. [6 marks]
(iv) Examine the limitations of a conservation strategy that has been implemented in an ecosystem of your choice. [8 marks]
External energy flows
Nutrient pathways

– 10 – M06/3/GEOGR/HP2/ENG/TZ0/XX/Q+
2206-5202
a6. Climatic hazards and change
Either
(a) essay
“The only effective responses to the problems of acid rain and the depletion of stratospheric ozone are international, and not local or national.”
Discuss this statement. [20 marks]
Or
(b) Structured question
If you choose to answer this question refer to the satellite image in the Resources Booklet.
The satellite image shows a major weather system over part of southern Africa.
(i) state the name of the weather system X shown in the satellite image. [1 mark]
(ii) State the direction in which the weather system is moving, and justify your answer. [1+1 mark]
(iii) Describe and explain the changes of weather that would be experienced as this weather system passes directly overhead. [4+3 marks]
(iv) To what extent are the human responses to one named climatic hazard related to a country’s level of development? [10 marks]

– 11 –
Turn over
M06/3/GEOGR/HP2/ENG/TZ0/XX/Q+
2206-5202
Blank page
– 12 – M06/3/GEOGR/HP2/ENG/TZ0/XX/Q+
2206-5202
SeCTioN B
Answer at least one question from this section. If more than one question is selected from this section, each must be taken from a different theme. (Do not answer both an essay and a structured question on the same
theme.)
Case studies and examples should be used to illustrate answers and, where appropriate, they should be
specifically located. Include well drawn, large, relevant maps, sketches, tables and diagrams as often as applicable.
B7. Contemporary issues in geographical regions
Either
(a) essay
Examine how physical, economic and socio-political factors have caused the contemporary geographical issues in a region you have studied. [20 marks]
(This question continues on the following page)
– 13 –
Turn over
M06/3/GEOGR/HP2/ENG/TZ0/XX/Q+
2206-5202
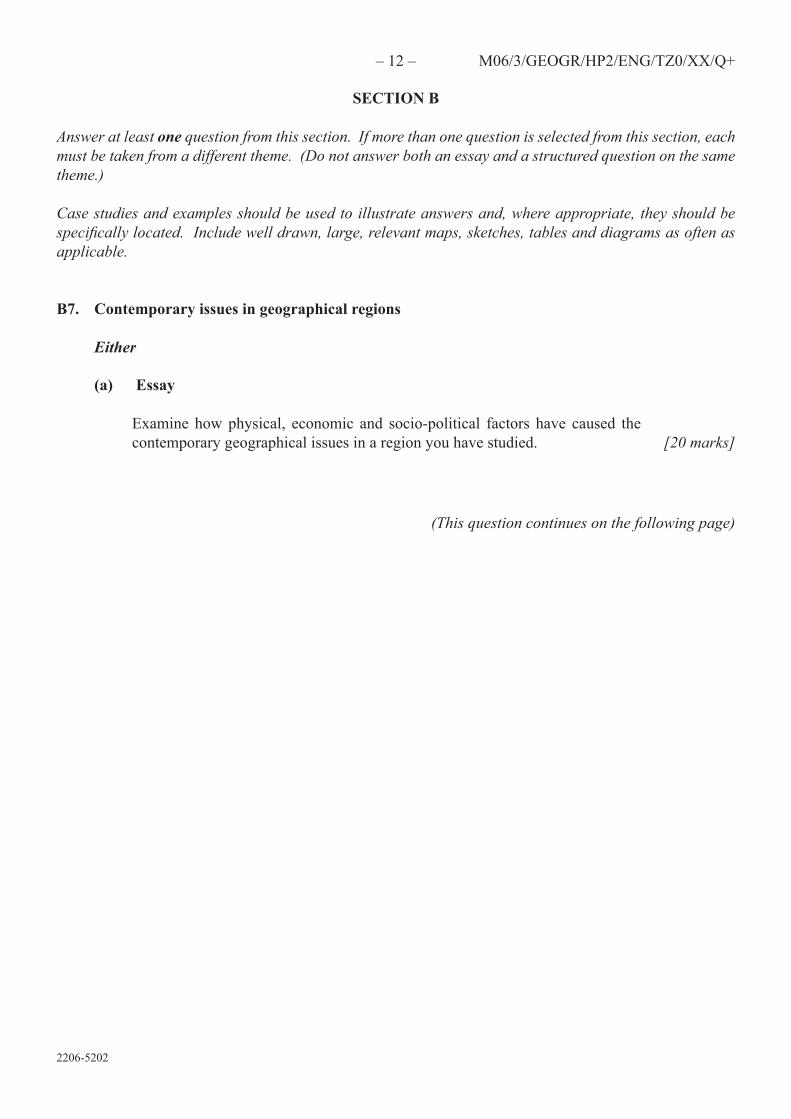
(Question B7 continued)
Or
(b) Structured question
The maps show three alternative regional divisions for the distribution of homes without a telephone in an area in 1960.
[source: M Monmonier, (1991) How to lie with maps]
(i) Explain why the regions shown on Map A differ so greatly from the regions shown on Maps B and c. [2 marks]
(ii) Describe one situation in which Map A may be more useful than Maps B and C, and justify your answer. [4 marks]
(iii) Locate your local region and define its boundaries using only an annotated map. [4 marks]
(iv) Referring to examples, examine whether the boundaries of a single-feature region are easier to define than the boundaries of a multi‑feature region. [10 marks]
(scales deliberately omitted.)
below 10%10% to 30%
above 30%
below 10%10% to 15%
above 15%
below 20%
20% to 30%above 30%
Map a Map B Map C
Homes without a telephone in an area in 1960
Homes without a telephone in an area in 1960
Homes without a telephone in an area in 1960

– 1� – M06/3/GEOGR/HP2/ENG/TZ0/XX/Q+
2206-5202
B8. Settlements
Either
(a) essay
Analyse the main factors responsible for variations in land use and functions in the central Business District of a large urban area. Include a map to illustrate your answer. [20 marks]
(This question continues on the following page)
– 15 –
Turn over
M06/3/GEOGR/HP2/ENG/TZ0/XX/Q+
2206-5202
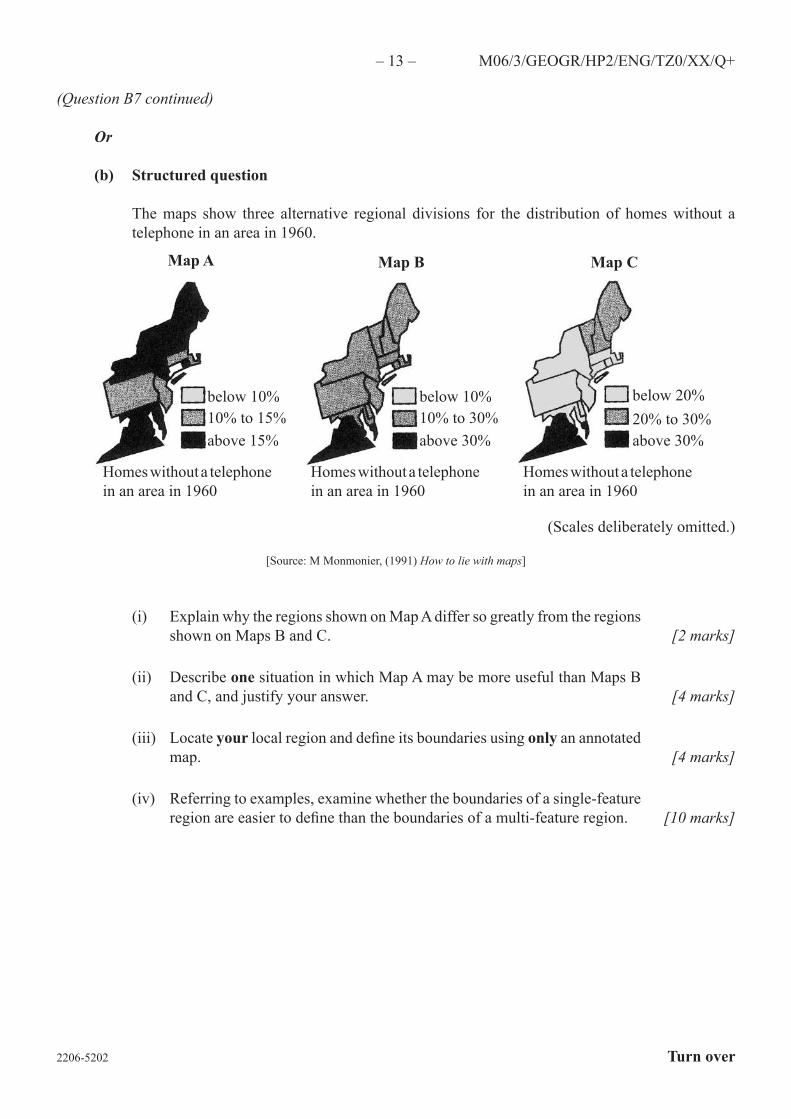
(Question B8 continued)
Or
(b) Structured question
The graph below shows the percentage of national urban population living in nine primate cities in 1950, 2000 and 2015 (predicted).
0
20
�0
60
80
100
[source: UN Population Division – Urban Prospects]
(i) Define the term primate city. [1 mark]
(ii) Briefly explain three ways in which the data shown in the graph may be unreliable. [3 marks]
(iii) Describe and provide possible explanations for the changes over time in the percentage of urban population living in the primate cities shown on the graph. [3+3 marks]
(iv) Referring to examples, examine the benefits that counter‑urbanization brings to rural settlements. [10 marks]
Percentage of national urban
population living in primate city
1950
2000
2015(predicted)
Kuwait
city
(Kuw
ait)
Beirut
(Leb
anon
)
Brazz
avill
e (con
go)
Phnom
Pen
h (cam
bodi
a)
Bangk
ok (T
haila
nd)
Yerev
an (A
rmen
ia)
san Jo
se (c
osta
Rica)
Athen
s (Gre
ece)
Baku (
Azerba
ijan)
– 16 – M06/3/GEOGR/HP2/ENG/TZ0/XX/Q+
2206-5202
B9. productive activities: aspects of change
Either
(a) essay
“The growth of agribusiness has been environmentally damaging and socially disruptive.”
Discuss this view with reference to specific examples. [20 marks]
Or
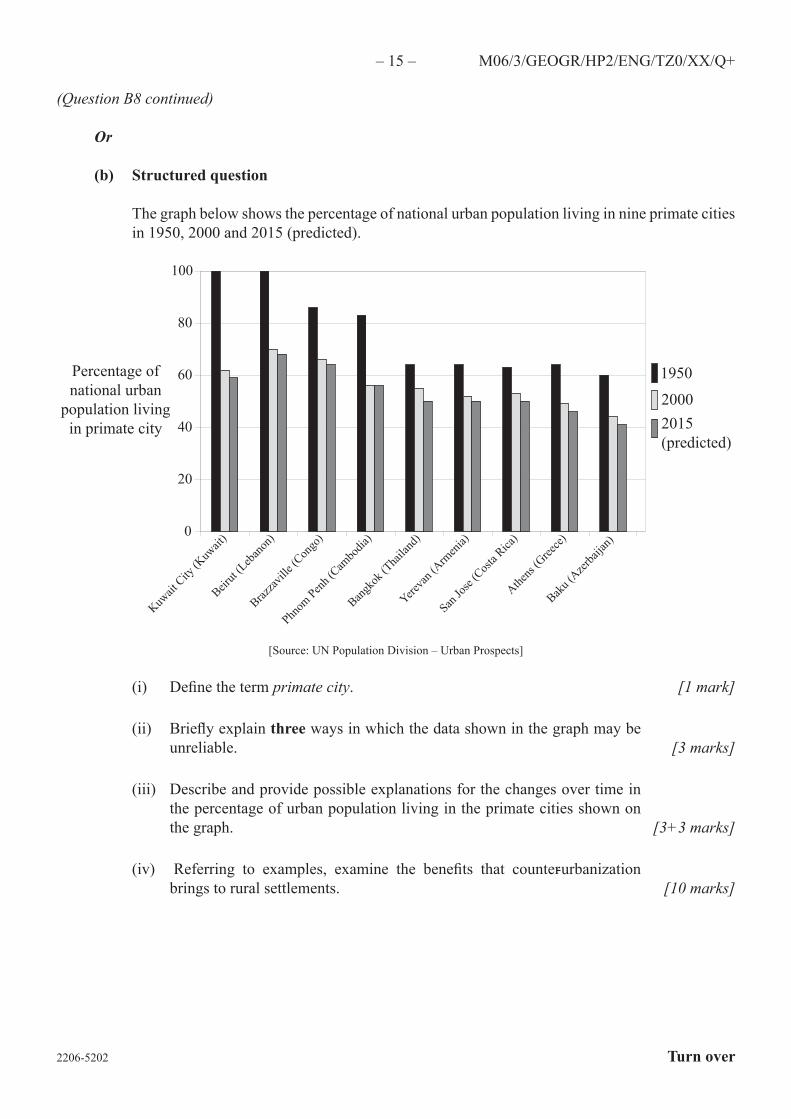
(b) Structured question
The graphs below show changes in the employment structure (the percentage of the working population employed in each economic sector) for two countries, A and B, between 1980 and 2002.
0
20
�0
60
80
100
1980 1985 1990 1995 2000 20020
20
�0
60
80
100
1980 1985 1990 1995 2000 2002
employment Sector
Primary secondary (manufacturing) Tertiary
[Source: International Labour Office]
(i) With reference to the data given in the graphs, classify each country according to its current level of economic development. Justify your answer. [4 marks]
(ii) Provide possible reasons for the changes in the employment structure of either country A or country B. [6 marks]
(iii) “Manufacturing industry can never be sustainable.” Evaluate this statement. [10 marks]
Per
cent
age
empl
oym
ent
Per
cent
age
empl
oym
ent
country A country B
years years
– 1� –
Turn over
M06/3/GEOGR/HP2/ENG/TZ0/XX/Q+
2206-5202
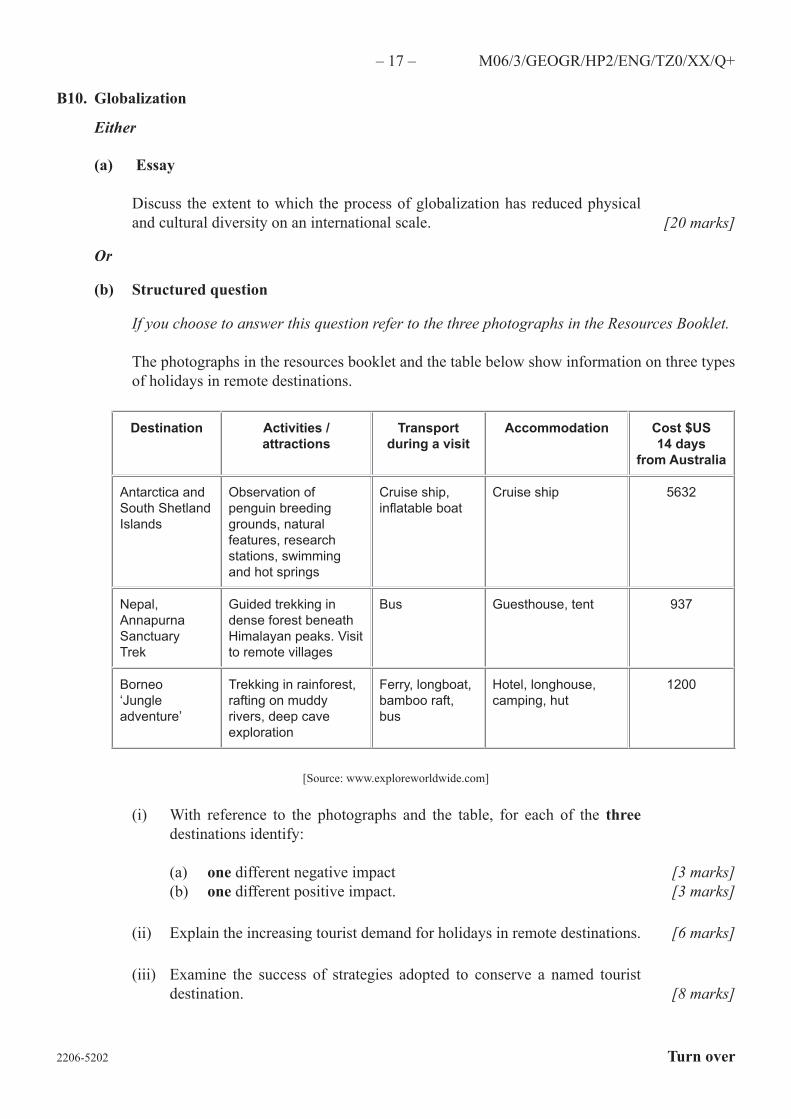
B10. Globalization
Either
(a) essay
Discuss the extent to which the process of globalization has reduced physical and cultural diversity on an international scale. [20 marks]
Or
(b) Structured question
If you choose to answer this question refer to the three photographs in the Resources Booklet.
The photographs in the resources booklet and the table below show information on three types of holidays in remote destinations.
Destination Activities / attractions
Transport during a visit
Accommodation Cost $US14 days
from Australia
Antarctica and
South Shetland
Islands
Observation of
penguin breeding
grounds, natural
features, research
stations, swimming
and hot springs
Cruise ship,
inflatable boatCruise ship 5632
Nepal,
Annapurna
Sanctuary
Trek
Guided trekking in
dense forest beneath
Himalayan peaks. Visit
to remote villages
Bus Guesthouse, tent 937
Borneo
‘Jungle
adventure’
Trekking in rainforest,
rafting on muddy
rivers, deep cave
exploration
Ferry, longboat,
bamboo raft,
bus
Hotel, longhouse,
camping, hut
1200
[source: www.exploreworldwide.com]
(i) With reference to the photographs and the table, for each of the three
destinations identify:
(a) one different negative impact (b) one different positive impact.
[3 marks]
[3 marks]
(ii) Explain the increasing tourist demand for holidays in remote destinations. [6 marks]
(iii) Examine the success of strategies adopted to conserve a named tourist destination. [8 marks]

– 18 – M06/3/GEOGR/HP2/ENG/TZ0/XX/Q+
2206-5202
SeCTioN C
If you choose to answer this question, use the topographic map extract and the aerial photograph in the Resources Booklet to answer all parts.
C11. Topographic mapping
The aerial photograph and map extract show the area around Loxton, a town with a population of � 000 on the Murray River in south Australia. The town is the centre of an agricultural area that specializes in the cultivation of grapes, citrus and other fruit under irrigation.
The contour interval of the map extract is 10 metres and the scale is 1:50 000.
(a) Give a possible reason for the circular (or semi-circular) patterns seen in the south of the photograph. [1 mark]
(b) Determine the direction of flow of the River Murray, giving a reason. [2 marks]
(c) State the 6‑figure grid reference for the south‑western corner of the aerial photograph. [2 marks]
(d) Describe and give possible reasons for the land use on the edge of the urban area. [3+2 marks]
(e) Using only an annotated map, divide the area shown on the map into regions, and describe the essential characteristics of each region. [10 marks]