the ib diploma programme statistical bulletin
TRANSCRIPT
May 2009 examination session
The IB Diploma Programme statistical bulletin

1
The IB Diploma Programme statistical bulletin, May 2009 examination session
Published in November 2009
International Baccalaureate Peterson House, Malthouse Avenue, Cardiff Gate
Cardiff, Wales CF23 8GL United Kingdom
Phone: + 44 29 2954 7777 Fax: + 44 29 2054 7778 Website: www.ibo.org
© International Baccalaureate Organization 2009
Statistical queries should be directed to the Management Information Coordinator:
Phone: +44 29 2054 7657 Fax: +44 29 2054 7778
Email: [email protected]

2
Contents
Tables and graphs Page Index: key to abbreviations
4
PART A: general school statistics
5–7
1 Number of schools following the Diploma Programme 2005–2009
5
2 Number and percentage of schools following the Diploma Programme by working language 2005–2009
6
3 Number and percentage of schools following the Diploma Programme by IB region 2005–2009
7
PART B: registration statistics
8–27
4 Number of schools registering candidates May 2005–May 2009
8
5 Number of May session schools registering candidates May 2005–May 2009
8
6 Number of schools registering candidates by working language May 2005–May 2009
9
7 Number and percentage of schools registering candidates by IB region May 2005–May 2009
10
8 Number of candidates registered by category May 2005–May 2009
11
9 Number of candidates registered by gender May 2005–May 2009
13
10 Number of candidates registered by IB region May 2005–May 2009
14
11 Number of candidates registered by category, gender and IB region May 2009
15
12 Summary of Diploma Programme examination entries: schools with registered candidates May 1975–May 2009
16
13 Number of schools that registered a particular number of candidates May 2005 –May 2009
18
14 Subject registration summary May 2009
19
15 Subject group registrations May 2005–May 2009
19
16 Additional Diploma Programme requirements: extended essay and theory of knowledge May 2009
20
17 Subject registration summary: extended essay by subject group May 2009
20
18 Subject registration summary: theory of knowledge by language May 2009
21
19 Nationalities of candidates registered May 2009
22

3
20 Number of countries represented by examination session May 2005–May 2009
25
21 Number of candidates registered by country May 2009
26
PART C: results statistics
28–42
22 Analysis of examination results by subject and level May 2009
28
23 Diploma and retake candidates (D+R): distribution of points totals May 2009
36
24 Retake candidates only (R): distribution of points totals May 2009
37
25 Diploma score distribution: diploma and retake candidates (D+R) and retake candidates only (R) May 2009
38
26 Extended essay results May 2009
39
27 Theory of knowledge results May 2009
40
28 Distribution of additional points May 2005–May 2009
41
29 Mean points score worldwide May 2005–May 2009
42
30 Mean grade worldwide May 2005–May 2009
42
31 Pass rate worldwide May 2005–May 2009
43
32 Number of diplomas and bilingual diplomas awarded May 2005–May 2009
43
33 Number of diplomas awarded by IB region May 2009
43
34 Number of candidates scoring 45 points May 1999-May 2009 43 35 Number of candidates scoring 45 points by IB region May 1999-May 2009 44
36 Number of candidates scoring 45 points by IB gender May 1999-May 2009 44
4
Index: key to abbreviations
Categories of registration Diploma Programme candidates must register in one of four categories. These are identified by one of the following letters.
D Diploma: candidates intending to complete the requirements for the award of an IB diploma.
R Retake: previous IB diploma candidates who are seeking to improve their results.
The highest grade obtained for a subject will contribute towards the IB diploma. C Certificate: candidates taking one or more subjects who are not seeking the award
of the IB diploma.
A Anticipated: candidates intending to complete the requirements for one or two standard level subjects (excluding languages ab initio and pilot subjects) at the end of their first year of the Diploma Programme. They must complete all remaining IB diploma requirements in the corresponding examination session in the following year.
IB regions Schools that are authorized to offer the IB Diploma Programme are grouped by geographical region. The abbreviations used in the tables are the codes describing the following geographical regions:
IBAEM IB Africa, Europe and the Middle East IBAP IB Asia-Pacific IBA IB Latin America, North America and the Caribbean
Other abbreviations HL Higher level SL Standard level EE Extended essay TOK Theory of knowledge PS Pilot subjects SBS School-based syllabuses
5
PART A: general school statistics
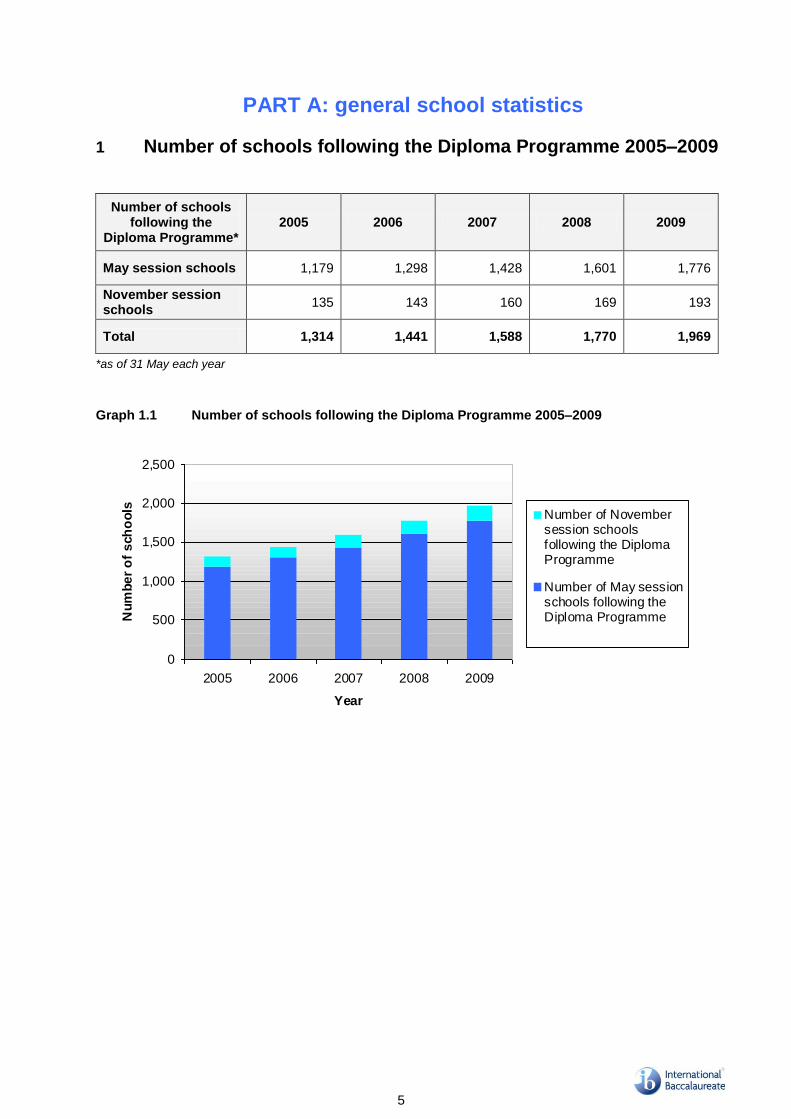
1 Number of schools following the Diploma Programme 2005–2009
Number of schools following the
Diploma Programme* 2005 2006 2007 2008 2009
May session schools 1,179 1,298 1,428 1,601 1,776
November session schools
135 143 160 169 193
Total 1,314 1,441 1,588 1,770 1,969
*as of 31 May each year
Graph 1.1 Number of schools following the Diploma Programme 2005–2009
0
500
1,000
1,500
2,000
2,500
2005 2006 2007 2008 2009
Year
Nu
mb
er
of
sch
oo
ls Number of Novembersession schoolsfollowing the DiplomaProgramme
Number of May sessionschools following theDiploma Programme

6
2 Number and percentage of schools following the Diploma
Programme by working language 2005–2009
Number of schools following
the Diploma Programme by
working language*
2005 2006 2007 2008 2009
English 1,150 1,269 1,403 1,556 1,733
French 18 18 19 21 28
Spanish 146 154 166 193 208
Total 1,314 1,441 1,588 1,770 1969 1,092
*as of 31 May each year
Graph 2.1 Number of schools following the Diploma Programme by working language
2005–2009
0
200
400
600
800
1,000
1,200
1,400
1,600
1,800
2,000
2005 2006 2007 2008 2009
Year
Nu
mb
er
of
sc
ho
ols
English
French
Spanish
Percentage of schools following
the Diploma Programme by
working language*
2005 2006 2007 2008 2009
English 87.52% 88.06% 88.35% 87.91% 88.01%
French 1.37% 1.25% 1.20% 1.19% 1.42%
Spanish 11.11% 10.69% 10.45% 10.90% 10.57%
*as of 31 May each year

7
3 Number and percentage of schools following the Diploma Programme by IB region 2005–2009
Number of schools following
the Diploma Programme by IB
region*
2005 2006 2007 2008 2009
IBAEM 417 463 515 571 656
IBAP 148 172 206 240 270
IBA 749 806 867 959 1,043
Total 1,314 1,441 1,588 1,770 1,969
*as of 31 May each year
Graph 3.1 Number of schools following the Diploma Programme by IB region 2005–2009
0
200
400
600
800
1000
1200
2005 2006 2007 2008 2009
Year
Nu
mb
er
of
sc
ho
ols
IBAEM
IBA
IBAP
Percentage of schools following
the Diploma Programme by IB
region*
2005 2006 2007 2008 2009
IBAEM 31.74% 32.13% 32.43% 32.26% 33.32%
IBAP 11.26% 11.94% 12.97% 13.56% 13.71%
IBA 57.01% 55.93% 54.59% 54.18% 52.97%
*as of 31 May each year

8
PART B: registration statistics
4 Number of schools registering candidates May 2005–May 2009
Number of schools
registering candidates
May 2005 May 2006 May 2007 May 2008 May 2009
1,059 1,178 1,289 1,432 1582
Percentage of total number of
schools 80.59% 81.75% 81.17% 80.90% 80.35%
Graph 4.1 Number of schools registering candidates May 2005–May 2009
0
500
1,000
1,500
2,000
2,500
May 2005 May 2006 May 2007 May 2008 May 2009
Examination session
Nu
mb
er
of
sch
oo
ls
Total number of DiplomaProgramme schools
Number of schoolsregistering candidates forMay examination session
5 Number of May session schools registering candidates May
2005–May 2009
Number of May session schools
registering candidates
May 2005 May 2006 May 2007 May 2008 May 2009
1,010 1,123 1,239 1,373 1,519
Total number of May session
schools 1,179 1,298 1,428 1,601 1,776
Percentage of all May session
schools 85.67% 86.52% 86.76% 85.76% 85.53%
9
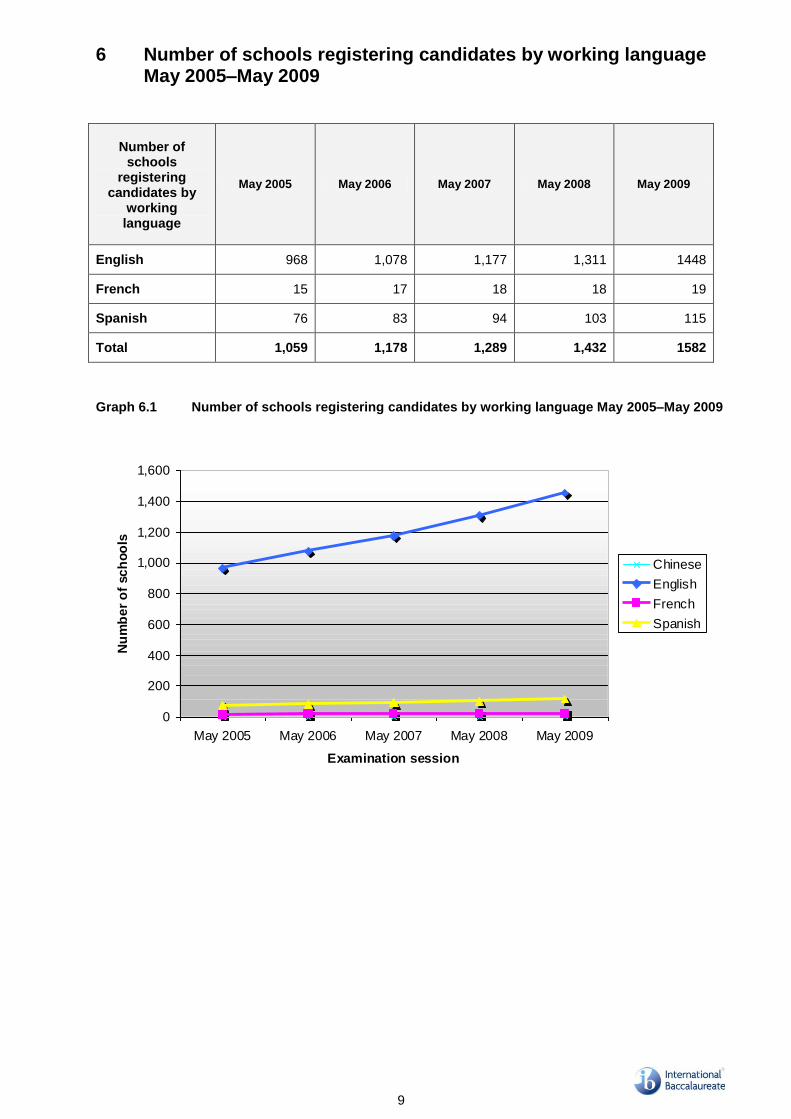
6 Number of schools registering candidates by working language May 2005–May 2009
Number of schools
registering candidates by
working language
May 2005 May 2006 May 2007 May 2008 May 2009
English 968 1,078 1,177 1,311 1448
French 15 17 18 18 19
Spanish 76 83 94 103 115
Total 1,059 1,178 1,289 1,432 1582
Graph 6.1 Number of schools registering candidates by working language May 2005–May 2009
0
200
400
600
800
1,000
1,200
1,400
1,600
May 2005 May 2006 May 2007 May 2008 May 2009
Examination session
Nu
mb
er
of
sc
ho
ols
Chinese
English
French
Spanish

10
7 Number and percentage of schools registering candidates by IB region May 2005–May 2009
Number of schools
registering candidates by
IB region
May 2005 May 2006 May 2007 May 2008 May 2009
IBAEM 355 401 443 500 558
IBAP 99 114 131 165 193
IBA 605 663 715 767 839
Total 1,059 1,178 1,289 1,432 1,590
Graph 7.1 Number of schools registering candidates by IB region May 2005–
May 2009
0
100
200
300
400
500
600
700
800
900
May 2005 May 2006 May 2007 May 2008 May 2009
Examination session
Nu
mb
er
of
sc
ho
ols
IBAEM
IBA
IBAP
Percentage of schools
registering candidates by IB
region
May 2005 May 2006 May 2007 May 2008 May 2009
IBAEM 33.52% 34.04% 34.37% 34.92% 35.09%
IBAP 9.35% 9.68% 10.16% 11.52% 12.14%
IBA 57.13% 56.28% 55.47% 53.56% 52.77%
11
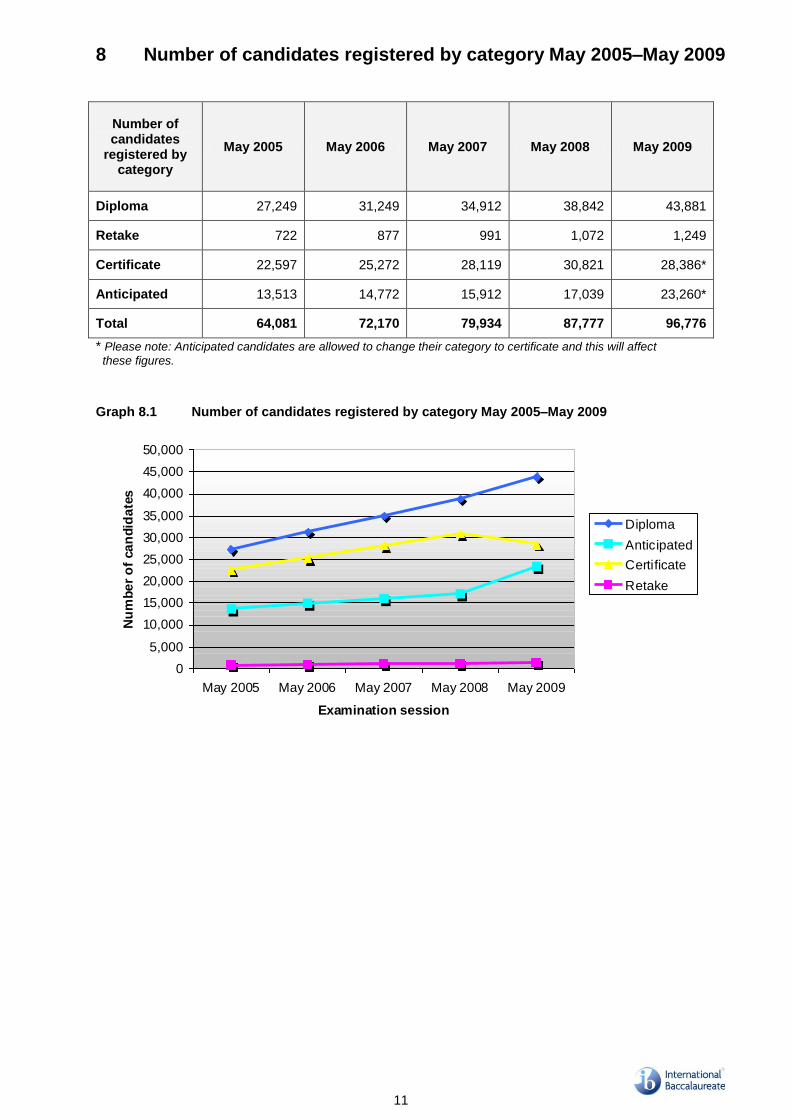
8 Number of candidates registered by category May 2005–May 2009
Number of candidates
registered by category
May 2005 May 2006 May 2007 May 2008 May 2009
Diploma 27,249 31,249 34,912 38,842 43,881
Retake 722 877 991 1,072 1,249
Certificate 22,597 25,272 28,119 30,821 28,386*
Anticipated 13,513 14,772 15,912 17,039 23,260*
Total 64,081 72,170 79,934 87,777 96,776
* Please note: Anticipated candidates are allowed to change their category to certificate and this will affect
these figures.
Graph 8.1 Number of candidates registered by category May 2005–May 2009
0
5,000
10,000
15,000
20,000
25,000
30,000
35,000
40,000
45,000
50,000
May 2005 May 2006 May 2007 May 2008 May 2009
Examination session
Nu
mb
er
of
ca
nd
ida
tes
Diploma
Anticipated
Certificate
Retake

12
Graph 8.2 Number of candidates registered May 2005–May 2009
0
20,000
40,000
60,000
80,000
100,000
120,000
May 2005 May 2006 May 2007 May 2008 May 2009
Examination session
Nu
mb
er
of
ca
nd
ida
tes
Number ofcandidatesregistered
Percentage of
candidates registered by
category
May 2005 May 2006 May 2007 May 2008 May 2009
Diploma 42.52% 43.30% 43.68% 44.25% 45.34%
Retake 1.13% 1.22% 1.24% 1.22% 1.29%
Certificate 35.26% 35.02% 35.18% 35.11% 29.34%*
Anticipated 21.09% 20.47% 19.91% 19.42% 24.03%*
* Please note: Anticipated candidates are allowed to change their category to certificate and this will affect
these figures.
Graph 8.3 Percentages of candidates registered May 2005–May 2009
0%
10%
20%
30%
40%
50%
60%
70%
80%
90%
100%
May 2005 May 2006 May 2007 May 2008 May 2009
Examination session
Pe
rce
nta
ge
of
ca
nd
ida
tes
Anticipated
Certificate
Retake
Diploma

13
9 Number of candidates registered by gender May 2005–May 2009
Number of candidates
registered by gender
May 2005 May 2006 May 2007 May 2008 May 2009
Female 35,824 40,285 44,833 49,002 53,706
Male 28,257 31,885 35,101 38,775 43,070
Total 64,081 72,170 79,934 87,777 96,776
Graph 9.1 Number of candidates registered by gender May 2005–May 2009
0
10,000
20,000
30,000
40,000
50,000
60,000
May 2005 May 2006 May 2007 May 2008 May 2009
Examination session
Nu
mb
er
of
ca
nd
ida
tes
Female
Male
Percentage of
candidates registered by
gender
May 2005 May 2006 May 2007 May 2008 May 2009
Female 55.90% 55.82% 56.09% 55.83% 55.50%
Male 44.10% 44.18% 43.91% 44.17% 44.50%

14
10 Number of candidates registered by IB region May 2005–May 2009
Number of candidates
registered by IB region
May 2005 May 2006 May 2007 May 2008 May 2009
IBAEM 13,221 14,884 16,533 18,214 20,852
IBAP 4,782 5,382 6,240 7,357 9,130
IBA 46,078 51,904 57,161 62,206 66,794
Total 64,081 72,170 79,934 87,777 96,776
Graph 10.1 Number of candidates registered by IB region May 2005–May 2009
0
10000
20000
30000
40000
50000
60000
70000
80000
May 2005 May 2006 May 2007 May 2008 May 2009
Examination session
Nu
mb
er
of
can
did
ate
s
IBAEM
IBA
IBAP
Percentage of
candidates registered by
IB region
May 2005 May 2006 May 2007 May 2008 May 2009
IBAEM 20.63% 20.62% 20.68% 20.75% 21.55%
IBAP 7.46% 7.46% 7.81% 8.38% 9.43%
IBA 71.91% 71.92% 71.51% 70.87% 69.02%
15
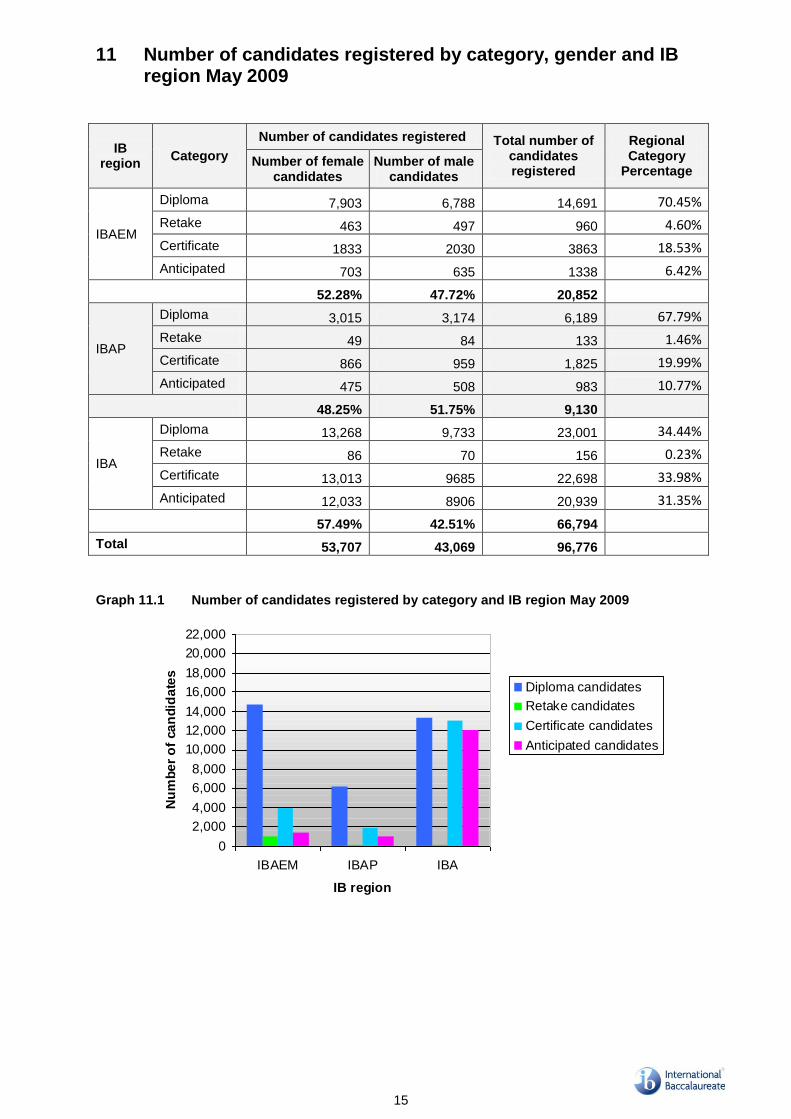
11 Number of candidates registered by category, gender and IB region May 2009
IB region
Category
Number of candidates registered Total number of candidates registered
Regional Category
Percentage Number of female
candidates Number of male
candidates
IBAEM
Diploma 7,903 6,788 14,691 70.45%
Retake 463 497 960 4.60%
Certificate 1833 2030 3863 18.53%
Anticipated 703 635 1338 6.42%
52.28% 47.72% 20,852
IBAP
Diploma 3,015 3,174 6,189 67.79%
Retake 49 84 133 1.46%
Certificate 866 959 1,825 19.99%
Anticipated 475 508 983 10.77%
48.25% 51.75% 9,130
IBA
Diploma 13,268 9,733 23,001 34.44%
Retake 86 70 156 0.23%
Certificate 13,013 9685 22,698 33.98%
Anticipated 12,033 8906 20,939 31.35%
57.49% 42.51% 66,794
Total 53,707 43,069 96,776
Graph 11.1 Number of candidates registered by category and IB region May 2009
0
2,000
4,000
6,000
8,000
10,000
12,000
14,000
16,000
18,000
20,000
22,000
IBAEM IBAP IBA
IB region
Nu
mb
er
of
ca
nd
ida
tes
Diploma candidates
Retake candidates
Certificate candidates
Anticipated candidates

16
12 Summary of Diploma Programme examination entries: schools with registered candidates May 1975–May 2009
Year Number of
schools entered
Percentage of increase
Number of candidates examined
Percentage of increase
Average number of candidates per school
Number of diploma and
retake candidates
Average number of diploma
and retake candidates per school
1975 30 30% 1,217 19% 40.6 377 12.6
1976 37 23% 1,600 31% 43.2 567 15.3
1977 44 19% 1,966 23% 44.7 644 14.6
1978 52 18% 2,222 13% 42.7 680 13.1
1979 61 17% 2,479 12% 40.6 835 13.7
1980 76 25% 2,845 15% 37.4 1,005 13.2
1981 96 26% 3,719 31% 38.7 1,244 13.0
1982 111 16% 4,644 25% 41.8 1,505 13.6
1983 131 18% 5,021 8% 38.3 1,603 12.2
1984 163 24% 6,385 27% 39.2 2,183 13.4
1985 180 10% 7,606 19% 42.3 2,440 13.6
1986 209 16% 8,389 10% 40.1 2,679 12.8
1987 246 18% 9,387 12% 38.2 2,942 12.0
1988 270 10% 11,233 20% 41.6 3,564 13.2
1989 291 8% 11,946 6% 41.1 3,904 13.4
1990 301 3% 13,321 12% 44.3 4,287 14.2
1991 322 7% 14,749 11% 45.8 4,811 14.9
1992 346 7% 16,078 9% 46.5 5,693 16.5
1993 370 7% 17,552 9% 47.4 6,432 17.4
1994 405 9% 19,509 11% 48.2 7,331 18.1
1995 437 8% 21,361 9% 48.9 8,403 19.2
1996 455 4% 23,448 10% 51.5 9,396 20.7
1997 502 10% 26,570 13% 52.9 10,868 21.6
1998 568 13% 29,505 11% 51.9 12,476 22.0
1999 631 11% 33,143 12% 52.5 14,001 22.2
2000 678 7% 36,758 11% 54.2 15,592 23.0
2001 743 10% 40,579 10% 54.6 16,880 22.7
2002 825 11% 46,659 15% 56.6 19,796 24.0
2003 890 8% 52,110 12% 58.6 22,662 25.5
2004 974 9% 57,230 10% 58.8 25,111 25.8
2005 1,059 9% 64,081 12% 60.5 27,971 26.4
2006 1,178 11% 72,170 13% 61.3 32,126 27.3
2007 1,289 9% 79,934 11% 62.0 35,903 30.2
2008 1,432 11% 87,777 10% 61.3 39,914 30.4
2009 1,582 10% 96,776 10% 61.2 45,130 31.3

17
Graph 12.1 Summary of Diploma Programme examination entries: schools with candidates registered May 1975–May 2009
Graph 12.2 Summary of Diploma Programme examination entries: total number of candidates registered; number of diploma and retake candidates registered May 1975–May 2009
0
200
400
600
800
1,000
1,200
1,400
1,600
1,800
1975 1978 1981 1984 1987 1990 1993 1996 1999 2002 2005 2008
Number of schools entered
0
20,000
40,000
60,000
80,000
100,000
120,000
1975 1978 1981 1984 1987 1990 1993 1996 1999 2002 2005 2008
Number of candidates examined Number of diploma and retake candidates
18
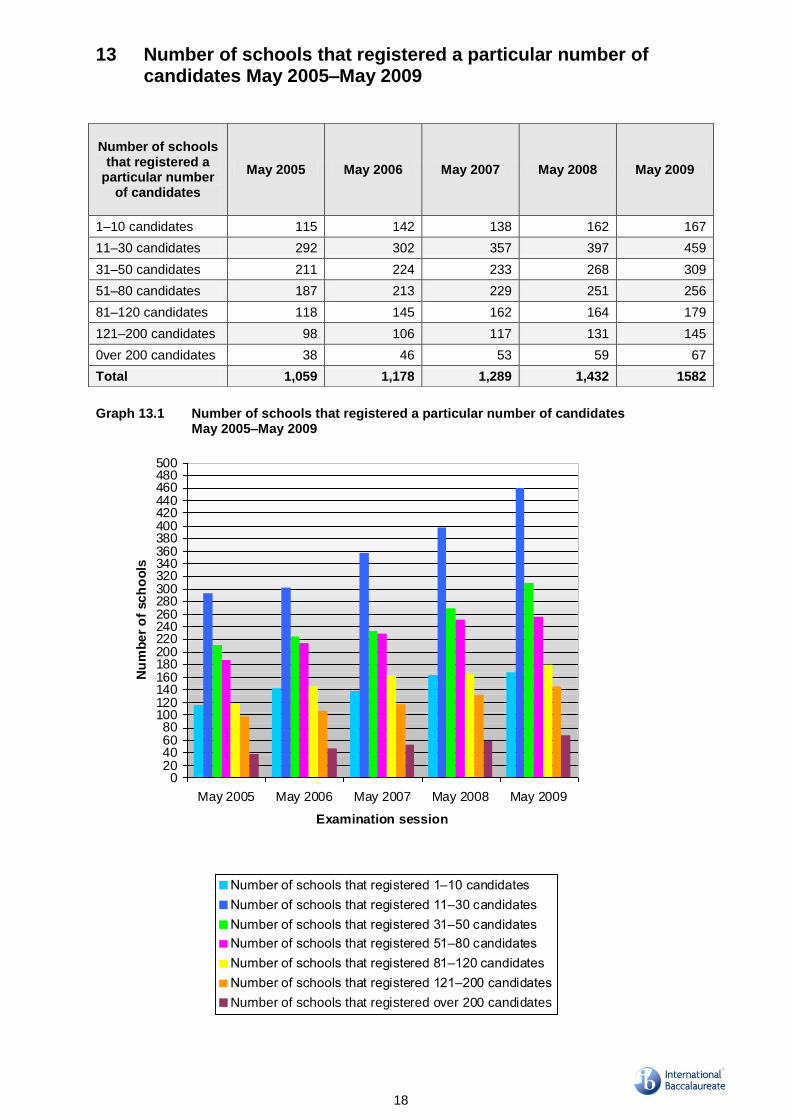
13 Number of schools that registered a particular number of candidates May 2005–May 2009
Graph 13.1 Number of schools that registered a particular number of candidates
May 2005–May 2009
020406080
100120140160180200220240260280300320340360380400420440460480500
May 2005 May 2006 May 2007 May 2008 May 2009
Examination session
Nu
mb
er
of
sc
ho
ols
Number of schools that registered 1–10 candidates
Number of schools that registered 11–30 candidates
Number of schools that registered 31–50 candidates
Number of schools that registered 51–80 candidates
Number of schools that registered 81–120 candidates
Number of schools that registered 121–200 candidates
Number of schools that registered over 200 candidates
Number of schools
that registered a particular number
of candidates
May 2005 May 2006 May 2007 May 2008 May 2009
1–10 candidates 115 142 138 162 167
11–30 candidates 292 302 357 397 459
31–50 candidates 211 224 233 268 309
51–80 candidates 187 213 229 251 256
81–120 candidates 118 145 162 164 179
121–200 candidates 98 106 117 131 145
0ver 200 candidates 38 46 53 59 67
Total 1,059 1,178 1,289 1,432 1582

19
14 Subject registration summary May 2009
Subject group
Subject registrations Number of subjects
English French Spanish German* Portuguese* Total Higher level
Standard level
Total
Group 1 – – – – – 55,416 45 72 117
Group 2 – – – – – 60,692 35 47 82
Group 3 72,582 665 3,213 119 0 76,579 9 11 20
Group 4 67,901 698 2,866 119 0 71,584 4 5 9
Group 5 53,952 529 2,592 0 0 57,073 2 4 6
Group 6 15,648 32 883 0 0 16,563 4 4 8
PS 346 0 0 0 0 346 1 3 4
SBS 677 0 0 0 41 718 0 14 14
Totals 211,106 1,924 9,554 238 41 338,971 100 160 260
*Subject registration in German is only allowed for History and Biology, and in Portuguese for SBS.
15 Subject group registrations May 2005–May 2009 Graph 15.1 Number of candidates registered for subject groups May 2004–May 2008
0
5,000
10,000
15,000
20,000
25,000
30,000
35,000
40,000
45,000
50,000
55,000
60,000
65,000
70,000
75,000
80,000
May 2005 May 2006 May 2007 May 2008 May 2009
Examination session
Nu
mb
er
of
can
did
ate
s
Group 1
Group 2
Group 3
Group 4
Group 5
Group 6
Pilot subjects
School-based syllabuses

20
16 Additional Diploma Programme requirements: extended essay and theory of knowledge May 2005–2009
Number of candidates
registered for extended essay and theory of knowledge
May 2005 May 2006 May 2007 May 2008 May 2009
Extended essay 28,069 32,068 35,828 39,827 45,403
Theory of knowledge 27,487 31,576 35,227 39,240 44,204
17 Subject registration summary: extended essay by subject group May 2009
Number of EE candidates
registered for a particular
subject group
Group 1 Group 2 Group 3 Group 4 Group 5 Group 6 Pilot
subjects Total
7,317 2,580 23,481 6,912 1,168 3,371 574 45,403
Percentage of EE
candidates registered for a particular
subject group
16.12% 5.68% 51.72% 15.22% 2.57% 7.42% 1.26% 100.00%
Graph 17.1 Subject registration summary: extended essay by subject group May 2009
Pilot subjects
Group 5
Group 6
Group 1
Group 2
Group 4
Group 3
Group 1
Group 2
Group 3
Group 4
Group 5
Group 6
Pilot subjects

21
18 Subject registration summary: theory of knowledge by language May 2009
Theory of knowledge registration by language
English French Spanish German
Chinese
Total
Number of candidates registered
41,149 475 2,464 13 103 44,204
Percentage of candidates registered
93.09% 1.07% 5.57% 0.03% 0.23% 100.00%
Graph 18.1 Subject registration summary: theory of knowledge by language May 2009
Spanish
German
Fre
nch
Chinese
English
English
French
Spanish
German
Chinese
22
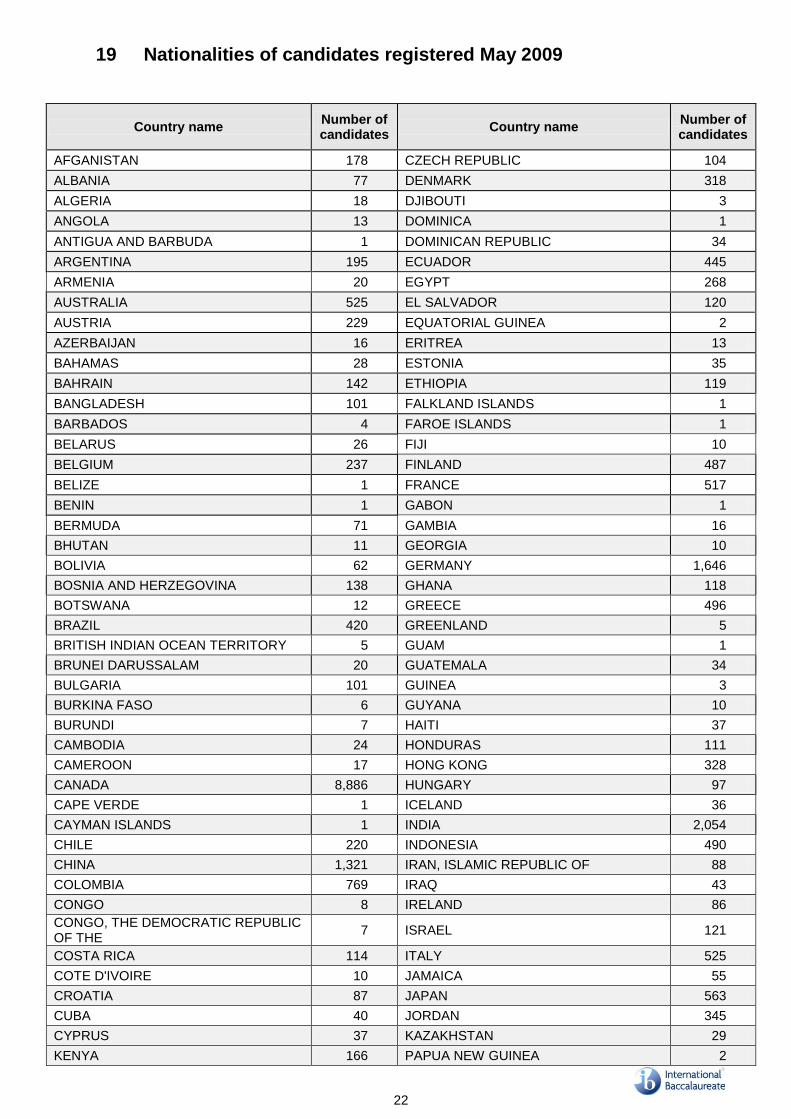
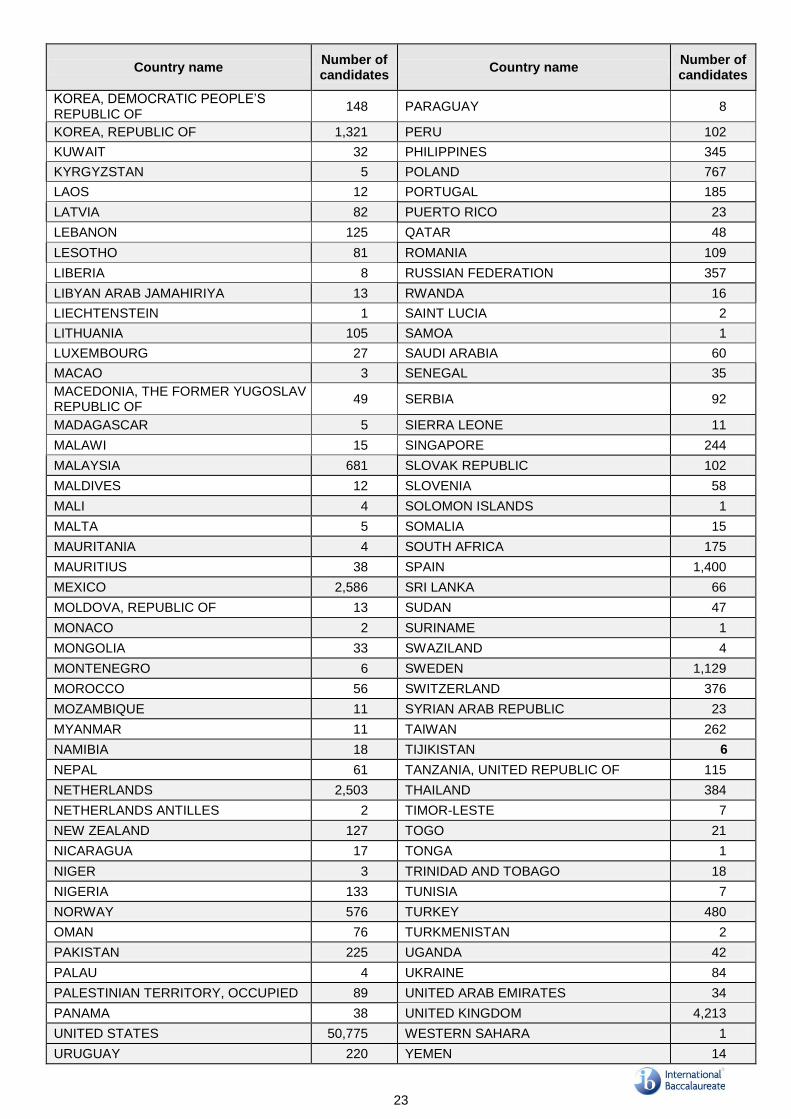
19 Nationalities of candidates registered May 2009
Country name Number of candidates
Country name Number of candidates
AFGANISTAN 178 CZECH REPUBLIC 104
ALBANIA 77 DENMARK 318
ALGERIA 18 DJIBOUTI 3
ANGOLA 13 DOMINICA 1
ANTIGUA AND BARBUDA 1 DOMINICAN REPUBLIC 34
ARGENTINA 195 ECUADOR 445
ARMENIA 20 EGYPT 268
AUSTRALIA 525 EL SALVADOR 120
AUSTRIA 229 EQUATORIAL GUINEA 2
AZERBAIJAN 16 ERITREA 13
BAHAMAS 28 ESTONIA 35
BAHRAIN 142 ETHIOPIA 119
BANGLADESH 101 FALKLAND ISLANDS 1
BARBADOS 4 FAROE ISLANDS 1
BELARUS 26 FIJI 10
BELGIUM 237 FINLAND 487
BELIZE 1 FRANCE 517
BENIN 1 GABON 1
BERMUDA 71 GAMBIA 16
BHUTAN 11 GEORGIA 10
BOLIVIA 62 GERMANY 1,646
BOSNIA AND HERZEGOVINA 138 GHANA 118
BOTSWANA 12 GREECE 496
BRAZIL 420 GREENLAND 5
BRITISH INDIAN OCEAN TERRITORY 5 GUAM 1
BRUNEI DARUSSALAM 20 GUATEMALA 34
BULGARIA 101 GUINEA 3
BURKINA FASO 6 GUYANA 10
BURUNDI 7 HAITI 37
CAMBODIA 24 HONDURAS 111
CAMEROON 17 HONG KONG 328
CANADA 8,886 HUNGARY 97
CAPE VERDE 1 ICELAND 36
CAYMAN ISLANDS 1 INDIA 2,054
CHILE 220 INDONESIA 490
CHINA 1,321 IRAN, ISLAMIC REPUBLIC OF 88
COLOMBIA 769 IRAQ 43
CONGO 8 IRELAND 86
CONGO, THE DEMOCRATIC REPUBLIC OF THE
7 ISRAEL 121
COSTA RICA 114 ITALY 525
COTE D'IVOIRE 10 JAMAICA 55
CROATIA 87 JAPAN 563
CUBA 40 JORDAN 345
CYPRUS 37 KAZAKHSTAN 29
KENYA 166 PAPUA NEW GUINEA 2
23
Country name Number of candidates
Country name Number of candidates
KOREA, DEMOCRATIC PEOPLE’S REPUBLIC OF
148 PARAGUAY 8
KOREA, REPUBLIC OF 1,321 PERU 102
KUWAIT 32 PHILIPPINES 345
KYRGYZSTAN 5 POLAND 767
LAOS 12 PORTUGAL 185
LATVIA 82 PUERTO RICO 23
LEBANON 125 QATAR 48
LESOTHO 81 ROMANIA 109
LIBERIA 8 RUSSIAN FEDERATION 357
LIBYAN ARAB JAMAHIRIYA 13 RWANDA 16
LIECHTENSTEIN 1 SAINT LUCIA 2
LITHUANIA 105 SAMOA 1
LUXEMBOURG 27 SAUDI ARABIA 60
MACAO 3 SENEGAL 35
MACEDONIA, THE FORMER YUGOSLAV REPUBLIC OF
49 SERBIA 92
MADAGASCAR 5 SIERRA LEONE 11
MALAWI 15 SINGAPORE 244
MALAYSIA 681 SLOVAK REPUBLIC 102
MALDIVES 12 SLOVENIA 58
MALI 4 SOLOMON ISLANDS 1
MALTA 5 SOMALIA 15
MAURITANIA 4 SOUTH AFRICA 175
MAURITIUS 38 SPAIN 1,400
MEXICO 2,586 SRI LANKA 66
MOLDOVA, REPUBLIC OF 13 SUDAN 47
MONACO 2 SURINAME 1
MONGOLIA 33 SWAZILAND 4
MONTENEGRO 6 SWEDEN 1,129
MOROCCO 56 SWITZERLAND 376
MOZAMBIQUE 11 SYRIAN ARAB REPUBLIC 23
MYANMAR 11 TAIWAN 262
NAMIBIA 18 TIJIKISTAN 6
NEPAL 61 TANZANIA, UNITED REPUBLIC OF 115
NETHERLANDS 2,503 THAILAND 384
NETHERLANDS ANTILLES 2 TIMOR-LESTE 7
NEW ZEALAND 127 TOGO 21
NICARAGUA 17 TONGA 1
NIGER 3 TRINIDAD AND TOBAGO 18
NIGERIA 133 TUNISIA 7
NORWAY 576 TURKEY 480
OMAN 76 TURKMENISTAN 2
PAKISTAN 225 UGANDA 42
PALAU 4 UKRAINE 84
PALESTINIAN TERRITORY, OCCUPIED 89 UNITED ARAB EMIRATES 34
PANAMA 38 UNITED KINGDOM 4,213
UNITED STATES 50,775 WESTERN SAHARA 1
URUGUAY 220 YEMEN 14

24
Country name Number of candidates
Country name Number of candidates
US MINOR OUTLINING ISLANDS 5 YUGOSLAVIA 3
UZBEKISTAN 22 ZAMBIA 29
VENEZUELA 283 ZIMBABWE 50
VIETNAM 291 OTHER 178
VIRGIN ISLANDS, U.S. 1
Total number of nationalities: 202 (192 are above, and 10 other nationalities are from dual nationality candidates whose second nationality is not in the above) Candidates with dual nationality (Second nationality is not included in the above): 9,646
25
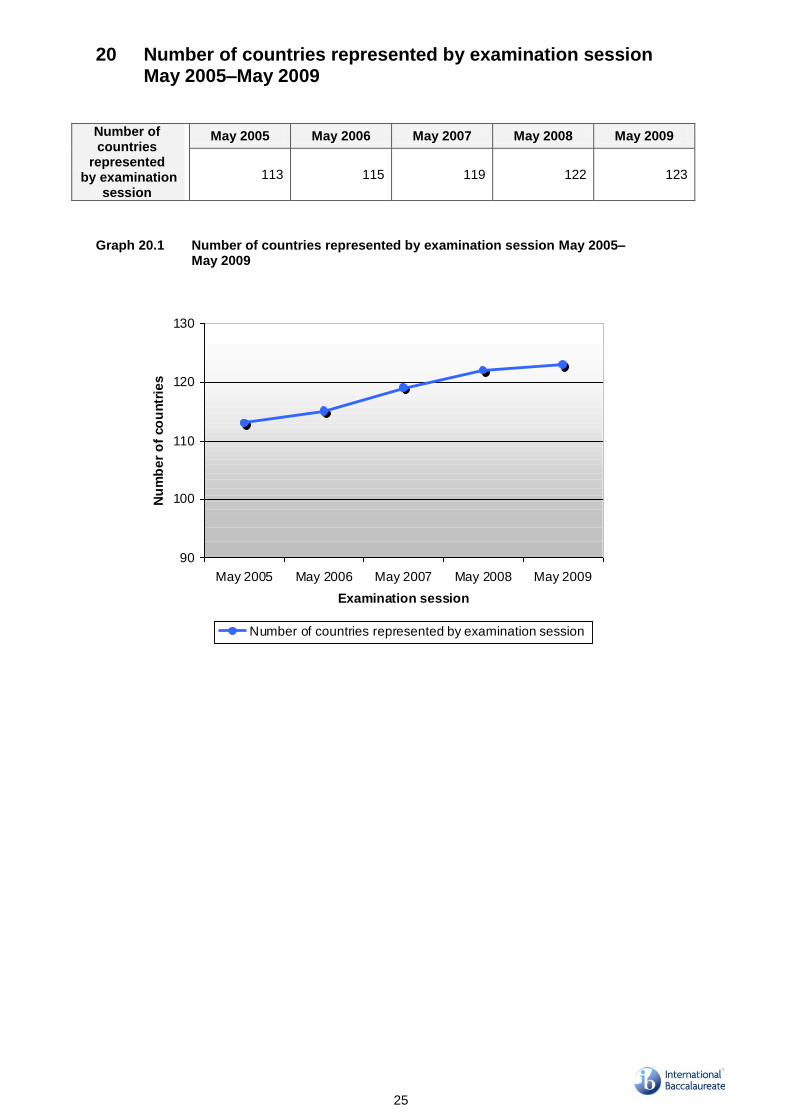
20 Number of countries represented by examination session May 2005–May 2009
Number of countries
represented by examination
session
May 2005 May 2006 May 2007 May 2008 May 2009
113 115 119 122 123
Graph 20.1 Number of countries represented by examination session May 2005–
May 2009
90
100
110
120
130
May 2005 May 2006 May 2007 May 2008 May 2009
Examination session
Nu
mb
er
of
co
un
trie
s
Number of countries represented by examination session
26
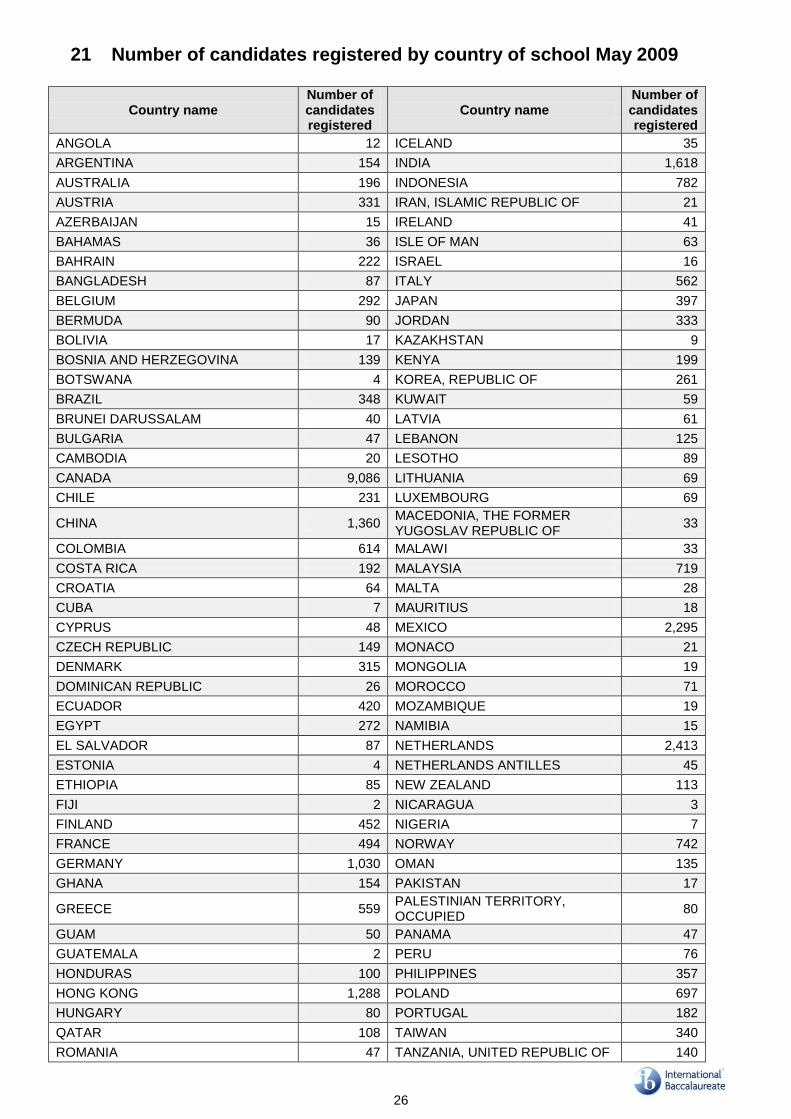
21 Number of candidates registered by country of school May 2009
Country name Number of candidates registered
Country name Number of candidates registered
ANGOLA 12 ICELAND 35
ARGENTINA 154 INDIA 1,618
AUSTRALIA 196 INDONESIA 782
AUSTRIA 331 IRAN, ISLAMIC REPUBLIC OF 21
AZERBAIJAN 15 IRELAND 41
BAHAMAS 36 ISLE OF MAN 63
BAHRAIN 222 ISRAEL 16
BANGLADESH 87 ITALY 562
BELGIUM 292 JAPAN 397
BERMUDA 90 JORDAN 333
BOLIVIA 17 KAZAKHSTAN 9
BOSNIA AND HERZEGOVINA 139 KENYA 199
BOTSWANA 4 KOREA, REPUBLIC OF 261
BRAZIL 348 KUWAIT 59
BRUNEI DARUSSALAM 40 LATVIA 61
BULGARIA 47 LEBANON 125
CAMBODIA 20 LESOTHO 89
CANADA 9,086 LITHUANIA 69
CHILE 231 LUXEMBOURG 69
CHINA 1,360 MACEDONIA, THE FORMER YUGOSLAV REPUBLIC OF
33
COLOMBIA 614 MALAWI 33
COSTA RICA 192 MALAYSIA 719
CROATIA 64 MALTA 28
CUBA 7 MAURITIUS 18
CYPRUS 48 MEXICO 2,295
CZECH REPUBLIC 149 MONACO 21
DENMARK 315 MONGOLIA 19
DOMINICAN REPUBLIC 26 MOROCCO 71
ECUADOR 420 MOZAMBIQUE 19
EGYPT 272 NAMIBIA 15
EL SALVADOR 87 NETHERLANDS 2,413
ESTONIA 4 NETHERLANDS ANTILLES 45
ETHIOPIA 85 NEW ZEALAND 113
FIJI 2 NICARAGUA 3
FINLAND 452 NIGERIA 7
FRANCE 494 NORWAY 742
GERMANY 1,030 OMAN 135
GHANA 154 PAKISTAN 17
GREECE 559 PALESTINIAN TERRITORY, OCCUPIED
80
GUAM 50 PANAMA 47
GUATEMALA 2 PERU 76
HONDURAS 100 PHILIPPINES 357
HONG KONG 1,288 POLAND 697
HUNGARY 80 PORTUGAL 182
QATAR 108 TAIWAN 340
ROMANIA 47 TANZANIA, UNITED REPUBLIC OF 140

27
Country name Number of candidates registered
Country name Number of candidates registered
RUSSIAN FEDERATION 122 THAILAND 627
RWANDA 5 TOGO 43
SAUDI ARABIA 161 TUNISIA 26
SENEGAL 22 TURKEY 450
SERBIA 49 UGANDA 82
SINGAPORE 642 UKRAINE 35
SLOVAKIA 90 UNITED ARAB EMIRATES 475
SLOVENIA 67 UNITED KINGDOM 3,976
SOUTH AFRICA 40 UNITED STATES 52,465
SPAIN 1,429 URUGUAY 206
SRI LANKA 54 UZBEKISTAN 10
SUDAN 13 VENEZUELA 254
SWAZILAND 22 VIETNAM 141
SWEDEN 1,130 ZAMBIA 51
SWITZERLAND 1,184 ZIMBABWE 42
SYRIAN ARAB REPUBLIC 13 Total number of candidates registered
96,776

28
PART C: results statistics
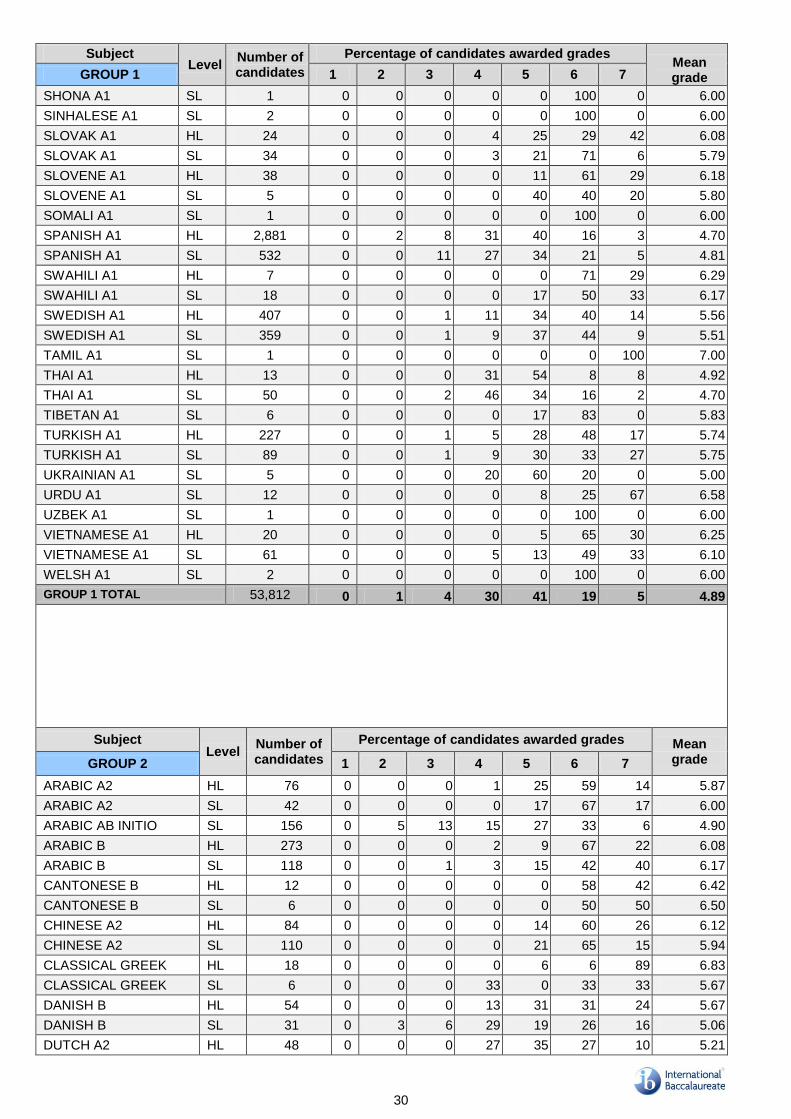
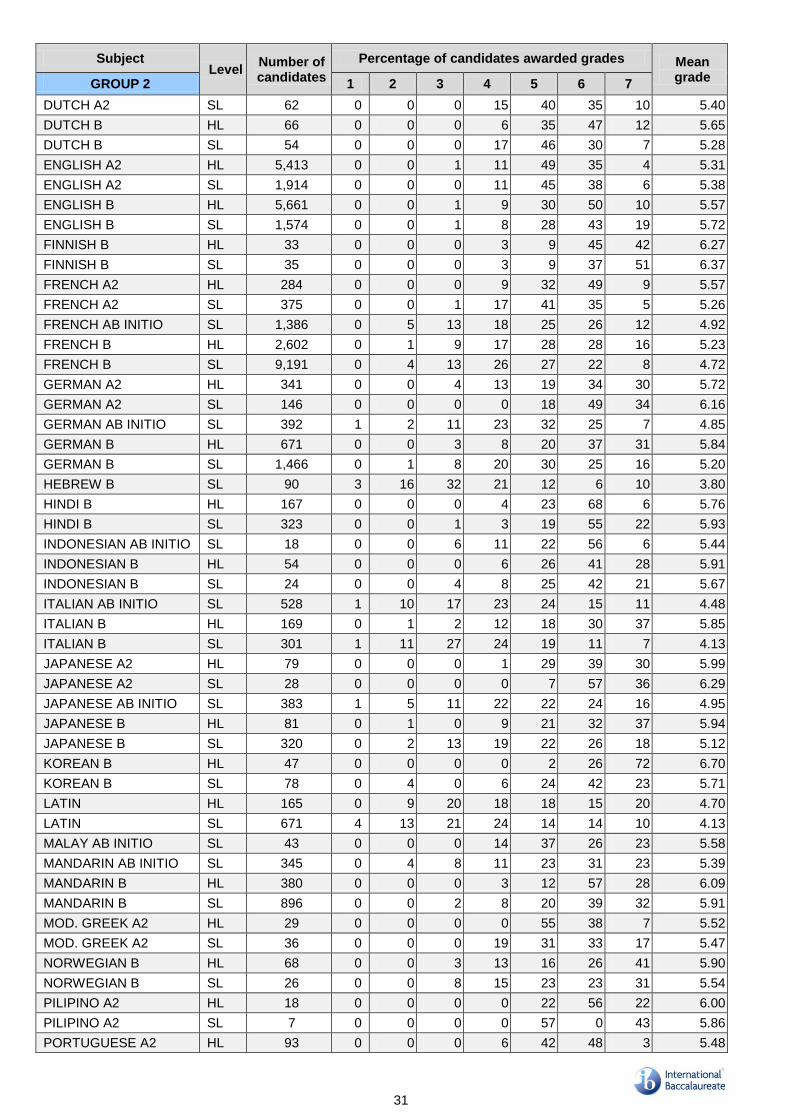
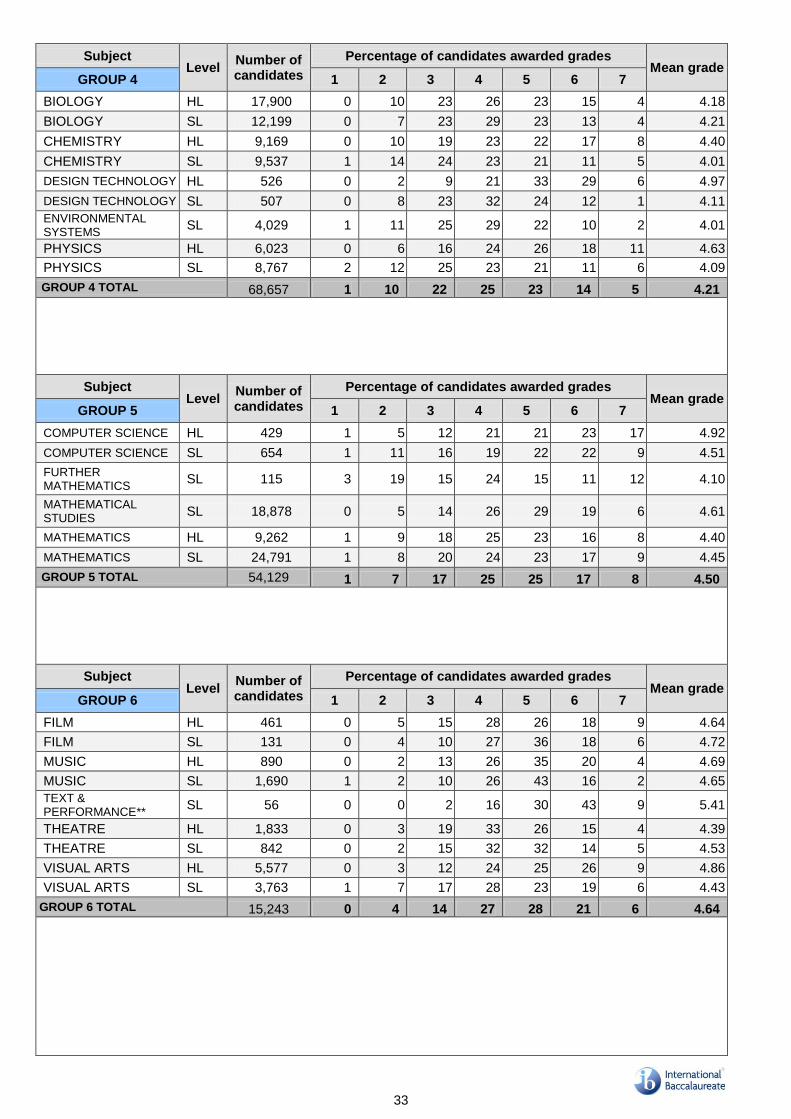
22 Analysis of examination results by subject and level May 2009
Subject Level
Number of candidates
Percentage of candidates awarded grades Mean grade
GROUP 1 1 2 3 4 5 6 7
ALBANIAN A1 HL 1 0 0 0 0 0 0 100 7.00
ALBANIAN A1 SL 13 0 0 0 0 0 0 100 7.00
AMHARIC A1 HL 5 0 0 0 0 0 40 60 6.60
AMHARIC A1 SL 24 0 0 0 0 4 54 42 6.38
ARABIC A1 HL 175 0 0 1 14 65 20 1 5.06
ARABIC A1 SL 296 1 0 0 7 39 47 6 5.50
ARMENIAN A1 SL 1 0 0 0 0 0 100 0 6.00
BELARUSIAN A1 SL 4 0 0 0 0 0 50 50 6.50
BENGALI A1 SL 8 0 0 0 0 13 75 13 6.00
BOSNIAN A1 HL 45 0 0 0 16 56 24 4 5.18
BOSNIAN A1 SL 17 0 0 0 0 18 59 24 6.06
BULGARIAN A1 HL 23 0 0 0 0 22 43 35 6.13
BULGARIAN A1 SL 19 0 0 0 0 5 58 37 6.32
BURMESE A1 SL 2 0 0 0 0 100 0 0 5.00
CATALAN A1 HL 18 0 0 0 0 28 33 39 6.11
CATALAN A1 SL 32 0 0 0 0 9 38 53 6.44
CHICHEWA A1 SL 1 0 0 0 0 100 0 0 5.00
CHINESE A1 HL 376 0 1 3 19 39 32 5 5.15
CHINESE A1 SL 366 0 0 2 14 30 42 13 5.48
CROATIAN A1 HL 35 0 0 0 9 26 46 20 5.77
CROATIAN A1 SL 25 0 0 0 4 48 40 8 5.52
CZECH A1 HL 58 0 0 0 17 43 33 7 5.29
CZECH A1 SL 10 0 0 10 20 30 10 30 5.30
DANISH A1 HL 109 0 0 0 3 28 47 23 5.90
DANISH A1 SL 54 0 0 0 2 19 52 28 6.06
DHIVEHI A1 SL 3 0 0 0 33 33 0 33 5.33
DUTCH A1 HL 62 0 0 3 24 58 13 2 4.85
DUTCH A1 SL 127 0 0 5 15 28 38 14 5.42
DZONGKHA A1 SL 4 0 0 0 0 50 50 0 5.50
ENGLISH A1 HL 32,778 0 0 5 35 43 14 2 4.70
ENGLISH A1 SL 8,376 0 0 4 27 43 22 4 4.94
ESTONIAN A1 SL 6 0 0 0 0 0 0 100 7.00
FINNISH A1 HL 134 0 0 0 10 46 35 8 5.41
FINNISH A1 SL 123 0 0 0 8 38 47 7 5.52
FRENCH A1 HL 461 0 0 1 20 41 31 6 5.19
FRENCH A1 SL 210 0 1 4 27 28 28 11 5.10
GEORGIAN A1 SL 1 0 0 0 0 100 0 0 5.00
GERMAN A1 HL 762 0 0 1 14 42 32 11 5.37
GERMAN A1 SL 347 0 0 1 13 33 35 18 5.58
GREENLAND A1 SL 4 0 0 0 0 0 100 0 6.00
HEBREW A1 HL 7 0 0 0 0 0 43 57 6.57
HEBREW A1 SL 27 0 0 0 0 4 44 52 6.48

29
Subject Level
Number of candidates
Percentage of candidates awarded grades Mean grade
GROUP 1 1 2 3 4 5 6 7
HINDI A1 SL 47 0 0 2 2 21 49 26 5.94
HUNGARIAN A1 HL 13 0 0 0 0 15 23 62 6.46
HUNGARIAN A1 SL 24 0 0 0 8 33 25 33 5.83
ICELANDIC A1 HL 2 0 0 0 0 50 0 50 6.00
ICELANDIC A1 SL 7 0 0 0 14 14 57 14 5.71
INDONESIAN A1 HL 136 0 0 0 2 34 43 21 5.82
INDONESIAN A1 SL 194 0 0 0 6 19 52 24 5.93
ITALIAN A1 HL 172 0 0 2 41 38 13 6 4.81
ITALIAN A1 SL 75 0 1 7 27 28 27 11 5.04
JAPANESE A1 HL 102 0 0 0 2 12 44 42 6.26
JAPANESE A1 SL 84 0 0 0 1 11 62 26 6.13
KAZAKH A1 SL 2 0 50 0 50 0 0 0 3.00
KHMER A1 SL 9 0 0 0 0 0 44 56 6.56
KINYARWAND A1 SL 2 0 0 0 0 0 50 50 6.50
KOREAN A1 HL 232 0 0 0 0 9 46 45 6.36
KOREAN A1 SL 220 0 0 0 0 7 54 39 6.30
KURDISH A1 SL 1 0 0 0 0 0 100 0 6.00
LATVIAN A1 HL 32 0 0 0 6 13 50 31 6.06
LATVIAN A1 SL 13 0 0 15 8 15 38 23 5.46
LITHUANIAN A1 HL 24 0 0 0 0 8 42 50 6.42
LITHUANIAN A1 SL 55 0 0 5 4 15 40 36 5.98
MACEDONIAN A1 HL 30 0 0 0 0 0 23 77 6.77
MACEDONIAN A1 SL 8 0 0 0 0 0 0 100 7.00
MALAY A1 HL 10 0 0 0 0 10 70 20 6.10
MALAY A1 SL 441 0 0 0 0 1 35 64 6.63
MODERN GREEK A1 HL 228 0 0 0 12 45 27 15 5.44
MODERN GREEK A1 SL 178 0 0 1 8 37 42 12 5.58
MONGOLIAN A1 HL 4 0 0 0 0 25 25 50 6.25
MONGOLIAN A1 SL 7 0 0 0 0 29 29 43 6.14
NEPALI A1 SL 8 0 0 0 0 13 13 75 6.63
NORWEGIAN A1 HL 245 0 0 1 8 30 41 20 5.70
NORWEGIAN A1 SL 111 1 0 5 10 30 39 16 5.49
PERSIAN A1 HL 1 0 0 0 0 100 0 0 5.00
PERSIAN A1 SL 20 0 5 0 20 25 30 20 5.35
PILIPINO A1 HL 3 0 0 0 0 67 33 0 5.33
PILIPINO A1 SL 1 0 0 0 0 0 100 0 6.00
POLISH A1 HL 197 0 1 5 19 45 22 8 5.05
POLISH A1 SL 391 0 1 3 18 40 32 6 5.16
PORTUGUESE A1 HL 91 0 3 12 30 26 22 7 4.71
PORTUGUESE A1 SL 96 0 0 4 22 27 35 11 5.28
ROMANIAN A1 HL 7 0 0 0 0 14 71 14 6.00
ROMANIAN A1 SL 13 0 0 0 0 8 77 15 6.08
RUSSIAN A1 HL 77 0 1 4 19 32 34 9 5.21
RUSSIAN A1 SL 121 0 2 7 26 23 31 11 5.06
SERBIAN A1 HL 30 0 0 0 3 13 53 30 6.10
SERBIAN A1 SL 39 0 3 0 8 28 33 28 5.74
SESOTHO A1 HL 29 0 0 0 0 14 86 0 5.86
SESOTHO A1 SL 35 0 0 0 0 9 74 17 6.09
30
Subject Level
Number of candidates
Percentage of candidates awarded grades Mean grade GROUP 1 1 2 3 4 5 6 7
SHONA A1 SL 1 0 0 0 0 0 100 0 6.00
SINHALESE A1 SL 2 0 0 0 0 0 100 0 6.00
SLOVAK A1 HL 24 0 0 0 4 25 29 42 6.08
SLOVAK A1 SL 34 0 0 0 3 21 71 6 5.79
SLOVENE A1 HL 38 0 0 0 0 11 61 29 6.18
SLOVENE A1 SL 5 0 0 0 0 40 40 20 5.80
SOMALI A1 SL 1 0 0 0 0 0 100 0 6.00
SPANISH A1 HL 2,881 0 2 8 31 40 16 3 4.70
SPANISH A1 SL 532 0 0 11 27 34 21 5 4.81
SWAHILI A1 HL 7 0 0 0 0 0 71 29 6.29
SWAHILI A1 SL 18 0 0 0 0 17 50 33 6.17
SWEDISH A1 HL 407 0 0 1 11 34 40 14 5.56
SWEDISH A1 SL 359 0 0 1 9 37 44 9 5.51
TAMIL A1 SL 1 0 0 0 0 0 0 100 7.00
THAI A1 HL 13 0 0 0 31 54 8 8 4.92
THAI A1 SL 50 0 0 2 46 34 16 2 4.70
TIBETAN A1 SL 6 0 0 0 0 17 83 0 5.83
TURKISH A1 HL 227 0 0 1 5 28 48 17 5.74
TURKISH A1 SL 89 0 0 1 9 30 33 27 5.75
UKRAINIAN A1 SL 5 0 0 0 20 60 20 0 5.00
URDU A1 SL 12 0 0 0 0 8 25 67 6.58
UZBEK A1 SL 1 0 0 0 0 0 100 0 6.00
VIETNAMESE A1 HL 20 0 0 0 0 5 65 30 6.25
VIETNAMESE A1 SL 61 0 0 0 5 13 49 33 6.10
WELSH A1 SL 2 0 0 0 0 0 100 0 6.00
GROUP 1 TOTAL 53,812 0 1 4 30 41 19 5 4.89
Subject Level
Number of candidates
Percentage of candidates awarded grades Mean grade GROUP 2 1 2 3 4 5 6 7
ARABIC A2 HL 76 0 0 0 1 25 59 14 5.87
ARABIC A2 SL 42 0 0 0 0 17 67 17 6.00
ARABIC AB INITIO SL 156 0 5 13 15 27 33 6 4.90
ARABIC B HL 273 0 0 0 2 9 67 22 6.08
ARABIC B SL 118 0 0 1 3 15 42 40 6.17
CANTONESE B HL 12 0 0 0 0 0 58 42 6.42
CANTONESE B SL 6 0 0 0 0 0 50 50 6.50
CHINESE A2 HL 84 0 0 0 0 14 60 26 6.12
CHINESE A2 SL 110 0 0 0 0 21 65 15 5.94
CLASSICAL GREEK HL 18 0 0 0 0 6 6 89 6.83
CLASSICAL GREEK SL 6 0 0 0 33 0 33 33 5.67
DANISH B HL 54 0 0 0 13 31 31 24 5.67
DANISH B SL 31 0 3 6 29 19 26 16 5.06
DUTCH A2 HL 48 0 0 0 27 35 27 10 5.21
31
Subject Level
Number of candidates
Percentage of candidates awarded grades Mean grade
GROUP 2 1 2 3 4 5 6 7
DUTCH A2 SL 62 0 0 0 15 40 35 10 5.40
DUTCH B HL 66 0 0 0 6 35 47 12 5.65
DUTCH B SL 54 0 0 0 17 46 30 7 5.28
ENGLISH A2 HL 5,413 0 0 1 11 49 35 4 5.31
ENGLISH A2 SL 1,914 0 0 0 11 45 38 6 5.38
ENGLISH B HL 5,661 0 0 1 9 30 50 10 5.57
ENGLISH B SL 1,574 0 0 1 8 28 43 19 5.72
FINNISH B HL 33 0 0 0 3 9 45 42 6.27
FINNISH B SL 35 0 0 0 3 9 37 51 6.37
FRENCH A2 HL 284 0 0 0 9 32 49 9 5.57
FRENCH A2 SL 375 0 0 1 17 41 35 5 5.26
FRENCH AB INITIO SL 1,386 0 5 13 18 25 26 12 4.92
FRENCH B HL 2,602 0 1 9 17 28 28 16 5.23
FRENCH B SL 9,191 0 4 13 26 27 22 8 4.72
GERMAN A2 HL 341 0 0 4 13 19 34 30 5.72
GERMAN A2 SL 146 0 0 0 0 18 49 34 6.16
GERMAN AB INITIO SL 392 1 2 11 23 32 25 7 4.85
GERMAN B HL 671 0 0 3 8 20 37 31 5.84
GERMAN B SL 1,466 0 1 8 20 30 25 16 5.20
HEBREW B SL 90 3 16 32 21 12 6 10 3.80
HINDI B HL 167 0 0 0 4 23 68 6 5.76
HINDI B SL 323 0 0 1 3 19 55 22 5.93
INDONESIAN AB INITIO SL 18 0 0 6 11 22 56 6 5.44
INDONESIAN B HL 54 0 0 0 6 26 41 28 5.91
INDONESIAN B SL 24 0 0 4 8 25 42 21 5.67
ITALIAN AB INITIO SL 528 1 10 17 23 24 15 11 4.48
ITALIAN B HL 169 0 1 2 12 18 30 37 5.85
ITALIAN B SL 301 1 11 27 24 19 11 7 4.13
JAPANESE A2 HL 79 0 0 0 1 29 39 30 5.99
JAPANESE A2 SL 28 0 0 0 0 7 57 36 6.29
JAPANESE AB INITIO SL 383 1 5 11 22 22 24 16 4.95
JAPANESE B HL 81 0 1 0 9 21 32 37 5.94
JAPANESE B SL 320 0 2 13 19 22 26 18 5.12
KOREAN B HL 47 0 0 0 0 2 26 72 6.70
KOREAN B SL 78 0 4 0 6 24 42 23 5.71
LATIN HL 165 0 9 20 18 18 15 20 4.70
LATIN SL 671 4 13 21 24 14 14 10 4.13
MALAY AB INITIO SL 43 0 0 0 14 37 26 23 5.58
MANDARIN AB INITIO SL 345 0 4 8 11 23 31 23 5.39
MANDARIN B HL 380 0 0 0 3 12 57 28 6.09
MANDARIN B SL 896 0 0 2 8 20 39 32 5.91
MOD. GREEK A2 HL 29 0 0 0 0 55 38 7 5.52
MOD. GREEK A2 SL 36 0 0 0 19 31 33 17 5.47
NORWEGIAN B HL 68 0 0 3 13 16 26 41 5.90
NORWEGIAN B SL 26 0 0 8 15 23 23 31 5.54
PILIPINO A2 HL 18 0 0 0 0 22 56 22 6.00
PILIPINO A2 SL 7 0 0 0 0 57 0 43 5.86
PORTUGUESE A2 HL 93 0 0 0 6 42 48 3 5.48

32
PORTUGUESE A2 SL 36 0 0 0 0 44 50 6 5.61
PORTUGUESE B HL 35 0 0 0 3 14 63 20 6.00
PORTUGUESE B SL 31 0 0 0 3 35 35 26 5.84
RUSSIAN AB INITIO SL 45 0 0 4 24 31 27 13 5.20
RUSSIAN B HL 78 0 1 1 1 5 29 62 6.45
RUSSIAN B SL 60 0 0 3 12 18 28 38 5.87
SPANISH A2 HL 437 0 0 11 15 29 38 8 5.17
SPANISH A2 SL 202 0 0 2 17 26 44 11 5.44
SPANISH AB INITIO SL 2,716 0 2 11 24 32 22 10 4.89
SPANISH B HL 3,763 0 1 5 15 23 37 19 5.46
SPANISH B SL 12,550 0 4 15 26 27 21 7 4.69
SWAHILI AB INITIO SL 25 0 4 0 8 36 52 0 5.32
SWEDISH A2 HL 32 0 0 0 16 25 44 16 5.59
SWEDISH A2 SL 47 0 0 0 4 23 51 21 5.89
SWEDISH B HL 74 0 0 3 14 24 35 24 5.65
SWEDISH B SL 95 2 4 1 13 37 37 6 5.14
THAI A2 HL 20 0 0 0 0 5 35 60 6.55
THAI A2 SL 33 0 0 0 0 12 45 42 6.30
URDU B HL 6 0 0 0 0 17 67 17 6.00
URDU B SL 4 0 0 0 0 25 75 0 5.75
GROUP 2 TOTAL 58,456 0 2 9 18 29 30 12 5.12
ITGS = INFORMATION TECHNOLOGY IN A GLOBAL SOCIETY
Subject Level
Number of candidates
Percentage of candidates awarded grades Mean grade GROUP 3 1 2 3 4 5 6 7
BUSINESS & MANAGEMENT
HL 3,752 1 5 15 26 31 18 5 4.53
BUSINESS & MANAGEMENT
SL 3,042 1 6 17 23 27 20 6 4.55
ECOSYSTEMS AND
SOCIETY* SL 230 1 3 24 23 27 15 7 4.47
ECONOMICS HL 7,023 0 1 10 18 32 26 12 5.09
ECONOMICS SL 5,173 0 2 9 16 30 28 15 5.18
GEOGRAPHY HL 2,666 0 1 7 21 31 27 13 5.13
GEOGRAPHY SL 2,143 0 10 16 25 26 17 6 4.40
HISTORY HL 27,485 0 2 12 34 33 14 5 4.60
HISTORY SL 4,765 0 2 9 29 40 16 4 4.68
ISLAMIC HISTORY HL 51 0 0 4 20 41 33 2 5.10
ISLAMIC HISTORY SL 97 0 2 13 28 33 20 4 4.67
ITGS HL 1,185 1 6 25 35 24 8 1 4.02
ITGS SL 1,896 1 4 24 36 23 12 2 4.18
PHILOSOPHY HL 1,108 0 0 8 20 34 28 8 5.06
PHILOSOPHY SL 1,421 0 2 14 25 29 23 7 4.77
PSYCHOLOGY HL 3,703 0 3 12 27 35 19 4 4.66
PSYCHOLOGY SL 6,529 1 7 17 30 24 15 5 4.35
SOCIAL AND CULTURAL ANTHROPOLOGY
HL 324 0 4 17 23 33 19 4 4.58
SOCIAL AND CULTURAL ANTHROPOLOGY
SL 971 0 2 10 33 40 14 1 4.59
WORLD CULTURES*** SL 93 0 0 2 5 16 48 28 5.95
GROUP 3 TOTAL 73,657 0 3 13 28 32 18 6 4.67
33
Subject Level
Number of candidates
Percentage of candidates awarded grades Mean grade
GROUP 4 1 2 3 4 5 6 7
BIOLOGY HL 17,900 0 10 23 26 23 15 4 4.18
BIOLOGY SL 12,199 0 7 23 29 23 13 4 4.21
CHEMISTRY HL 9,169 0 10 19 23 22 17 8 4.40
CHEMISTRY SL 9,537 1 14 24 23 21 11 5 4.01
DESIGN TECHNOLOGY HL 526 0 2 9 21 33 29 6 4.97
DESIGN TECHNOLOGY SL 507 0 8 23 32 24 12 1 4.11
ENVIRONMENTAL SYSTEMS
SL 4,029 1 11 25 29 22 10 2 4.01
PHYSICS HL 6,023 0 6 16 24 26 18 11 4.63
PHYSICS SL 8,767 2 12 25 23 21 11 6 4.09
GROUP 4 TOTAL 68,657 1 10 22 25 23 14 5 4.21
Subject Level
Number of candidates
Percentage of candidates awarded grades Mean grade
GROUP 5 1 2 3 4 5 6 7
COMPUTER SCIENCE HL 429 1 5 12 21 21 23 17 4.92
COMPUTER SCIENCE SL 654 1 11 16 19 22 22 9 4.51
FURTHER MATHEMATICS
SL 115 3 19 15 24 15 11 12 4.10
MATHEMATICAL STUDIES
SL 18,878 0 5 14 26 29 19 6 4.61
MATHEMATICS HL 9,262 1 9 18 25 23 16 8 4.40
MATHEMATICS SL 24,791 1 8 20 24 23 17 9 4.45
GROUP 5 TOTAL 54,129 1 7 17 25 25 17 8 4.50
Subject Level
Number of candidates
Percentage of candidates awarded grades Mean grade
GROUP 6 1 2 3 4 5 6 7
FILM HL 461 0 5 15 28 26 18 9 4.64
FILM SL 131 0 4 10 27 36 18 6 4.72
MUSIC HL 890 0 2 13 26 35 20 4 4.69
MUSIC SL 1,690 1 2 10 26 43 16 2 4.65
TEXT & PERFORMANCE**
SL 56 0 0 2 16 30 43 9 5.41
THEATRE HL 1,833 0 3 19 33 26 15 4 4.39
THEATRE SL 842 0 2 15 32 32 14 5 4.53
VISUAL ARTS HL 5,577 0 3 12 24 25 26 9 4.86
VISUAL ARTS SL 3,763 1 7 17 28 23 19 6 4.43
GROUP 6 TOTAL 15,243 0 4 14 27 28 21 6 4.64

34
Subject Level
Number of candidates
Percentage of candidates awarded grades Mean grade
PILOT SUBJECTS 1 2 3 4 5 6 7
DANCE HL 118 0 0 3 10 25 45 17 5.62
DANCE SL 44 0 0 11 16 23 34 16 5.27
SPORT & EXERCISE SCIENCE
SL 68 0 6 12 35 28 13 6 4.49
WORLD RELIGIONS SL 93 0 0 13 28 40 17 2 4.68
PS TOTAL 323 0 1 9 21 30 29 10 5.06
Subject
Level Number of candidates
Percentage of candidates awarded grades
Mean grade SCHOOL-BASED SYLLABUSES
1 2 3 4 5 6 7
ART HISTORY SL 148 0 1 20 29 29 18 3 4.49
BEGINNERS’ HINDI SL 14 0 0 0 7 21 21 50 6.14
BEGINNERS’ NYNORSK
SL 12 0 0 0 0 25 42 33 6.08
CHILE & PACIFIC BASIN
SL 16 0 0 0 0 75 19 6 5.31
CHINESE STUDIES SL 21 0 0 0 0 29 52 19 5.90
CLASSICAL GREEK & ROMAN STUDIES
SL 25 0 0 0 0 12 48 40 6.28
HISTORICAL & CONTEMPORARY BRAZILIAN STUDIES
SL 74 0 3 8 31 31 22 5 4.77
HUMAN RIGHTS SL 52 0 2 8 21 38 31 0 4.88
PEACE & CONFLICT STUDIES
SL 103 0 0 2 7 38 30 23 5.66
POLITICAL THOUGHT SL 33 0 0 3 6 27 24 39 5.91
SCIENCE TECHNOLOGY & SOCIETY
SL 32 0 0 0 0 28 53 19 5.91
SOCIAL STUDIES SL 9 0 11 11 22 22 22 11 4.67
TURKISH SOCIAL STUDIES
SL 119 1 8 17 15 30 20 9 4.64
WORLD POLITICS SL 44 0 2 2 14 25 34 23 5.55
SBS TOTAL 702 0 2 10 16 31 27 14 5.13
ALL SUBJECTS TOTAL 324,979 0 5 13 25 30 20 7 4.66
* Trans-disciplinary subject groups 3 and 4 ** Trans-disciplinary subject groups 1 and 6
*** Trans-disciplinary subject groups 3 and 6
35
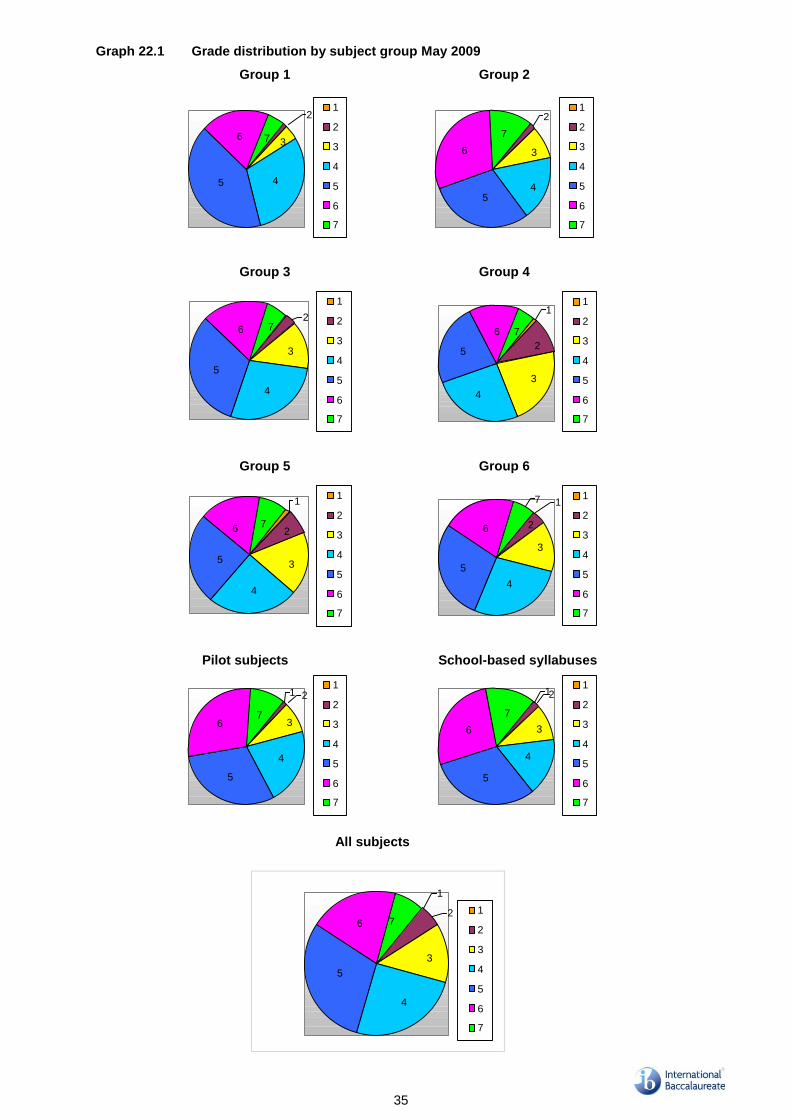
Graph 22.1 Grade distribution by subject group May 2009
Group 1 Group 2
45
6 7 3
21
2
3
4
5
6
7
5
3
4
2
7
6
1
2
3
4
5
6
7
Group 3 Group 4
3
5
6 72
4
1
2
3
4
5
6
7
1
4
3
2
76
5
1
2
3
4
5
6
7
Group 5 Group 6
4
3
2
1
7
5
6
1
2
3
4
5
6
7
4
3
2
17
6
5
1
2
3
4
5
6
7
Pilot subjects School-based syllabuses
5
4
3
1 2
76
1
2
3
4
5
6
7
5
4
3
12
7
6
1
2
3
4
5
6
7
All subjects
1
2
3
76
5
4
1
2
3
4
5
6
7

36
23 Diploma and retake candidates (D+R): distribution of points totals May 2009
Total Points
Diploma awarded Diploma not awarded Total number of candidates awarded each points score
Cumulative Number of candidates
Percentage of candidates
Number of candidates
Percentage of candidates
0 0.00%
1 1 0.00% 1 0.00%
2 5 0.01% 5 0.01%
3 13 0.03% 13 0.04%
4 21 0.05% 21 0.09%
5 26 0.06% 26 0.15%
6 23 0.05% 23 0.20%
7 16 0.04% 16 0.23%
8 28 0.06% 28 0.30%
9 31 0.07% 31 0.37%
10 36 0.08% 36 0.45%
11 53 0.12% 53 0.57%
12 63 0.14% 63 0.71%
13 80 0.18% 80 0.89%
14 106 0.24% 106 1.12%
15 171 0.38% 171 1.51%
16 240 0.54% 240 2.04%
17 304 0.68% 304 2.72%
18 462 1.03% 462 3.76%
19 618 1.38% 618 5.14%
20 819 1.83% 819 6.97%
21 1080 2.42% 1080 9.39%
22 1342 3.00% 1343 12.39%
23 1637 3.66% 1637 16.05%
24 1239 2.77% 861 1.93% 2102 20.76%
25 1616 3.62% 648 1.45% 2264 25.82%
26 1984 4.44% 453 1.01% 2435 31.27%
27 2383 5.33% 286 0.64% 2668 37.24%
28 2798 6.26% 35 0.08% 2834 43.58%
29 2801 6.27% 13 0.03% 2813 49.87%
30 2798 6.26% 20 0.04% 2818 56.18%
31 2650 5.93% 8 0.02% 2658 62.12%
32 2617 5.85% 7 0.02% 2624 67.99%
33 2419 5.41% 4 0.01% 2423 73.41%
34 2182 4.88% 2 0.00% 2184 78.30%
35 1886 4.22% 4 0.01% 1890 82.53%
36 1707 3.82% 1707 86.35%
37 1447 3.24% 1448 89.59%
38 1201 2.69% 1 0.00% 1201 92.27%
39 1001 2.24% 1002 94.51%
40 804 1.80% 1 0.00% 805 96.32%
41 600 1.34% 600 97.66%
42 463 1.04% 464 98.70%
43 330 0.74% 328 99.43%
44 169 0.38% 169 99.81%
45 86 0.19% 86 100%
35181 78.71% 9518 21.29% 44699 100%
37
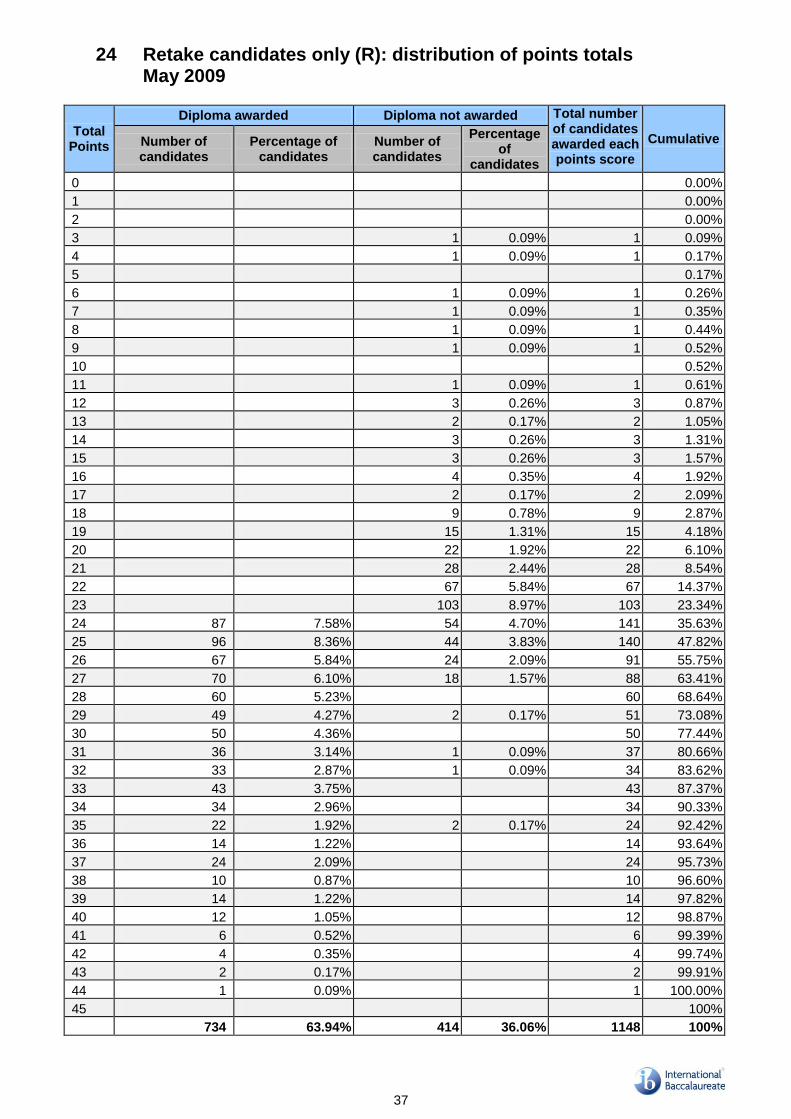
24 Retake candidates only (R): distribution of points totals May 2009
Total Points
Diploma awarded Diploma not awarded Total number of candidates awarded each points score
Cumulative Number of candidates
Percentage of candidates
Number of candidates
Percentage of
candidates
0 0.00%
1 0.00%
2 0.00%
3 1 0.09% 1 0.09%
4 1 0.09% 1 0.17%
5 0.17%
6 1 0.09% 1 0.26%
7 1 0.09% 1 0.35%
8 1 0.09% 1 0.44%
9 1 0.09% 1 0.52%
10 0.52%
11 1 0.09% 1 0.61%
12 3 0.26% 3 0.87%
13 2 0.17% 2 1.05%
14 3 0.26% 3 1.31%
15 3 0.26% 3 1.57%
16 4 0.35% 4 1.92%
17 2 0.17% 2 2.09%
18 9 0.78% 9 2.87%
19 15 1.31% 15 4.18%
20 22 1.92% 22 6.10%
21 28 2.44% 28 8.54%
22 67 5.84% 67 14.37%
23 103 8.97% 103 23.34%
24 87 7.58% 54 4.70% 141 35.63%
25 96 8.36% 44 3.83% 140 47.82%
26 67 5.84% 24 2.09% 91 55.75%
27 70 6.10% 18 1.57% 88 63.41%
28 60 5.23% 60 68.64%
29 49 4.27% 2 0.17% 51 73.08%
30 50 4.36% 50 77.44%
31 36 3.14% 1 0.09% 37 80.66%
32 33 2.87% 1 0.09% 34 83.62%
33 43 3.75% 43 87.37%
34 34 2.96% 34 90.33%
35 22 1.92% 2 0.17% 24 92.42%
36 14 1.22% 14 93.64%
37 24 2.09% 24 95.73%
38 10 0.87% 10 96.60%
39 14 1.22% 14 97.82%
40 12 1.05% 12 98.87%
41 6 0.52% 6 99.39%
42 4 0.35% 4 99.74%
43 2 0.17% 2 99.91%
44 1 0.09% 1 100.00%
45 100%
734 63.94% 414 36.06% 1148 100%
38
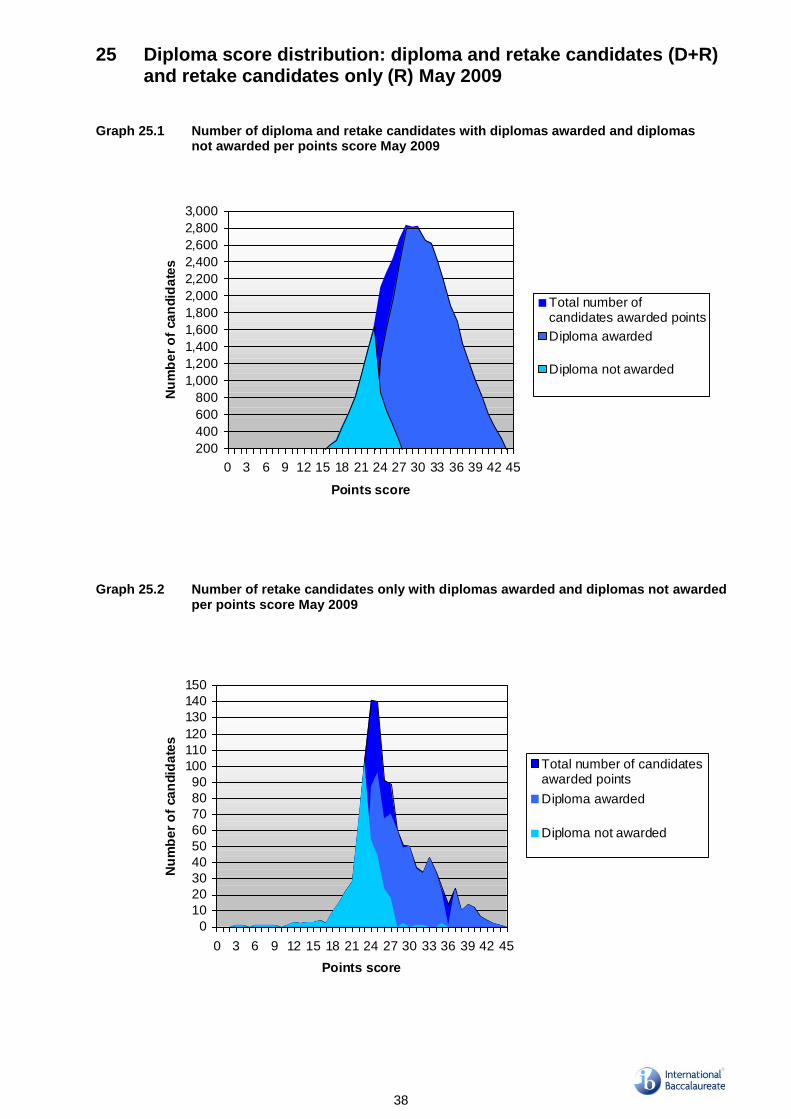
25 Diploma score distribution: diploma and retake candidates (D+R) and retake candidates only (R) May 2009
Graph 25.1 Number of diploma and retake candidates with diplomas awarded and diplomas not awarded per points score May 2009
200
400
600
800
1,000
1,200
1,400
1,600
1,800
2,000
2,200
2,400
2,600
2,800
3,000
0 3 6 9 12 15 18 21 24 27 30 33 36 39 42 45
Points score
Nu
mb
er
of
ca
nd
ida
tes
Total number ofcandidates awarded points
Diploma awarded
Diploma not awarded
Graph 25.2 Number of retake candidates only with diplomas awarded and diplomas not awarded
per points score May 2009
0
10
20
30
40
50
60
70
80
90
100
110
120
130
140
150
0 3 6 9 12 15 18 21 24 27 30 33 36 39 42 45
Points score
Nu
mb
er
of
ca
nd
ida
tes
Total number of candidatesawarded points
Diploma awarded
Diploma not awarded
39
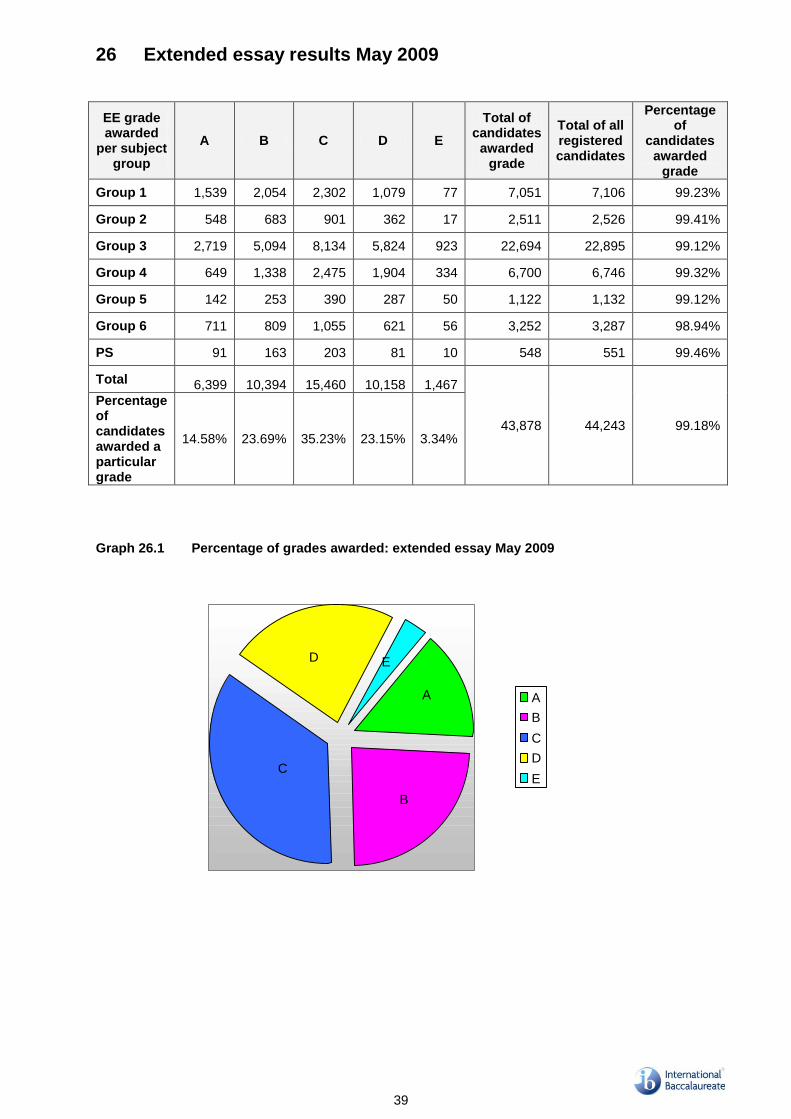
26 Extended essay results May 2009
EE grade awarded
per subject group
A B C D E
Total of candidates
awarded grade
Total of all registered candidates
Percentage of
candidates awarded
grade
Group 1 1,539 2,054 2,302 1,079 77 7,051 7,106 99.23%
Group 2 548 683 901 362 17 2,511 2,526 99.41%
Group 3 2,719 5,094 8,134 5,824 923 22,694 22,895 99.12%
Group 4 649 1,338 2,475 1,904 334 6,700 6,746 99.32%
Group 5 142 253 390 287 50 1,122 1,132 99.12%
Group 6 711 809 1,055 621 56 3,252 3,287 98.94%
PS 91 163 203 81 10 548 551 99.46%
Total 6,399 10,394 15,460 10,158 1,467
43,878 44,243 99.18%
Percentage of candidates awarded a particular grade
14.58% 23.69% 35.23% 23.15% 3.34%
Graph 26.1 Percentage of grades awarded: extended essay May 2009
A
B
C
D E
A
B
C
D
E

40
Graph 26.2 Percentage of grades awarded: extended essay May 2008
A
B
C
DE
A
B
C
D
E
27 Theory of knowledge results May 2009
TOK grade awarded
A B C D E
Total of candidates
awarded grade
Total of all registered candidates
Percentage of
candidates awarded
grade
Number of candidates awarded grade
2,405 12,753 19,860 7,931 513
43,462 44,202 98.33% Percentage of candidates awarded grade
5.53% 29.34% 45.70% 18.25% 1.18%
Graph 27.1 Percentage of grades awarded: theory of knowledge May 2009
ED
C B
A
A
B
C
D
E
41
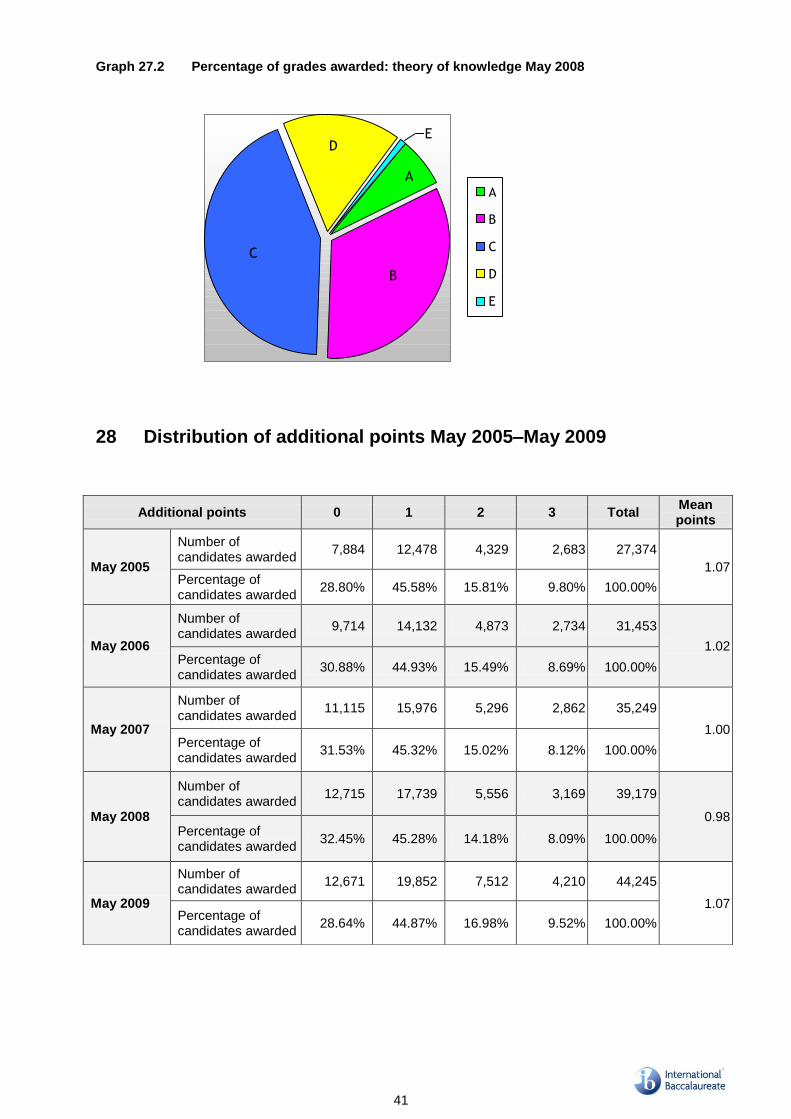
Graph 27.2 Percentage of grades awarded: theory of knowledge May 2008
ED
C
B
AA
B
C
D
E
28 Distribution of additional points May 2005–May 2009
Additional points 0 1 2 3 Total Mean points
May 2005
Number of candidates awarded
7,884 12,478 4,329 2,683 27,374
1.07 Percentage of candidates awarded
28.80% 45.58% 15.81% 9.80% 100.00%
May 2006
Number of candidates awarded
9,714 14,132 4,873 2,734 31,453
1.02 Percentage of candidates awarded
30.88% 44.93% 15.49% 8.69% 100.00%
May 2007
Number of candidates awarded
11,115 15,976 5,296 2,862 35,249
1.00 Percentage of candidates awarded
31.53% 45.32% 15.02% 8.12% 100.00%
May 2008
Number of candidates awarded
12,715 17,739 5,556 3,169 39,179
0.98 Percentage of candidates awarded
32.45% 45.28% 14.18% 8.09% 100.00%
May 2009
Number of candidates awarded
12,671 19,852 7,512 4,210 44,245
1.07 Percentage of candidates awarded
28.64% 44.87% 16.98% 9.52% 100.00%

42
Graph 28.1 Distribution of additional points May 2009
1
2
3
00
1
2
3
Graph 28.2 Distribution of additional points May 2008
1
2
3
0 0
1
2
3
29 Mean points score worldwide May 2005–May 2009 Mean score
per examination
session
May 2005 May 2006 May 2007 May 2008 May 2009
30.09 29.89 29.56 29.57 29.51
30 Mean grade worldwide May 2005–May 2009 Mean grade
per examination
session
May 2005 May 2006 May 2007 May 2008 May 2009
4.78 4.74 4.68 4.69 4.66
43
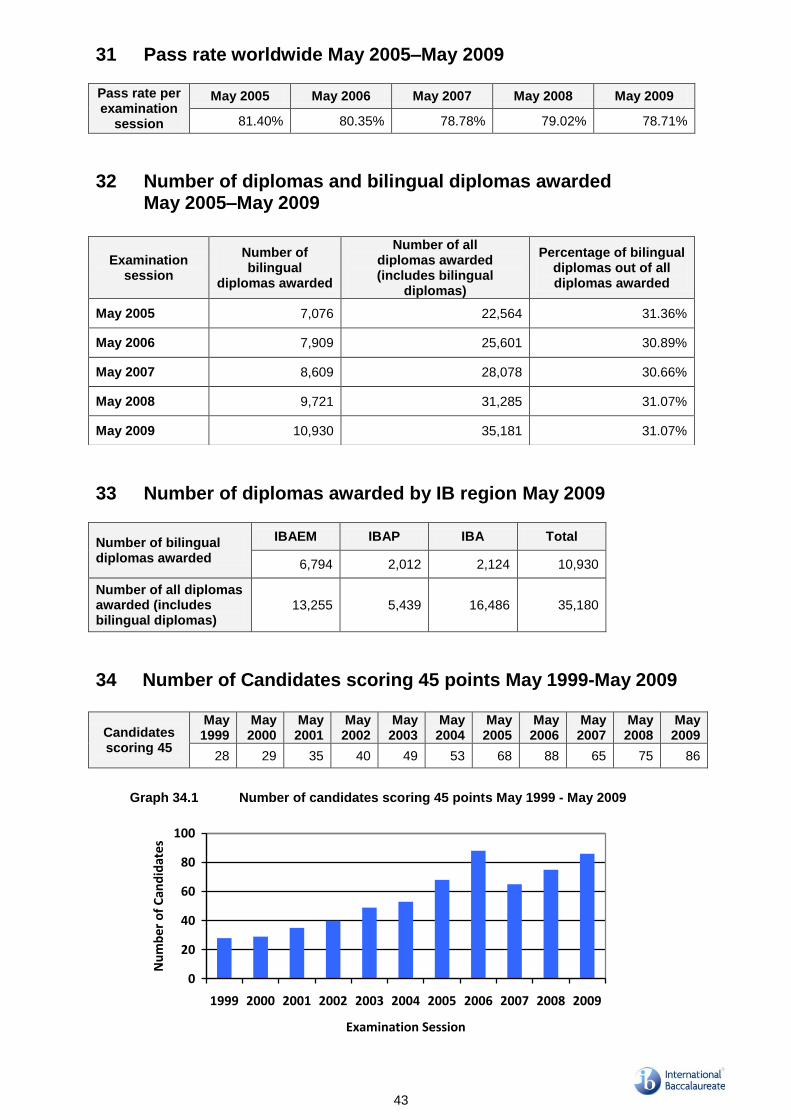
31 Pass rate worldwide May 2005–May 2009 Pass rate per examination
session
May 2005 May 2006 May 2007 May 2008 May 2009
81.40% 80.35% 78.78% 79.02% 78.71%
32 Number of diplomas and bilingual diplomas awarded May 2005–May 2009
33 Number of diplomas awarded by IB region May 2009
Number of bilingual diplomas awarded
IBAEM IBAP IBA Total
6,794 2,012 2,124 10,930
Number of all diplomas awarded (includes bilingual diplomas)
13,255 5,439 16,486 35,180
34 Number of Candidates scoring 45 points May 1999-May 2009
Candidates scoring 45
May 1999
May 2000
May 2001
May 2002
May 2003
May 2004
May 2005
May 2006
May 2007
May 2008
May 2009
28 29 35 40 49 53 68 88 65 75 86
Graph 34.1 Number of candidates scoring 45 points May 1999 - May 2009
0
20
40
60
80
100
1999 2000 2001 2002 2003 2004 2005 2006 2007 2008 2009
Examination Session
Nu
mb
er o
f C
and
idat
es
Examination session
Number of bilingual
diplomas awarded
Number of all diplomas awarded (includes bilingual
diplomas)
Percentage of bilingual diplomas out of all diplomas awarded
May 2005 7,076 22,564 31.36%
May 2006 7,909 25,601 30.89%
May 2007 8,609 28,078 30.66%
May 2008 9,721 31,285 31.07%
May 2009 10,930 35,181 31.07%

44