i2i overview & capabilities
TRANSCRIPT
07/02/2018 1
i2i Overview & Capabilities
4th ICEPIM & OMIC GAS 2018
About i2i
Our Vision “ To simplify pipeline inspection so it becomes a low risk, low cost and regular non-disruptive
activity, leading to enhanced integrity management that benefits from big data analytics and digital technologies”
Our Objectives To develop & deploy simple operational tools with smart sensors With simplicity comes Increased frequency of deployment - allows monitoring of defects Collect ‘big data’ (flow assurance & integrity) - develop predictive maintenance strategies To provide a flexible business model Service and technology provider Ship equipment to Operators without personnel Provide the technology to local service companies – allowed us to go global quickly
07/02/2018 2
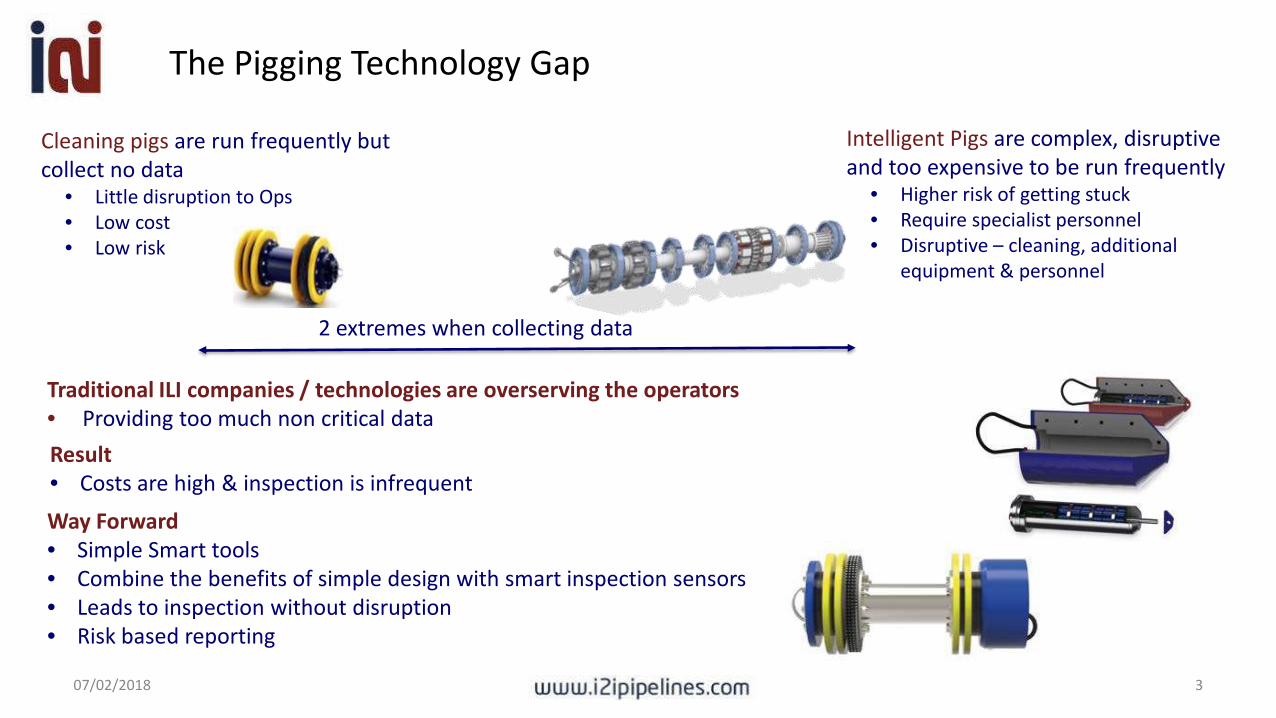
Way Forward• Simple Smart tools• Combine the benefits of simple design with smart inspection sensors• Leads to inspection without disruption • Risk based reporting
The Pigging Technology Gap
07/02/2018 3
Intelligent Pigs are complex, disruptive and too expensive to be run frequently
• Higher risk of getting stuck• Require specialist personnel• Disruptive – cleaning, additional
equipment & personnel
Cleaning pigs are run frequently but collect no data
• Little disruption to Ops• Low cost • Low risk
Result • Costs are high & inspection is infrequent
2 extremes when collecting data
Traditional ILI companies / technologies are overserving the operators• Providing too much non critical data
The main difference with conventional ILI
07/02/2018 4
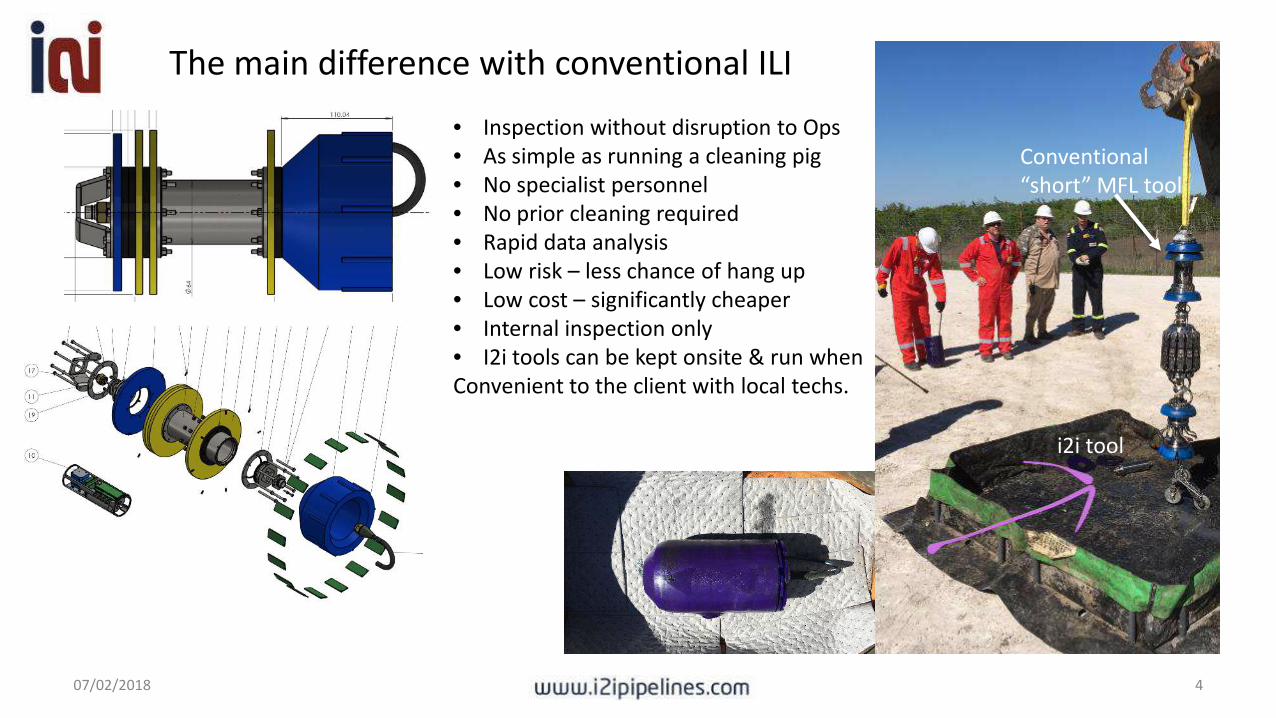
• Inspection without disruption to Ops• As simple as running a cleaning pig• No specialist personnel• No prior cleaning required• Rapid data analysis• Low risk – less chance of hang up• Low cost – significantly cheaper• Internal inspection only• I2i tools can be kept onsite & run when Convenient to the client with local techs.
i2i tool
Conventional “short” MFL tool
I2i – main product range
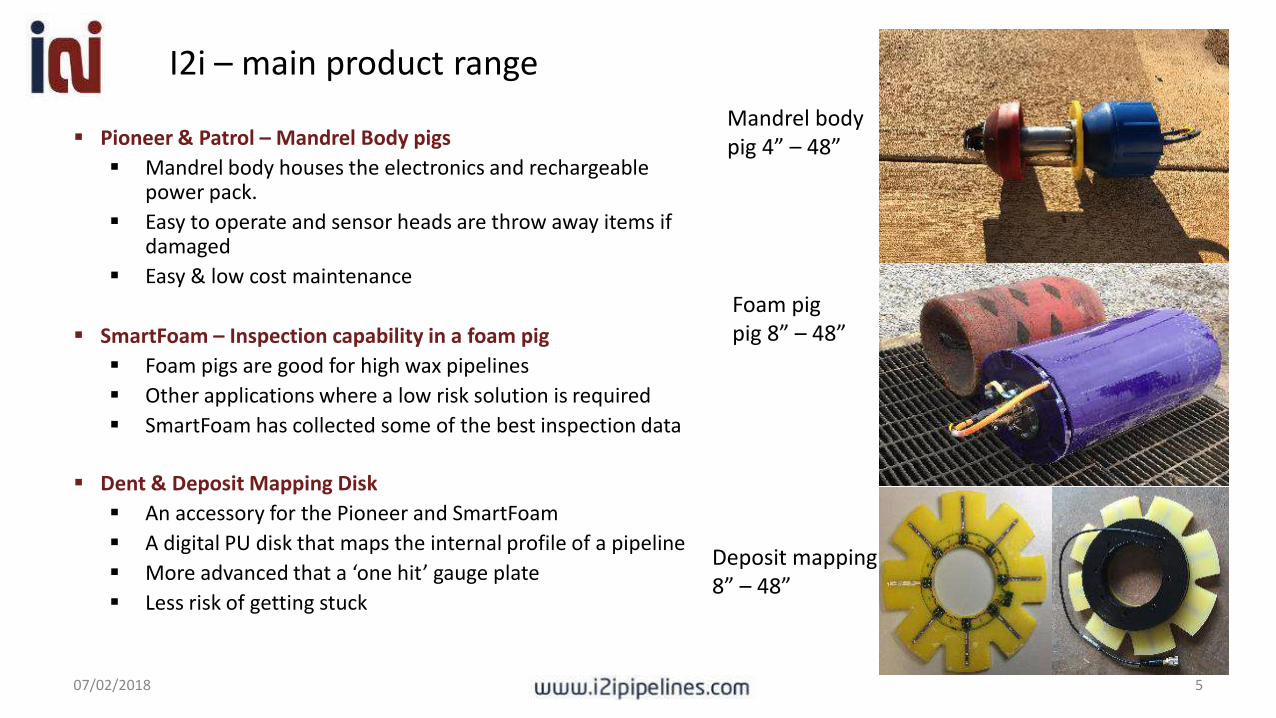
Pioneer & Patrol – Mandrel Body pigs Mandrel body houses the electronics and rechargeable
power pack. Easy to operate and sensor heads are throw away items if
damaged Easy & low cost maintenance
SmartFoam – Inspection capability in a foam pig Foam pigs are good for high wax pipelines Other applications where a low risk solution is required SmartFoam has collected some of the best inspection data
Dent & Deposit Mapping Disk An accessory for the Pioneer and SmartFoam A digital PU disk that maps the internal profile of a pipeline More advanced that a ‘one hit’ gauge plate Less risk of getting stuck
07/02/2018 5
Mandrel body pig 4” – 48”
Foam pigpig 8” – 48”
Deposit mapping8” – 48”
The Inspection Technology
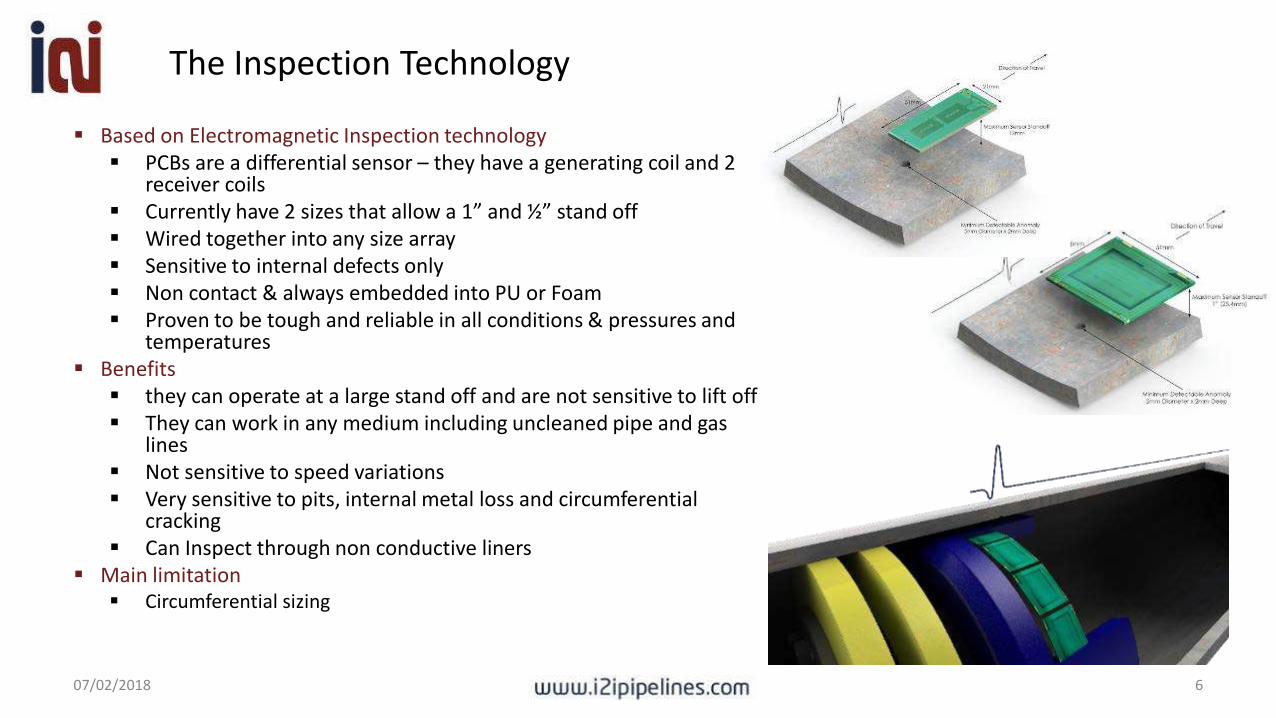
Based on Electromagnetic Inspection technology PCBs are a differential sensor – they have a generating coil and 2
receiver coils Currently have 2 sizes that allow a 1” and ½” stand off Wired together into any size array Sensitive to internal defects only Non contact & always embedded into PU or Foam Proven to be tough and reliable in all conditions & pressures and
temperatures Benefits they can operate at a large stand off and are not sensitive to lift off They can work in any medium including uncleaned pipe and gas
lines Not sensitive to speed variations Very sensitive to pits, internal metal loss and circumferential
cracking Can Inspect through non conductive liners
Main limitation Circumferential sizing
07/02/2018 6
Case Study - West Africa Operations
07/02/2018 7
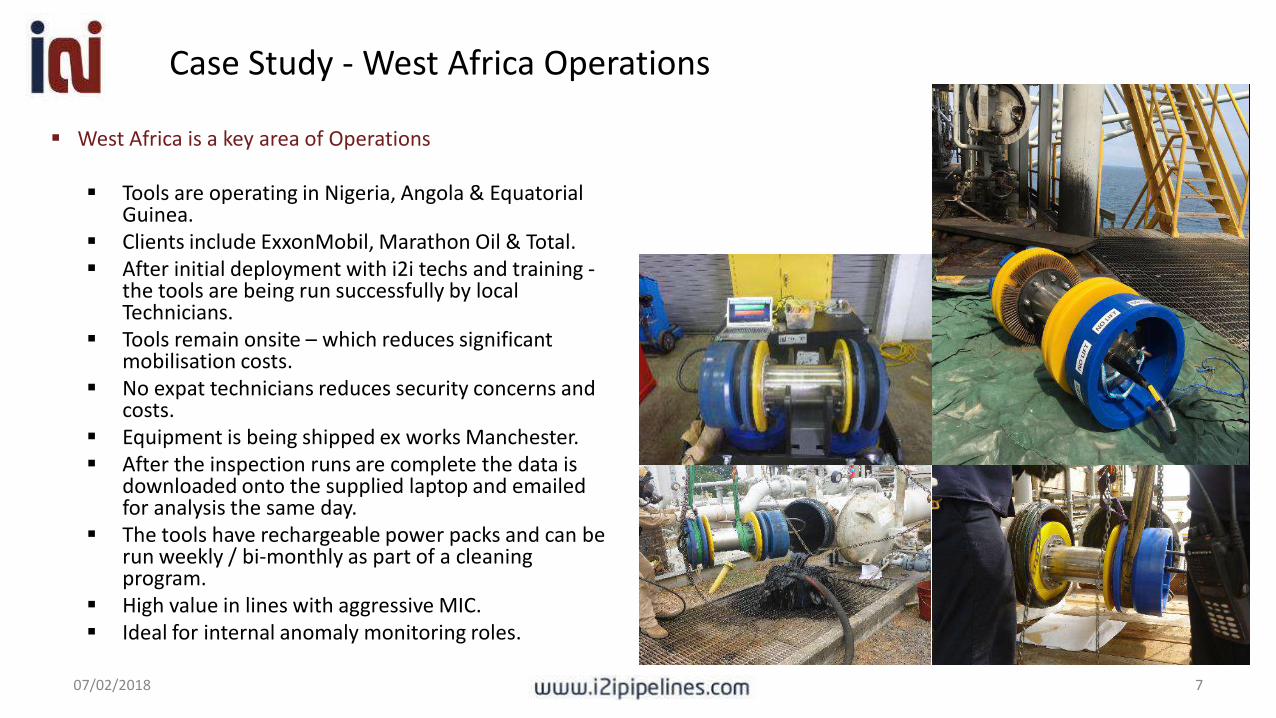
West Africa is a key area of Operations
Tools are operating in Nigeria, Angola & Equatorial Guinea.
Clients include ExxonMobil, Marathon Oil & Total. After initial deployment with i2i techs and training -
the tools are being run successfully by local Technicians.
Tools remain onsite – which reduces significant mobilisation costs.
No expat technicians reduces security concerns and costs.
Equipment is being shipped ex works Manchester. After the inspection runs are complete the data is
downloaded onto the supplied laptop and emailed for analysis the same day.
The tools have rechargeable power packs and can be run weekly / bi-monthly as part of a cleaning program.
High value in lines with aggressive MIC. Ideal for internal anomaly monitoring roles.
Case Study – Flexible Riser Inspection
07/02/2018 8
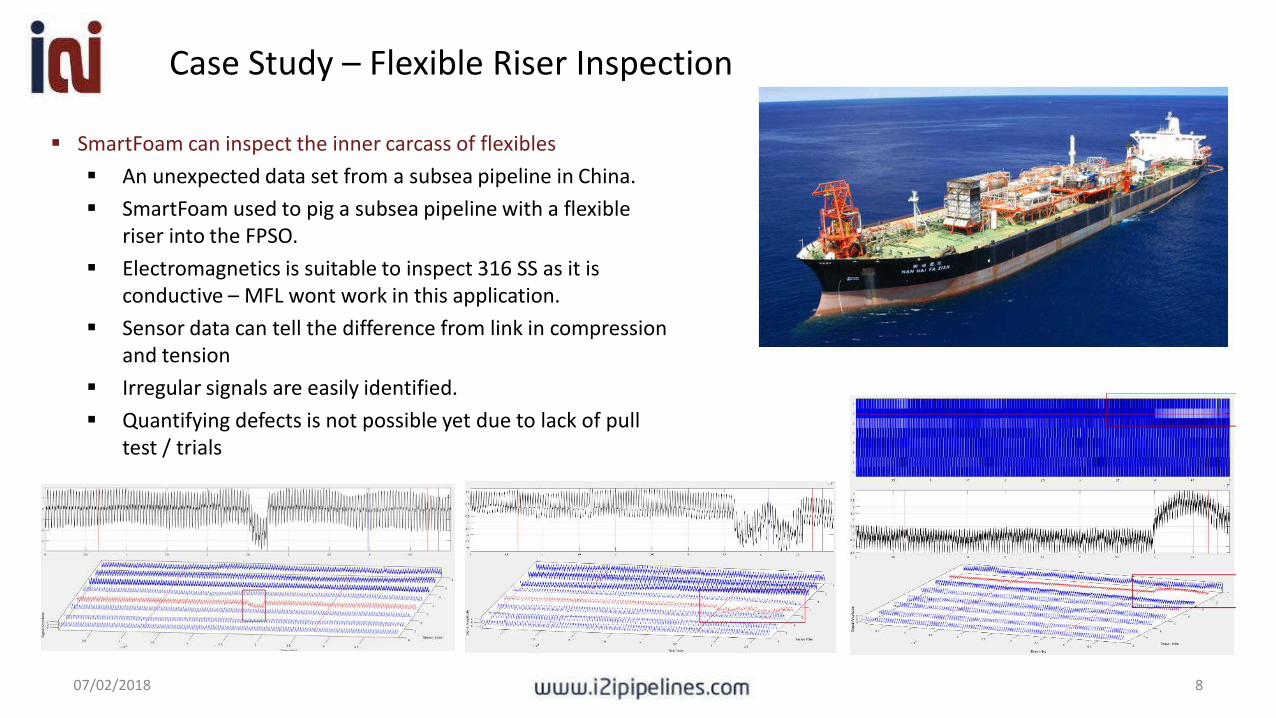
SmartFoam can inspect the inner carcass of flexibles An unexpected data set from a subsea pipeline in China. SmartFoam used to pig a subsea pipeline with a flexible
riser into the FPSO. Electromagnetics is suitable to inspect 316 SS as it is
conductive – MFL wont work in this application. Sensor data can tell the difference from link in compression
and tension Irregular signals are easily identified. Quantifying defects is not possible yet due to lack of pull
test / trials
Case Study - Mapping deposits
07/02/2018 9
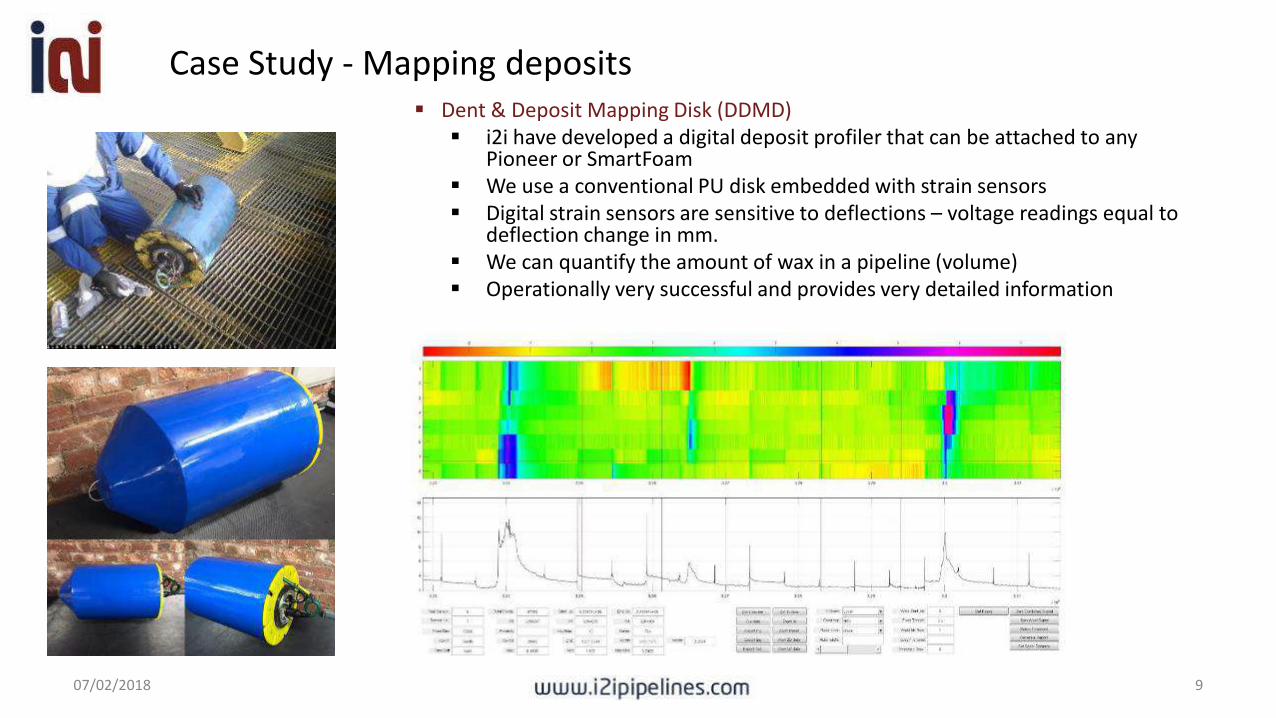
Dent & Deposit Mapping Disk (DDMD) i2i have developed a digital deposit profiler that can be attached to any
Pioneer or SmartFoam We use a conventional PU disk embedded with strain sensors Digital strain sensors are sensitive to deflections – voltage readings equal to
deflection change in mm. We can quantify the amount of wax in a pipeline (volume) Operationally very successful and provides very detailed information
Case Study - Mapping dents
07/02/2018 10
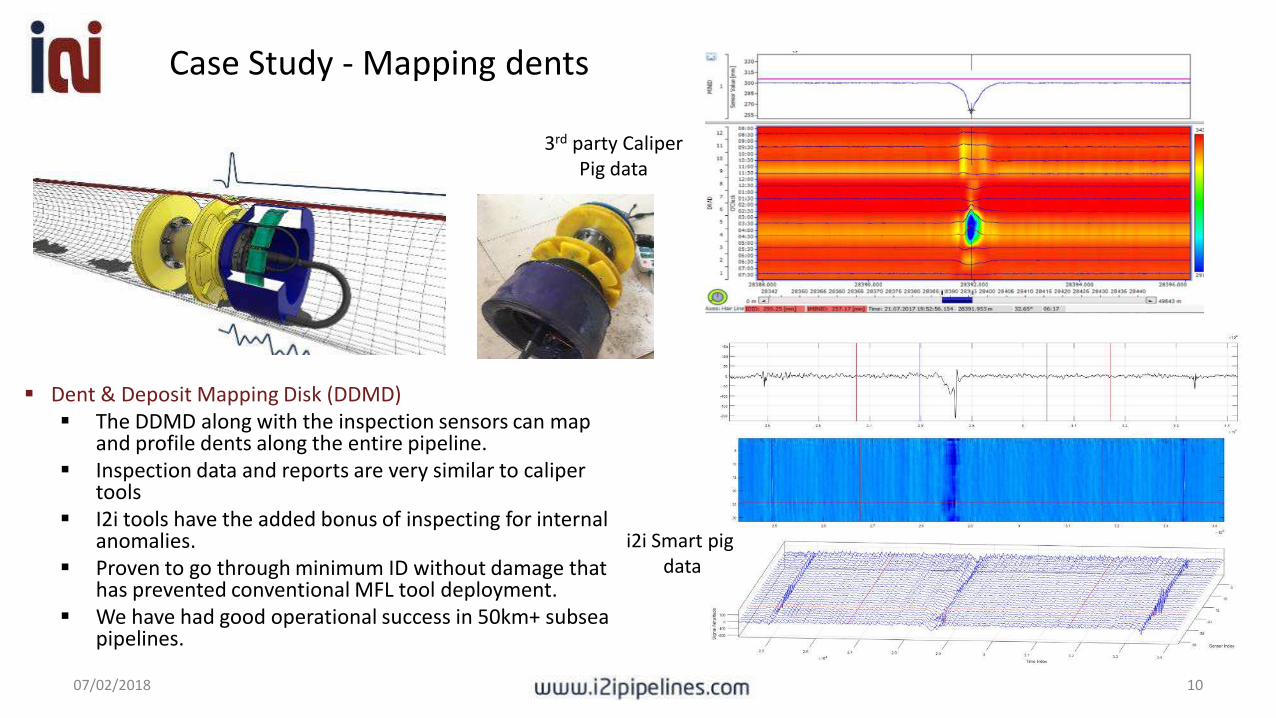
Dent & Deposit Mapping Disk (DDMD) The DDMD along with the inspection sensors can map
and profile dents along the entire pipeline. Inspection data and reports are very similar to caliper
tools I2i tools have the added bonus of inspecting for internal
anomalies. Proven to go through minimum ID without damage that
has prevented conventional MFL tool deployment. We have had good operational success in 50km+ subsea
pipelines.
3rd party CaliperPig data
i2i Smart pig data
Case Study - Inspecting gathering lines
07/02/2018 11
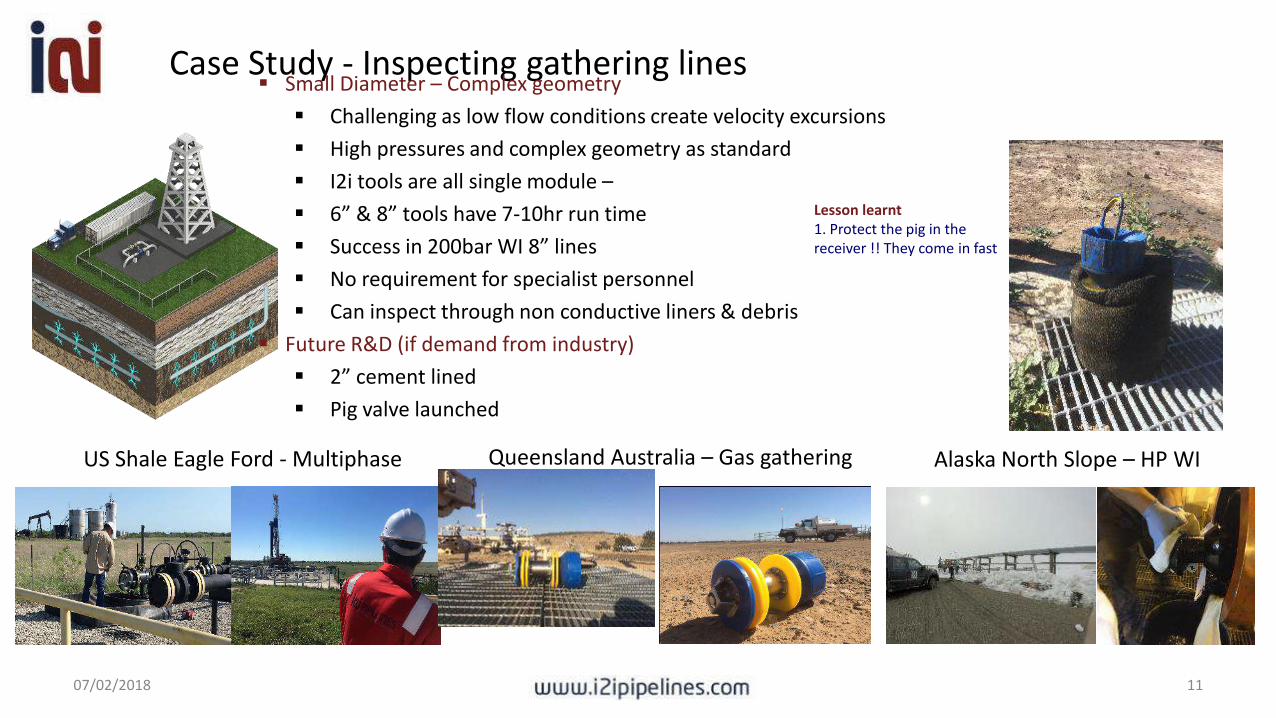
Small Diameter – Complex geometry Challenging as low flow conditions create velocity excursions High pressures and complex geometry as standard I2i tools are all single module – 6” & 8” tools have 7-10hr run time Success in 200bar WI 8” lines No requirement for specialist personnel Can inspect through non conductive liners & debris
Future R&D (if demand from industry) 2” cement lined Pig valve launched
US Shale Eagle Ford - Multiphase Queensland Australia – Gas gathering Alaska North Slope – HP WI
Lesson learnt1. Protect the pig in the receiver !! They come in fast
Case Study – Deployment through pigging valves
07/02/2018 12
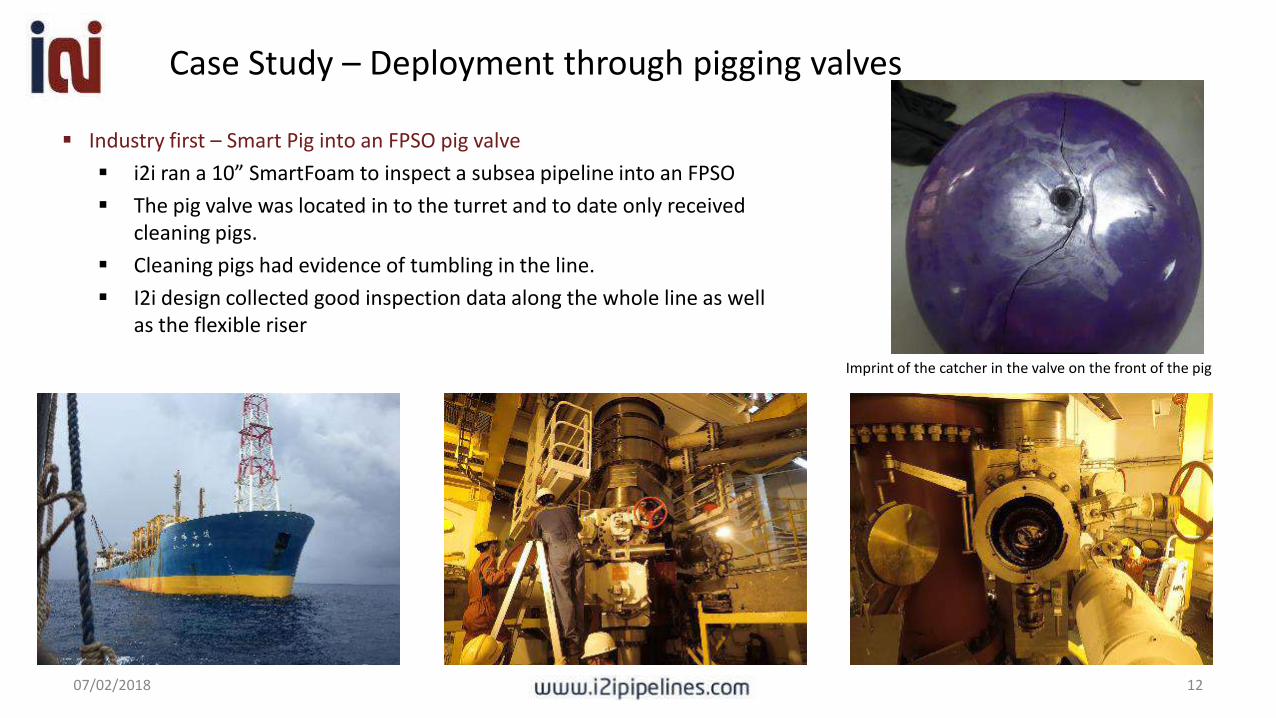
Industry first – Smart Pig into an FPSO pig valve i2i ran a 10” SmartFoam to inspect a subsea pipeline into an FPSO The pig valve was located in to the turret and to date only received
cleaning pigs. Cleaning pigs had evidence of tumbling in the line. I2i design collected good inspection data along the whole line as well
as the flexible riser
Imprint of the catcher in the valve on the front of the pig
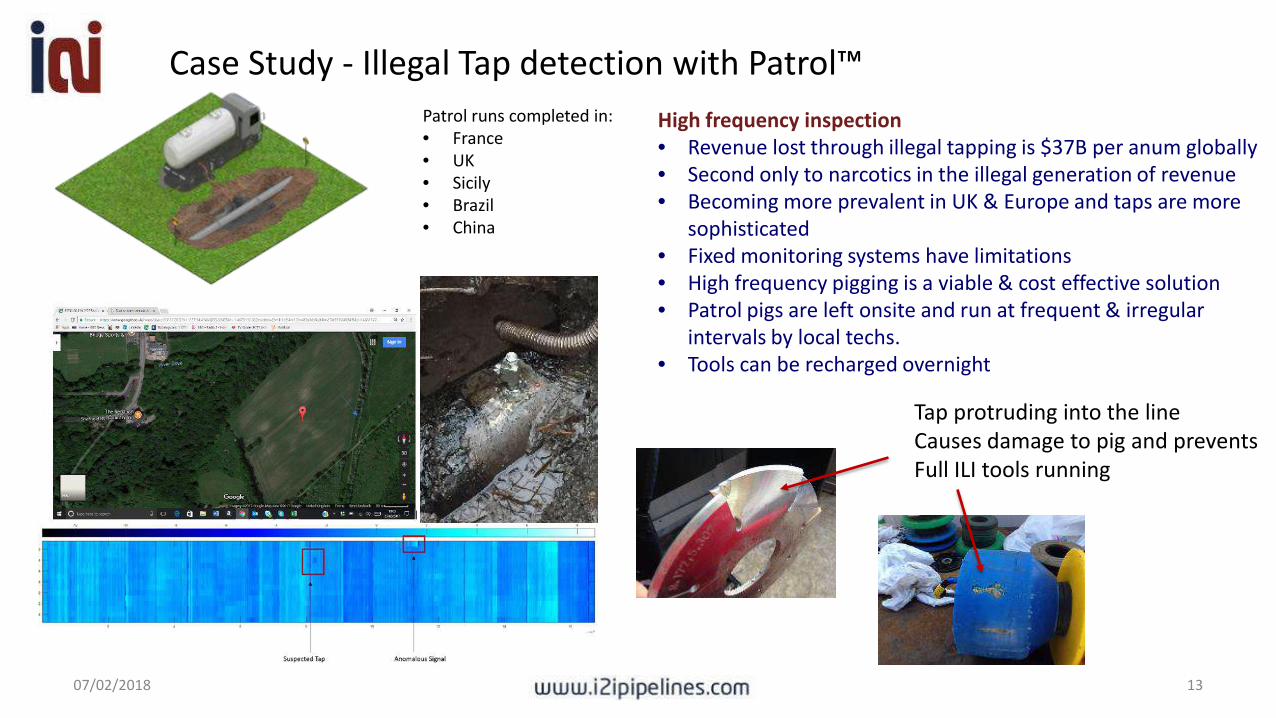
Case Study - Illegal Tap detection with Patrol™
07/02/2018 13
High frequency inspection• Revenue lost through illegal tapping is $37B per anum globally• Second only to narcotics in the illegal generation of revenue• Becoming more prevalent in UK & Europe and taps are more
sophisticated • Fixed monitoring systems have limitations• High frequency pigging is a viable & cost effective solution• Patrol pigs are left onsite and run at frequent & irregular
intervals by local techs.• Tools can be recharged overnight
Tap protruding into the lineCauses damage to pig and prevents Full ILI tools running
Patrol runs completed in:• France• UK• Sicily • Brazil• China
Case study – Special designs
07/02/2018 14
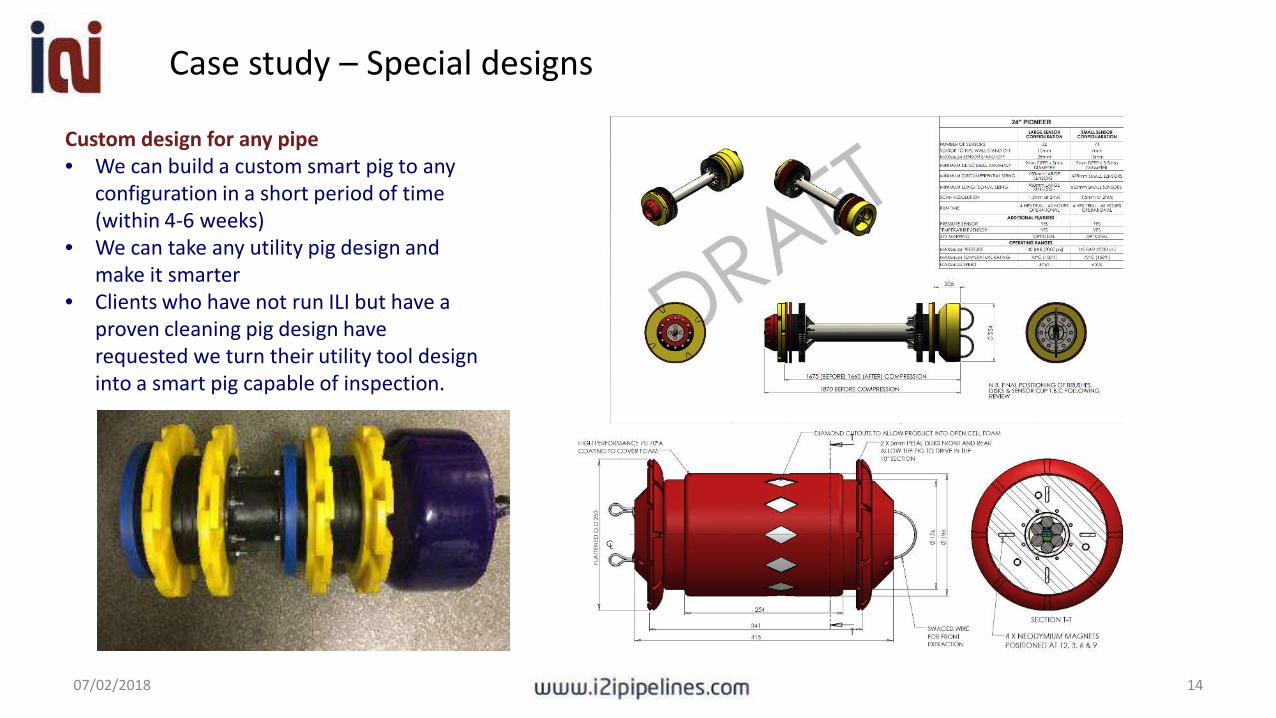
Custom design for any pipe• We can build a custom smart pig to any
configuration in a short period of time (within 4-6 weeks)
• We can take any utility pig design and make it smarter
• Clients who have not run ILI but have a proven cleaning pig design have requested we turn their utility tool design into a smart pig capable of inspection.
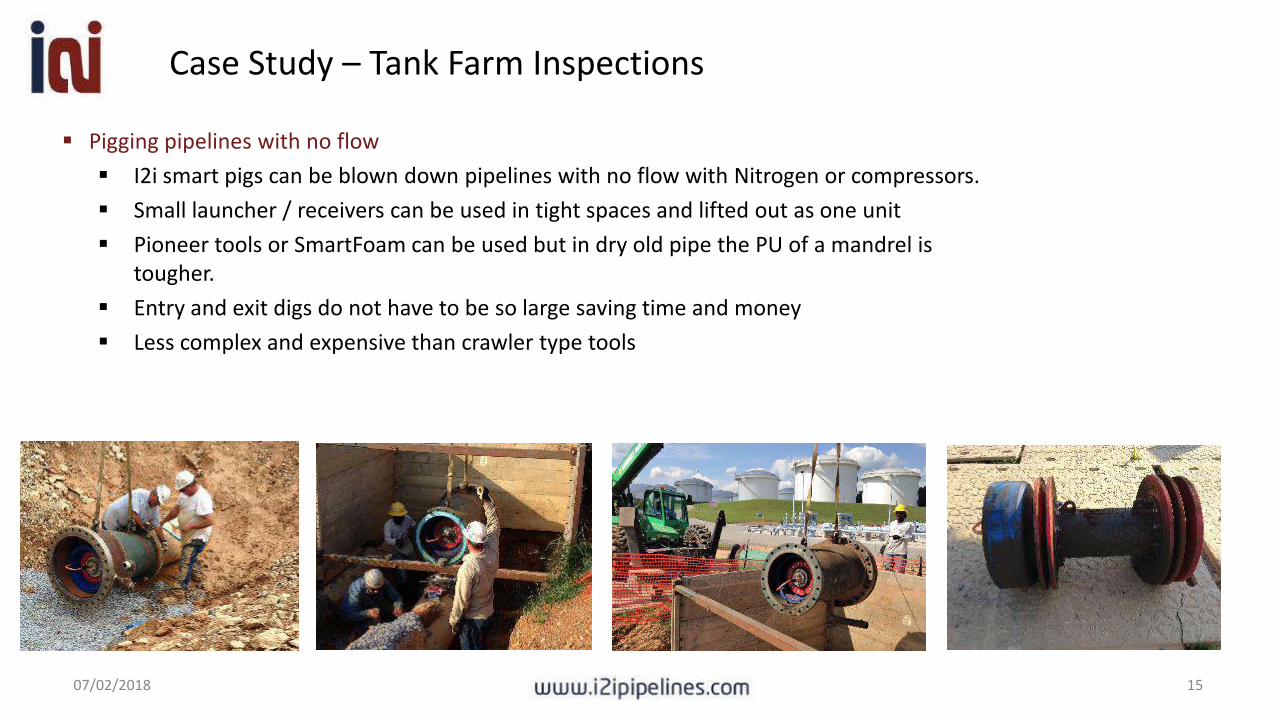
Case Study – Tank Farm Inspections
07/02/2018 15
Pigging pipelines with no flow I2i smart pigs can be blown down pipelines with no flow with Nitrogen or compressors. Small launcher / receivers can be used in tight spaces and lifted out as one unit Pioneer tools or SmartFoam can be used but in dry old pipe the PU of a mandrel is
tougher. Entry and exit digs do not have to be so large saving time and money Less complex and expensive than crawler type tools
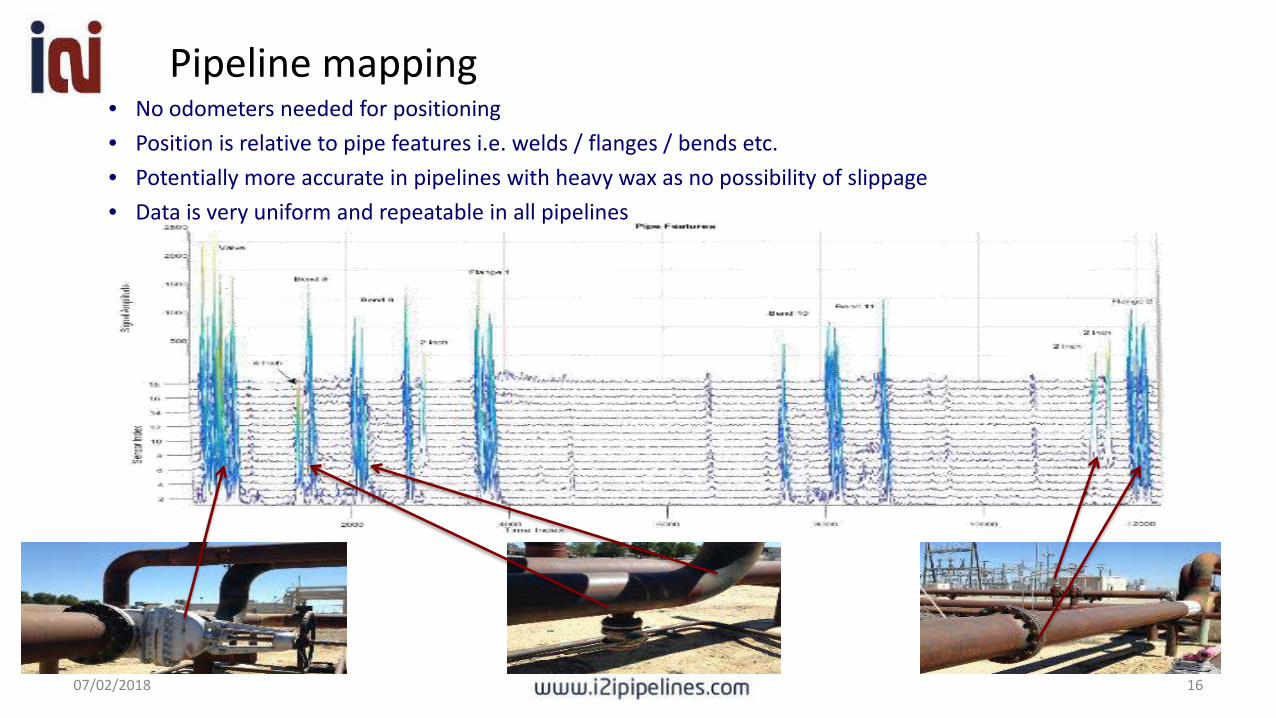
Pipeline mapping• No odometers needed for positioning• Position is relative to pipe features i.e. welds / flanges / bends etc.• Potentially more accurate in pipelines with heavy wax as no possibility of slippage• Data is very uniform and repeatable in all pipelines
1607/02/2018
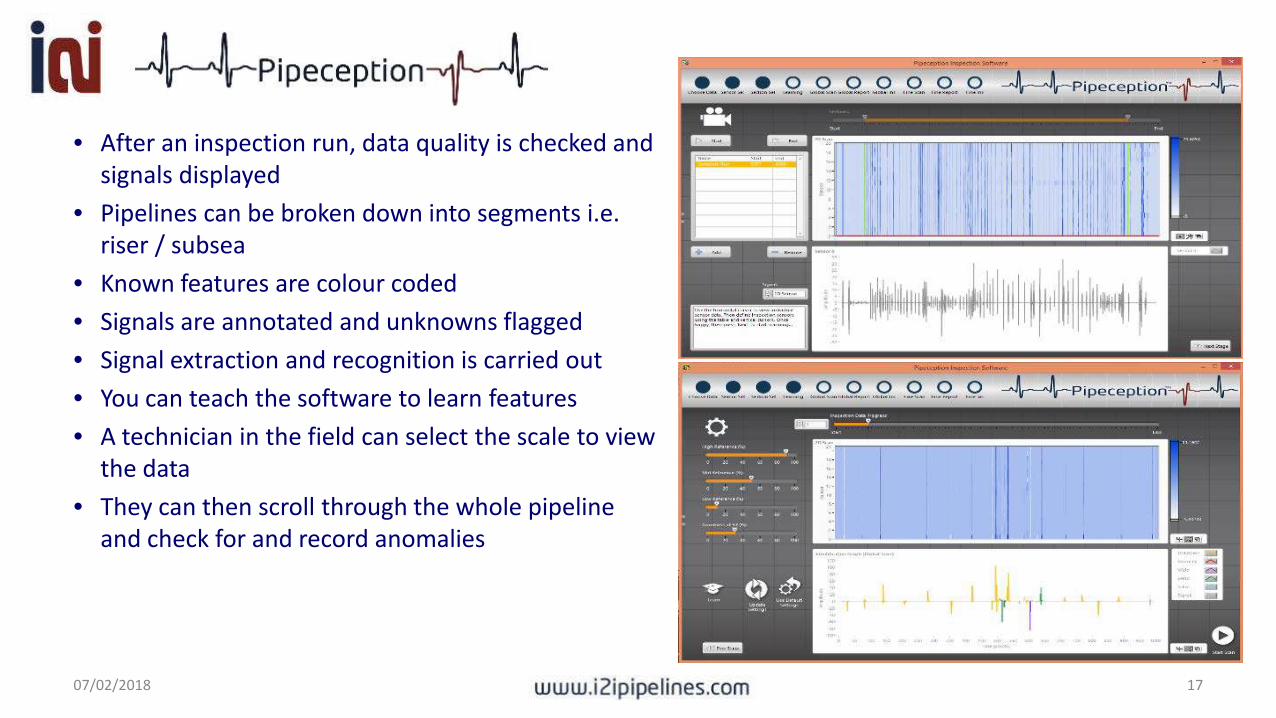
Pipeception
• After an inspection run, data quality is checked and signals displayed
• Pipelines can be broken down into segments i.e. riser / subsea
• Known features are colour coded• Signals are annotated and unknowns flagged• Signal extraction and recognition is carried out• You can teach the software to learn features • A technician in the field can select the scale to view
the data• They can then scroll through the whole pipeline
and check for and record anomalies
07/02/2018 17
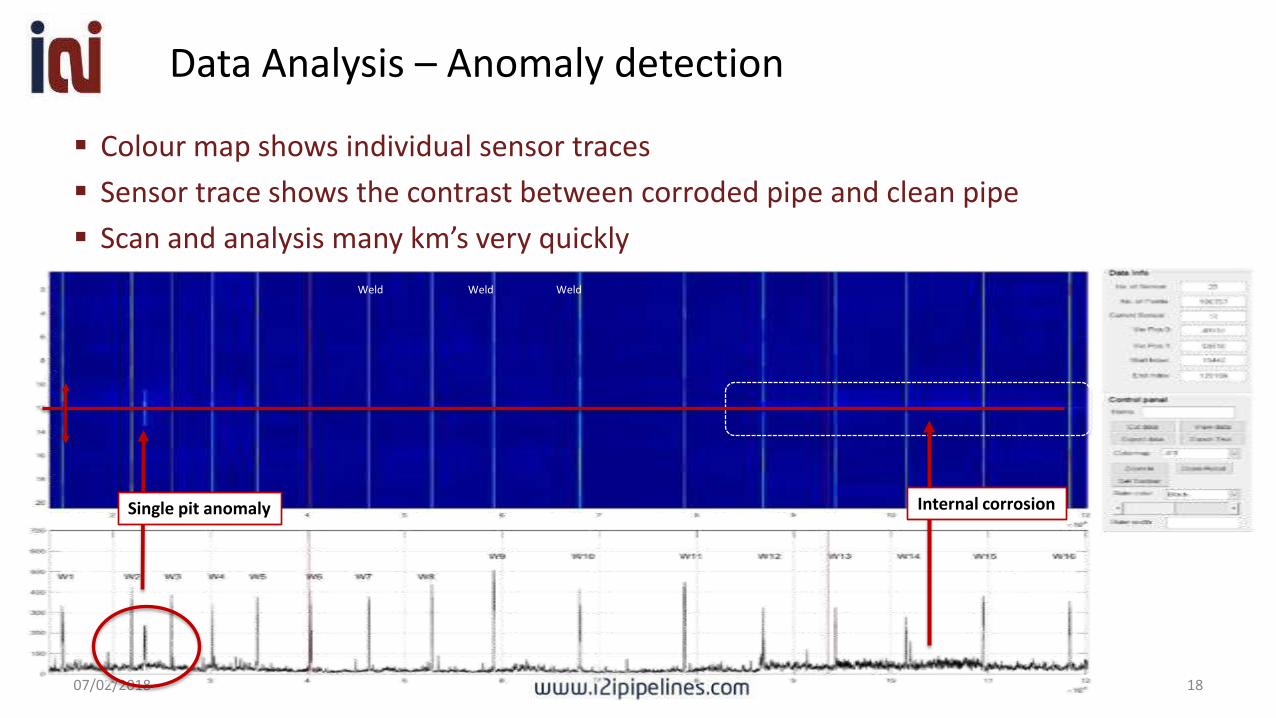
Data Analysis – Anomaly detection
Colour map shows individual sensor traces Sensor trace shows the contrast between corroded pipe and clean pipe Scan and analysis many km’s very quickly
07/02/2018 18
Single pit anomaly Internal corrosion
Weld Weld Weld
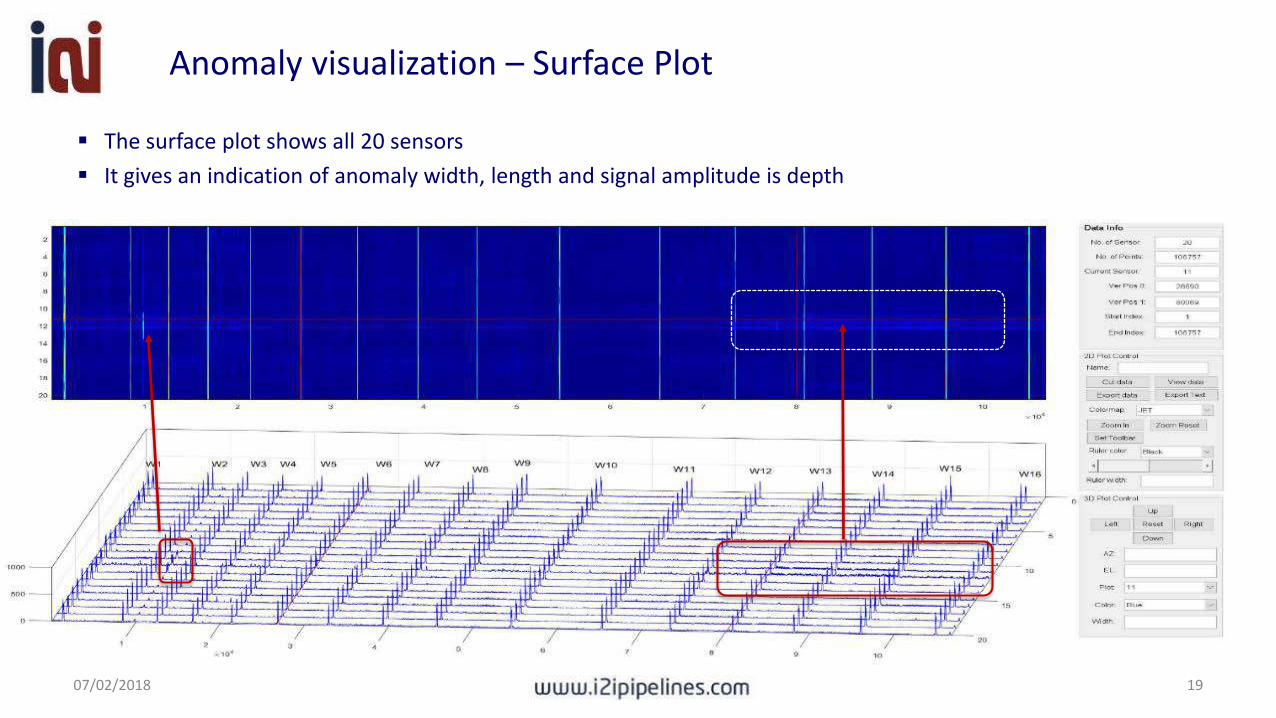
Anomaly visualization – Surface Plot
The surface plot shows all 20 sensors It gives an indication of anomaly width, length and signal amplitude is depth
1907/02/2018
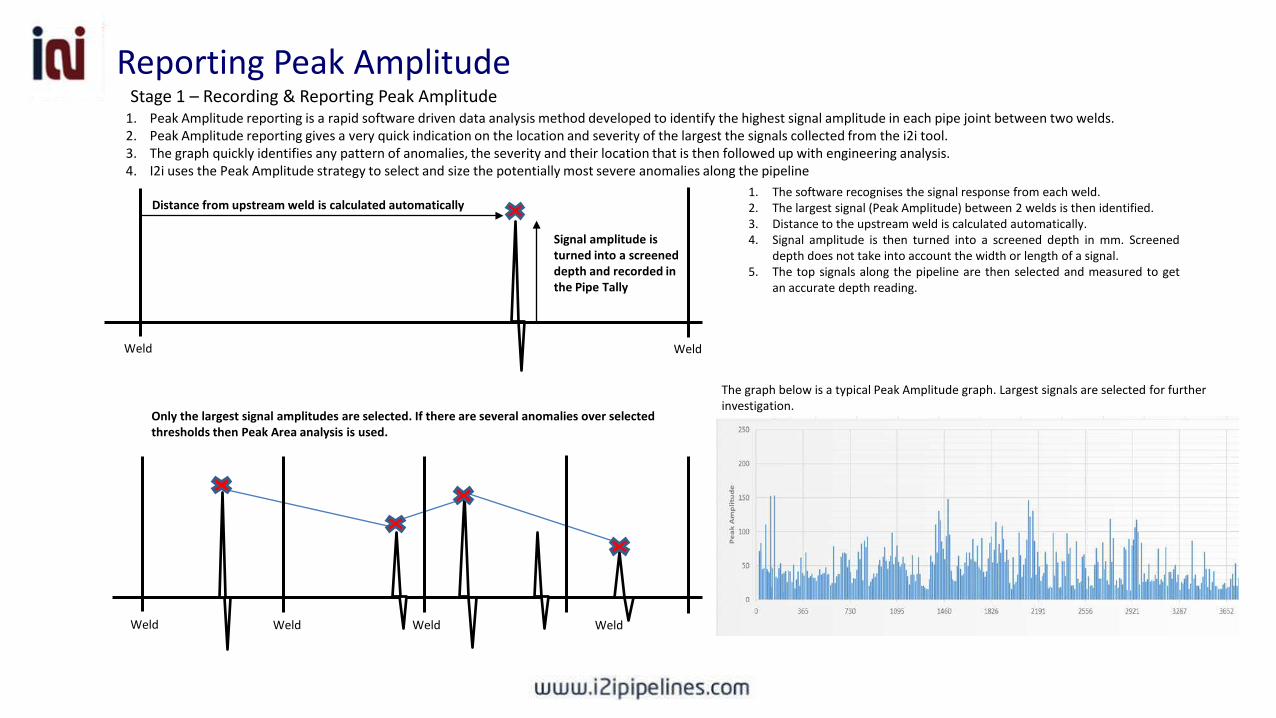
1. The software recognises the signal response from each weld.2. The largest signal (Peak Amplitude) between 2 welds is then identified.3. Distance to the upstream weld is calculated automatically.4. Signal amplitude is then turned into a screened depth in mm. Screened
depth does not take into account the width or length of a signal.5. The top signals along the pipeline are then selected and measured to get
an accurate depth reading.
1. Peak Amplitude reporting is a rapid software driven data analysis method developed to identify the highest signal amplitude in each pipe joint between two welds. 2. Peak Amplitude reporting gives a very quick indication on the location and severity of the largest the signals collected from the i2i tool.3. The graph quickly identifies any pattern of anomalies, the severity and their location that is then followed up with engineering analysis.4. I2i uses the Peak Amplitude strategy to select and size the potentially most severe anomalies along the pipeline
Stage 1 – Recording & Reporting Peak Amplitude
Weld Weld
Distance from upstream weld is calculated automatically
Signal amplitude is turned into a screened depth and recorded in the Pipe Tally
Weld WeldWeld Weld
The graph below is a typical Peak Amplitude graph. Largest signals are selected for further investigation.
Only the largest signal amplitudes are selected. If there are several anomalies over selected thresholds then Peak Area analysis is used.
Reporting Peak Amplitude
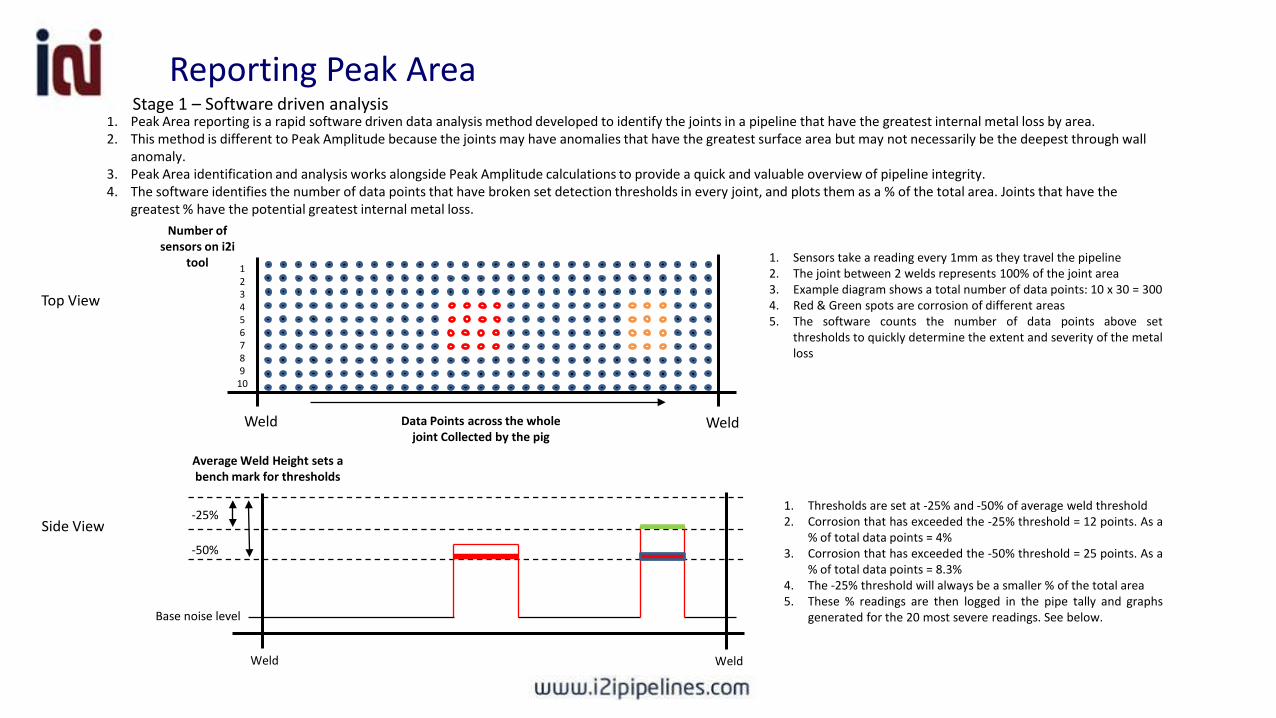
1. Sensors take a reading every 1mm as they travel the pipeline2. The joint between 2 welds represents 100% of the joint area3. Example diagram shows a total number of data points: 10 x 30 = 3004. Red & Green spots are corrosion of different areas5. The software counts the number of data points above set
thresholds to quickly determine the extent and severity of the metalloss
1. Thresholds are set at -25% and -50% of average weld threshold2. Corrosion that has exceeded the -25% threshold = 12 points. As a
% of total data points = 4%3. Corrosion that has exceeded the -50% threshold = 25 points. As a
% of total data points = 8.3%4. The -25% threshold will always be a smaller % of the total area5. These % readings are then logged in the pipe tally and graphs
generated for the 20 most severe readings. See below.
Weld Weld
Number of sensors on i2i
tool 123456789
10
Data Points across the whole joint Collected by the pig
1. Peak Area reporting is a rapid software driven data analysis method developed to identify the joints in a pipeline that have the greatest internal metal loss by area.2. This method is different to Peak Amplitude because the joints may have anomalies that have the greatest surface area but may not necessarily be the deepest through wall
anomaly.3. Peak Area identification and analysis works alongside Peak Amplitude calculations to provide a quick and valuable overview of pipeline integrity.4. The software identifies the number of data points that have broken set detection thresholds in every joint, and plots them as a % of the total area. Joints that have the
greatest % have the potential greatest internal metal loss.
Weld Weld
Average Weld Height sets a bench mark for thresholds
-25%
-50%
Base noise level
Top View
Side View
Stage 1 – Software driven analysis Reporting Peak Area
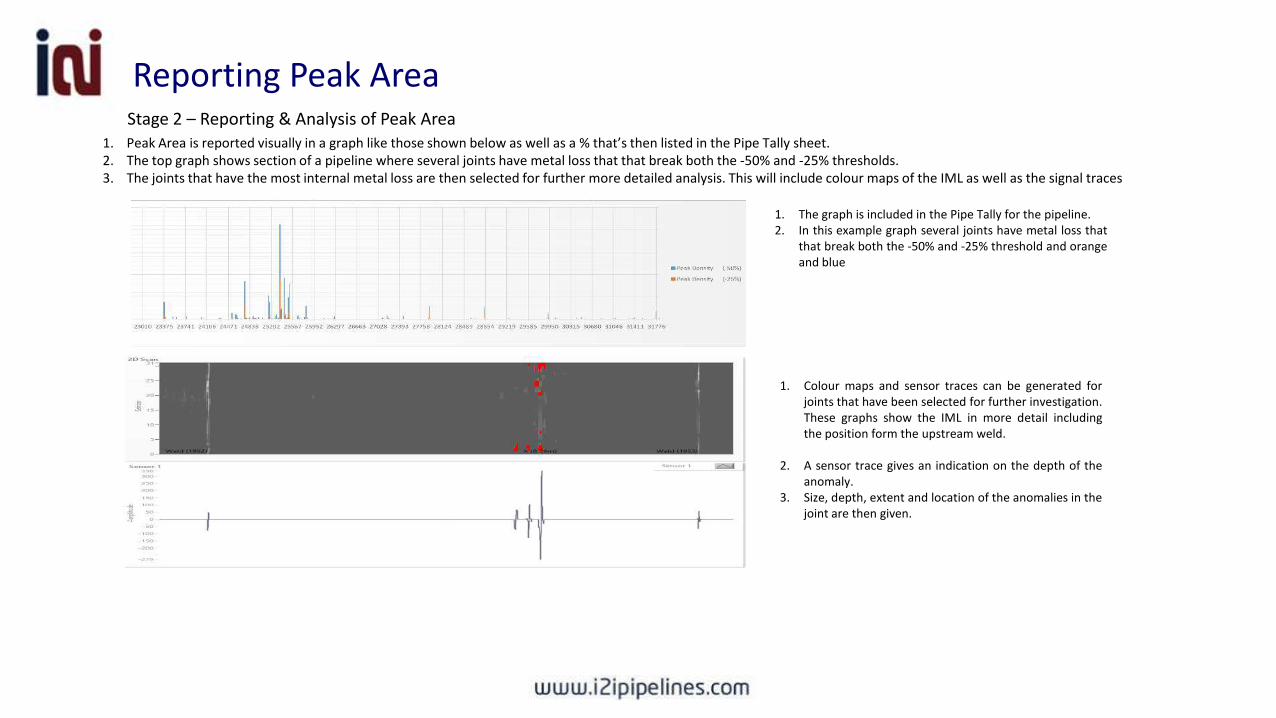
1. Peak Area is reported visually in a graph like those shown below as well as a % that’s then listed in the Pipe Tally sheet.2. The top graph shows section of a pipeline where several joints have metal loss that that break both the -50% and -25% thresholds.3. The joints that have the most internal metal loss are then selected for further more detailed analysis. This will include colour maps of the IML as well as the signal traces
1. Colour maps and sensor traces can be generated forjoints that have been selected for further investigation.These graphs show the IML in more detail includingthe position form the upstream weld.
2. A sensor trace gives an indication on the depth of theanomaly.
3. Size, depth, extent and location of the anomalies in thejoint are then given.
1. The graph is included in the Pipe Tally for the pipeline.2. In this example graph several joints have metal loss that
that break both the -50% and -25% threshold and orangeand blue
Stage 2 – Reporting & Analysis of Peak Area
Reporting Peak Area
Summary – Think differently• In-line inspection does not have to be an expensive, risky and disruptive exercise.• Smart sensors and simple operational tools targeting the largest anomalies in a pipeline can bring great value to pipeline
integrity operations.
• Don’t just inspect - Monitor• Where data collection is regular and low cost• Where data drives the decision making process• Where asset teams can maximize digital technologies
• Keep it Simple• Simple tools are lower risk and cheaper• Require less people to run• Less disruption to production
• Deployment designed to suit the Customer needs• Flexible• Low cost• Custom pigs with standard components
07/02/2018 23