i prostanoid receptor flammatory of aktchemical; and akt inhibitor iv (1 mmol/l) from calbiochem...
TRANSCRIPT

Shuai Yan,1 Qianqian Zhang,1 Xiaojing Zhong,1 Juan Tang,1 Yuanyang Wang,1 Junjie Yu,1
Yi Zhou,1 Jian Zhang,1 Feifan Guo,1 Yi Liu,1 Garret A. FitzGerald,2 and Ying Yu1,3
I Prostanoid Receptor–Mediated InflammatoryPathway Promotes HepaticGluconeogenesis ThroughActivation of PKA and Inhibitionof AKTDiabetes 2014;63:2911–2923 | DOI: 10.2337/db13-1893
Nonsteroidal anti-inflammatory drugs (NSAIDs), includ-ing acetylsalicylic acid (ASA), improve glucose metab-olism in diabetic subjects, although the underlyingmechanisms remain unclear. In this study, we observeddysregulated expression of cyclooxygenase-2, prosta-cyclin biosynthesis, and the I prostanoid receptor (IP) inthe liver’s response to diabetic stresses. High doses ofASA reduced hepatic prostaglandin generation and sup-pressed hepatic gluconeogenesis in mice during fasting,and the hypoglycemic effect of ASA could be restoredby IP agonist treatment. IP deficiency inhibited starvation-induced hepatic gluconeogenesis, thus inhibiting theprogression of diabetes, whereas hepatic overexpres-sion of IP increased gluconeogenesis. IP deletion de-pressed cAMP-dependent CREB phosphorylation andelevated AKT phosphorylation by suppressing PI3K-g/PKC-z–mediated TRB3 expression, which subsequentlydownregulated the gluconeogenic genes for glucose-6-phosphatase (G6Pase) and phosphoenol pyruvate car-boxykinase 1 in hepatocytes. We therefore conclude thatsuppression of IP modulation of hepatic gluconeogenesisthrough the PKA/CREB and PI3K-g/PKC-z/TRB3/AKTpathways contributes to the effects of NSAIDs in diabetes.
Glucose is the major source of energy required by mostmammalian cells to maintain normal physiological
functions. Glucose homeostasis is tightly regulated withina relatively narrow range by hormones such as glucagonand insulin and through balancing of glucose output bythe liver and its utilization by peripheral tissues such asskeletal muscle, heart, and adipocytes. Liver is the domi-nant organ in the maintenance of glucose homeostasis,which is regulated by way of glucose production throughglycogenolysis and gluconeogenesis, glucose uptake byglycogenesis, and glycolytic conversion to pyruvate (1). Cir-culating insulin increases in response to feeding, leading toglycogenesis and lipogenesis and the suppression of hepaticglucose production (HGP). Conversely, during fasting con-ditions or in the case of untreated type 1 diabetes, insulinsecretion drops and glucagon secretion rises, promptinghepatic glycogenolysis and gluconeogenesis. The key regu-latory enzymes for hepatic gluconeogenesis include glucose6 phosphatase (G6Pase), fructose-1, 6-bisphosphatase,and phosphoenolpyruvate carboxykinase 1 (PEPCK), alsoknown as PCK1. However, in patients with type 2 diabe-tes, the rate of hepatic gluconeogenesis is considerablyelevated, contributing to fasting hyperglycemia and toexaggerated postprandial hyperglycemia.
Prostaglandins (PGs) play important roles ininflammation-mediated diseases, including diabetes (2).
1Key Laboratory of Food Safety Research, Institute for Nutritional Sciences,Shanghai Institutes for Biological Sciences, Graduate School of the ChineseAcademy of Sciences, Chinese Academy of Sciences, Shanghai, China2Institute for Translational Medicine and Therapeutics, University of Pennsylvania,Philadelphia, PA3Key Laboratory of Food Safety Risk Assessment, Ministry of Health, Beijing,China
Corresponding author: Ying Yu, [email protected].
Received 18 December 2013 and accepted 2 April 2014.
This article contains Supplementary Data online at http://diabetes.diabetesjournals.org/lookup/suppl/doi:10.2337/db13-1893/-/DC1.
S.Y. and Q.Z. contributed equally to this work.
© 2014 by the American Diabetes Association. Readers may use this article aslong as the work is properly cited, the use is educational and not for profit, andthe work is not altered.
Diabetes Volume 63, September 2014 2911
METABOLISM

Elevated PGs have been observed in type 1 and type 2diabetes (3,4). Epidemiological studies have indicated thatthe use of nonselective nonsteroidal anti-inflammatorydrugs (NSAIDs), including acetylsalicylic acid (ASA), isassociated with a significant reduction in the risk of di-abetes in healthy populations (5). Selective cyclooxygen-ase (COX)-2 inhibitors have also been reported to increaseinsulin sensitivity in healthy individuals (6) and to ame-liorate diabetes in experimental animals (7). These obser-vations strongly suggest that COX-derived PGs areinvolved in the pathogenesis of diabetes. Moreover, clin-ical trials have revealed that treatment with ASA (8)results in the reduction of fasting plasma glucose andimproves insulin sensitivity, whereas high doses of selec-tive COX-2 inhibitors have been reported to cause hypo-glycemia (9) and increase the hypoglycemic effect of oralantidiabetic drugs (10). These observations raise the pos-sibility that PGs play a role in carbohydrate metabolism,especially in hepatic gluconeogenesis, the predominantsource of increased hepatic glucose in type 2 diabetes.
Prostanoids in liver are produced by parenchymal he-patocytes (11) and nonhepatocyte cells, such as Kupffer cells(12), and their biosynthesis and release can be regulated inresponse to a range of (patho) physiological stimuli to mod-ulate hepatocyte function. In isolated rodent livers, infusionof PGF2a but not thromboxane A2 stimulates gluconeogen-esis and glycogenolysis, and PGD2 induces hepatic glyco-genolysis (13), whereas PGE2 inhibits glucagon-mediatedgluconeogenesis from lactate (14). However, the relevanceof these infusion experiments to the autocoidal role andconcentrations of endogenous eicosanoids is unclear, andthe potential importance of PGI2 in regulating glucose me-tabolism in liver is unknown.
In this study, we observed upregulation of the COX-2/PGI2/I prostanoid receptor (IP) axis in the livers of fastedmice or mice treated with a high-fat diet (HFD), or mice inwhich diabetes had been induced genetically or pharmaco-logically. Deletion of the IP conferred protection againstdiabetes in mice due to the suppression of hepatic gluco-neogenesis. Conversely, reexpression of IP in the liver aug-mented hepatic glucose output and led to insulin resistanceby enhancing intracellular adenylate cyclase activity, upreg-ulating Tribble 3 (TRB3)-dependent AKT phosphorylation,and subsequently promoting transcription of the key he-patic gluconeogenic enzymes PCK1 and G6Pase. These datasuggest that PGI2 is involved in modulation of hepaticgluconeogenesis through the IP.
RESEARCH DESIGN AND METHODS
MiceThe mice used in this study were maintained at a C57BL/6background. For the diet-induced obese model, mice werefed a regular chow diet (SLRC, Shanghai, People’s Re-public of China) or an HFD (60% fat, D12492; ResearchDiets, New Brunswick, NJ) ad libitum for 16 weeks. ForASA treatment, 7-week-old ob/ob mice received normaldrinking water or drinking water containing 600 mg/L
(high-dose) ASA, respectively, which was replaced everyother day. All procedures were approved by the Institu-tion for Nutritional Sciences Institutional Animal Careand Use Committee, Shanghai Institutes for BiologicalSciences, Chinese Academy of Sciences, China.
Metabolic StudiesInsulin, glucose, and pyruvate tolerance tests wereperformed by an intraperitoneal injection of 0.8 units/kg insulin after 6-h fasting, 1.5 g/kg glucose after over-night fasting, or 2 g/kg sodium pyruvate after overnightfasting, respectively. Glucose clearance was evaluated bycalculating the areas under curve, as previously described(15). A glucagon challenge test was performed by an in-traperitoneal injection of glucagon (150 mg/kg) after a 15-h fast (16). Measurements of VO2 and the respirationexchange ratio (VCO2/VO2) were acquired using indirectcalorimetry, as previously described (17). Insulin and glu-cagon quantitation of murine plasma samples collected at8–9 A.M. was done using the Mercodia Ultrasensitive RatInsulin ELISA kit and the Glucagon ELISA kit (ALPCODiagnostics, Salem, NH), respectively. Serum triglyceride(TG), total cholesterol, HDL cholesterol, and LDL choles-terol were measured using assay kits (BHKT, Beijing, Peo-ple’s Republic of China). Tissue TG and total cholesterolwere measured using assay kits (BHKT), as previously de-scribed (18).
Western BlottingProteins from total cell lysates were separated by SDS-PAGEand probed with different primary antibodies against AKT(ser473), AKT (ser308), AKT, insulin receptor (IR) substrate(IRS; Ser307), IRS, FoxO1 (Ser253), FoxO1, glycogensynthase kinase 3b (GSK3b) (ser9), GSK3b, phospho-p44/42 mitogen-activated protein kinase (Thr202/Tyr204), p44/42 mitogen-activated protein kinase, PDK1, and carboxy-terminal modulator protein (CTMP; Cell Signaling Technol-ogy, Danvers, MA); COX-1 and COX-2 (Cayman ChemicalCompany, Ann Arbor, MI); G6Pase and TRB3 (Santa CruzBiotechnology, Santa Cruz, CA); PCK1 (Abcam); b-actin(Sigma-Aldrich, St. Louis, MO); and HK2 and peroxisomeproliferator–activated receptor (PPAR)-a (Proteintech,Wuhan, People’s Republic of China).
Primary HGPPrimary hepatocytes were washed three times with PBSand then changed to glucose- and phenol-free DMEMwith 20 mmol/L sodium lactate and 1 mmol/L sodiumpyruvate for 6 h. Glucose levels in the culture weredetermined using a Glucose Assay kit (Sigma-Aldrich).Total protein was used for normalization. For adenovirus(Ad) experiments, cells were infected with various Ad, andHGP was quantitated after 48 h.
Cell Culture and TreatmentsPrimary hepatocytes were cultured in DMEM with25 mmol/L glucose, 10% FBS, and 50 mg/mL penicillinand streptomycin at 37°C in 5% CO2 and 95% air. Insulin(100 nmol/L) from Sigma-Aldrich; glucagon (100 nmol/L),
2912 IP Pathway Promotes Gluconeogenesis Diabetes Volume 63, September 2014

cicaprost (1 mmol/L), LY294002 (25 mmol/L), RO32-0432(10 mmol/L), and CAY-10441 (1 mmol/L) from CaymanChemical; and Akt inhibitor IV (1 mmol/L) from Calbiochemwere used to treat hepatocytes as indicated.
Determination of Cellular cAMP LevelsCellular cAMP levels were measured as previouslydescribed (19).
In Vivo Insulin Signaling AssayFor measurement of insulin signaling in liver, micemaintained on different diets were fasted 6 h beforereceiving an insulin injection. Mice were anesthetized,and a piece of liver was excised through an incision andsnap frozen in liquid nitrogen as the untreated control.Within 4–5 min after injection via the portal vein with10 units/kg human insulin (Eli Lilly, Indianapolis, IN),another piece of liver was snap frozen for subsequentprotein extraction and Western blot analysis.
Construction of Adenoviral Vector Encoding IPTo construct an IP overexpressing adenoviral vector, mouseIP full-length cDNA was inserted into the pAdTrack-cytomegalovirus construct, which was then subcloned intopAdEasy-1 adenoviral backbone vector through homolo-gous recombination in BJ5183. To package the Ad, theadenoviral DNA was linearized by PacI restrictionenzyme and transfected into HEK293 cells using Lipo-fectamine 2000 (Invitrogen). After several rounds ofpropagation, recombinant Ad was purified by ultracen-trifugation in cesium chloride gradient.
Isolation of Liver Kupffer CellsLiver Kupffer cells were prepared as previously described(20,21). The purity and viability of Kupffer cells wereassessed by trypan blue and immunostaining.
PG ExtractionPG extraction from liver tissue or culture medium wasroutinely performed in the laboratory (22).
PCK1 ActivityPCK1 activity was examined as previously described (23).
Generation of Streptozotocin-Induced Diabetic MiceStreptozotocin (STZ)-induced diabetic mice were pro-duced by using previously described methods (24)
mRNA Quantification by RT-PCRTotal RNA from cultured hepatocytes or tissues wasextracted using Trizol reagent (Invitrogen, Carlsbad, CA)and then treated with RNase-free DNase (Takara, Dalian,People’s Republic of China) at 37°C for 2 min to removegenomic DNA. The primers used for each target gene aresummarized in Supplementary Table 1.
Statistical AnalysisThe Student t test was used for all statistical analysis.Time course studies were analyzed by two-way ANOVA,followed by the Bonferroni posttest (GraphPad Prism 5software). P , 0.05 was considered statistically signifi-cant. Data are represented as mean 6 SEM.
RESULTS
COX-2/PGI2/IP Axis Is Upregulated in Liver inResponse to Fasting and Diabetic StressWe first examined the expression of all prostanoid re-ceptors in metabolic tissues from chow-fed mice (Supple-mentary Fig. 1). All of the prostanoid receptors werevariously expressed in liver except FP. Of note, thrombox-ane receptor (TP) and IP were abundantly detected in liver,white adipose tissue (WAT), and skeletal muscle. In con-trast to the dominant constitutive expression of COX-1,only COX-2 was upregulated by fasting or administrationof the HFD to wild-type (WT) mice, and a similar inductionwas evident in ob/ob mice (Fig. 1A and B), with a corre-sponding induction of prostanoid formation (Fig. 1C). Themost abundant product formed in the livers was PGI2 un-der physiological conditions. Further investigation of he-patocytes and Kupffer cell–enriched nonparenchymal cells(.80% by immunostaining) revealed that COX-2 expres-sion was upregulated in response to COX-1 deficiency(Fig. 1D and F), suggesting that products of COX-1 con-tribute to the expression of COX-2, which is consistentwith previous observations (25). However, the deletion ofCOX-1 or COX-2 reduced all prostanoids compared withWT controls (Fig. 1E and G). Interestingly, COX-2 expres-sion and prostanoids production induced by high glucoseconcentrations appeared more robust in Kupffer cells thanin hepatocytes (Fig. 1D–G). IP expression in liver was alsoelevated significantly in fasted, HFD-fed, and ob/ob mice(Fig. 1H and I); however, we did not observe any altera-tions of TP expression in metabolic organs in response tofasting and the HFD challenge (data not shown).
IP Deficiency and High Doses of ASA Reduced FastingBlood Glucose Levels in MiceGiven that the hepatic PGI2/IP axis was activated in re-sponse to fasting and diabetic stresses, we first examinedthe effect of IP ablation on glucose metabolism in mice. IPdeletion had no detectable effect on blood glucose levelsin chow-fed mice but significantly decreased blood glucoseduring fasting as measured at 4 h and 8 h (Fig. 2A), andthe hyperglycemic response to glucagon was markedlyattenuated in IP-deficient mice (Fig. 2B). Interestingly,mRNA and protein expression of key gluconeogenic genesin liver, G6Pase and PCK1, were consistently reduced in IPknock-out (KO) mice compared with WT littermates, be-fore and after fasting (Fig. 2C–E). PCK1 activity in liverwas also impaired in IP KO mice in response to fasting(Fig. 2F). Moreover, we did not observe alterations of thekey hepatic glycogenolytic gene for glycogen phosphory-lase (Pygl) in IP KO mice (Fig. 2G), suggesting that thefasting hypoglycemia in the mutants resulted from a de-fect of hepatic gluconeogenesis, not glycogenolysis.
To further investigate whether IP disruption interfereswith lipid metabolism and glycolysis in mice, we analyzedthe blood lipid profiles and expression of enzymesinvolved in fatty acid synthesis, fatty acid oxidation,and glycolysis. No differences in blood cholesterol or TG
diabetes.diabetesjournals.org Yan and Associates 2913

were detected between IP KO and WT in fed or fastedstates (Supplementary Fig. 2). In addition, the expressionof key enzymes for de novo fatty acid synthesis, includingATP citrate lyase (ACL), acetyl-CoA carboxylase 1 (ACC1),and fatty acid synthase in livers, gastrocnemii, and WAT,were unaltered in IP KO mice (Supplementary Figs. 3A–Cand 4A–C). Moreover, IP deletion did not influence he-patic fatty acid oxidation, muscular glycolysis, or glucoseuptake by skeletal muscle or WAT in mice (SupplementaryFigs. 5A–C and 6A–C). Taken together, these results
suggest that IP is involved in hepatic gluconeogenesis inresponse to fasting.
High doses of ASA reportedly lower fasting bloodglucose in type 2 diabetes (8,26). As expected, a markedreduction of PG formation in liver, including PGI2 (Sup-plementary Fig. 7A) and a significant depression in fastingblood glucose were observed in ob/ob mice treated with600 mg/L ASA in drinking water (Supplementary Fig. 7B).Likewise, PCK1 and G6Pase expression in liver was alsodramatically reduced by high doses of ASA, further
Figure 1—Alterations of the COX-2/PGI2/IP axis in liver in response to fasting and diabetic stress. A: Western blot analysis of COX-1 andCOX-2 in liver tissue from regular chow diet–fed (CHOW), HFD-treated, and ob/ob mice, under fed or 12-h fasting conditions. B: Densi-tometric analysis of the abundance of COX-1 and COX-2 as in A. *P < 0.05, **P < 0.01 vs. WT (n = 4). C: PG profile of liver tissue fromnormal diet–fed (Fed), fasting, HFD-treated, and ob/ob mice (12-week-old). *P < 0.05, **P < 0.01 vs. Fed group (n = 8). D: Expression ofCOX-1 and COX-2 in primary hepatocytes from WT, COX-1 KO, and COX-2 KO mice. E: PG profile of primary hepatocytes at basal andhigh glucose–stimulated conditions. *P < 0.05 vs. WT (5 mmol/L glucose; n = 6). F: Expression of COX-1 and COX-2 in Kupffer cells fromWT, COX-1 KO, and COX-2 KO mice. G: PG profile of Kupffer cells at basal (5 mmol/L glucose) and high glucose–stimulated conditions.*P < 0.05 vs. WT; #P < 0.05 vs. basal condition (n = 6). H: mRNA expression of IP in liver from regular chow diet–fed (Fed), fasting, HFD-treated, and ob/ob mice. *P < 0.05 vs. Fed group (n = 8). I: Schematic diagram for changes of COX-2/PGI2/IP axis in livers under fasting ordiabetic stresses. TxB2, thromboxane B2.
2914 IP Pathway Promotes Gluconeogenesis Diabetes Volume 63, September 2014

suggesting that the hypoglycemic effect of ASA is due tosuppression of hepatic gluconeogenesis (SupplementaryFig. 7C). Interestingly, the decline of blood glucose inob/ob mice by ASA was restored completely by adminis-tration of the IP agonist cicaprost (Supplementary Fig.7D), suggesting that the hypoglycemic effect of ASA mightbe at least partly mediated through inhibition of PGI2/IPsignaling.
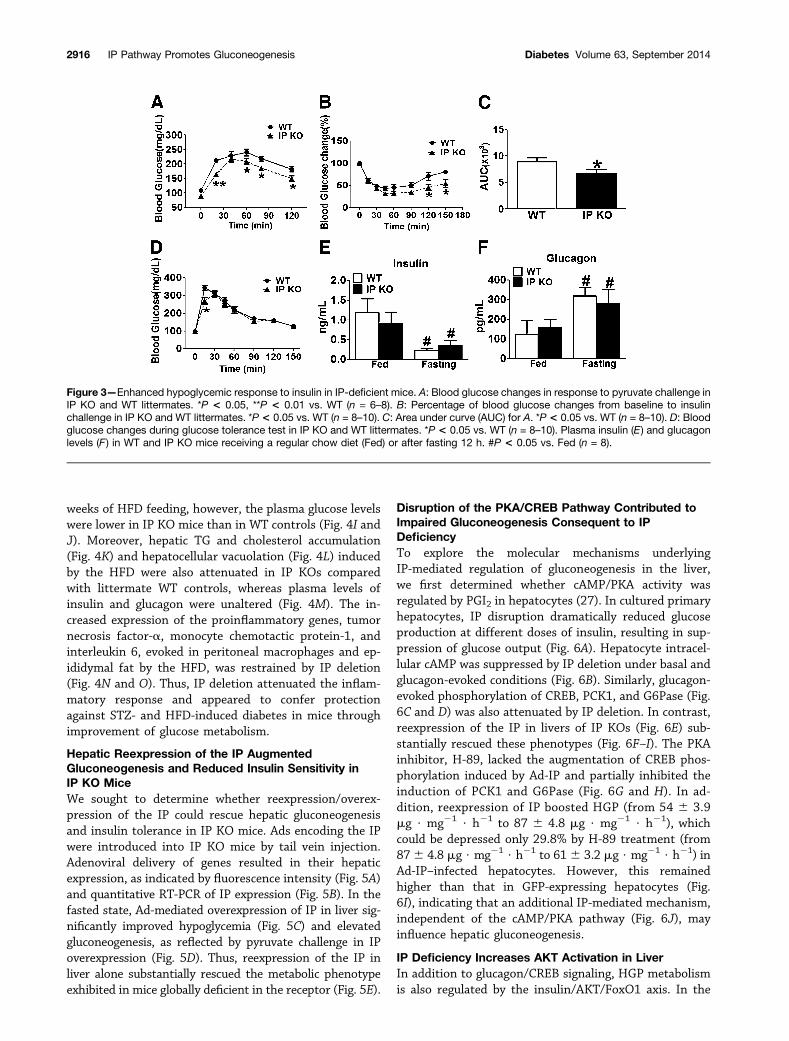
To directly determine the effect of IP deficiency ongluconeogenesis in vivo, pyruvate tolerance tests wereperformed on age- and weight-matched lean male mice. IPKO mice have a decreased gluconeogenic capacity (Fig.3A). In addition, hypoglycemic response to insulin wasmore pronounced in IP KO mice compared with WT lit-termates (Fig. 3B and C). There were no marked improve-ments in glucose tolerance and normal glucose clearancein IP KO mice (Fig. 3D). However, we did not detect anyovert differences in blood insulin and glucagon levels be-tween IP KO and WT mice in fed or fasted states, despitea sharp decrease in insulin and a marked elevation ofglucagon in response to fasting (Fig. 3E and F). No
significant differences were detected in O2 consumption,and CO2 and heat production, the respiratory exchangeratio, and activity between IP KOs and WTs (Supplemen-tary Fig. 8A–E).
IP Deficiency Protected Against STZ- andHFD-Induced DiabetesMultiple doses of STZ induced severe degeneration andnecrosis of pancreatic b-cells (Fig. 4A) and islet shrinkage(Fig. 4B–C) in IP KO and WT mice, as reflected by a strik-ing reduction of insulin secretion (Fig. 4D). The elevationin blood glucose evoked by STZ in WT mice fed regularchow was significantly blunted by IP deletion (Fig. 4E). Nodifferences in insulin and glucagon levels were detectedbetween IP KO and WT mice (Fig. 4D). After the HFDchallenge, IP KO mice gained approximately the samebody weight as their WT littermates (Fig. 4F) and ex-hibited normal body composition (Fig. 4G). There wasno significant difference of blood glucose levels betweenHFD-challenged IP KO and WT mice (Fig. 4H). In re-sponse to insulin and glucose tolerance tests after 16
Figure 2—Impaired hepatic gluconeogenesis in IP KO mice. A: Blood glucose changes in response to fasting in IP KO and WT littermates.*P < 0.05 vs. WT (n = 8). B: Blood glucose changes in response to glucagon challenge in IP KO and WT littermates. *P < 0.05 vs. WT (n =6–8). C: mRNA expression levels of hepatic PCK1 and G6Pase in IP KO and WT littermates after fasting 8 h. *P < 0.05 vs. WT (n = 6). D:Immunoblot of PCK1 and G6Pase expression in livers from IP KO and WT littermates during fasting. E: Densitometric analysis for theabundance of PCK1 and G6Pase as in D. *P < 0.05, **P < 0.01 vs. WT (n = 4). F: PCK1 enzyme activity in livers from IP KO and WTlittermates after fasting 8 h. **P < 0.01 vs. WT (n = 6). G: mRNA expression of glycogen phosphorylase (Pygl) in livers from IP KO andWT littermates receiving a regular chow diet (Fed) or after fasting 8 h. #P < 0.05 vs Fed controls.
diabetes.diabetesjournals.org Yan and Associates 2915
weeks of HFD feeding, however, the plasma glucose levelswere lower in IP KO mice than in WT controls (Fig. 4I andJ). Moreover, hepatic TG and cholesterol accumulation(Fig. 4K) and hepatocellular vacuolation (Fig. 4L) inducedby the HFD were also attenuated in IP KOs comparedwith littermate WT controls, whereas plasma levels ofinsulin and glucagon were unaltered (Fig. 4M). The in-creased expression of the proinflammatory genes, tumornecrosis factor-a, monocyte chemotactic protein-1, andinterleukin 6, evoked in peritoneal macrophages and ep-ididymal fat by the HFD, was restrained by IP deletion(Fig. 4N and O). Thus, IP deletion attenuated the inflam-matory response and appeared to confer protectionagainst STZ- and HFD-induced diabetes in mice throughimprovement of glucose metabolism.
Hepatic Reexpression of the IP AugmentedGluconeogenesis and Reduced Insulin Sensitivity inIP KO MiceWe sought to determine whether reexpression/overex-pression of the IP could rescue hepatic gluconeogenesisand insulin tolerance in IP KO mice. Ads encoding the IPwere introduced into IP KO mice by tail vein injection.Adenoviral delivery of genes resulted in their hepaticexpression, as indicated by fluorescence intensity (Fig. 5A)and quantitative RT-PCR of IP expression (Fig. 5B). In thefasted state, Ad-mediated overexpression of IP in liver sig-nificantly improved hypoglycemia (Fig. 5C) and elevatedgluconeogenesis, as reflected by pyruvate challenge in IPoverexpression (Fig. 5D). Thus, reexpression of the IP inliver alone substantially rescued the metabolic phenotypeexhibited in mice globally deficient in the receptor (Fig. 5E).
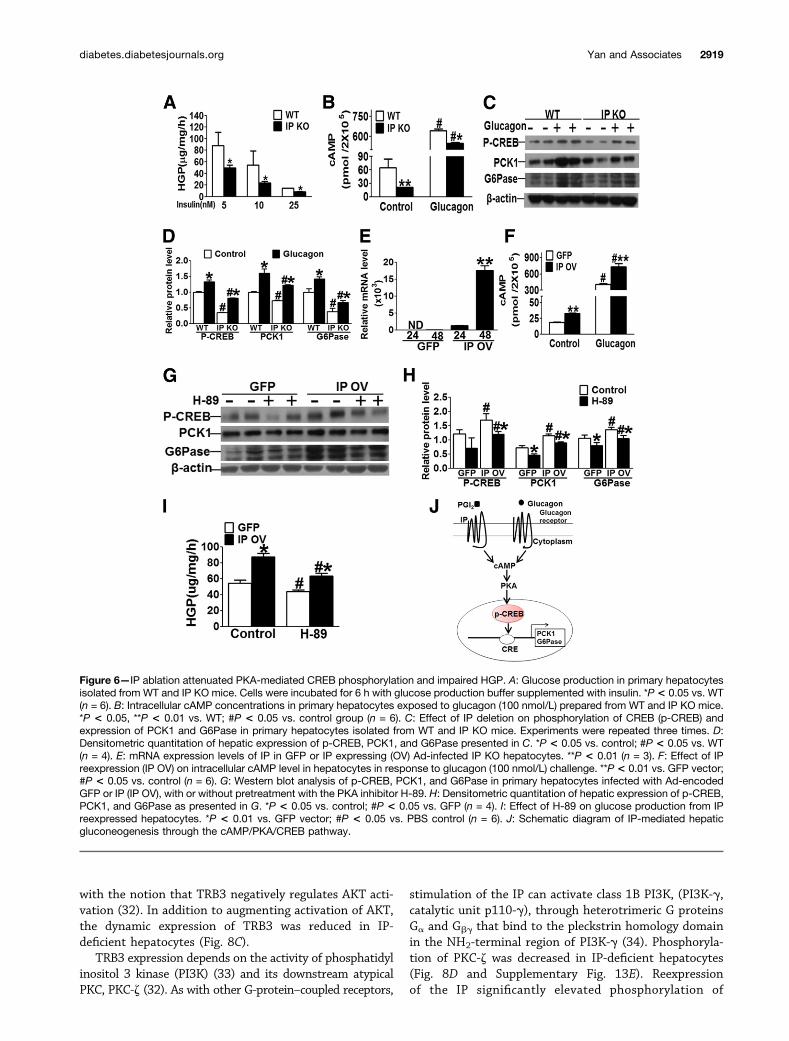
Disruption of the PKA/CREB Pathway Contributed toImpaired Gluconeogenesis Consequent to IPDeficiencyTo explore the molecular mechanisms underlyingIP-mediated regulation of gluconeogenesis in the liver,we first determined whether cAMP/PKA activity wasregulated by PGI2 in hepatocytes (27). In cultured primaryhepatocytes, IP disruption dramatically reduced glucoseproduction at different doses of insulin, resulting in sup-pression of glucose output (Fig. 6A). Hepatocyte intracel-lular cAMP was suppressed by IP deletion under basal andglucagon-evoked conditions (Fig. 6B). Similarly, glucagon-evoked phosphorylation of CREB, PCK1, and G6Pase (Fig.6C and D) was also attenuated by IP deletion. In contrast,reexpression of the IP in livers of IP KOs (Fig. 6E) sub-stantially rescued these phenotypes (Fig. 6F–I). The PKAinhibitor, H-89, lacked the augmentation of CREB phos-phorylation induced by Ad-IP and partially inhibited theinduction of PCK1 and G6Pase (Fig. 6G and H). In ad-dition, reexpression of IP boosted HGP (from 54 6 3.9mg $ mg21 $ h21 to 87 6 4.8 mg $ mg21 $ h21), whichcould be depressed only 29.8% by H-89 treatment (from876 4.8 mg $ mg21 $ h21 to 616 3.2 mg $ mg21 $ h21) inAd-IP–infected hepatocytes. However, this remainedhigher than that in GFP-expressing hepatocytes (Fig.6I), indicating that an additional IP-mediated mechanism,independent of the cAMP/PKA pathway (Fig. 6J), mayinfluence hepatic gluconeogenesis.
IP Deficiency Increases AKT Activation in LiverIn addition to glucagon/CREB signaling, HGP metabolismis also regulated by the insulin/AKT/FoxO1 axis. In the
Figure 3—Enhanced hypoglycemic response to insulin in IP-deficient mice. A: Blood glucose changes in response to pyruvate challenge inIP KO and WT littermates. *P < 0.05, **P < 0.01 vs. WT (n = 6–8). B: Percentage of blood glucose changes from baseline to insulinchallenge in IP KO and WT littermates. *P < 0.05 vs. WT (n = 8–10). C: Area under curve (AUC) for A. *P < 0.05 vs. WT (n = 8–10). D: Bloodglucose changes during glucose tolerance test in IP KO and WT littermates. *P < 0.05 vs. WT (n = 8–10). Plasma insulin (E) and glucagonlevels (F ) in WT and IP KO mice receiving a regular chow diet (Fed) or after fasting 12 h. #P < 0.05 vs. Fed (n = 8).
2916 IP Pathway Promotes Gluconeogenesis Diabetes Volume 63, September 2014

Figure 4—IP-deficient mice are resistant to STZ- and HFD-induced diabetes. A: Representative hematoxylin and eosin (H&E) staining ofpancreatic sections from STZ-treated IP KO and WT mice. Scale, 100 mm. B: Representative immunohistochemistry (IHC) staining of insulinin pancreatic sections from STZ-treated IP KO and WT mice. Scale bar, 100 mm. C: Quantification of insulin staining in B. #P < 0.05 vs.control (n = 6). D: Plasma insulin and glucagon levels of STZ-treated IP KO and WT mice. #P < 0.05 vs. control (n = 8). E: Blood glucosechanges of IP KO and WT mice after STZ treatments. *P< 0.05, **P< 0.01 vs. WT (n = 8). F: Body weight of IP KO and WT mice challengedwith HFD. Mice were weighed every week after HFD treatment (n = 8). G: Body composition of IP KO and WT mice. Mice before (CHOW)and after 16 weeks of HFD treatment underwent fat/lean evaluation by DEXA (n = 8). H: Blood glucose concentration of IP KO and WT micefed the HFD (n = 8–10). I: Insulin tolerance test on IP KO and WT control mice fed the HFD for 16 weeks. *P< 0.05 vs. WT (n = 8). J: Glucosetolerance test on IP KO and WT mice fed the HFD for 16 weeks. *P < 0.05, **P < 0.01 vs. WT control (n = 8). K: Hepatic TG and totalcholesterol (CHO) contents of IP KO and WT controls fed the regular chow diet (CHOW) or the HFD for 16 weeks. *P < 0.05, **P < 0.01 vs.WT control; #P< 0.05 vs. CHOW (n = 8). L: Representative H&E stainings of livers from HFD-treated IP KO and WT mice.M: Plasma insulinand plasma glucagon levels in WT and IP KO mice after HFD for 16 weeks. #P < 0.05 vs. chow-fed (n = 8). N: mRNA levels of tumornecrosis factor-a (TNF-a), interleukin-6 (IL-6), and monocyte chemotactic protein-1 (MCP-1) in peritoneal macrophages from IP KO andWT mice before (CHOW) and after 16 weeks of HFD treatment. *P < 0.05 vs. WT control; #P < 0.05 vs. CHOW (n = 8). O: mRNA levels ofTNF-a, IL-6, and MCP-1 in WAT from IP KO and WT mice before (CHOW) and after 16 weeks of HFD treatment. *P < 0.05 vs. WT control;#P < 0.05 vs. CHOW (n = 8).
diabetes.diabetesjournals.org Yan and Associates 2917

fed state, increased insulin secretion activates the AKTpathway in hepatocytes, which in turn, phosphorylatesand inhibits FoxO1, which is subjected to ubiquitinationand degradation in the cytoplasm, resulting in reducedexpression of gluconeogenic genes, PCK1 and G6Pase(28). Under basal conditions, the level of phosphorylationof AKT (Ser473 and Thr308) is quite low in primary he-patocytes from WT mice. However, deletion of the IP inprimary hepatocytes markedly increased phosphorylationof AKT, FoxO1 (Ser253), and GSK3b (Ser9, another AKTdownstream substrate), even in the absence of insulinstimulation (Fig. 7A and B). Similar results were observedin livers obtained from mice fed a chow diet or HFD(Supplementary Fig. 9A and B). Again, the expression lev-els of PCK1 and G6Pase decreased in IP KO hepatocytes(Fig. 7A). However, we did not detect alterations of IRS-1protein expression and its tyrosine phosphorylation in IP-deficient hepatocytes (Fig. 7A and B), consistent with un-changed plasma insulin levels in the IP KO mice (Fig. 3E).Thus, IP deletion appeared to modulate AKT activity in-dependent of an effect on the IR. The AKT inhibitor IV,which efficiently restrained phosphorylation of AKT atSer-473 and Thr-308 (Supplementary Fig. 10A and B),blocked the augmented phosphorylation of AKT andFoxO1 in IP-deficient hepatocytes (Fig. 7C and D) butdid not completely abolish the differences in expressionof PCK1 and G6Pase between the two genotypes (Fig. 7Cand D). Knockdown of AKT in primary hepatocytes fur-ther confirmed the findings described above (Supplemen-tary Fig. 11). In addition, IP disruption in cultured
hepatocytes reduced HGP approximately by half (Fig.7E). This corresponds to a reduction of approximatelyone-fifth after treatment with AKT inhibitor IV (215 610.83 mg $ mg21 $ h21 vs. 175 6 6.7 mg $ mg21 $ h21),which was consistent with the premise that elevated ac-tivation of AKT contributed to suppression of hepaticgluconeogenesis in IP KO mice (Fig. 7F).
PGI2 Modulated Hepatic Gluconeogenesis via thePI3K/PKC-z/TRB3 Pathway to Depress AKTThe activity of AKT can be modulated through itsinteraction with various binding partners (29). For exam-ple, AKT activity can be downregulated by CTMP (30) andpseudokinase TRB3, an endogenous AKT inhibitor thatbinds to AKT and prevents insulin-mediated AKT phos-phorylation (31). We observed that TRB3 expression atmRNA (Supplementary Fig. 12A and B) and protein (Fig.8A and Supplementary Fig. 13A) levels was markedly sup-pressed in livers from IP KO mice under fed and fastedconditions and that this expression could be rescued byhepatic reexpression of the IP in the KO mice (Fig. 8B andSupplementary Fig. 13B). Deletion or reexpression of IPin hepatocytes failed to influence expression of PDK1 andCTMP (data not shown). Insulin also induces the expres-sion of TRB3, which, in turn, modulates AKT activity tomaintain normal glucose metabolism (31). Insulin treat-ment led to rapid AKT phosphorylation (peaking at 2 h),followed by subsequent deactivation, whereas TRB3 in-duction lagged behind AKT phosphorylation (Fig. 8Cand Supplementary Fig. 13C and D), which was consistent
Figure 5—Hepatic reexpression of IP in liver restored fasting-induced hypoglycemia and reduced insulin sensitivity and glucose tolerancein mice. A: Representative imaging of IP KO mice expressing adenovirally encoded IP (IP OV) and GFP. Ad was infused by tail vein, andimages were analyzed on day 7. B: IP expression in livers from IP KO mice after 7 days of Ad infusion. **P < 0.05 (n = 6). C: Effect of IP Ad(IP OV) infusion on plasma glucose levels in IP KO mice in response to fasting. *P< 0.05 vs. GFP controls (n = 6). D: Pyruvate tolerance testof IP KO mice expressing Ad encoded with GFP or IP (IP OV). *P < 0.05, **P < 0.01 vs. GFP (n = 8). E: Insulin tolerance test of IP KO miceexpressing Ad-encoded GFP or IP (IP OV). *P < 0.05, **P < 0.01 vs. GFP (n = 8).
2918 IP Pathway Promotes Gluconeogenesis Diabetes Volume 63, September 2014
with the notion that TRB3 negatively regulates AKT acti-vation (32). In addition to augmenting activation of AKT,the dynamic expression of TRB3 was reduced in IP-deficient hepatocytes (Fig. 8C).
TRB3 expression depends on the activity of phosphatidylinositol 3 kinase (PI3K) (33) and its downstream atypicalPKC, PKC-z (32). As with other G-protein–coupled receptors,
stimulation of the IP can activate class 1B PI3K, (PI3K-g,catalytic unit p110-g), through heterotrimeric G proteinsGa and Gbg that bind to the pleckstrin homology domainin the NH2-terminal region of PI3K-g (34). Phosphoryla-tion of PKC-z was decreased in IP-deficient hepatocytes(Fig. 8D and Supplementary Fig. 13E). Reexpressionof the IP significantly elevated phosphorylation of
Figure 6—IP ablation attenuated PKA-mediated CREB phosphorylation and impaired HGP. A: Glucose production in primary hepatocytesisolated from WT and IP KO mice. Cells were incubated for 6 h with glucose production buffer supplemented with insulin. *P < 0.05 vs. WT(n = 6). B: Intracellular cAMP concentrations in primary hepatocytes exposed to glucagon (100 nmol/L) prepared from WT and IP KO mice.*P < 0.05, **P < 0.01 vs. WT; #P < 0.05 vs. control group (n = 6). C: Effect of IP deletion on phosphorylation of CREB (p-CREB) andexpression of PCK1 and G6Pase in primary hepatocytes isolated from WT and IP KO mice. Experiments were repeated three times. D:Densitometric quantitation of hepatic expression of p-CREB, PCK1, and G6Pase presented in C. *P < 0.05 vs. control; #P < 0.05 vs. WT(n = 4). E: mRNA expression levels of IP in GFP or IP expressing (OV) Ad-infected IP KO hepatocytes. **P < 0.01 (n = 3). F: Effect of IPreexpression (IP OV) on intracellular cAMP level in hepatocytes in response to glucagon (100 nmol/L) challenge. **P < 0.01 vs. GFP vector;#P < 0.05 vs. control (n = 6). G: Western blot analysis of p-CREB, PCK1, and G6Pase in primary hepatocytes infected with Ad-encodedGFP or IP (IP OV), with or without pretreatment with the PKA inhibitor H-89. H: Densitometric quantitation of hepatic expression of p-CREB,PCK1, and G6Pase as presented in G. *P < 0.05 vs. control; #P < 0.05 vs. GFP (n = 4). I: Effect of H-89 on glucose production from IPreexpressed hepatocytes. *P < 0.01 vs. GFP vector; #P < 0.05 vs. PBS control (n = 6). J: Schematic diagram of IP-mediated hepaticgluconeogenesis through the cAMP/PKA/CREB pathway.
diabetes.diabetesjournals.org Yan and Associates 2919

PKC-z (Fig. 8E and Supplementary Fig. 13F), whereasthe IP-specific antagonist CAY-10441, PI3K inhibitorLY294002, and PKC inhibitor RO32-0432 all suppressedthe induction of PKC-z phosphorylation (Fig. 8F). Similarly,differences in hepatic TRB3 expression resulting from de-ficiency or reexpression of IP were blunted by the PI3Kinhibitor LY294002 and the PKC-z inhibitor RO32-0432(Supplementary Fig. 14A and B), indicating that regulationof TRB3 by IP is mediated by the PI3K/PKC-z pathway.Knockdown of PKC-z in primary hepatocytes further con-firmed our findings described above (Supplementary Fig.
15) Silencing of TRB3 (Ad-shTRB3) suppressed IP-medi-ated HGP by ;40% (from 99 6 4.1 mg $ mg21 $ h21 to56 6 4.9 mg $ mg21 $ h21), whereas the combination ofAd-shTRB3 and the PKA inhibitor H-89 completely abol-ished HGP induced by IP reexpression in hepatocytes (Fig.8G). Likewise, we also observed the suppression of PI3K-gsignaling and decreased phosphorylation of CREB in micetreated with high doses of ASA, and these trends werereversed by activation of IP (Supplementary Fig. 16). Thesefindings implicated PI3K-g/PKC-z/TRB3/AKT signaling inIP modulation of hepatic gluconeogenesis (Fig. 8H).
Figure 7—AKT/FoxO1-mediated suppression of hepatic gluconeogenesis was enhanced in IP KO mice. A: Western blot analysis of hepaticinsulin signaling in primary hepatocytes isolated from IP KO andWT mice. B: Densitometric quantitation of hepatic phosphorylation of IRS1,AKT, FoxO1, and GSK3b compared against total expression, and hepatic expression of PCK1 and G6Pase by normalized to b-actin as seenin A. *P < 0.05, **P < 0.01 vs. PBS control; #P < 0.05 vs. WT (n = 4). C: Effect of AKT inhibitor on phosphorylation of AKT/FoxO1 andexpression of PCK1 and G6Pase in hepatocytes isolated from IP KO and WT mice. D: Densitometric quantitation of hepatic phosphor-ylation of AKT and FoxO1 compared against total expression and hepatic expression of PCK1 and G6Pase normalized to b-actin as seen inC. *P < 0.05, **P < 0.01 vs. PBS control; #P < 0.05 vs. WT (n = 4). E: Effect of AKT inhibitor IV on glucose production from WT and IP KOhepatocytes. *P < 0.05 vs. WT; #P < 0.05 vs. vehicle control (n = 6). F: Schematic diagram of IP-mediated hepatic gluconeogenesisthrough the PI3K-g/AKT/FoxO1 pathway.
2920 IP Pathway Promotes Gluconeogenesis Diabetes Volume 63, September 2014

DISCUSSION
In this study, we found that hepatic expression of COX-2,PGI2 production, and IP expression were enhanced underconditions associated with augmented hepatic gluco-neogenesis (e.g., during fasting in WT mice and in micepredisposed to diabetes due to genetic mutations or phar-macological treatment). Disruption in this pathway,specifically by deleting the IP, inhibited hepatic gluconeo-genesis and ameliorated diabetes for the latter conditions,whereas this phenotype could be rescued in large part byhepatic reexpression of the IP. These findings establish anovel connection between PGI2, a cardioprotective (35)and proinflammatory eicosanoid (27), and carbohydratemetabolism, which may at least partly explain thereported metabolic effects of NSAIDs in humans (8).
Inhibition of COX-2, the dominant source of PGI2 bio-synthesis in humans (36), has been reported to increaseinsulin sensitivity in healthy (6) and in overweight indi-viduals (7). Pharmacological inhibition and genetic abla-tion of COX-2 in mice reduces fasting glucose andprotects against STZ-induced diabetes (37). Treatmentwith high doses of ASA, which would be expected to in-hibit COX-1 and COX-2, ameliorates insulin resistance inpatients with type 2 diabetes by reducing gluconeogenesisand stimulating peripheral glucose uptake (8), likely byinhibiting I-kB kinase/nuclear factor-kB activity (26),which influences COX-2 transcription and activity. Theseobservations are consistent with the notion that COX-2–dependent products play a functionally important role inthe regulation of gluconeogenesis in humans.
Figure 8—IP/PI3K-g/PKC-z/TRB3 signaling axis was involved in hepatic gluconeogenesis. A: Western blot analysis of TRB3 in WT and IPKO hepatocytes cultured in the presence (Control) and absence (Starve) of serum. B: Effect of reexpression of IP on TRB3 expression inhepatocytes. C: Association of TRB3 expression with AKT phosphorylation in primary hepatocytes in response to insulin treatment. D:Effect of IP deletion on phosphorylation of PKC-z in primary hepatocytes from WT and IP KO mice. E: Effect of IP overexpression onphosphorylation of PKC-z in hepatocytes infected with Ad-GFP (GFP) or Ad-IP (IP OV). F: Effect of CAY-10441 (IP antagonist) onphosphorylation (p) of PKC-z. G: Effect of TRB3 short hairpin (sh) RNA and H-89 treatment on HGP of IP reexpressed hepatocytes (IPOV). The inset shows mRNA expression levels of TRB3 in hepatocytes infected with shTRB3 Ad. **P < 0.01 vs. vehicle control. *P < 0.05 vs.GFP; #P < 0.05 vs. vector control (n = 6). H: Schematic diagram of IP-mediated hepatic gluconeogenesis through PI3K-g/PKC-z/TRB3/AKTand cAMP/CREB pathways.
diabetes.diabetesjournals.org Yan and Associates 2921

We also found dysregulated expression of COX-2, PGI2biosynthesis, and IP expression in the livers of fasted, diet-induced obese, and ob/ob mice. IP deficiency depressedfasting-induced hepatic gluconeogenesis and enhancedthe hypoglycemic effect of insulin in mice, probably dueto impaired counterregulatory response (38). Moreover,deletion of IP in mice slowed the progression of diabetesinduced by STZ or the HFD. Conversely, hepatic overex-pression of IP in the liver increased gluconeogenesis, result-ing in insulin resistance. IP deletion in primary hepatocytesresulted in the diminished glucagon-mediated phosphory-lation of CREB and diminished transcription of gluconeo-genic genes, and this phenotype was rescued byreexpression of the IP in liver. These results suggest thatthe COX-2/PGI2/IP axis influences gluconeogenesis, at leastin part, by enhancing the glucagon-mediated pathway.Conversely, insulin has been shown to depress hepatic glu-coneogenesis through the IR/IRS-mediated PI3K/AKT/FoxO1 pathway (39). Indeed, IP ablation also increasedAKT/FoxO1 signaling in response to insulin in culturedhepatocytes and in livers from starved and HFD-challengedmice. IP activation also perturbs hepatic insulin signalingto regulate gluconeogenesis through modulation of AKTactivity. Class 1A PI3Ks (including PI3K-a and PI3K-b)are activated by receptor tyrosine kinase (such as IR),whereas class 1B PI3K (i.e., PI3K-g) is activated by thebinding of p110-g to the Gbg unit of the G-protein–coupledreceptor (34). Meanwhile, p110-g interacts physicallywith PKC-z (40). We did observe that the elevation ofTRB3 expression induced by activation of IP (a Gas–coupled receptor) could be abrogated by both PI3K andPKC-z inhibitors, consistent with previous studies, indi-cating that hepatic TRB3 could be regulated by PI3K andPKC-z (32,41). Moreover, we did not observe any effectsof cAMP/CREB on TRB3 expression by chromatin immu-noprecipitation assay (Supplementary Fig. 17), which isconsistent with PKA inhibitor (H89) treatment and wasunable to entirely block HGP induced by IP reexpression.Collectively, these results indicated that activation of theIP regulated hepatic gluconeogenesis via both cAMP/PKA/CREB and PI3K-g/PKC-z/TRB3/AKT pathways, and a com-bination of H89 treatment and TRB3 silencing could en-tirely restrain IP activation–induced HGP.
PGI2 displays proinflammatory (e.g., rheumatoid ar-thritis) and anti-inflammatory (e.g., atherosclerosis) prop-erties, depending on the inflamed organs and thepathological models (27). Our results indicated thatPGI2/IP may modulate the pathological process of exces-sive hepatic gluconeogenesis in diabetes. As one of theeffective drugs for the management of pulmonary arterialhypertension, synthetic PGI2-epoprostenol has beenreported to elevate serum glucose in humans and animals(42), whereas treatment with another PGI2 analog, ilo-prost, significantly reduced lactate and slightly increasedglucose in patients with critical limb ischemia (43),thereby indirectly implicating IP signaling in gluconeogen-esis. However, PGI2 in fat tissue also promotes adipose
cell differentiation (44) and de novo brown adipocytetissue recruitment in WAT (45) through another naturalnuclear receptor, PPAR-g. Interestingly, treatment withberaprost, a PGI2 analog, ameliorated complications ofdiabetes, such as nephropathy, in severely diabeticrodents by reduction of inflammation in peripheral tis-sues through upregulation of PPAR-g (46) and perhapsPPAR-d (47). Subsequent activation of PPAR-g, whichreduces a flux of free fatty acid and cytokines from adi-pose tissue to the liver, results in increased insulin sensi-tivity in diabetes (48). However, a slight increase ofhepatic PPAR-g expression was observed in IP KO mice(data not shown), suggesting that beraprost might regu-late PPAR-g directly (49) rather than through IP.
NSAIDs, particularly those specific for inhibition of COX-2, can influence carbohydrate metabolism, specifically glu-coneogenesis, in humans. Among the prostanoids, COX-2 isthe dominant contributor to biosynthesis of PGI2, and PGI2is the major product of mouse hepatocytes under physiolog-ical conditions, Here, we show that the IP for PGI2 modu-lates hepatic gluconeogenesis through both the Gas/PKA/CREB and Gbg/PI3K-g/PKC-z/TRB3/AKT pathways (Fig.8H) and that disruption of this receptor confers protectionagainst the progression of diabetes by inhibition of hepaticgluconeogenesis. These observations provide a mechanisticrationale for clinical observations suggesting a role for COX-2 inhibition in the regulation of carbohydrate metabolism.
Acknowledgments. The authors thank Dr. Shengzhong Duan (Institutefor Nutritional Sciences Shanghai Institutes for Biological Sciences, ChineseAcademy of Sciences) for technical assistance.Funding. This work was supported by grants from the Ministry of Science andTechnology of China (2012CB945100, 2011CB503906, 2011ZX09307-302-01,and 2012BAK01B00), the National Natural Science Foundation of China (NFSC81030004), NSFC-Canadian Institutes of Health Research (CIHR) joint grant(NSFC 81161120538 and CIHR-CCI117951), the Knowledge Innovation Programof the Chinese Academy of Sciences (KSCX2-EW-R-09), and the Clinical Re-search Center at the Institute for Nutritional Sciences, Shanghai Institutes forBiological Sciences (CRC2010007). Y.Y. was supported by the One Hundred TalentsProgram of the Chinese Academy of Sciences (2010OHTP10) and Pujiang TalentProgram of Shanghai Municipality (11PJ1411100). Y.Y. is a Fellow at the JiangsuCollaborative Innovation Center for Cardiovascular Disease Translational Medicine.
Duality of Interest. No potential conflicts of interest relevant to this articlewere reported.Author Contributions. S.Y., Q.Z., and Y.Y. designed the research asso-ciated with the project. S.Y., Q.Z., X.Z., J.T., Y.W., Y.Z., and J.Z. performedexperiments. J.Y., F.G., Y.L., and G.A.F. provided important reagents. S.Y.,G.A.F., and Y.Y. wrote the manuscript. Y.Y. is the guarantor of this work and,as such, had full access to all the data in the study and takes responsibility forthe integrity of the data and the accuracy of the data analysis.
References1. Cahill GF Jr. Fuel metabolism in starvation. Annu Rev Nutr 2006;26:1–222. Donath MY, Shoelson SE. Type 2 diabetes as an inflammatory disease. NatRev Immunol 2011;11:98–1073. Helmersson J, Vessby B, Larsson A, Basu S. Association of type 2 diabeteswith cyclooxygenase-mediated inflammation and oxidative stress in an elderlypopulation. Circulation 2004;109:1729–1734
2922 IP Pathway Promotes Gluconeogenesis Diabetes Volume 63, September 2014

4. Chen SS, Jenkins AJ, Majewski H. Elevated plasma prostaglandins andacetylated histone in monocytes in type 1 diabetes patients. Diabet Med 2009;26:182–1865. Hayashino Y, Hennekens CH, Kurth T. Aspirin use and risk of type 2 di-abetes in apparently healthy men. Am J Med 2009;122:374–3796. Gonzalez-Ortiz M, Martinez-Abundis E, Balcazar-Munoz BR, Robles-Cervantes JA. Inhibition of cyclooxygenase-1 or -2 on insulin sensitivity in healthysubjects. Horm Metab Res 2001;33:250–2537. González-Ortiz M, Pascoe-González S, Esperanzamartínez-Abundis, Kam-Ramos AM, Hernández-Salazar E. Effect of celecoxib, a cyclooxygenase-2-specificinhibitor, on insulin sensitivity, C-reactive protein, homocysteine, and metabolicprofile in overweight or obese subjects. Metab Syndr Relat Disord 2005;3:95–1018. Hundal RS, Petersen KF, Mayerson AB, et al. Mechanism by which high-dose aspirin improves glucose metabolism in type 2 diabetes. J Clin Invest 2002;109:1321–13269. Yapaçi E, Uysal O, Demirbilek H, Olgar S, Naçar N, Ozen H. Hypoglycaemiaand hypothermia due to nimesulide overdose. Arch Dis Child 2001;85:51010. Sone H, Takahashi A, Yamada N. Ibuprofen-related hypoglycemia in a pa-tient receiving sulfonylurea. Ann Intern Med 2001;134:34411. Cao Z, Mulvihill MM, Mukhopadhyay P, et al. Monoacylglycerol lipasecontrols endocannabinoid and eicosanoid signaling and hepatic injury in mice.Gastroenterology 2013;144:808–817.e81512. Henkel J, Gartner D, Dorn C, et al. Oncostatin M produced in Kupffer cells inresponse to PGE2: possible contributor to hepatic insulin resistance and stea-tosis. Lab Invest 2011;91:1107–111713. Kuiper J, Zijlstra FJ, Kamps JA, Van Berkel TJ. Cellular communicationinside the liver. Binding, conversion and metabolic effect of prostaglandin D2 onparenchymal liver cells. Biochem J 1989;262:195–20114. Levine RA, Schwartzel EH Jr. Prostaglandin E(2) inhibition of glucagon-induced hepatic gluconeogenesis and cyclic adenosine 39,59-monophosphateaccumulation. Biochem Pharmacol 1980;29:681–68415. Marguet D, Baggio L, Kobayashi T, et al. Enhanced insulin secretion andimproved glucose tolerance in mice lacking CD26. Proc Natl Acad Sci U S A2000;97:6874–687916. Mao T, Shao M, Qiu Y, et al. PKA phosphorylation couples hepatic inositol-requiring enzyme 1alpha to glucagon signaling in glucose metabolism. Proc NatlAcad Sci U S A 2011;108:15852–1585717. Millward CA, Desantis D, Hsieh CW, et al. Phosphoenolpyruvate carboxy-kinase (Pck1) helps regulate the triglyceride/fatty acid cycle and development ofinsulin resistance in mice. J Lipid Res 2010;51:1452–146318. Sun Z, Miller RA, Patel RT, et al. Hepatic Hdac3 promotes gluconeogenesisby repressing lipid synthesis and sequestration. Nat Med 2012;18:934–94219. Zhang EE, Liu Y, Dentin R, et al. Cryptochrome mediates circadian regulationof cAMP signaling and hepatic gluconeogenesis. Nat Med 2010;16:1152–115620. Froh M, Konno A, Thurman RG. Isolation of liver Kupffer cells. Curr ProtocToxicol 2003;Chapter 14:Unit 14.1421. Smedsrød B, Pertoft H. Preparation of pure hepatocytes and re-ticuloendothelial cells in high yield from a single rat liver by means of Percollcentrifugation and selective adherence. J Leukoc Biol 1985;38:213–23022. Zhang J, Zou F, Tang J, et al. CCyclooxygenase-2-derived prostaglandin E2promotes injury-induced vascular neointimal hyperplasia through the E-prostanoid3 receptor. Circ Res 2013;113:104–11423. Rajas F, Croset M, Zitoun C, Montano S, Mithieux G. Induction of PEPCK geneexpression in insulinopenia in rat small intestine. Diabetes 2000;49:1165–116824. Yin D, Tao J, Lee DD, et al. Recovery of islet beta-cell function instreptozotocin- induced diabetic mice: an indirect role for the spleen. Diabetes2006;55:3256–326325. Hui Y, Ricciotti E, Crichton I, et al. Targeted deletions of cyclooxygenase-2and atherogenesis in mice. Circulation 2010;121:2654–266026. Yuan M, Konstantopoulos N, Lee J, et al. Reversal of obesity- and diet-induced insulin resistance with salicylates or targeted disruption of Ikkbeta.Science 2001;293:1673–1677
27. Stitham J, Midgett C, Martin KA, Hwa J. Prostacyclin: an inflammatoryparadox. Front Pharmacol 2011;2:2428. Matsumoto M, Pocai A, Rossetti L, Depinho RA, Accili D. Impaired regulationof hepatic glucose production in mice lacking the forkhead transcription factorFoxo1 in liver. Cell Metab 2007;6:208–21629. Vivanco I, Sawyers CL. The phosphatidylinositol 3-kinase AKT pathway inhuman cancer. Nat Rev Cancer 2002;2:489–50130. Maira SM, Galetic I, Brazil DP, et al. Carboxyl-terminal modulator protein(CTMP), a negative regulator of PKB/Akt and v-Akt at the plasma membrane.Science 2001;294:374–38031. Du K, Herzig S, Kulkarni RN, Montminy M. TRB3: a tribbles homolog thatinhibits Akt/PKB activation by insulin in liver. Science 2003;300:1574–157732. Ding J, Kato S, Du K. PI3K activates negative and positive signals to reg-ulate TRB3 expression in hepatic cells. Exp Cell Res 2008;314:1566–157433. Schwarzer R, Dames S, Tondera D, Klippel A, Kaufmann J. TRB3 is a PI 3-kinase dependent indicator for nutrient starvation. Cell Signal 2006;18:899–90934. Stephens LR, Eguinoa A, Erdjument-Bromage H, et al. The G beta gammasensitivity of a PI3K is dependent upon a tightly associated adaptor, p101. Cell1997;89:105–11435. Grosser T, Yu Y, Fitzgerald GA. Emotion recollected in tranquility: lessonslearned from the COX-2 saga. Annu Rev Med 2010;61:17–3336. McAdam BF, Catella-Lawson F, Mardini IA, Kapoor S, Lawson JA, FitzGeraldGA. Systemic biosynthesis of prostacyclin by cyclooxygenase (COX)-2: the humanpharmacology of a selective inhibitor of COX-2. Proc Natl Acad Sci U S A 1999;96:272–27737. Tabatabaie T, Waldon AM, Jacob JM, Floyd RA, Kotake Y. COX-2 inhibitionprevents insulin-dependent diabetes in low-dose streptozotocin-treated mice.Biochem Biophys Res Commun 2000;273:699–70438. Ramnanan CJ, Edgerton DS, Kraft G, Cherrington AD. Physiologic action ofglucagon on liver glucose metabolism. Diabetes Obes Metab 2011;13(Suppl. 1):118–12539. Oh KJ, Han HS, Kim MJ, Koo SH. Transcriptional regulators of hepaticgluconeogenesis. Arch Pharm Res 2013;36:189–20040. Frey RS, Gao X, Javaid K, Siddiqui SS, Rahman A, Malik AB. Phosphati-dylinositol 3-kinase gamma signaling through protein kinase Czeta inducesNADPH oxidase-mediated oxidant generation and NF-kappaB activation in en-dothelial cells. J Biol Chem 2006;281:16128–1613841. Matsumoto M, Han S, Kitamura T, Accili D. Dual role of transcription factorFoxO1 in controlling hepatic insulin sensitivity and lipid metabolism. J Clin Invest2006;116:2464–247242. Product Monograph. PrFLOLAN� for Injection. Available from http://www.gsk.ca/english/docs-pdf/product-monographs/Flolan.pdf. Accessed 20 February 201443. Danielsson P, Metzsch C, Norgren L. Effect of iloprost infusion on metab-olism in critical limb ischemia, utilizing microdialysis. A pilot study. Int Angiol2004;23:259–26244. Négrel R. Prostacyclin as a critical prostanoid in adipogenesis. Prosta-glandins Leukot Essent Fatty Acids 1999;60:383–38645. Vegiopoulos A, Müller-Decker K, Strzoda D, et al. Cyclooxygenase-2 con-trols energy homeostasis in mice by de novo recruitment of brown adipocytes.Science 2010;328:1158–116146. Inoue E, Ichiki T, Takeda K, et al. Beraprost sodium, a stable prostacyclinanalogue, improves insulin resistance in high-fat diet-induced obese mice.J Endocrinol 2012;213:285–29147. Sugawara A, Kudo M, Saito A, Matsuda K, Uruno A, Ito S. Novel effects ofberaprost sodium on vasculatures. Int Angiol 2010;29:28–3248. Phielix E, Szendroedi J, Roden M. The role of metformin and thiazolidine-diones in the regulation of hepatic glucose metabolism and its clinical impact.Trends Pharmacol Sci 2011;32:607–61649. Sue YM, Chung CP, Lin H, et al. PPARdelta-mediated p21/p27 induction viaincreased CREB-binding protein nuclear translocation in beraprost-induced an-tiproliferation of murine aortic smooth muscle cells. Am J Physiol Cell Physiol2009;297:C321–C329
diabetes.diabetesjournals.org Yan and Associates 2923