i-light factor in corn production - connecting repositories · the letter c is a constant of...
TRANSCRIPT

Research Bulletin 1067 September 1990
University of Missouri-Columbia College of Agriculture
Agricultural Experiment Station Roger L. Mitchell, Director
I-Light as a
Factor in Corn Production
C.M. Woodruff Professor Emeritus
:1:.

PRODUCTION OF CORN AS A FUNCTION OF LIGHT from,
the ear weight function , g = a + bA - cA2. In this form g = ear weight in pounds and A = area in square feet.
PARAMETERS OF THE FUNCTION.
~ b 1. A i, the area of interference, d A = ° , b - 2cAi = 0, Ai = 2 c .
2. G, the weight of a full sized ear of corn at area Ai, G = a + bAj-cAj2
·3. A 0, the area extropolated to g = 0. As a quadratic,
-b±-Vb 2 -4ac ° =-cAo2 + bAa + a , and Ao 2a
or Ao = Ai - ~ ~ . 4. E, the maximum efficiency when A = Ao for which E = ddl '
o
giving E = b -2cAo. OrE= A.-A . 1 0
2G
5. Y, the ear weight per square foot of area from Y = ~ , and
a + bA- cA2 .a.. YAY = A + b- cA.
dY dY =..a. 6. Y m, the maximum yield occurs when dA = 0; dA = A2- c.
~~2 - c = 0, Am = ~-ca. (Note: the value of a is-.).
a = + b - cAm. Am
7. gm, the ear weight at Am, gm = YmAm.
establishing the biological significance of the coefficients of a second degree polynomial as a production function relating yield of corn to the population of plants on a field of corn.

LIGHT AS A FACTOR IN CORN PRODUCTION.
The primary function of agriculture is collecting solar energy in a useful form by green leaves on plants. Any deficit in the various requirements of a corn plant is reflected in a departure in size of ear from the genetic potential of a fully developed ear. To the extent that all requirements except one are optimized within the limits of the environment in which the plant exists while filling the ear, then for this one the size of ear produced will be some function of the component that is variable.
Sizes of corn ears reflect amounts of light as determined by the numbers of plants producing them. The addition of an increment of light by increasing the area occupied by a plant provides light to a mixture of lighted and shaded leaves. That illuminating shaded leaves generates grain . That striking illuminated leaves generates heat that vaporizes water of the transporation stream. The weight of grain produced by added light is equal to the product of the efficiency of light impinging upon a shaded leaf and the fraction of the addition that reaches shaded leaves.
Each acre in a field of corn receives one acre of sunlight. Light is allotted to individual plants according to the numbers of plants sharing that suply of light. Plants share light in the form of a
rectangle thirty inches long and six to eighteen inches wide for corn rows spaced thirty inches apart. Within the environment surrounding an individual corn plant, optimized in so far as possible by soil, water and mineral nutrition, the weight of ear produced is a function of the area of light provided the plant.
Corn plants grow in stature from emergence of the seedling to antheses. From thence to physiological maturity, the time is spent in filling the kernals on an ear. The ear, a product of its genetic mak-up, contains a number of paired rows of kernels, each reflecting an average size and number per row according to the supply of light provided the plant up to complete filling of the ear. The object here is to develope the production function that accounts for the weight of
ear produced with respect to the area of light provided each plant.
2

PARAMETERS OF THE PRODUCTION FUNCTION.
Developing a production function requires identifying the parameters that establish the limits within which the system operates. After identification they must be assembled into an operating system. The problem is analgous to that of a factory that assembles engines for an automobile. The parts of the engine are its parameters that arrive as a kit to be assembled into a functional mechanism. The funciional mechanism may be presented as a blue print of a diagram showing each part in relation to all others. Once assembled the engine must be tested to determine if it functions according to plan. Think of the corn plant filling kernels on an ear as a biophysical system that operates as do mechanical systems each part contributing its share to the final product Parameters for the production function for corn are:
G, - The weight of a completely filled ear of corn as engineered by the plant breeder. This weight, an average of a large number of ears, becomes greater as the purity of the seed approaches the ideal of the variety it represents. G is a parameter because when the ear is full the operation is complete.
A i-The area of interference between plants competing for light at which a full sized ear is produced and below which the weight of an ear is less than G. Ai.the amount of light that fills an ear...
A 0- The area of extinction at which no light is available to grain producing leaves . This area corresponds to the initiation of grain production by the first increment of added light falling upon shaded lerves.
Am -The area where weight of ear corn per square foot of area is a maximum. This area exists by virtue of the equilibrium between declining ear size and increasing ear numbers. It involves the number of plants per acre for which yield of grain is a maximum.
E - The efficiency of added light illuminating shaded leaves that produce grain. The units are pounds of ear weight produced per square foot of illuminated leaf surface.
3

The values of the various parameters operate within a major parameter that represents the environment of the corn plant over the 50 to 55 day period that the plant functions in filling an ear. During this period lengths of night and day vary, temperatures vary, cloud cover changes, the angle of the sun swings through an arc in the aky, pulses of light strike leaves as they rustle in the breeze and leaves in subdued lighting function as mixtures of shaded and lighted leaves. The panaroma of environmental contributions are integrated into one expression for each location and each season of cropping.
Few if any of the parameters of production are subject to direct measurement. In most instances the values are determined from yields of corn at various populations of plants. Accepting yields of corn per acre as representing 70 pounds of corn per bushel and populations as plants per acre provides a measure of g as pounds per ear and of A as square feet of light per plant. Populations producing ear weights in the range of 0.5 to 1.0 pounds each represent viable ears from viable plants. The ear weight - plant area relationship when used in a suitable production function extrapolates to provide values for the parameters that anchor the two limits between which the production function operates.
ASSEMBLING PARAMETERS INTO A PRODUCTION FUNCTION THROUGH THE USE OF OPERATORS
Parameters function in a system only as they are governed by
operators. Commonly occuring operators include the following::+, -,
x, +, =, dg, dA, C. The letter C is a constant of intigration requiring evaluation from known vaues in the limits. Add to these exponents and roots along with a small c representing a package of the functional parameters. The assembly of the parameters with their
.£.&. A·- A operators is the derivative: dA = E A/ _ Ao . __ n_nn_nnn( 1 ).
The increment of ear weight dg produced by an increment of light dA is equal to the product of the efficiency E and the fraction of dA that is operational at area A. Upon integration, equation ( 1 ) yields:
_ E 2 g - - 2(Ai- A o) (Ai-A) + C. When A = Ai, g = G.
Hence C = G giving g = G E 2 - 2(Aj_ Ao) (Aj- A) - - --------- (2)
4

E Replacing 2(AI Ao)
with c and squaring (Ai- A)2 yields,
g = (G - cAi2) + providing g = a
a biophysical +
(2cA j ) A cA2. -------------( 3 ) meaning for the coefficients of,
bA - cA2 -------------- (4) . E
namely, a = (G - cAi2) b -== 2cAi; and c = 2(Ai- Ao) .
Evidence presented later supports the validity of equation (3) and therefore of equation (4). The procedure for deriving the parameters of the production function utilizes both these equations
MEASURING THE PARAMETERS OF PRODUCTION.
Data from the research center at Spickard, Missouri yielded:, g = -0.229 + 0.376A - 0.0326A2 this for corn in 40 inch rows .Extracting the values for the production parameters utilizing equations (3) and (4): :yields:
Ai -The second degree polynomial is a parabola with the vertex at Ai ' Beyond Ai the function is not operative. Multiple eared plants and plants with tillers reflect the accumulation of synthate in excess of that required to fill an ear Setting the first derivative
equal to zero and solving yields Ai = ~c. Applied to the data from
Spickard, Mo. Ai = 0.376/2(0.0326) = 5.77 square feet per plant or 7500 plants per acre.
G.- Solving equation (4) for the value of G when A = 5.77, G = - 0.229 + 0.376(5.77)- 0.0326(5.772) or 0.855 lbs./ear.
A 0 -Solving for the value of A at which the weight of the ear is zero involves converting the form of the polynomial to that of a quadratic and solving for A when g = O. Although this is a straight forward solution, a more useful approach involves setting g = 0 when A::::: Ao and solving equation (2) for E which gives
E ::::: 2G R I' E' E 'th 2G . ld Ai-Ao' epacmg In c = 2(Ai- Ao) WI Ai-Ao Yle s,
c ::::: G 2' From this Ai - Ao ::::: ~ G.. and Ao::::: Ai _ ~ G.. . (Ai -Ao) C C
Utilizing the values for Ai' G, and c of data from Spickard, Mo, gives Ao ::::: 5.77 - '/0.855/0.0326 ::::: 0.65 square feet per plant. With the value for Ao established, that for E may be determined.
E, - From E ::::: 2G/ (Ai - Ao)' 2(0.0855/(5.77 - 0.65) ::::: 0.334 lbs. of ear weight per square foot of illuminated leaf surface.
5

Am - The area per plant for which yield is a maximum occurs where increasing numbers is offset by decreasing sizes of ears. Equation (4) expresses weight of ear as a function of area per plant. Dividing weight of ear by the area required to produce it expresses yield as weight of ear per square foot of light provided. Yield g/A = (a + bA - cA2) / A. The value of A at which yield is a
maxium occurs at Am for which the first derivative of the yield
f .. .s!.Y. _..L d h A - A .J!1L unctlOn IS zero. dA - - A2 - c an w en - m 'dAm = O.
a 2 -a ---2 = c; Am =-Z-
Am but the value of a is negative. Hence,
_ I-a Am = -'J ~.
Using the data from Spickard, Mo. for which a = - 0.229 and
c = 0.0326, Am = ~ 7.025 = 2.65 square feet per plant. This translates to a population of 16,438 plants per acre. The
weight of ear gm at Am = 0.538 pounds. Y m' the yield in bushels per acre = 0.538 (16.438)170 giving 126 bu/ac Figurel.
CORN YIELD AS A FUNCTION OF LIGHT AS EVALUATED WITH EIGHT YEARS OF DATA FROM FOUR LOCATIONS
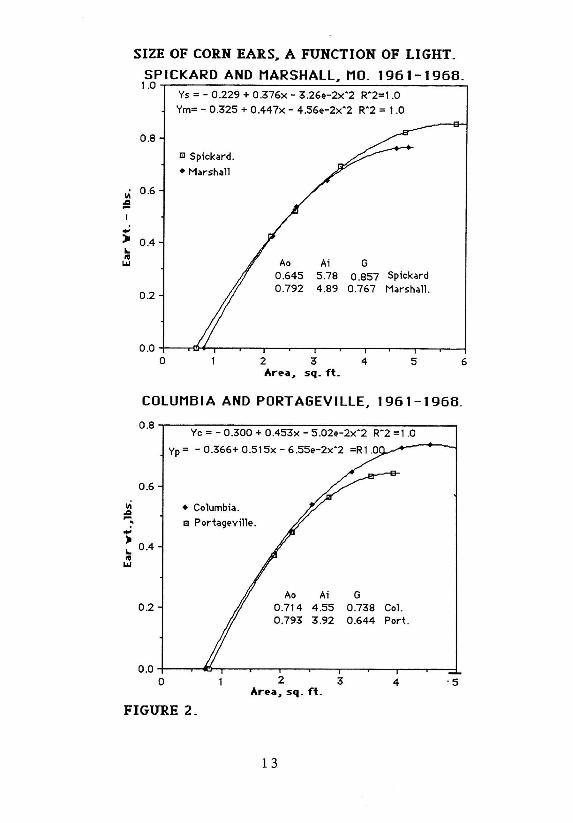
Kroth and Doll conducted an investigation of corn yields with respect to nitrogen and plant populations at Spickard, Marshall, Columbia and Portageville, Missouri through 1961 to 1968 The variables included seven amounts of nitrogen and four populations of plants each with three replications. The data used here was for nitrogen at 150 pounds per acre and 9 13, 17 ad 19 thousand plants per acre. Four years of drought, 1961, '62, '63, and '67 at Marshall, two years 1962 and '63 at Columbia, and failure to plant one year at Portageville, 1968 were excluded from analyses.
The total numbers of plants per acre at each population each season were added. The total yields of corn at each population each season were added, multiplied by 70 pounds per bushel and divided by the number of plants producing them to give the average weight of ear per plant. The total number of plants per acre for the duration of the investigation were divided into the area represented by the number of acre-years involved to obtain the average area in square feet per plant at each population. Ear weights were regressed against areas per plant for each of the four populations at each of the four locations. From the second degree polynomials values were
6

obtained for Ao at g = 0 and Ai at g = G. The values were included in the graphs of the production functions, figure 2. The paremter E, the derived parameters Am, g m, and Y m and the plant populations associated with Y m for each of the locations, are given in Table 1.
Table - 1. Efficiency E, areas per plant and ear weights producing maximum yields with plant populations and yields of corn at four locations in Missouri from 1961 to 1968.
Location Efficiency-E 2 lbs./ ft .
Am
ft2./ plant
gm
lbs./ear
Population
plants/ac.
Ym
bu./ac.
-----------------------------------------Spickard 0.34 2.65 0.54 16,400 Marshall 0.37 2.67 0.54 16,300 Columbia 0.39 2.44 0.51 17,900 PortageviIIe 0.41 2.36 0.49 18,500
Yields and Corresponding Ear Weights of Corn at Various Plant Populations.
126 127 129 128
The production functions derived for the data of figure 2 were converted to yields and ear weights over an extended range of plant populations, figure 3. The maximum yields were essentialy the same at all locations. There was a small decrease in size of ear from north to south compensated for by an increase in plant populations. Of special significance was the agreement of ear weight data at maximum yield with that of an earlier era at half pound ears. Both findings reflect corn prosduction practices when rows were spaced 40 to 42 inches apart Also for these early practices maximum yield were associated with plant populations of 15 to 20 thousand plants per acre.
Modern technology with schedule guided irrigations, single cross hybrid varieties, fertilization guided by soil tests and row spaces of thirty inches has set new standards of performance for corn. Results of more recent developments will be analyzed .
7

CORN PRODUCTION PRACTICES INVESTIGATED ON THE EXPERIMENT STATION FIELDS AT COLUMBIA, McCREDIE, WELDON SPRING AND MT. VERNON, MISSOURI.
Beyond schedule guided irrigations, fertilizer amounts and kinds and hybrid variety tests, both planting patterns and row spacings were investigated. Results for both triangular and square planting patterns suggested that extrapolated values of ear sizes approached zero as areas per plant approached zero. The same occured when row spacings exceeded the normal lengths of corn leaves, specifically at sixty and eighty inch row spacings . Plants receiving side lighting produced ears containing grain even when crowding each other in the row
Thirty inch row spacings approximate the lengths of corn leaves as they extend between the rows. Stacked up both sides of a corn stalk leaves on corn plants two inches apart in the row effectively extinguish light to grain producing leaves. Ear sizes extrapolate to zero at 0.4 square feet per plant for plant spacing of 2 inches in thirty inch rows . The top lighted leaves do little more than meet the metabolic requirements of the plant.
Determinations of the production function g = f(A) were attempted with three plant populations, 7.5, 15 and 30 thousand plants per acre. Irregularities in tillering and shoot development at 7500 plants per acre failed to provide reliable measures of the weights of ears produced with adequate lighting. A more satisfactory evaluation was through use of a value of 0.4 square feet for Ao along with 1,45 and 2.9 square feet per plant for 30 and 15 thousand plants adjusted for numbers existing at harvest time .. Results for the better yielding hybrids at Columbia, Weldon Spring and also at Mt. Vernon are presented in figure, 4.
Ear weight distributions including zero weights for ears from barren stalks provided superior estimates of ear size with respect to the area per plant. These values extrapolated to area Ai for estimates of the maximum ear weight G were more reliable than the results obtained for average ear weights from 7500 plants per acre. The degree of uniformity in size of ears is a characteristic of the purity of a hybrid grown from commercial seed. Both the quality of the hybrid varieties of corn plants and the technology of growing corn have achieved a remarkable degree of perfection today.
8

DEVELOPING A PRODUCTION FUNCTION FROM A SINGLE OBSERVATION
Data relating yields of com to populations of plants are not too plentifuC But forty years of trial and error methods have brought corn production to a high degree of perfection. Of 77 different hybrid varieties tested in 1989 by the Agricultural Experiment Station on the local resaearch center at Columbia, Mo. , all yielded between 200 and 268 bushels per acre The 268 bushels per acre with 27,500 plants per acre represents an ideal combination of production practices and environmental conditions for growing corn . Accepting this yield and population of plants as representing A man d gm for corn grown in 30 inch rows, the object is to derive the various parameters of the production function that account for the yield that was achieved.
The first parameter A 0 involves the proximity of plants in 30 inch rows. For leaves approximating 30 inches in length extending accross 30 inch rows, lighting from the side of the row is effeectively eliminated. Leaves 2 inches wide stacked up both sides of a corn stalk extinguish light penetrating to grain producing leaves. An average leaf width of 2 inches over a 30 inch row width shades 60 square inches or 0.42 square feet as an estimated value for the parameter A o.
The 27 ,500 plants per acre establishes the value for A m at 1.58 square feet per plant.
The yield of 268 bushels at 70 pounds of ear corn per bushel equals 18,760 pounds from 27,500 plants for an average ear weight gm = 0.68 pounds.
The 18,700 pounds of corn per acre represents a yield Y m 0 f 0.43 pounds of corn per square foot of soil.
The complete spectrum of the production function is portrayed by the three coefficients of equation (4). Imbedded in these are the parameters of equation (2). The object here is to establish values for the parameters A 0, Ai, G and E from values for Am, g m and Y m for corn in 30 inch rows thereby arriving at values for the three coefficients of equation (4) .
A o. - This value has been established at 0.42 square feet per plant for corn grown in 30 inch rows .
9

A i.- Replacing 2(A 1- A 0)
E with c then dividing by A
converts equation (2) from an ear weight g to a yield Y in pounds of ear corn per square foot of area occupied by the plant, namely
G-c(AI-A)2 Y = A Setting the derivative equal to zero for which
dYm A = Am and Y = Ym gives dAm
G Aj2 = ---2 + c --2
Am Am c = o.
Upon simplifying, A i2 = Am 2 + G/e. Under Ao it was shown that
e = G Replacing c with this quantity yields (Ai-Ao)
G = (A.'-Ao)2 from which A.2 _ A 2 + (A· - A )2 c .- m I O.
( A i-A 0) 2 = Ai 2 - 2 A i A 0
Ai2 = Am 2 + Ai2 - 2AiAo + A02. After + A 0 2 yielding canceling A i2 and ,
solving for Ai'
Ao ).
Determination of the values of band e in equation (4) ..
The first derivative of equation (4) equals zero when A = Ai, namely, b - 2cAi = 0 giving b = 2eAi .
The first derivative of equation (4) equals when A = Am,
gm namely, b - 2eArn = Am' giving b = KID-
2eAm + Am"
The two values for b are equal, hence 2eAi = 2eAm + K..!!L Am
gm/Am from which e = 2 ( A i-A m )
An explanation of the fraction Am.. Am
Any straight line through the origin relating weight alloted the plant that produced it is a yield line. steepest line passing through the origin and
production function is a maximum yield line
of ear to the area The slope of the tangent to the
gm Y m =--
Am With both A i and e evaluated, then b = 2eAi.
10

Values of the parameters G and E, By equation 2, g = 0 when A = Ao giving G = c(Aj - Ao)2 Also
2G E = A . A at A = Ao ,
1- 0
Value of the coefficient a of equation (4). Values for the parameters of equation (2) and for the coefficients
band c of equation (4) have been established with respect to a maximum yield Y m. The most direct solution for arriving at a value for the remaining coefficient a is to use its representation in equation (3) namely, a = G- cAj2.
Numerical Values of Parameters and Coefficients Derived for an Estimated Maximum Yield of 268 Bushels from 27,500 Plants per Acre at Columbia, Missouri in 1989.
43500 Am = 275 0 0 = 1.584 square feet per plant.
268(70) g m = 27500 = 0.682 pounds per ear ..
0.682 £m... Ym = Am = 1.584 = 0.431 pounds per square foot ..
2(30) 1 4 4 = 0.42 square feet per plant. Ao =
Ai = ! (A m 2 A) _ .!. ( 1 .5842 + 0.42) = 3.22 ft2/ plant. 2 Ao + 0 - 2 0.42
Ym 0.431 2 ( A j - Am) = 2 ( 3 . 22 - 1. 5 84) = 0.132. c =
b = 2cAi = 2(0.132)3.22 = 0.850. G = c(Aj -A 0)2 = 0.132(3.22 - 0.42)2 = 1.04 pounds/ear.
2G 2(1.04) (Aj-Ao) = 3.22 - 0.42 = G - cAi2 = 1.04 - 0.132(3.22)2
g = -0.329 + 0.850A ...... 0.132A2.
E = a =
0.743 pounds per ft. 2 .
= -0.329.
The parameters and coefficients of the production function generated by the yield of 268 bushels per acre represent an expression of the seasonal environment, the hybrid variety and the production technology brought togethewr in the 1989 corn growing season. It is the culmination of advancements in the past half century that have brought corn yields on the experiment station field from the 30 to 40 bushel category that formerly was accepted as normal. Figure 5.
1 1

PERFORMANCE OF CORN AT SPICKARD, MO. AS A FUNCTION OF AREA PER PLANT. 1961-'68.
1.50
1.25
1.00
0.75 III "0 c ::l 0 .50 0 9-Cl
0.25
0 .00 III g-pounds
-0.25
-0.50 0 Ao 1
-- Tan-E __ Tan-Y
2 Am 3 A-square feet
g = (G-cAj2) + (2CAj)A -CA2_ g = a + bA - cA2 .
g == -0.229 + 0.376A - 0.0326A2.
4 5 Ai 6
Aj = * = 0; 0.376 - 2(0.0326)Aj = 0. ; Aj = 5.77 ft2·/plant.
G = -0.229 + 0.376Aj - 0.0326Aj2 = 0.855 lbs./ear.
_/G _10.855 ' Ao = Aj - -\j ~; = 5.77 --\j 0.0326 = 0.65 ft.2/plant.
_ I-a _ I 0.229 Am = -\j ~ = -\j 0 .0326 = 2.65 ft.2/plant.
E = 2G = 2(0.855) 2 Aj- Ao 5.77 _ 0.65 = 0.334. lbs./ ft. at Ao·
FIGURE 1.
12
vi :S
.; )0 L ow
1.1.1
11\
SIZE OF CORN EARS6 A FUNCTION OF LIGHT_
SP I CKARD AND MARSHAll, MO_ 1961-1968_ 1.0,..------------'-------------,
0 .8
0 .6
0.4
0 .2
Ys = - 0 .229 + 0 .376x - 3.26~-2xA2 RA2=1 .0
Ym= - 0.325 + 0.447x - 4.56~-2xA2 RA2 = 1.0
l:l Spickard .
• Marshall
Ao 0 .645 0 .792
Ai 5 .78 4 .89
G 0 .857 Spickard
0 .767 Marshal1.
O .O+--~~-~_.-~-._~-_.-r--.-~~
o 2 3 4 5 6 Are-a, sq_ ft _
COlUMBI A AND PORT AGEV IllE, 1961 -1968.
0 .8,..--------------------~ Yc = - 0.300 + 0.453x - 5 .02e-2xA2 RA2 =1 .0
Yp= -0.366+0 .515x-6.55e-2xA2 =Rl.0
0 .6
:S. • Columbia .
l:l Portageville . .. ) L 0.4 ow
1.1.1
0.2 Ao Ai G
0 .714 4.55 0.738 Col. 0 .793 3.92 0 .644 Port .
O.O+--~~._-r--r-~-~-~--.-~-=l
o 2 3 4 · 5 Are-a, sq _ ft _
FIGURE 2 _
13

~ 10. I.) IV
10.
" Q,
1/1 -" &. 1/1 ::I
CO
iii ."
= ::I 0 Q, , ....
&. !:II .~
) 10. IV
LI.l
CORN YIELD AS A FUNCTION OF PLANT POPULATIONS, 1961 - 1968.
130~----------------~--------------------~
~ 127.5
120
110
100
90
--e-- SPICKARD.
MARSHALL
• COLUMBIA
-<>-- PORT AGEV ILLE I
17 ,217 80+---~----.---~--L-.---~ __ --.-----~--~
o 10 20 30 Plants per acre, thousands . .
EAR WEIGHTS vs POPULATIONS, 1961 -1 968. 1.0,---------------------------------------,
--e-- SPICKARD . 0 .8
MARSHALL .
• COLUMBIA .
PORT AGEVILLE .
0 .6
.518
0.4
17,217
0 .2 +-----...----~----r-..JtL-____, __ --_r_--__r----_.__--__1
40
o 10 20 30 40 Plants per acre, thousands.
FIGURE 3.
14

iii oCI -.: )I
... .. ~
iii !
..; )I ... .. ....
Bo. Jack AND HOLDEN HYBRIDS AT WElDONSPRING . 1969
1.0~------------------~------------------,
0 .8
III Bo Jack , X7L.
• Holden, 033 . 0 .6
0.4
0 .2
Ao Ai G bu./ac . 0.40 3.39 0 .81 201 B. J . 0.40 3 .02 0 .76 209 HoI.
O .O+---~----~--~----.----r----.---~--~
o 2 Area. SQ. ft.
3 4
PIONEER 3306 HYBRID AT COLUMBIA AND Mt. VERNON. MISSOURI. 1971.
1.0~--------------~~------~----------~
0.8
III
• 0.6
0.4
0 .2
COLUMBIA.
Mt. VERNON .
Ao Ai G bu.lac .
0 .40 3 .20 0 .84 220 COL.
0 .40 3 .27 0 .87 223 Mt . V.
O .O+---~----~--~----~---r----r---~--~
o 2 Area. aq . ft.
3 4
FIGURE 4.
15
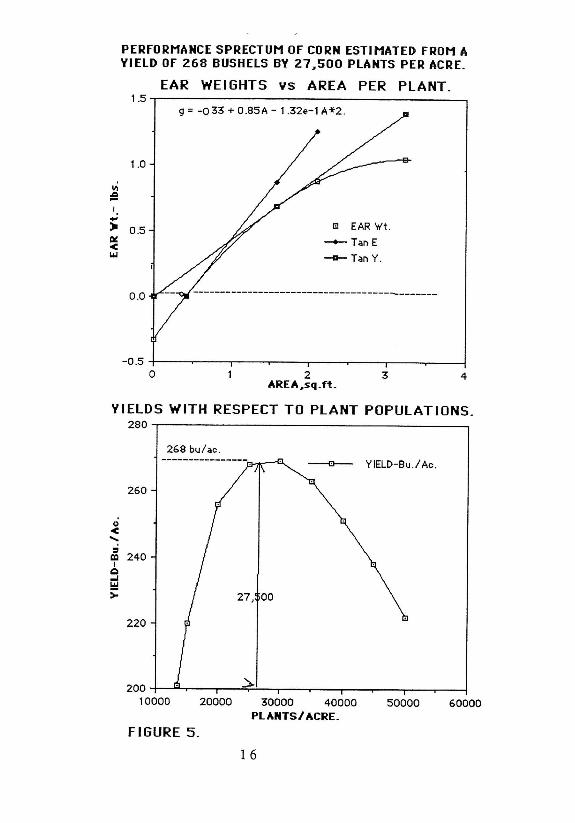
PERfORMANCE SPRECTUM OF CORN ESTIMATED FROM A YiElD OF 268 BUSHELS BV 27,500 PLANTS PER ACRE.
iii ;e
.; )I
~ < ~
EAR WEIGHTS YS AREA PER PLANT. 1 .5~------------------------------------~
1.0
0 .5
0 .0
9 = -033 + 0 .85A - 1.32e-l A*2 .
l::l EAR 'w't .
-- TanE
-- Tan Y.
-0 .5 +-----.-----...-----.----,..-----,------,-----.-----1 o 2
AREA,sq.ft. 3 4
YIELDS WITH RESPECT TO PLANT POPULATIONS. 280
268 bu/ac . -a--- YIELD-Bu./Ac .
260
<.i < ..... :i
CQ 240 I
Q ... !:!:! > 27 , 00
220
200~~-.---.-~~~--r_--~--r_-,~-,.__---r--~ 1 0000 20000 30000 40000 50000 60000
PL ANTS I ACRE.
FIGURE 5.
16

REFERENCES.
1. Gaddy, H.J. 1069, Corn Grain Yield as a Function of Plant Areas. M S Thesis, University of Missouri - Columbia.
2. Kroth, E.M. and Doll, J.P. Response of Corn Yields to Nitrogen Fertilization and Plant Populations in Missouri. Agricultural Experiment Station, University of Missouri - Columbia.
1962, Special Report - 13. 1963, Special Report - 27. Kroth, E.M. and Collier, Dale.- continued-1964, Special Report - 36. 1965, Special Report - 47. 1966, Special Report - 67 . 1967, Special Report - 76. 1968, Special Report - 91. 1969, Special Report -107.
3. Minor, H.C. Morris, e.G. Mason, H.L. Kneer, D.R. and Lawman, E.E. 1989 - CORN, Missouri Crop Performance Special Report 404, Agricultural Experiment Station, University of Missouri, Columbia.
4. Samonte, H.P. 1970. Functional Relation of Yield to Plant Populations and Planting Patterns for Maize. Ph. D. Disertation, University of Missouri - Columbia.
5. Woodruff, C.M. 1968. Performance Parameters of Corn. Twenty Third Annual Corn and Sorghum Conference. American Seed Trade Association, Publication 23 .
1 7

an equaJ oppor1llnlty I".dwllon