i hereby declare that, except where specifically indicated ... yr projects 2009... · 3.1.5 piles...
TRANSCRIPT
Ryan McCarron Trinity Hall
1
Building Response due to
Excavation-Induced Displacements
By
Ryan McCarron (TH)
Fourth-year undergraduate project
in Group D, 2008/2009
I hereby declare that, except where specifically indicated, the work submitted
herein is my own original work.
Date: Signature:

Ryan McCarron Trinity Hall
2
Table of Contents 1 Introduction ........................................................................................................ 5
1.1 Background .................................................................................................. 5
1.2 Research Aims and Scope ............................................................................ 5
1.3 Layout of report............................................................................................ 6
2 Literature Review .............................................................................................. 7
2.1 Introduction .................................................................................................. 8
2.2 Soil movements in Greenfield conditions .................................................... 8
2.3 Effect of deep foundation on soil movements ............................................ 15
3 Modelling – Design and Test Procedures ........................................................ 16
3.1 Apparatus Design ...................................................................................... 16
3.1.1 Model Box ............................................................................................ 17
3.1.2 Soil Properties ..................................................................................... 18
3.1.3 Model Wall ........................................................................................... 19
3.1.4 Excavation ........................................................................................... 19
3.1.5 Piles ...................................................................................................... 20
3.1.6 Pile Loading ......................................................................................... 20
3.1.7 Pile top restraint ................................................................................. 21
3.2 Model Preparation ..................................................................................... 21
3.3 Summary of test procedure ....................................................................... 22
3.4 Test Summary ............................................................................................ 22
4 Analysis Methodology ...................................................................................... 23
4.1 Horizontal wall movement measurement ................................................. 23
4.2 Particle Image Velocimetry (PIV) ............................................................. 23
4.2.1 Principles ............................................................................................. 23
4.2.2 Accuracy ............................................................................................... 24

Ryan McCarron Trinity Hall
3
5 Results .............................................................................................................. 25
5.1 Introduction ................................................................................................ 25
5.2 Greenfield tests (RMG1, RMG2, RMG3, RMG4) ...................................... 26
5.2.1 Technical difficulties ........................................................................... 26
5.2.2 Graphs.................................................................................................. 26
5.3 Piled tests (RMP1, RMP2) ......................................................................... 28
5.3.1 Technical difficulties ........................................................................... 28
5.3.2 Graphs.................................................................................................. 29
5.4 Piled tests (RMP1, RMP2, RMP3, RMP4) ................................................ 30
5.4.1 Technical difficulties ........................................................................... 30
5.4.2 Graphs.................................................................................................. 30
5.5 Horizontal Wall Movements ...................................................................... 32
5.6 Pile Movement Mechanisms ...................................................................... 33
5.7 Results Summary ....................................................................................... 34
6 Discussion ......................................................................................................... 35
6.1 Introduction ................................................................................................ 35
6.2 Greenfield Tests ......................................................................................... 35
6.3 Effect of piled foundation ........................................................................... 36
6.4 Effect of piled foundation loaded ............................................................... 36
6.5 Effect of pile foundation loaded and laterally restrained at the top ........ 37
6.5.1 Low stiffness restraint ........................................................................ 38
6.5.2 High stiffness restraint ....................................................................... 38
6.6 Horizontal Wall Movements ...................................................................... 38
6.6.1 Experimental comparison ................................................................... 38
6.6.2 Comparison with Bica and Clayton (1998) ......................................... 39
6.7 Pile deformation mechanism ..................................................................... 39

Ryan McCarron Trinity Hall
4
7 Conclusions ...................................................................................................... 40
7.1 Introduction ................................................................................................ 40
7.2 Ground movement mechanisms ................................................................ 40
7.3 Influence of piled foundation of ground movement .................................. 40
7.4 Recommendations for future work ............................................................ 41
8 References ........................................................................................................ 42
9 Appendix 1 – Pile Loading Calculations ......................................................... 44
10 Appendix 2 – Risk Assessment Retrospective ............................................. 45
10.1 Initial Assessments................................................................................. 45
10.2 Risk Oversights ....................................................................................... 45
11 Appendix 3 - Calibration Markers ................................................................ 46

Ryan McCarron Trinity Hall
5
1 Introduction
1.1 Background
As the population of the world increases and the growth of cities accelerates the
demand on current infrastructure is greatly increased. One of the many roles of the civil engineer is to facilitate this growth through the development and upgrade of said infrastructure. This increasing population places pressure on
urban space, and when there is a demand for more infrastructure, very often subsurface structures provide the only solution. Underground structures such as tunnels, deep excavations and shafts therefore have to be constructed in highly
populated areas.
During construction of subsurface structures there are ground movements
induced, and these ground movements depending on location and intensity can be very damaging to existing structures and services. In general underground construction is expensive and the current design approaches are conservative,
leading to potentially unnecessary increases in cost. In order to alleviate this better understanding of the mechanisms which control the deformation induced by underground construction is necessary.
1.2 Research Aims and Scope
This research is concerned with deep excavations and the influence of adjacent
foundations on induced deformations. In many urban areas large buildings are constructed on piled foundations. It is the aim of this research to examine how a piled foundation adjacent to a deep excavation affects the ground movements
caused by the excavation. Previous understanding of the Greenfield response to a deep excavation is well documented, and field data shows that the presence of adjacent buildings does affect deformation profiles. This will be investigated
using a 1g plane strain model of a deep excavation in sand. The detailed aims of this research are:
• Broad literature review to understand current state of knowledge
• Design and develop a 1g (1 times gravity) model

Ryan McCarron Trinity Hall
6
• Series of Greenfield tests to confirm validity of the authors model
• Series of tests on piled foundations to compare the response to that of the Greenfield tests.
1.3 Layout of report
Chapter 2 – Literature Review: combines previous studies to develop an understanding of the potential effects that a piled foundation will have on Greenfield deformation.
Chapter 3 – Modelling: explains the development of the model, and the differences between 1g models and reality. It details the apparatus, and how the
model evolved.
Chapter 4 – Analysis Methodology: details the analysis and the importance of
understanding the strengths and weakness of the method used.
Chapter 5 – Results: reports the results from the tests, also showing some of the practical problems encountered during the testing process.
Chapter 6 – Discussion: results are discussed, and a comparison is made with the field data.
Chapter 7 – The main conclusions from the research are presented and some potential avenues for future research are discussed.

Ryan McCarron Trinity Hall
7
2 Literature Review
The purpose of this research is twofold, firstly to understand the Greenfield response to excavation at low stress levels, and secondly to look at the effect of a piled foundation adjacent to a deep excavation. This chapter looks first at the
Greenfield ground movements associated with deep excavations. The literature review focuses on cantilever walls in dry sand. Field data, physical models and numerical models are also summarised.
Secondly, the literature review examines how piled foundations are affected by ground movements. This area has not been studied in as much detail and as a
result there are very few papers of interest. Some work has been done on the impact of tunnelling on an overlying pile group, and although tunnelling-induced ground movement is different from excavation-induced ground movement, the
underlying concepts are similar. The notation used is shown in Figure 2.1.
Figure 2.1 – Notation

Ryan McCarron Trinity Hall
8
2.1 Introduction
With the large growth in population over the last century and the increased
demand on infrastructure, the pressure on space within urban environments increases dramatically. Often subsurface structures provide the only solution to this increased demand. As a result tunnels, shafts and deep excavations are
becoming more common and are being constructed in highly populated areas beneath existing buildings and services.
The construction of these subsurface structures will always cause ground movements above and adjacent to the tunnel or excavation. These ground movements can cause translation, rotation, deformation and distortion. This can
cause serious damage to buildings and services. A detailed understanding of how existing buildings and services react to excavations and tunnelling is vitally important before design and construction of such structures or infrastructure.
The current standards for prediction of ground movements are well understood for Greenfield conditions for both tunnelling and deep excavations. However the impact of buildings and foundation type on the ground movements is
comparatively less well understood.
This work is specifically concerned with the effect the foundation type of a
building has on the amount or extent of settlement that occurs as a result of a deep excavation. Most large buildings in urban areas will sit on a piled foundation with depths sometimes much deeper than the adjacent excavation,
however some buildings have shallower piled foundations with depths comparable to the excavation depth and these are the buildings that the author is concerned with.
2.2 Soil movements in Greenfield conditions
Peck (1969) provided the first empirical approach to estimating ground movements. Settlements adjacent to temporary braced and sheet pile structures are considered, and their relationship to soil types and workmanship. Peck plots
a settlement (Sv) normalised with excavation depth against horizontal distance from the support system, also normalised with excavation depth. Three

Ryan McCarron Trinity Hall
9
categories are presented and the maximum movement adjacent to the support system in Zone 1 (stiff clays and sands) did not exceed 1% of excavation depth. Peck’s results can be seen in Figure 2.2.
Figure 2.2 - Peck's results
Clough and O’Rourke (1990) summarised many case studies and their observations for in-situ walls in stiff clay and sands found that the maximum horizontal wall movements tended to average at 0.2%h, with a maximum value of
0.5%h. The maximum soil settlement has an average of 0.15%h, and finally there are no significant differences in the maximum movements for different types of walls. Figure 2.3 and Figure 2.4 show that the data follows a linear
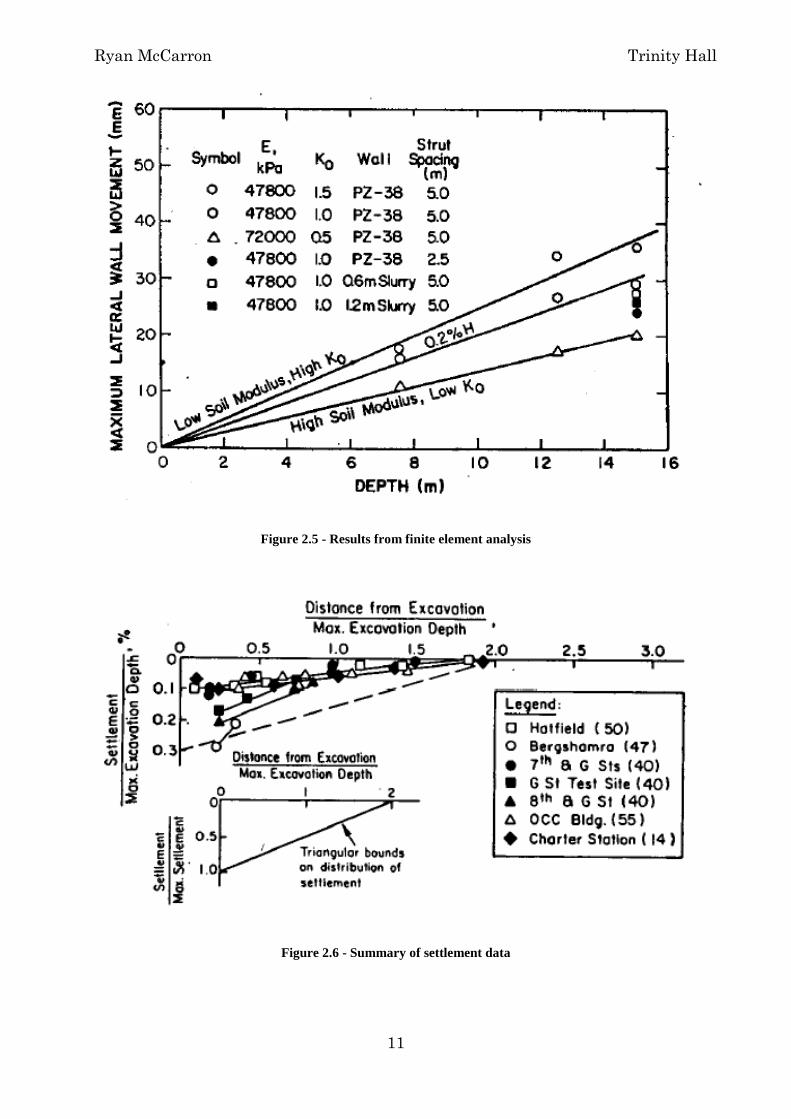
pattern and this suggests that the soil actually deforms as an elastic material. These results lead to a series of finite element analysis based on elastic soil behaviour. The analysis predicted the linear response of lateral wall movement
as demonstrated by Figure 2.5. Clough and O’Rourke also summarised the settlements for excavations in sand and the results can be seen in Figure 2.6.
Long (2001) found that maximum ground settlements behind retaining walls wholly embedded in stiff clays were on average 0.2%h. This corresponded to a maximum lateral wall deflection of 0.4%h. Long et al (2002) summarised field data from 27 cantilever wall sites and plotted normalised maximum wall

Ryan McCarron Trinity Hall
10
deflection (wmax/h) against system stiffness �𝐸𝐸𝑤𝑤𝑤𝑤𝑤𝑤𝑤𝑤 𝐼𝐼𝑤𝑤𝑤𝑤𝑤𝑤𝑤𝑤𝛾𝛾𝑤𝑤 𝑠𝑠4 � which was defined by
Clough et al. (1989). EwallIwall of the wall is the flexural rigidity, γw is the unit weight of water and s is the prop spacing, which in the case of a cantilever wall is 1.4h. The normalised wall deflections had an average value of 0.36%h shown in
Figure 2.7.
Figure 2.3 - Clough and O'Rourke (1990)
Figure 2.4 - Clough and O'Rourke (1990)
Ryan McCarron Trinity Hall
11
Figure 2.5 - Results from finite element analysis
Figure 2.6 - Summary of settlement data

Ryan McCarron Trinity Hall
12
Figure 2.7 - Case history data
Hsieh and Ou (1998) identified two soil settlement soil profiles, a concave profile when the cantilever components of lateral wall deflections are small and a
spandrel profile when the cantilever components of the lateral wall deflections are large. This is analogous to a simple cantilever wall and a propped cantilever wall respectively, as can be seen in Figure 2.8. For the spandrel type profile the
maximum settlement occurs adjacent to the wall. The ground surface settlement modelled by this profile compares well with Clough and O’Rourke. This still means that to complete a calculation either the maximum lateral wall deflection
or the maximum soil surface settlement must be known. These will have to be determined from either case histories or finite element analysis.
Figure 2.8 - Settlement profile

Ryan McCarron Trinity Hall
13
Lyndon and Pearson (1987) carried out a series of centrifuge tests in dry sand, to investigate the movements of a retaining wall as an excavation occurred. Figure 2.9 shows wall displacements as the excavation progressed. It also shows the
point at which catastrophic failure occurred.
Figure 2.9 - Maximum wall deflections
Bransby and Milligan (1975) conducted laboratory-scale experimental study of deformations near a cantilever sheet pile wall. Figure 2.10 shows a plot of
maximum horizontal wall deflection normalised with excavation depth (wmax/h) plotted against excavation depth normalised with cantilever wall length (h/D). For a stiff retaining wall the excavation depth required to cause failure gave h/D
as 0.81 and 0.83 for two tests.

Ryan McCarron Trinity Hall
14
Figure 2.10 - Maximum wall deflections
Figure 2.11 - Wall deflection at failure

Ryan McCarron Trinity Hall
15
Bica and Clayton (1998) also carried out 1g tests investigating the behaviour of cantilever walls embedded in sand. Although 1g tests are very different from centrifuge tests because of the large difference in stress levels, the data on
maximum horizontal wall movement falls within a narrow band with a pair of average curves fitting the data for loose and dry sands. Figure 2.11 shows a comparison of normalised maximum horizontal wall movement (wmax/h) and the
normalised embedment depth (d/h).
2.3 Effect of deep foundation on soil movements
There has been very little research carried out on the effect of deep foundations behind an embedded retaining wall. The soil-structure interaction mechanism
that governs the behaviour of the pile group and the retaining wall has been looked at by Morton and King (1979). They carried out laboratory-scale tests on the effect tunnelling had on an overlying pile group. Morton and King concluded
that the tunnelling had major effects on the piles, and that settlement of friction piles are controlled by the ground deformation at the pile tip. The degree of deformation may entirely be masked from the surface. They concluded that the
prime factor that induces failure of a pile is the dilatancy of the soil directly above the tunnel.
This work was furthered by Jacobsz (2002) who carried out some centrifuge tests to investigate the effect of tunnelling beneath a pile group. The main conclusions were that small displacements cause mobilisation of maximum skin friction.
When maximum shaft friction is mobilised further reduction in base load causes large pile displacements. The most interesting conclusion is that pile behaviour is very sensitive to the location of the base of the pile relative to the shear zones
extending from the tunnel. These are very similar to the conclusions of Morton and King.
Marshall (2009) carried out a further series of centrifuge test on the effect of tunnelling below driven piles and concluded that the work of Jacobsz (2002) agreed well with the results obtained.

Ryan McCarron Trinity Hall
16
3 Modelling – Design and Test Procedures
The complexity of the interaction between a retaining wall and the supported soil as well as the interaction of piled foundations and a deforming soil mass are both well suited to 1g modelling. Very often in geotechnical engineering a centrifuge
model is used where the stress levels of a scale model are amplified using a centrifuge. It is also possible to test scale models without a centrifuge, this is 1g modelling. 1g modelling was used primarily due to time constraints; however the
development of a centrifuge model is also much more costly. There are many implications for tests carried out at this lower stress level, which must be understood if the results are to be interpreted correctly. There are many factors
influencing the response of both the soil and the piled foundation. The opportunity to carry out Greenfield testing provides the opportunity to elucidate soil and pile behaviour.
This section gives detail on the development of the model and the test procedures used. It covers the assumptions made when carrying out 1g experiments and various scaling issues that are often encountered. The later sections cover how
the model has evolved from a Greenfield test rig to that which investigated the influence of piled foundations behind the wall.
3.1 Apparatus Design
The apparatus in principle is quite simple; however the interaction of the model
components and the model box provided many difficult challenges in developing the model as the tests progressed. A photograph of the apparatus can be seen in Figure 3.1.

Ryan McCarron Trinity Hall
17
Figure 3.1 - Apparatus set-up 3.1.1 Model Box
The model box had approximate dimensions 1.2m x 1.0m x 0.115m. The back of the box is a 12mm Perspex sheet, and the front of the box is a 10mm glass front. It is intended that the deformations occur under plane strain conditions. This
means that the plane vertical boundaries perpendicular to the retaining wall should be rigid and frictionless. The rigid assumption is sound because at 1g neither the Perspex nor the glass should deform. The frictionless assumption is
not completely fulfilled by the presence of the glass and Perspex, however they do minimise the frictional forces involved. The layout of the model box can be seen in Figure 3.2.

Ryan McCarron Trinity Hall
18
Figure 3.2 - Model box layout 3.1.2 Soil Properties
The model box was filled with dry Leighton Buzzard Fraction E silica sand – Grade 100/170 supplied by the David Ball Group plc. The maximum and
minimum voids ration; emax and emin were 1.01 and 0.65 respectively. The sand has a typical D50 of 122μm (Vorster (2006)) and a specific gravity Gs of 2.67. The critical state angle φcrit is 32o. The relative density ID was not tested on a test by
test basis, however it was viewed that it is reasonable to achieve a relative density of 70-80%. A uniform density was achieved using a mechanical sand pouring device which was able to ensure a constant head drop. The mechanical
sand pourer can be seen in Figure 3.3.
Figure 3.3 - Sand pouring apparatus

Ryan McCarron Trinity Hall
19
3.1.3 Model Wall
The retaining wall was chosen to be 600mm deep and as a result was placed
approximately 650mm from the right side of the model. The assumption that determined the position of the wall was based on the knowledge of the Ka and Kp values of 45o±φ’/2 respectively. The wall was left 1mm short on either side of the
Perspex and glass to ensure there was no unnecessary friction. The gap left between the glass and the retaining wall meant it was possible for sand to move through the gap. This problem was solved using an arrangement of paper and
cling film developed by El-Shafie (2007). The arrangement can be seen in Figure 3.4.
Figure 3.4 - Cling film arrangement
The nature of the 1g experiments meant that the scaling of the retaining wall would be fairly complex. An iterative process was used to decide exactly what thickness of retaining wall would give Greenfield settlement similar to those
gained in previous studies. Initially a 1.5mm wall was used, however the deformations were very large even at low levels of excavation, so this was replaced in favour of a 5mm thick wall which gave more reasonable results.
3.1.4 Excavation
The excavation was carried out in 60mm intervals. Assuming an approximate scale of 1:15 this gives excavation intervals of approximately 1m which is reasonable. The excavation was carried out using a vacuum, to remove the sand.
The sand was then kept to be reused for the next test.

Ryan McCarron Trinity Hall
20
3.1.5 Piles
The piles were made of 10mm square brass rod. They were 400mm long so as
they would extend at least ¾ of the way down the retaining wall. The piles were modelling a bored pile so there was no density change around them. In order to achieve this it was necessary to pour the sand around the piles instead of
pushing them into the sand. It was also decided to model a pile group similar to that which would be present as part of a foundation of a large building. In total there were 20 piles. They were arranged in a square grid with spacing of 4 times
their thickness. Figure 3.5 shows the lay-out of piles and the support arrangement used while pouring the sand. The support arrangement was removed as the sand was filled up.
Figure 3.5 - Pile set-up 3.1.6 Pile Loading
The loading of the pile group was carried out using a suitably high stiffness plate over the top of the piles. The plate had lubricant applied to its underside to ensure that there was minimal friction between it and the piles. The calculation
for the capacity of the pile group was carried out based on the assumption that an individual pile could sustain both end bearing and skin friction loading. The calculation for the capacity of an individual pile is shown in Appendix 1. There
was also a test carried out in the laboratory where a 400mm pile of similar dimensions was loaded to failure. In this experiment the pile was able to hold 2.7kg. Based on this and the calculation carried out in Appendix 1 it was decided
that including an appropriate factor of safety the load that each pile would carry would be equal to 2kg. This is a factor of safety of 3. That meant that there was a 40kg load applied to the plate on top of the pile group.

Ryan McCarron Trinity Hall
21
3.1.7 Pile top restraint
The restraint on the pile top was provided using two strips of aluminium, of
different thickness to model the different stiffness required. Each strip was stuck using epoxy glue to the top of a row of piles.
3.2 Model Preparation
The model preparation was basically the same for all of the tests with the
exception of the pile tests. The sand was poured using the method mentioned in 3.1.3 to the base of the retaining wall. The wall was then installed and held in place as the sand level was raised further until it was able to support the wall.
The complexity arose when the pile group had to be installed. If the displacement mechanism of the pile group was to be observed, it was necessary for one row of piles to be placed front glass wall. This can be seen from Figure
3.6. To prevent the ingress of sand between the piles and the model wall a silicon lubricant was used, this also served to reduce the friction between the piles and the model wall. However it was very difficult to ensure that the piles remained
pressed tight up against the model wall while the sand was being poured, and as a result in some of the tests the sand got between the pile and the wall. This problem will be discussed in later sections.
Figure 3.6 - Pile placement in model

Ryan McCarron Trinity Hall
22
3.3 Summary of test procedure
1. Begin sand pouring 2. Install model wall 3. Continue sand pouring 4. Install pile group 5. Finish sand pouring 6. Install any further restraint or loads to the pile group 7. Set up displacement measurement for retaining wall 8. Begin taking pictures 9. Excavate 10. Repeat until failure of wall
3.4 Test Summary
Table 3-1 - Test summary
Test Name Test Code Details
Greenfield 1 RMG1 Greenfield 2 RMG2 Failed: sand leaked Greenfield 3 RMG3 Greenfield 4 RMG4 Piles Unloaded RMP1 Piles only Piles Loaded RMP2 Piles loaded Pile Loaded and Restrained RMP3 Low stiffness restraint Pile Loaded and Restrained RMP4 High stiffness restraint

Ryan McCarron Trinity Hall
23
4 Analysis Methodology
4.1 Horizontal wall movement measurement
There were two methods of measurement used for obtaining the horizontal
retaining wall displacement. Initially a Linear Variable Differential Transformer (LVDT) was used, this is a very accurate way of measuring displacements. However the purpose of measuring the wall movement is to verify some of the
PIV results. It is unnecessary to use an instrument of such accuracy when the combined accuracy of the PIV in this case was 0.01mm. For the remaining series of tests a mechanical micrometer dial gauge was used to measure the
displacements. This provided results comparable to those from the LVDT and it also increased the rate at which the experiment could be set up. This was an important consideration in hindsight because due to the nature of the research
period strict time constraints were placed on when experimental work must be completed.
4.2 Particle Image Velocimetry (PIV)
PIV is the other method used to measure displacements.
4.2.1 Principles
PIV as detailed by White et al. (2003) is deformation measurement software
based on particle image velocimetry and close-range photogrammetry. It is a tool which allows the 2D measurement of displacements, in this case against the glass wall of the model box. The major benefit of this technique is the lack of
invasive objects in the continuum to be observed. The method assigns a mesh of patches to each individual photograph, each of which is uniquely identifiable. The patches are then traced as they move between images. This then identifies
the movement of the patches in image space. Through the use of calibration markers painted onto the model box it is possible to calculate this movement in object-space. Details of these calibration markers can be found in Appendix 3.

Ryan McCarron Trinity Hall
24
4.2.2 Accuracy
The accuracy of PIV is based around the resolution of the cameras used and the
distance the cameras are from the model box. In the case of this work two 8M Canon PowerShot cameras were used. Based on an aspect ratio 4:3, it was possible to attain an accuracy of ±0.013mm. However it should be noted that this
error is cumulative between images. In most experiments there were 10 photographs taken, this allows a potential error of ±0.13mm. Nevertheless the displacements of concern tend to be larger than this.

Ryan McCarron Trinity Hall
25
5 Results
5.1 Introduction
This section presents the results of the tests carried out as part of this research.
• Tests RMG1, RMG2, RMG3 and RMG4 were carried out to establish the Greenfield response.
• Test RMP1 investigate the presence of a pile group behind the retaining wall.
• RMP2 looked at the effect a load on the pile group had on the response during excavation.
• Tests RMP3 and RMP4 examined how the presence of a low and high stiffness restraint changed the response of the pile group during excavation.
The symbols used throughout this results section are shown in Figure 5.1.
Figure 5.1 - Notation used

Ryan McCarron Trinity Hall
26
5.2 Greenfield tests (RMG1, RMG2, RMG3, RMG4)
5.2.1 Technical difficulties
The main issue surrounding the first series of tests, RMG1 and RMG2, was the movement of sand particles through the gap left between the retaining wall and
the model box. It was thought that a sheet of folded paper would simply be enough to prevent this movement of sand. However as the tests progressed it became evident that this was not a viable solution. The problem can be seen in
Figure 5.2. This problem actually meant the results from test RMG2 were invalid. However the development of a cling film paper arrangement detailed in 3.1.3 meant that this was no longer going to be a problem.
Figure 5.2 - Sand particle movement around retaining wall 5.2.2 Graphs
Figure 5.3 and Figure 5.4 show the plots of maximum vertical and maximum horizontal displacements respectively against excavation depth at model scale for
the Greenfield tests. They show the development of soil settlement and horizontal movement adjacent to the retaining wall as the excavation progresses.
Movement of sand between retaining
wall and glass of the model box

Ryan McCarron Trinity Hall
27
Figure 5.3 - Maximum soil surface settlement for greenfield tests
Figure 5.4 - Maximum horizontal soil displacement for greenfield tests
-2
0
2
4
6
8
10
12
14
16
18
0 100 200 300 400 500 600
Max
imum
set
tlem
ent (
S v) (
mm
)
Excavation depth at model scale (mm)
Maximum Settlement (Sv) vs Excavation Depth
RMG1
RMG3
RMG4
0
5
10
15
20
25
0 100 200 300 400 500 600
Max
imum
hor
izon
tal d
ispl
acem
ent (
S h) (
mm
)
Excavation depth at model scale (mm)
Maximum Horizontal Displacement (Sh) vs Excavation Depth
RMG1
RMG3
RMG4
Ryan McCarron Trinity Hall
28
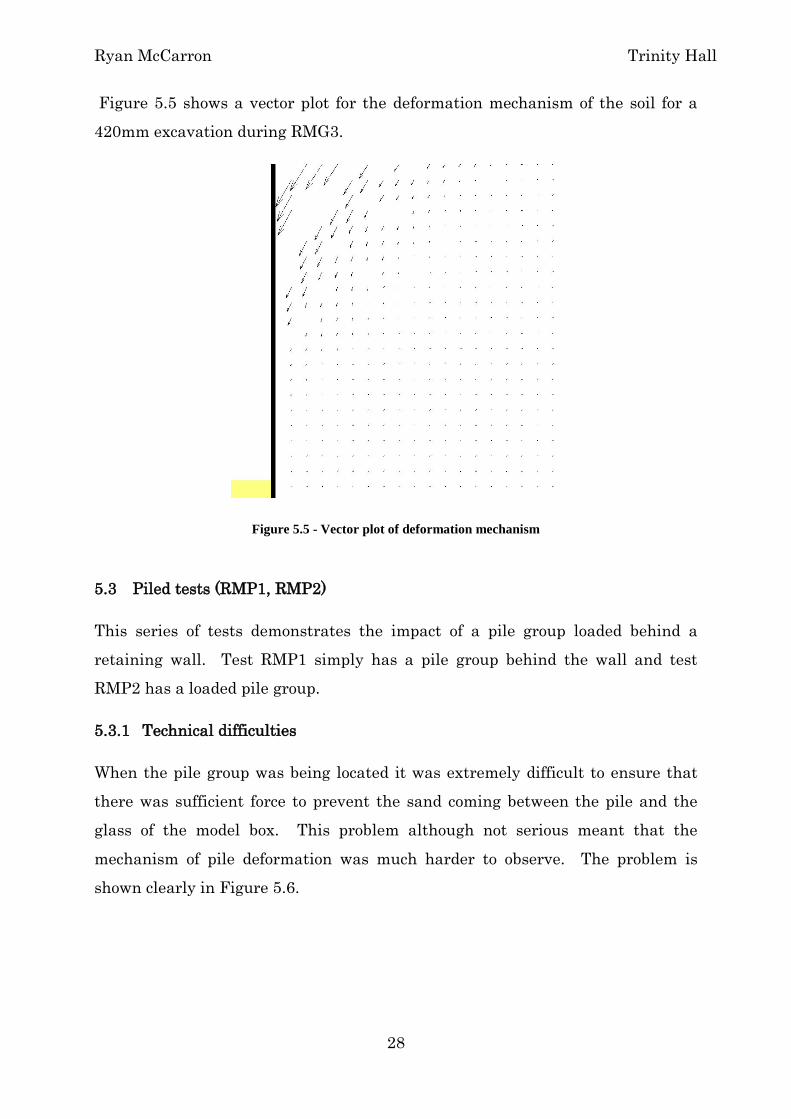
Figure 5.5 shows a vector plot for the deformation mechanism of the soil for a 420mm excavation during RMG3.
Figure 5.5 - Vector plot of deformation mechanism
5.3 Piled tests (RMP1, RMP2)
This series of tests demonstrates the impact of a pile group loaded behind a retaining wall. Test RMP1 simply has a pile group behind the wall and test RMP2 has a loaded pile group.
5.3.1 Technical difficulties
When the pile group was being located it was extremely difficult to ensure that there was sufficient force to prevent the sand coming between the pile and the glass of the model box. This problem although not serious meant that the
mechanism of pile deformation was much harder to observe. The problem is shown clearly in Figure 5.6.

Ryan McCarron Trinity Hall
29
Figure 5.6 - Sand particles between piles and glass wall 5.3.2 Graphs
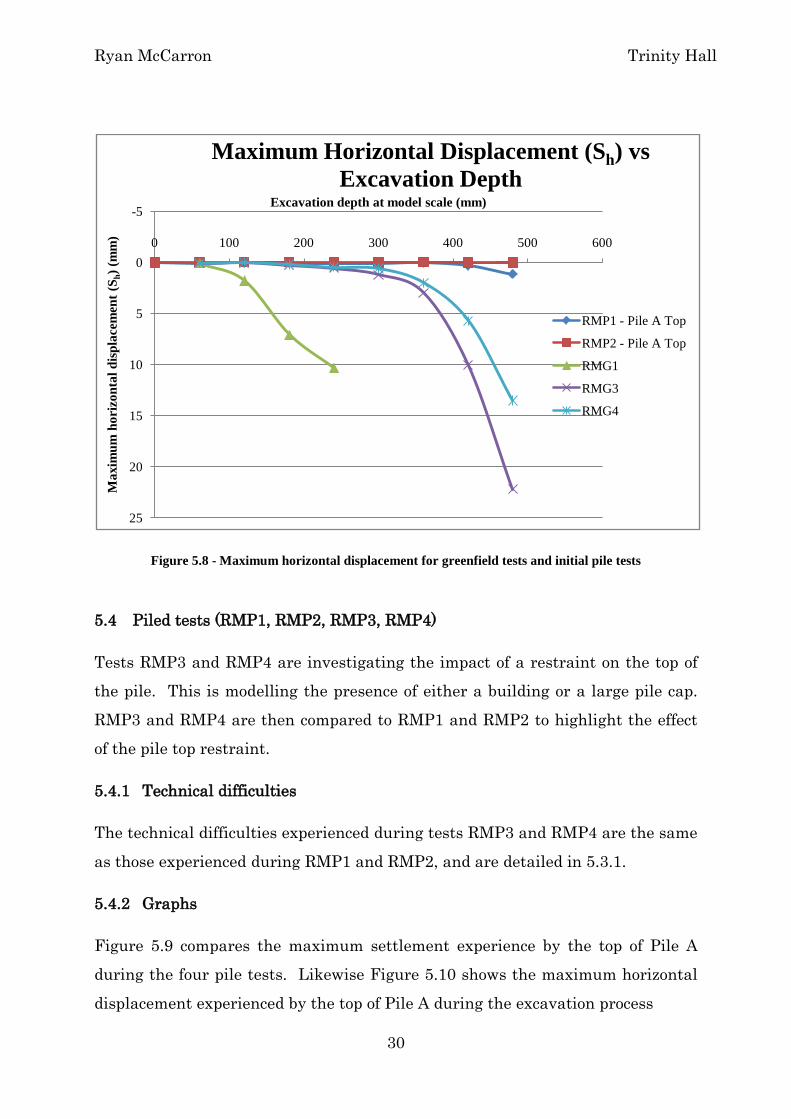
Figure 5.7 shows the maximum settlement adjacent to the retaining wall as the excavation depth increases. The top of pile A is tracked using PIV because we
are concerned with the building’s response to the excavation. In the case of a piled foundation it is the movement of the pile top that causes building movement. Pile A was chosen as the pile that would displace the most due to its
proximity to the excavation. Figure 5.8 shows the maximum horizontal movement developed as the excavation proceeded.
Figure 5.7 - Maximum settlement for greenfield tests and initial pile tests
-2
0
2
4
6
8
10
12
14
16
18
0 100 200 300 400 500 600
Max
imum
set
tlem
ent (
S v) (
mm
)
Excavation depth at model scale (mm)
Maximum Settlement (Sv) vs Excavation Depth
RMP1 - Pile A Top
RMP2 - Pile A Top
RMG1
RMG3
RMG4
Movement of sand between
piles and glass of model box
Ryan McCarron Trinity Hall
30
Figure 5.8 - Maximum horizontal displacement for greenfield tests and initial pile tests
5.4 Piled tests (RMP1, RMP2, RMP3, RMP4)
Tests RMP3 and RMP4 are investigating the impact of a restraint on the top of the pile. This is modelling the presence of either a building or a large pile cap.
RMP3 and RMP4 are then compared to RMP1 and RMP2 to highlight the effect of the pile top restraint.
5.4.1 Technical difficulties
The technical difficulties experienced during tests RMP3 and RMP4 are the same
as those experienced during RMP1 and RMP2, and are detailed in 5.3.1.
5.4.2 Graphs
Figure 5.9 compares the maximum settlement experience by the top of Pile A during the four pile tests. Likewise Figure 5.10 shows the maximum horizontal
displacement experienced by the top of Pile A during the excavation process
-5
0
5
10
15
20
25
0 100 200 300 400 500 600
Max
imum
hor
izon
tal d
ispla
cem
ent (
S h) (
mm
)
Excavation depth at model scale (mm)
Maximum Horizontal Displacement (Sh) vs Excavation Depth
RMP1 - Pile A Top
RMP2 - Pile A Top
RMG1
RMG3
RMG4

Ryan McCarron Trinity Hall
31
Figure 5.9 - Maximum settlement for pile tests
Figure 5.10 - Maximum horizontal displacement for pile tests
-0.5
0
0.5
1
1.5
2
0 100 200 300 400 500 600
Max
imum
set
tlem
ent (
S v) (
mm
)
Excavation depth at model scale (mm)
Maximum Settlement (Sv) vs Excavation Depth
RMP1 - Pile A Top
RMP2 - Pile A Top
RMP3 - Pile A Top
RMP4 - Pile A Top
-0.2
0
0.2
0.4
0.6
0.8
1
1.2
1.4
0 100 200 300 400 500 600
Max
imum
hor
izon
tal d
ispla
cem
ent (
S h) (
mm
)
Excavation depth at model scale (mm)
Maximum Horizontal Displacement (Sh) vs Excavation Depth
RMP1 - Pile A Top
RMP2 - Pile A Top
RMP3 - Pile A Top
RMP4 - Pile A Top

Ryan McCarron Trinity Hall
32
5.5 Horizontal Wall Movements
Figure 5.11 shows the horizontal movements of the retaining wall with
excavation depth. The horizontal wall movements are measured 10mm below the top of the retaining wall.
Figure 5.11 - Horizontal movements of retaining wall
Figure 5.12 - Comparison of horizontal wall movements with Bica and Clayton (1998)
-5
0
5
10
15
20
25
30
0 100 200 300 400 500 600
Hor
izon
tal w
all m
ovem
ents
(mm
)
Excavation depth at model scale (mm)
Horizontal Wall Movements
RMG1
RMG3
RMG4
RMP1
0
2
4
6
8
10
12
14
0 0.5 1 1.5 2
wm
ax/h
d/h
Comparison of Horizontal Wall Movements with Bica and Clayton
(1998)
Loose Sand
Dense Sand
RMG3
RMG4
RMP1

Ryan McCarron Trinity Hall
33
Figure 5.12 shows the data normalised in a way similar to Bica and Clayton (1998), and plotted against the data gathered by Bica and Clayton. This allows comparison to be made between the two set of data. Bica and Clayton carried out
a series of 1g tests of retaining walls in sand, and provide a good base for comparison of the author’s data.
5.6 Pile Movement Mechanisms
The mechanism by which the pile group moves is of great importance. Figure
5.13 shows that a pile chosen at random simply rotates as the excavation progresses. This can be seen from the linear variation in soil movements adjacent to the pile.
Figure 5.13 - Illustration of pile rotation
-50
0
50
100
150
200
250
300
350
400
00.20.40.60.811.21.4
Leng
th a
long
pile
from
pile
top
(mm
)
Horizontal displacement of soil adjacent to pile (mm)
Illustration of Pile Rotation
480mm Excavation
420mm Excavation

Ryan McCarron Trinity Hall
34
5.7 Results Summary
Table 5-1 - Results Summary
Test Name Test Code Purpose Results Greenfield 1 RMG1 Low stiffness support system Support stiffness effects the
depth of excavation and the maximum displacements experienced
Greenfield 2 RMG2 Repeatability of RMG1 Test FAILED Greenfield 3 RMG3 Higher stiffness support system Higher stiffness support
system results in reduced maximum displacements, and a deeper excavation depth achieved before failure
Greenfield 4 RMG4 Repeatability of RMG3 Test procedure and analysis methodology sound
Piles Unloaded RMP1 Investigate reinforcing effect of pile group on soil
Reduced maximum displacements, and horizontal wall movements
Piles Loaded RMP2 Investigate reinforcing effect of a loaded pile group on soil
Displacements reduced by a lesser extent than in RMP1, but still significant
Pile Loaded and Restrained RMP3 Investigate the effect of a building of low bending stiffness on piled foundations
Reduced maximum horizontal displacements dramatically, however did not affect maximum settlements much from RMP1
Pile Loaded and Restrained RMP4 Investigate the effect of a building of high bending stiffness on piled foundations
Reduced maximum displacements from RMP1

Ryan McCarron Trinity Hall
35
6 Discussion
6.1 Introduction
This section will highlight the important aspects of the results. It will draw
together the significant findings and attempt to provide an explanation of the behaviour of the model. It aims to combine the data in the literature review with the experimental data presented in Chapter 5. Initially the Greenfield response
will be examined.
6.2 Greenfield Tests
The first issue to be discussed in this section is the failure of test RMG2 to work. The infiltration of the sand through the gap between the retaining wall and the
glass wall meant that the retaining wall was ineffective. As the excavation progressed a large amount of sand from behind the retaining wall moved through to the excavation resulting in a reduced active force on the retaining wall.
Examining Figure 5.3 and Figure 5.4 it can be seen that there is a large difference in the response of the first Greenfield test with the remaining two. RMG1, the initial Greenfield test had a low stiffness retaining wall. The
retaining wall was only 1.5mm thick and as a result of very low stiffness. This created an exaggerated response to excavation causing much larger displacements. Examining tests RMG3 and RMG4 it can be seen that there is
consistency in the data. This helps to validate the experimental procedure and the analysis method because the same methods were used in both tests, and they yielded very similar results. It also shows that a higher stiffness support system
reduces induced displacements. The maximum normalised settlement is of the order of 1.5%, this value is much large in comparison to data presented by Clough and O’Rourke (1990). The main reason for this is the nature of the
experiment. The low-stress levels of a 1g experiment produce much larger displacements in sands than would normally be produced at higher stress levels.
Figure 5.5 shows a vector plot of the deformation mechanism of the soil behind the retaining wall after an excavation depth of 420mm. It shows a clear

Ryan McCarron Trinity Hall
36
movement to the left and downwards. This is obvious but nonetheless provides a quick check on the analysis method, because the deformation mechanism of the soil mass behind a retaining wall during an excavation is known, and matches
the vector plot shown in Figure 5.5.
6.3 Effect of piled foundation
In this particular scenario the top of Pile A is tracked because it is the movement of the foundation of a building that would cause and displacements or
translations of the building. Figure 5.7 and Figure 5.8 show the settlement and horizontal displacement data for the initial pile tests and the Greenfield tests. Initially it is obvious that the presence of the pile group has a large effect on the
response of a building because of the differences in maximum settlement and horizontal displacements observed
Examining the maximum chart first it is clear that the settlement is greatly reduced. The Greenfield data from RMG3 gives a maximum settlement of 6mm in comparison with a maximum settlement of 2mm for the top of Pile A. The
impact on the maximum horizontal movement is larger than that of the maximum settlement. A maximum horizontal movement of 15-20mm is experienced by tests RMG3 and RMG4, and this can be compared to a maximum
horizontal movement of 0-2mm for test RMP1.
This shows that in test RMP1 there is an overall stiffening effect created by the
presence of the pile group. This is illustrated by the reduction in response to the excavation. One of the most interesting things to note is that the point at which both settlement and horizontal displacement start to change is the point at which
the excavation goes below the base of the pile. This corresponds to an excavation depth of 400mm.
6.4 Effect of piled foundation loaded
Tests RMP2 showed the effects of a loaded pile group. The purpose of this test
was to model the presence of the weight of a building and its response to excavation.
Ryan McCarron Trinity Hall
37
The settlement of Pile A in test RMP2 was as expected larger than that of RMP1; however it still proved to be much reduced from the Greenfield scenario, showing that even a loaded pile group has a stiffening effect on the soil behind a retaining
wall. In contrast to settlement, the horizontal displacement of Pile A was greatly reduced from RMP1; this is believed to be due to the presence of a loading plate on the top of the pile group. It was necessary to place a stiff loading plate over
the top of the pile group to ensure even loading over each pile. In an attempt to reduce the effects of friction the bottom side of this loading plate the side in contact with the pile group was lubricated. Nevertheless it is believed that the
high frictional forces present due to the loading may have affected the horizontal displacement data somewhat. Again in this test any displacements of significant magnitude only begin to happen once the excavation passes 400mm. The main
difference is that the loaded pile test (RMP2) causes a more gradual settlement, starting before the 400mm cut-off in contrast with that of the unloaded pile test (RMP1).
6.5 Effect of pile foundation loaded and laterally restrained at the top
This series of tests was intended to model not only the effect of a buildings weight, but also the effect of the axial stiffness and the bending stiffness of a building. The low stiffness restraint models a low bending stiffness, while
maintaining a high axial stiffness. The high stiffness restraint models a high axial stiffness and a high bending stiffness. The results shown for the loaded pile group only can be assumed to model the response of a building with low axial
stiffness. Figure 5.9 and Figure 5.10 allow comparison of the loaded restrained pile group with that of the loaded and unloaded but not restrained. The Greenfield tests are not included because the magnitudes of displacement are too
large to enable a comparison to be made visually between individual pile tests. The results can be seen in Figure 5.9 and Figure 5.10, and show that the presence of a pile top restraint does have a quantifiable effect on the maximum
settlement and horizontal displacement experienced.

Ryan McCarron Trinity Hall
38
6.5.1 Low stiffness restraint
The presence of the low stiffness restraint had very little effect on the values of
settlement; the values still remain around 1.5-2.0mm. This shows that the bending stiffness of the restraint was insufficient restrain the movement of Pile A. However there was a major effect on the horizontal displacement experienced
by Pile A. Initially there was basically no change in the horizontal position of Pile A indicating that the axial stiffness of the restraint was sufficient to overcome any forces created because of deformation due to excavation. The last
point on Figure 5.10 shows a dramatic change in horizontal location. Although plausible, it is potentially due to the shearing of the epoxy glue used to ensure the restraint remained in contact with the pile.
6.5.2 High stiffness restraint
Conversely the presence of a high stiffness restraint had a large effect on both the settlement and horizontal displacement data. The high stiffness restraint caused a reduction in both displacements. This shows the axial and bending
stiffness of the restraint were sufficiently high to prevent Pile A from either settling or translating.
6.6 Horizontal Wall Movements
The horizontal wall movements were all measured 10mm down from the top of
the retaining wall.
6.6.1 Experimental comparison
Figure 5.11 shows the variation in wall movements with excavation depth. It can be seen that the low stiffness wall used in RMG1 caused much larger wall
displacements for a much smaller excavation depth. It can also be seen that the presence of the pile group behind the retaining wall did not have a major effect on the horizontal wall displacements. However it did result in an overall
reduction in maximum horizontal wall movements at an excavation depth of 480mm, again reinforcing the premise that the pile group has a reinforcing, or stiffening effect on the soil mass behind the excavation. This is inferred from the

Ryan McCarron Trinity Hall
39
reduced horizontal wall movements meaning the active pressure on the retaining wall must be reduced.
6.6.2 Comparison with Bica and Clayton (1998)
It can be seen from Figure 5.12 that all of the data obtained experimentally
compares well with the data obtained by Bica and Clayton. All of the experimental data lies within the bounds of loose and dense sand. It is interesting to note the proximity of the horizontal wall movement data from test
RMP1 to the dense sand correlation drawn by Bica and Clayton. This could mean that the presence of the pile group is analogous to having a denser sand present behind the retaining wall, which shows the piles are having a stiffening
effect on the soil behind the retaining wall.
6.7 Pile deformation mechanism
Figure 5.13 show that in tests RMP1 as the excavation progresses from 420mm to 480mm there is a definite rotation of Pile A. This was inferred from the linear
change in horizontal soil movements along the length of the pile. This defines the response of the suitably stiff pile. In reality it is more likely for the pile to bend and not rotate, however in the case of this 1g low stress experiment it is
plausible for the pile to rotate. This highlights the importance of understanding the implications of 1g testing, how the deformation mechanisms are different, and how this difference could affect results obtained.

Ryan McCarron Trinity Hall
40
7 Conclusions
7.1 Introduction
The objective of this research was to carry out a broad literature review of the
current state of knowledge of the response of buildings to excavation induced ground movements. A series of 1g plane strain model was developed and a series of experiments were carried out to confirm the Greenfield situation and the
validity of the author’s model. A series of tests with a piled foundation behind the retaining wall were then conducted. A series of digital images were taken of the soil and model components during testing such that PIV, an image-based
deformation analysis technique, could be used. Horizontal wall movements were also examined to investigate the impact of the deep foundations.
This chapter summarises the conclusions drawn from this research, looks at the critical mechanisms influencing the excavation-soil-foundation interaction problem, and how these mechanisms could potentially affect building response.
7.2 Ground movement mechanisms
It is clear from this research that even at low stresses the ground movement
mechanisms for a Greenfield tests are very similar to those experienced in reality. It can also be noted that the dilatant nature of sand at low stress levels causes exaggerated displacements and these must be taken into account when
interpreting the results of this research.
7.3 Influence of piled foundation of ground movement
The research has clearly shown that the presence of a pile group behind a retaining wall dramatically influences the ground response. The complexity of
the soil behaviour around bored piles in sand was certainly revealed to the author during the course of this research. The pile group has a stiffening effect on the ground and reduces settlements and horizontal displacements
dramatically. It should also be noted that the point at which the stiffening effect of the pile group is reduced is when the excavation proceeds past the bottom of

Ryan McCarron Trinity Hall
41
the pile. This is primarily due to the mobilisation of the soil at the base of the pile causing a massive reduction in the base load that may be carried. This reduction in base load places increased pressure on the capacity of the skin
friction of the pile which cannot be met causing settlement and translation of the pile.
7.4 Recommendations for future work
This work looked at the effect of piled foundations on the excavation-soil-
foundation interaction; however it did have some limitations. There were heavy time constraints placed on the experimental period, and this meant fewer tests were completed than desired. The opportunity to include more displacement
measuring equipment on the piles would have provided a more complete set of pile displacement data, upon which the PIV data could have been compared. 1g modelling although very useful does have its limitations, the inability to recreate
the actual stress conditions present in the scenario to be modelled means the ground response is different. Opportunities for future work include:
• The opportunity to carry out centrifuge modelling would greatly increase the comparability of the results to data gathered in the field.
• The tests carried out as part of this research were all cantilever walls. Many retaining structures used in deep excavations tend to be multi-
propped walls, and very often they tend to be in clay.
• Although there were two lines of piles in the pile group, this arrangement is unusual. More often than not the building will not be parallel to the
excavation, and twist deformation is a major problem. Experimentally it is possible to include buildings with a skew angle with respect to the retaining wall.
The interaction of a deep foundation with an excavation is complex; this research provides a good base upon which future research may be based. The problem
posed here is perhaps too complex initially for centrifuge modelling, but separating it into a couple of test series could produce some very interesting results in the future.

Ryan McCarron Trinity Hall
42
8 References
1. Marshall, A.M. (2009). Tunnelling in sand and its effects on pipelines and piles. PhD Thesis. University of Cambridge
2. Bica, A.V.D and Clayton, C.R.I (1998). An experimental study of the
behaviour of embedded lengths of cantilever walls. Geotechnique 48,No.6,731-745
3. Bolton, M.D. and Powrie, W. (1987). Collapse of diaphragm wall retaining
clay. Geotechnique, vol 37, no 3, pp 335-353 4. Brangan, C. and Long, M. (2001). Behaviour of buildings adjacent to deep
excavations in Dublin glacial till. Response of buildings to excavation
induced ground movements. Proceeding of the international conference held at Imperial College, London, UK
5. Bransby, P.L. and Milligan, W.E. (1975). Soil deformations near cantilever
sheet pile walls. Geotechnique 25 No.2, 175-195 6. Clough, G.W., Smith, E.M. and Sweeney, B.P. (1989). Movement control of
excavation support systems by iterative design. ACSE Foundation Engineering. Current principles and practices, Vol. 2, ACSE, New York, pp.
869-884 7. Clough, G.W. and O’Rourke, T.D. (1990). Construction induced movements of
in-situ walls, ASCE geotechnical special publication No. 25. Design and
Performance of Earth Retaining Structures, 439-470 8. El-Shafie, M.Z.E.B. (2007). Effect of building stiffness on excavation induced
displacements. PhD thesis. University of Cambridge
9. Hseih, P.G. and Ou, C.Y. (1998). Shape of ground surface settlements profiles caused by excavation. Canadian Geotechnical Journal, 35, pp. 1004-1017
10. Jacobsz, S.W. (2002). The effects of tunnelling on piled foundations. PhD
Thesis. University of Cambridge 11. King, G.J. and McLoughlin, J.P. (1992). Centrifuge model studies of a
cantilever retaining wall in sand. Proceeding of an international conference
on retaining structures, Cambridge, 711-720

Ryan McCarron Trinity Hall
43
12. Long, M. (2001). Database for retaining wall and ground movements due to deep excavations. Journal of Geotechnical and Geoenvironmental Engineering, ASCE 127 (3): 203-224
13. Lyndon, A. and Pearson, R.A. (1984). Pressure distribution on a rigid retaining wall in a cohesionless material. Proceedings of a symposium on the application of centrifuge modelling to geotechnical design, Manchester, pp.
271-280 14. Morton, J.D. and King, K.H. (1979). Effects of tunnelling on the bearing
capacity and settlement of piled foundations
15. O’Rourke, T.D., Cording, E.J. and Boscardin, M.D. (1976). The ground movements related to a braced excavation and their influence on adjacent structures. University of Illinois Report for the US Department of
Transportation, Report No. DOT-TST-76T-22 16. Padfield, C.J. and Mair, R.J. (1984). Design of retaining wall embedded in
stiff clay. Report 104, CIRIA, London
17. Peck, R.B. (1969). Deep excavations and tunnelling in soft ground. Proceedings of the 7th International Conference on Soil Mechanics and Foundation Engineering, Sociedad Mexicana de Mecanica de Suelos, A.C.,
Mexico City, pp. 225-290 18. Powrie, W. (1986). The behaviour of diaphragm walls in clay. PhD thesis,
University of Cambridge
19. Tan, F.S.C. (1990) Centrifuge and theoretical modelling of conical footing on sand. PhD thesis, University of Cambridge
20. Vorster, T.E.B. (2005). The effects of tunnelling on buried pipelines. PhD
Thesis. University of Cambridge 21. White, D.J., Take, W.A. and Bolton, M.D. (2003). Soil deformation
measurement using particle image velocimetry (PIV) and photogrammetry.
Geotechnique, Vol. 54, 7,pp. 619-631 22. Zhao, Y. (2007). In situ soil testing for foundation performance prediction.
PhD thesis, University of Cambridge.

Ryan McCarron Trinity Hall
44
9 Appendix 1 – Pile Loading Calculations
Firstly calculate the shaft resistance:
𝐹𝐹 = 𝐴𝐴. 𝐿𝐿. 𝜏𝜏̅ 𝜏𝜏 = 𝐾𝐾𝜎𝜎�𝑣𝑣
However 𝐾𝐾𝑤𝑤 < 𝐾𝐾 < 𝐾𝐾𝑝𝑝
It tends to be a good approximation to assume
𝐾𝐾 = 𝐾𝐾0 = 1 − 𝑠𝑠𝑠𝑠𝑠𝑠𝜑𝜑′
In this case from Tan (1990) 𝜑𝜑 = 32𝑜𝑜
𝜌𝜌𝑤𝑤𝑣𝑣 = 𝜌𝜌𝑚𝑚𝑤𝑤𝑚𝑚 + 𝜌𝜌𝑚𝑚𝑠𝑠𝑠𝑠2� = 1357 + 1633
2� = 1495 𝑘𝑘𝑔𝑔 𝑚𝑚3⁄
𝛾𝛾𝑤𝑤𝑣𝑣 = 1495 ∗ 9.81 = 14.67 𝑘𝑘𝑘𝑘 𝑚𝑚3⁄
𝐿𝐿 = 0.4𝑚𝑚 𝐴𝐴 = 0.01𝑚𝑚 ∗ 0.01𝑚𝑚 = 0.0001𝑚𝑚2
𝜏𝜏 = 𝐾𝐾0�𝛾𝛾𝑤𝑤𝑣𝑣 . 23� . 𝐿𝐿�
𝜏𝜏 = 1.8386 𝑘𝑘𝑘𝑘 𝑚𝑚2⁄
𝐹𝐹 = 0.0735𝑘𝑘𝑘𝑘
Then the base resistance needs to be calculated using Khristoforov, Berezantzev
and Golubkov (1961):
𝑞𝑞𝑏𝑏 = 𝜎𝜎𝑧𝑧′𝑘𝑘𝑞𝑞 𝜑𝜑′ = 32𝑜𝑜 𝑘𝑘𝑞𝑞 ≈ 27
𝐸𝐸 = 𝑞𝑞𝑏𝑏 .𝑘𝑘𝑞𝑞 𝜎𝜎𝑧𝑧′ = 23� . 𝐿𝐿. 𝛾𝛾𝑤𝑤𝑣𝑣
𝐸𝐸 = 23� . 𝐿𝐿. 𝛾𝛾𝑤𝑤𝑣𝑣 .𝑘𝑘𝑞𝑞 .𝐴𝐴 = 26.41𝑘𝑘
𝑃𝑃 = 𝐹𝐹 + 𝐸𝐸 = 99.9𝑘𝑘 𝑐𝑐𝑤𝑤𝑝𝑝𝑤𝑤𝑐𝑐𝑠𝑠𝑐𝑐𝑐𝑐
𝑃𝑃 = 𝑃𝑃𝑢𝑢𝑤𝑤𝑐𝑐3.0� = 33.3𝑘𝑘
3.39𝑘𝑘𝑔𝑔 𝑝𝑝𝑝𝑝𝑝𝑝 𝑝𝑝𝑠𝑠𝑤𝑤𝑝𝑝

Ryan McCarron Trinity Hall
45
10 Appendix 2 – Risk Assessment Retrospective
The experimental work, as detailed in the report did not vary from that presented in the initial Risk Assessment.
10.1 Initial Assessments
• Substances – the sand used, Leighton Buzzard Fraction E silica sand –
Grade 100/170 supplied by the David Ball Group plc was very fine, and would require the use of a mask when pouring: this was the correct assessment of the risk, and as a surplus to the control measure of a mask, there was also a portable dust extraction system put in place during the
sand pouring process.
• Manual Handling – the bags in which the sand is provided in weigh 20kg. Although inside the safe lifting weight limit, care should be taken when
lifting these: again a reasonable assessment of the risk, and the control measures meant that no injuries were sustained during experimental work.
• Manual Handling – the capacity of the pile group will mean that there will be a large load to be applied. This load could be up to 40kg, and is 1.2m from the ground. Care should be taken to ensure that the load does not
become unstable during failure of the pile group: the method of loading worked very well, the load was held by a backup support to prevent it falling when the pile group failed. Again a reasonable assessment of risk, and an effective control measure.
10.2 Risk Oversights
When the model box was being prepared, the front glass wall had to be removed for cleaning, and painting of the control markers. This glass front turned out to be extremely heavy +25kg. This meant four people were required to lift it, and
access arrangements meant it was impossible to get mechanical lifting equipment. This risk should have been identified and a more robust control measure put in place.

Ryan McCarron Trinity Hall
46
11 Appendix 3 - Calibration Markers
It can be seen from Figure 11.1 that there are small black dots, with a white surrounding painted. These dots are the calibration markers used as part of the PIV process.
Figure 11.1 - Calibration Markers
The calibration markers are used to account for any possible movement in the cameras during the experiment. It is known that the calibration markers do not
move, so when a PIV analysis is carried out on the markers the relative displacements of the markers can be taken away from the movement of the soil patches. This gives the overall movement of the soil with account taken for any
movement of the cameras.