i generational differences in work life balance
TRANSCRIPT

i
GENERATIONAL DIFFERENCES IN
WORK LIFE BALANCE ATTITUDES
A THESIS
SUBMITTED TO THE DEPARTMENT OF PSYCHOLOGY
OF THE STATE UNIVERSITY OF NEW YORK AT NEW PALTZ
IN PARTIAL FULFILLMENT OF THE REQUIREMENTS
FOR THE DEGREE OF
MASTER OF SCIENCE IN MENTAL HEALTH COUNSELING
By
Catherine C. Parker
November 2007

Notice: Signature Page Not Included
This thesis has been signed and approved by the
appropriate parties.
The signature page has been removed from this digital
version for privacy reasons.
The signature page is maintained as part of the official
version of the thesis in print that is kept in Special
Collections of Sojourner Truth Library at SUNY New Paltz.
iii
ACKNOWLEDGEMENTS
The author would like to acknowledge the following people and organizations that have
supported this research:
Rayna Wendell, the Director of Alumni Affairs at SUNY New Paltz, for her assistance in
obtaining a random sample of SUNY New Paltz alumni as potential participants in this study.
Meghan David for her invaluable help in preparing the 3000 surveys to be mailed and
entering all of the data from the returned surveys. Her extreme care in entering all the data and
documenting discrepancies minimized the amount of work I needed to do to prepare the data for
analysis.
Dr. Maryalice Citera, my thesis advisor, for her advice, expertise, and quick turnaround
on reviews, as well as her willingness to adjust her schedule to meet with me at the risk of her
own work life balance. The irony of a graduate thesis on work life balance was never lost on
either of us.
Dr Douglas Maynard and Tonda Highley, my review committee, for their support,
thoughtful comments and especially their flexibility which helped me to meet crucial deadlines.
The United University Professionals union who provided funding for postage for the
surveys.
The Psychology Department of The State University of New York at New Paltz who
provided funding for paper and printing costs.
My husband, Larry, who has always supported my work life balance decisions, usually
more than I do.

iv
TABLE OF CONTENTS
I. Acknowledgements…………………………………..…………. iii
II. Abstract………………………………………………..………... v
III. Introduction……………………………………………..…...…. 1
Generation Definitions ………………………………..…..... 2
Work Life Balance …………………….……………......…... 4
Work Life Balance Programs ……………..………………... 12
IV. Method…………………………………………..……………… 15
Participants………………………………………………….. 15
Measures ……………………………………………………. 16
Procedures ……………………………..…………………… 18
V. Results………………………………………………………...… 20
Work Life Balance………………………………………….. 22
Individual Initiative Behavior ……………………………… 24
Work Life Balance Programs ……………………………… 26
Summary …………………………………………………… 31
VI. Limitations …………...…………………………………...……. 32
VII. Discussion…………………………………………………..…... 33
Alternative Explanations ……………………..……………. 34
Conclusion …………………………………………………. 37
VIII. References…………………………………………..…………... 38
IX. Appendices…………………………………………..………….. 41

v
ABSTRACT
A study was conducted with 543 SUNY New Paltz alumni representing three generations to
determine if there were generational differences in attitudes about work life balance. A paper
and pencil survey was mailed to 3000 potential participants containing questions regarding
perception of work life balance, engagement in individual initiative behavior and work life
balance program usage and perceived risk. Significant differences in engagement in individual
initiative behavior, perceptions of risk and program usage were found between Baby Boomers
and Millennials. Significant differences in program usage were found between Baby Boomers
and Gen X’ers. Some surprising results were found. There were no significant results for gender
differences for perceived work life balance across the generations and the result for work life
balance by generation only approached significance. This result possibly suggests a more
complex relationship between gender, age, and work life balance. Alternative explanations such
as age, familial responsibility and gender are discussed. Implications for further research were
discussed including possible barriers to usage of work life programs for Baby Boomers and men
of all generations.

1
INTRODUCTION
The planned study looked at generational differences with respect to participants'
perceptions of work and career. Generational differences represent the set of values that
people within the same age group possess. It is posited that these values are formed by a
common history that is shared by a generational cohort. This common history includes
the experience of major life events such as war, economic recessions, political upheaval
and both natural and industrial disasters. World War II, the assassination of John F.
Kennedy, the shuttle Challenger disaster, and the attacks on the World Trade Center
represent examples of significant common experiences that have shaped the values of
each generation differently. While these events do have an effect on all generations, they
have the most profound effect on the youngest generation. Lancaster and Stillman (2002)
stated that “events and conditions that each of us experiences during our formative years
determine who we are and how we see the world” (p. 14). In addition to major world (or
US) events, socioeconomic changes can be another factor in developing generationally
specific values (Zemke, Raines, & Filipczak, 2000). Dual career families, geographic
dispersion of extended families, and single parent households, are all examples of current
trends that have changed the face of the workforce. Each generation has developed
different values around these phenomena depending on whether they were emerging
trends or well established norms during a specific generation's formative years.
This research was designed to gather data on how generational differences about
work and career affect peoples' view of work life balance.
• How does each generation perceive their balance between work and life?
• Do any of the generations engage in behavior at work that may make it
harder to manage their work life balance?

2
• What solutions are provided by organizations to help employees achieve
more balance? Are these solutions being used by members of all
generations or are some generations less likely to take advantage of these
programs? Do some generations perceive these programs to be more risky
to their careers?
• Are there gender differences in perceptions about work life balance and
work life balance programs and do those attitudes remain consistent across
generations?
This research attempted to address these questions. Three specific generations were
studied including: Baby Boomers, Gen X’ers and Millennials.
Generation Definitions
Baby Boomers
Baby Boomers are defined as people born between the years 1946 and 1964
(Lancaster & Stillman, 2002). Major life events for this generation include the Vietnam
War and the assassination of John F. Kennedy. Most Baby Boomers were raised by two
parents and had a stay at home mother. Zemke et al. (2000) stated that the parents of this
generation considered child rearing to be a symbol of what they had fought for through
the depression and WWII rather than a biological necessity. They further stated that as a
result, Baby Boomers were raised in the spotlight of the family. Economic conditions
included a post World War II economic boom. Baby Boomers were repeatedly told how
much their parents had sacrificed to create opportunities for their children and that they
were expected to be more financially successful than their parents. The combination of
the positive economic conditions, as well as the attention and encouragement from
3
parents, created an optimistic outlook among this generation (Zemke et al., 2000).
Gen X'ers
Gen X'ers are defined as people born between the years 1965 and 1980 (Lancaster
& Stillman, 2002). Major life events for these people include Watergate and the
Challenger disaster. Although many X’ers were not born when Watergate occurred, the
resulting loss of faith in the government continued throughout their formative years. This
generation faced a tougher economy than the Baby Boomers and their family lives were
not nearly as stable. This generation's Baby Boomer parents were more likely to be
working parents than stay at home care takers. A social imperative to succeed
financially, combined with a tougher economy that made it difficult to live on just one
salary, resulted in more dual career families. In addition, divorce rates tripled during the
birth years of this generation. This increase in parents working, particularly mothers,
created the phenomenon of latchkey kids (Lancaster & Stillman; Kupperschmidt, 1998).
These latchkey kids developed both a sense of self-reliance and a preference for freedom.
This generation also witnessed major institutions exposed as corrupt, such as the
government during the Watergate scandal. According to Lancaster and Stillman, this
generation has no heroes because, through the introduction of tabloid journalism and
increased access to the media, they grew up seeing heroes being disgraced. This has
created an innate cynicism and a tendency for them to rely more on themselves. Unlike
their Baby Boomer parents who were given much, Gen X'ers learned early on that they
needed to make their own opportunities and that achieving their goals may come at a
price.

4
Millennials
Millennials are defined as people born between the years 1981 and 1999
(Lancaster & Stillman, 2002). They are also referred to as Nexters, Generation Y, and
Generation Why. It is not yet clear which events will be pivotal for this generation since
the youngest members are only 8 years old. Major events that will most likely shape this
generation are the 9/11 disaster and the Iraq war. Parents of this generation include both
Baby Boomers and Gen X'ers. According to Zemke et al. (2000), Baby Boomer parents
of this generation are those that delayed childbearing to focus on their careers early on
and now approach parenting with the same level of enthusiasm and drive to achieve that
they had for their careers. Gen X'er parents are dedicated to making sure that their
children do not experience the neglect that they felt. The result is that these parents take
an active part in all areas of their children's lives, scheduling extra-curricular activities
when they are young and advocating for older children at colleges and jobs. Unlike their
predecessors the Gen X'ers, Millennials are the center of parental and societal attention
(Zemke et al., 2000). This results in a more positive view of society and institutions
which Murray (1997) claims they view as an extension of parental love and concern.
Work Life Balance
Changes to the work life balance equation
The health benefits of reducing stress through a balanced life, as well as the
difficulty of achieving a balanced life, are well known (Quick et al., 2004). How does
one define a balanced life, however? Fisher-McAuley, Stanton, Jolton, and Gavin (2003)
describe work life balance as a competition for both time and energy between the
different roles filled by an individual. Someone's life can be considered unbalanced

5
when the amount of time one works causes some sort of conflict or stress in other areas
of life. The choices people make about their priorities can cause conflict with bosses,
coworkers and/or family members. Stress can also be due to spillover where a person is
worrying about life issues while at work and worrying about work issues while at home.
Stress can also come from feelings of guilt about the choices being made (Quick et al.,
2004). Someone’s work life balance is primarily based on their own perception of
balance.
Throughout history people have worked hard to make a living and to survive in
difficult economic times. So what has changed? There have been societal and
technological changes since the 1950's that have impacted both sides of the work life
balance equation. These changes include the loss of traditional gender roles that defined
who was responsible for managing the “life” half of the equation. They also include
technological and economic changes that have raised expectations of employees
increasing the pressure on the “work” half of the equation.
Managing life responsibilities
During the 1940’s, and 1950’s, men managed work and women managed life.
Women took care of not only the housework, but also the emotional work of running the
family (Moen, 1998). This division of labor minimized the impact on the family when a
father needed to increase his focus on work. If the children were ill or even if an elderly
relative needed care, the work routine would not be disrupted because the wife would be
responsible for those tasks (Moen, 1998). The roles of housekeeper and breadwinner
were defined and assigned to specific individuals. In addition, the emotional roles of
worrying about children and worrying about financial stability were also defined and

6
assigned. Each partner knew their role and their domain of control and could trust the
other partner to handle their responsibilities. O'Toole and Lawler (2006) note that the
biographies of CEOs over the past fifty years are examples of these traditional marriages
where these men could rely on a stay at home wife to manage the family. These CEOs
are the ones currently determining work life balance policies for their employees.
A major change that occurred in the 1960’s and 1970’s was the significant
increase in women entering the labor force, as well as the significant increase in single
parent homes. This blurred the gender boundaries that defined who is responsible for
work issues and who is responsible for life issues (Quick et al., 2004; Greenblatt, 2002).
With the gender roles becoming less defined, there is the opportunity for more work life
spillover. All employees, both male and female, now deal with aspects of homemaking
and breadwinning. This can result in people experiencing more worry about life issues
during work hours and because they feel guilty about the intrusion of their personal life
on their work life, they may also begin to experience more worry about their job during
life hours (Quick et al., 2004).
Generational differences managing life issues
Baby Boomers are the generation with the least amount of experience dealing
with changing gender roles. It was during their working years that the gender boundaries
began to fade. As the Baby Boomers entered the workplace, businesses had a template
for a successful worker. He was male, he was committed to a long-term position at a
company and he did not let his personal life interfere with work (Moen, 1998). This is
not to say that he did not care for or worry about his family, but he was expected to put
that aside for the sake of his career and he was both rewarded by his company and by

7
society for doing so (Moen, 1998; Williams & Cohen Cooper 2004). As Baby Boomer
women entered the workplace, they also used the male template as a gauge for evaluating
their own experience and so did everyone else, including their managers and coworkers
(Moen, 1998). This template assumes that work life balance is achieved by having a wife
at home to handle the “life” part of the equation. This is unrealistic for women.
The background of the Gen X'ers with respect to work life issues is quite
different. These latchkey kids could be seen as the first victims of work life balance
issues. They grew up with an acceptance of women in the workplace and an attitude
about the sacrifices required for success. They saw their parents make sacrifices for work
that were not always rewarded (Jurkiewicz, 2000). They came to view work as more of a
means to an end and they do not believe they can have it all. They entered the work force
expecting to have to face difficult choices with respect to work and life. This generation
is less likely to put work at the center of their lives than Baby Boomers and more likely to
choose not to advance their career when there is a negative trade-off with their personal
life (American Business Collaboration, 2004). They also developed feelings of
resentment due to the amount of time and energy their parents devoted to their jobs
(Zemke et al., 2000).
Millennials are just joining the work force with the oldest members only 26 years
old. They have therefore, had less experience balancing work and life than the older
generations. Another key characteristic of this generation is that the changes that have
been stressful for Baby Boomers and Gen X'ers are taken for granted by Millennials.
Diversity in the workplace is expected. Women work and 50% of kids live in single
parent families. These are not seen as issues to discuss; rather they are seen as facts of
8
life in today's society (Zemke et al., 2000).
Overall, it is expected that Baby Boomers will report less work life balance
because they have experienced the most change with regard to traditional gender roles
and have the least experience managing that change. While Gen X’ers and Millennials
have grown up accustomed to working women, family responsibilities are still managed
predominantly by women (Singleton & Maher, 2004). Therefore, it is expected that
women overall will report more work life imbalance, regardless of the generation.
Hypothesis 1: Baby Boomers will report less work life balance than Gen X’ers or
Millennials
Hypothesis 2: Women will report more work life imbalance than men, regardless
of the generation.
Managing work expectations
One of the struggles with work life balance is to maintain this balance while still
being viewed as a “good employee”. What is it that defines a “good employee” or a
“good organizational citizen”? Organ (1997) defined organizational citizenship behavior
as “contributions to the maintenance and enhancement of the social and psychological
context that support task performance” (p. 91). He further explained that these behaviors
are not usually part of a formal job description nor do they have direct ties to a formal
reward system. One type of organizational citizenship behavior includes individual
initiative behaviors where employees focus on task related behaviors but at a level that
“is so far beyond minimally required or generally expected levels that it takes on a
voluntary flavor” (Podsakoff, MacKenzie, Paine, & Bachrach, 2000, p. 524). Examples
of these behaviors for white collar workers include checking email from home, working

9
during days off, and attending work related functions on personal time (Bolino &
Turnley, 2005).
While the idea of going above and beyond expectations at work is not new, there
have been changes in the workplace that have raised those expectations and removed
some of the physical restrictions that limited employee initiative. In the 1990's, new
technology became available that enabled employees to be able to work from anywhere
and set their own hours. Email, laptops, cell phones and Blackberries® all made it
possible to be connected 24 X 7 (Quick et al., 2004). It is no longer necessary to go to
the office to do work. That meant that during evenings, weekends, holidays and
vacations, workers can access all the information they need to work (Greenblatt, 2002;
O'Toole & Lawler, 2006). Also, with more global competition, the definition of the work
day is less clear. Business may end at 5:00 EST in New York but goes until 8:00 EST in
California and even later in China. The sun no longer sets on many business empires.
But with this new ability to work anytime and anywhere came the expectation to work
anytime, anywhere (O'Toole and Lawler, 2006).
What used to be considered above and beyond has now become expected with
employees feeling pressure to exhibit more individual initiative behavior (Perlow, 1998).
What used to be considered voluntary is now perceived to be part of the job requirements.
Bolino and Turnley (2005) posited that employees who exhibit more individual initiative
behavior would most likely have less time and energy for other aspects of their life,
specifically their family. Their study found that there was a positive relationship
between the amount of individual initiative behavior and work-family conflict, as well as
job stress and role overload. Although these types of behaviors seem to contribute to the

10
work life imbalance, companies continue to reward employees for these types of
behaviors implicitly, if not formally (Werner, 1994).
Generational differences with respect to individual initiative behaviors
Each generation’s outlook on business and success may affect their behavior with
respect to work life balance. One of the things that Baby Boomers value at work is
visibility. They want to be seen and they want credit for their hard work. The Baby
Boomer generation represented the first period of US population growth in 200 years
(Zemke, Raines, & Filipczak, 2000). This meant that wherever Baby Boomers went,
there were a lot more of them. This is the generation that learned early that they need to
stand out to be noticed and to succeed (Lancaster & Stillman, 2002). This belief could
certainly encourage them to not only engage in individual initiative behavior but to be
vocal about those behaviors to ensure they got credit. Baby Boomers also have an
optimistic outlook with respect to business and success. This optimistic outlook could
also encourage more individual initiative behavior because Baby Boomers would trust
that they would be rewarded in the long run by going above and beyond expectations.
Gen X'ers have been labeled the “slacker” generation that has no work ethic.
Zemke et al. (2000) propose that Gen X’ers actually have a different work ethic. They
explain that Gen X'ers are very willing to work hard but tend to focus more on getting the
job done rather than the time it takes to do the work. They value freedom and flexibility
in the workplace and want to be evaluated more for their results than the hours they work
(Zemke et al.; Jurkiewicz, 2000). Unlike their Baby Boomers predecessors, who focused
more on the effort required, Gen X'ers feel that employees should be rewarded for
efficiency instead (Lancaster & Stillman, 2002). While employees generally understand
11
that engaging in more individual initiative behavior usually results in more rewards at
work (Werner, 1994), Gen X'ers may have more difficulty engaging in this behavior.
First of all, they tend to resist the inefficiency of working to put in the hours rather than
to complete a specific, important task. They may also be uncomfortable with the fact that
the rewards for this behavior may not be immediate (Lancaster & Stillman, 2002). This
is the generation that does not trust any institution and is skeptical of promises of future
rewards. They are willing to work hard when they understand the rewards associated and
perceive value in those rewards.
Zemke et al. (2000) compared Millennials to the Veteran generation that preceded
the Baby Boomers. They said that Millennials are more morally conservative and more
willing to work for the common good. They are more trusting of management and more
willing to work hard but they also have a drive for success that will not allow them to
stay committed to just one company (Lancaster & Stillman, 2002). They may exhibit
more individual initiative behavior because they are committed to the success. Since
birth their highly involved parents have been both encouraging and advocating for their
success and high achievement (Murray, 1997; Giordani, 2005). They are also more team
oriented than their Gen X'er coworkers and may exhibit more loyalty to the team and
organization (Murray, 1997). The blurred boundaries between work and life due to
technology will not be difficult for this generation. They are already “connected” before
they reach the workplace (Giordani, 2005). With instant messaging, MySpace, iPods,
etc. this generation takes technology for granted. They are not naive about the impact
these technologies may have on their work life balance and value work that they enjoy
(Lancaster & Stillman, 2002).

12
It is expected the Millennials and Baby Boomers may report more individual
initiative behavior than Gen X’ers due to their different beliefs about organizations. Both
Baby Boomers and Millennials have a more positive view of work and organizations than
Gen X’ers. It is expected that women and men feel the pressure to be good
organizational citizens equally but that women will report engaging in less individual
initiative behavior. Since women still manage more of the family responsibilities, they
may simply have less opportunity to engage in individual initiative behavior even though
they know it would positively impact their careers.
Hypothesis 3: Millennials and Baby Boomers will report more individual
initiative behavior that Gen X’ers.
Hypothesis 4: Men will report more individual initiative behavior than women
regardless of generation.
Work Life Balance Programs
Usage of work life balance programs
In response to all of the attention from employees and the media, companies have
begun to introduce many programs to help with work life balance. Some of these
programs include, part-time work, job sharing, working from home both occasionally and
full-time, and allowing leave for education or family matters (De Cieri, Holmes, Abbott
& Pettit, 2005). Although many companies do now offer some work life balance
programs, many of these benefits are not being used (Nord, Fox, Phoenix & Viano,
2002). While some of the reasons include poor communication about program
availability and improper implementation (De Cieri et al., 2005), other factors include
fear of how participation will affect an employee’s career (Nord et al., 2002). De Cieri

13
et al. found that in 50% of the companies surveyed in Australia, fewer than 20% of the
employees participated in work life balance programs. Providing vacation time is
probably the most common and most traditional program that can assist work life balance
and many employees do not even take full advantage of their vacation time. The
Families and Work Institute (2005) found that while 79% of employees have paid
vacation, 36% do not plan to take the full vacation time allotted to them. They also found
that on average Americans take 14.6 vacations days annually (roughly 3 weeks).
Employees who find it difficult to miss more than 3 weeks during an entire year may be
less likely to take advantage of a much longer family leave.
Nord et al. (2002) interviewed employees of two consulting firms to understand
some of the difficulties employees have with work life balance programs. They
interviewed employees that were taking advantage of telecommuting and a reduced work
schedule. Some of the comments they received from participants include concerns that
the programs are incompatible with the existing practices of assigning work and assessing
performance; feelings of isolation while working at home; and lack of true support from
their immediate manager. This last concern was experienced as subtle negative
communication from managers and coworkers that reinforces the idea that participation
in work life balance programs was counter to the organizational culture.
Generational beliefs about career risk
The Baby Boomers’ need to stand out and be visible may be incompatible with
some work life balance programs that result in less time physically at work. With this
perspective it could even be difficult to switch to a less visible home based office even
though the job responsibilities remained unchanged (Lancaster & Stillman, 2002). Baby

14
Boomers may also perceive more risk in work life balance programs because, unlike Gen
X’ers, they equate job security with career security (Lancaster & Stillman, 2002). Gen
X'ers may actually be more cynical about a company’s true commitment to a work life
balance program, but they may perceive the risk of using one of the programs as being
more limited than do Baby Boomers. Gen X'ers have a broader view of their career that
does not rely on one company or even a small number of companies. The commitment is
still there but to one's career, not to a particular job (Lancaster & Stillman, 2002;
Jurkiewicz, 2000). Murray (1997) stated “They resist fixed rigid or closed off futures.
X'ers insist upon keeping their options open, seeing much of the work world as a maze of
ruts from which one can never escape” (p. 38). While utilizing a reduced workload
program at one company may give management a view that they are less committed, that
is only the view of their current company. If the opportunities are not available there,
they can always go somewhere else.
Having grown up during difficult times, Gen X’ers, are also hardened to
economic realities and have lowered their expectations of success. They know they will
not necessarily do better than their parents. That is different from the pressure to succeed
that Baby Boomers carry with them. Gen X'ers are survivors that learned the harsh
realities of work life balance early on. They are self reliant and look out for themselves
(Zemke et al., 2000). These attitudes and experience may better equip them to make
more conscious decisions about when to utilize work life balance programs to help them
to create a more balanced life for themselves.
Millennials may also be more likely to take advantage of any work life balance
programs but possibly for different reasons. While a cynical Gen X’er may choose to

15
accept any risk necessary to achieve balance, a Millennial may trust their organization to
support them in their desire for work life balance. Raised by parents that valued their
input, Millennials will be more likely to speak out about the issues with specific
programs and will expect their opinion to be valued (Lancaster & Stillman, 2002).
It is therefore expected that Baby Boomers will report less usage of work life
balance programs as compared with both Millennials and Gen X’ers. It is expected that
both Baby Boomers and Gen X’ers will report more perceived risk of using one of these
programs than their optimistic, Millennial counterparts. It is also expected that women
will report more usage of work life balance programs than men, despite reporting the
same level of perceived risk. Traditionally, women have held more family responsibility
than men and, while men have been more involved in recent years, it is expected that
women still retain the majority of those responsibilities. Therefore, women are still more
likely than men to sacrifice their career for their family goals.
Hypothesis 5: Baby Boomers will report less usage of work life balance
programs than Millennials and Gen X’ers.
Hypothesis 6: Women will report more usage of work life balance programs
than men, regardless of generation.
Hypothesis 7: Baby Boomers and Gen X’ers will report more perceived risk of
using one of these programs than Millennials.
METHOD
Participants
This study surveyed the alumni population from the State University of New York
(SUNY) at New Paltz. As mentioned previously, the generations that were targeted were

16
Baby Boomers, Gen X'ers and Millennials. The study was designed to sample alumni to
ensure participation from all three targeted generations, as well as targeting participants
who have some experience with work and career. Those two conditions precluded a
study that focused on current SUNY New Paltz students. This study also focused
exclusively on people born and raised in the United States. The major events and the
social and economic trends that influence the values for each of these generations are
those that are specifically relevant to the Unites States. While other areas of the world
may be impacted by these trends and events, that impact is not universal. Also there are
other local phenomena occurring around the world that would create unique experiences
for people in other geographic areas. The generational definitions on which this research
is based are specifically applicable to people born and raised in the United States. The
results of this research cannot be generalized to generations in other countries.
Measures
A paper and pencil survey was mailed to all potential participants. This method
was chosen over a web-based survey so as not to skew the results to younger more
technologically adept Baby Boomers. Participants were asked to fill out the survey and
return it by mail. It was expected that 10% of those who receive the survey will respond.
Therefore 3000 surveys were mailed.
The survey included 4 parts (see Appendix A) including 3 scales and
demographic information. The demographic questions asked about age, gender, country
of origin and current employment status. Age was used to determine in which
generational cohort the participant was placed. The analysis also examined gender
differences across these generations.
17
The first scale is the Work Interference with Personal Life (WIPL) scale
developed by Fisher-McAuley et al. (2003) and validated by J. Hayman (2005). Fischer-
McAuley et al. (2003) report the Cronbach alpha for this scale as α = .87. This scale was
chosen over other various family-work conflict scales as to be relevant for participants
who do not have family responsibilities but still may experience work impinging on their
personal life. This scale assesses if the participants currently feel that they had a balance
between work and life. This scale has 7 items and participants respond using a 5 point
Likert scale. Item 7 is reverse scored. Scores can range from 7 – 35 with a higher score
signifying less balance.
The second scale was designed to measure how often the participants engage in
individual initiative behaviors. This scale was developed by Bolino and Turnley (2005)
and contains 15 items. They report that the Cronbach’s alpha for this scale as α = .91.
Participants respond as to how often they engage in these specific behaviors using a 5
point Likert scale. Scores can range from 15 – 75 with the higher score signifying more
frequent engagement in these behaviors.
The third scale was designed to measure the participants’ usage of work life
programs and their view of the risks inherent in each program. This scale was created by
the researcher for this research project. Items included in the list of work life balance
programs were those mentioned in the literature discussing work life programs (Sullivan
& Mainiero, 2007; Kirby and Krone 2002; Allen, 2001; DeCiera et al., 2005). For each
of 12 programs the participant was asked to state whether their current employer provides
this program; their perception of the risk involved in using the program; and the
likelihood that they would use this program at some point in their career. The first

18
question was included to gather information on the current work life balance programs
being offered by employers. The second question was scored on a 5 point Likert scale.
Scores can range from 12 – 60 with the higher scores representing a perception of higher
risk. The third question presented participants with a 5 point Likert scale and an
additional 6th choice for programs that they considered not applicable. It also contained
an addition item that asked whether they take all of their allocated vacation time.
Questions that were answered as Not Applicable were scored the same as very unlikely or
1. These questions were therefore scored on a 5 point scale and scores could range from
13 – 65.
Scores from the three scales were analyzed separately to see if there are
significant differences in scores on each scale between generational cohorts. In addition,
scores for WIPL, individual initiative behavior and work life balance program usage were
analyzed to see if there were significant differences between genders regardless of
generational cohort. An analysis was also done to determine if there was a significant
correlation between scores of the WIPL scale and the individual initiative scales
regardless of gender and generational cohort.
Procedure
Prospective participants were obtained by working with the alumni office at
SUNY New Paltz. A list of 3000 alumni was generated randomly to determine who
would receive the mailed surveys. This was a stratified sample based on the year of
graduation. 1000 names were sampled randomly from each of the following groups:
Baby Boomers were sampled from the classes of 1968 through 1986; Gen X’ers were
sampled from the classes of 1987 through 2002; Millennials were sampled from the
19
classes of 2003 through 2006. The year of graduation did not guarantee that these
potential participants would fall into those generational cohorts but it was the best
approximation due to the fact that the age of each alumnus was not available. The year of
graduation was only used for sampling and not for data analysis. Actual age was used for
data analysis.
Each potential participant was mailed a package that included a letter, the survey
instrument and a postage paid return envelope. The letter described the research being
conducted and explained that they were chosen because they are alumni of SUNY New
Paltz (Appendix B). It included the criteria for participation. Alumni needed to be 61
years old or younger and must have been born and raised in the United States. The letter
asked them to complete the survey if they met the criteria for participation. It was
expected that the survey would take less than 15 minutes to complete. They were
instructed to place the completed survey in the postage paid envelope and mail it back.
They were thanked for their participation. Surveys were returned to the researcher at the
Psychology department office at SUNY New Paltz. Once the surveys had been removed
from their envelopes (which could have contained return address information if added by
the participant) there was no identifying information on the survey that could connect
them with the participant. Any incomplete surveys that were returned were counted and
then discarded. Any surveys that were returned from alumni who were not born and
raised in the US or are older than 61 years of age were included in the demographic
information but not the analysis of the scales. A response rate of at least 10% was
expected in order to have at least 100 participants from each generational cohort.

20
RESULTS
Of the 3000 surveys that were mailed, 559 participants responded. Of those
returned responses, 11 did not fill out the survey stating that they were not eligible due to
age. There were two participants who did not fill out the survey stating that they felt they
did not qualify because they were retired and two surveys that were returned blank. One
response was received in error. Data from a total of 543 surveys were entered. In
addition, 165 change of address notifications were received. It is not possible to
determine how many of those represent potential participants who never received the
survey, however. It is also not possible to know in which generation they would have
fallen. There were five participants who returned the survey after filling out some
demographic information but not filling out any of the questions relating to the scales.
Every survey that had some information was included in the demographic analysis.
There were 543 participants that were included in the demographic analysis. Of
these six participants did not report their age, 272 (50%) were in the age range of Baby
Boomers, 171 (32%) were in the age range of Gen X’ers, and 89 (16%) were in the age
range of Millennials. There were five participants who were older than 61 years but still
filled out some of the questionnaire. They were included in the demographic analyses
but not in the rest of the analyses. Millennials returned the survey at the lowest rate.
Almost twice as many Gen X’ers returned the survey and three times as many Baby
Boomers responded. One possible reason for fewer responses from Millennials is that the
addresses for those alumni may have been the least accurate. Younger graduates are more
likely to relocate after graduation. The participants were primarily Caucasian (n = 464,
86%) with African American as the next larger group represented (n = 17, 3%). In
21
addition there were 14 participants who reported being Hispanic (3%), ten who reported
being Asian (2%), one reported being Native American (0.2%) and 29 who reported that
they were multiracial, other, or preferred not to provide their ethnicity (5%). The Baby
Boomer cohort had the largest percentage of Caucasian participants with 91% (n = 248)
and the Millennial cohort had the lowest percentage of Caucasians with 79% (n = 70).
There were a total of 370 women and 162 men who responded. Both the Baby Boomer
group and the X’er group were approximately 31% male. The Millennial group had
fewer men with only 24%. Several people did not report their gender (n = 10) and one
participant identified as transgender and did not choose a specific gender. The majority
of the participants held only one job (n = 406, 75%). There were 90 participants who
held two jobs, 14 participants who held three jobs and 2 participants who held four jobs.
Baby Boomers were somewhat more likely to hold only one job (79%) than were Gen
X’ers (73%) and Millennials (73%). The majority of the participants reported that they
were married or in a civil union (n = 299, 55%); 149 participants (27%) reported that they
were single; 54 participants (10%) reported that they were divorced and 32 participants
(6%) reported that they were living with someone. There were seven widows/widowers
(1%) in the study. Several participants (n = 5) reported more than one answer for marital
status. Baby Boomers were more likely to report that they were married (70%) than
either Gen X’ers (57%) and Millennials (9%). Baby Boomers were also more likely to be
divorced (14%) than Gen X’ers (8%) or Millennials (1%). Millennials were more likely
to be single (80%) or living with someone (9%) than either Gen X’ers (single 29%, living
with someone 6%) or Baby Boomers (single 10%, living with someone 5%)
Participants did not answer the questions on children consistently. Some

22
participants provided numbers and others checked off categories. Therefore it is not
possible to accurately report the number of children that participants had. Certain
assumptions were made in order to interpret the data. Participants that checked a
category were coded as having one child in that age group. Participants who filled in
data in one age group and left the remaining age groups blank were interpreted to have no
children in those other age groups. Participants who did not fill out any of the age
groups were left blank. A total number of children was calculated but that number can
only be used to identify participants who have at least one child in any age group since
the number of children was not always reported. The majority of participants (n = 378,
70%) reported having at least one child, 124 participants (23%) reported having no
children, and 41 participants (8%) did not provide information about their children.
Baby Boomers were more likely to have children (n = 233, 86%) than Gen X’ers (n =
112, 66%) and Millennials (n = 28, 31%). As expected, the older generational cohorts
were also more likely to have older children, but all groups reported having children
under the age of 4. Gen X’ers were the most likely to have children from the youngest
age group with 49% (n = 84). Baby Boomers were the least likely with only 15% (n =
41) and 30% of Millennials reported having children in the youngest age group (n = 27).
Baby Boomers reported children older than 24 (n = 113, 42%) more often than children
in other age groups.
Work Life Balance
Scores for work life balance were determined by adding the individual scores on the 7
questions. The 7th question was reverse scored. If participants wrote in a value of Not
Applicable for any questions, a value of 3 was substituted. The value of 3 represented an

23
answer of Neither Agree nor Disagree and therefore was the most neutral value. The
mean answer for each question was substituted for missing data. A one way ANOVA
was conducted to determine if there was a significant difference in perceived work life
balance by participants from different generations. The first hypothesis of this study
posited that Baby Boomers would report less work life balance than Gen X’ers or
Millennials. Higher values for the work life balance score represent less work life
balance or more work life imbalance. Table 1 shows that Baby Boomers in this study did
report higher work life imbalance than Gen X’ers and Millennials. A one way ANOVA
was conducted to determine if there was a significant difference in the means. The results
approached significance, F(2,494) = 2.84, p = .06. Therefore this hypothesis was not
fully supported. Because the results did show that the means for the three groups in this
study were in the expected direction, this suggested that additional research should be
encouraged.
Table 1
Descriptive Statistics for Work Life Balance Scores by Generation
Generation n M SD
Millennials 85 19.28 5.94
Gen X’ers 155 19.40 6.62
Baby Boomers 257 20.82 7.27
Total 497 20.11 6.85
The results also did not support the second hypothesis that stated that women would
report higher work life imbalance. Table 2 shows the descriptive statistics for both men

24
and women. An independent t-test was conducted but no significant difference was
found between the means, t(494) = 0.50, p = .62. This result is surprising as much of the
literature for work life balance focuses on the issues that women face balancing work and
family. This analysis only examined whether there were differences between genders
regardless of their generation, however. The difference between men and women with
respect to work life balance may not be consistent across generations. More analysis
should be done to better understand the relationship within a specific generation.
Table 2
Descriptive Statistics for Work Life Balance Scores by Gender
Gender n M SD
Male 155 19.88 6.71
Female 341 20.21 6.89
Individual Initiative Behavior
Scores for individual initiative behavior were determined by adding the individual
scores on the 12 questions. If participants wrote in a value of Not Applicable for any
questions, a value of 1 was substituted. The value of 1 is equal to never doing the
behavior in question. The mean answer for each question was substituted for missing
data. A one way ANOVA was conducted to determine if there was a significant
difference between the frequency of individual initiative behaviors of participants in
different generations. The third hypothesis of this study posited that Millennials and
Baby Boomers would report more individual initiative behavior that Gen X’ers. Higher
scores represent more frequent engagement in individual initiative behaviors. Table 3

25
shows that Baby Boomers in this study did report higher frequency of engagement in
these behaviors than Gen X’ers but their reported frequency of engagement was also
higher than Millennials as well. A one way ANOVA was conducted to determine if any
of the mean differences were significant. The results of the ANOVA showed that there
were significant differences between the groups, F(2,494) = 3.34, p = .04. The strength
of the relationship between generation and individual initiative behavior scores is small
(η2 = .01). Because these results did not support the hypothesis specifically, a Tukey
HSD post hoc analysis was done to determine which groups were significantly different.
The results of that analysis show that Millennials actually exhibit individual initiative
behavior significantly less frequently than Baby Boomers (p = .04). The amount of
engagement in individual initiative behavior reported by Gen X’ers was not significantly
different from either Baby Boomers or Millennials. These results do not support the
hypothesis but do provide some evidence of generational differences in behavior at work.
Table 3
Descriptive Statistics for Individual Initiative Behavior Scores by Generation
Generation n M SD
Millennials 85 35.95 11.15
Gen X’ers 155 37.62 10.56
Baby Boomers 257 39.14 9.84
Total 497 38.12 10.35
An independent samples t-test was conducted to see if there was any difference
between men and women for the amount of reported individual initiative behavior. As

26
with the work life balance results, there was no significant difference between the two
genders in the amount of reported behavior t(494) = 0.40, p = .69. Men in this sample
reported more individual initiative behavior than women (see Table 4), but that result was
not significant.
Table 4
Descriptive Statistics for Work Life Balance Scores by Gender
Gender n M SD
Male 155 38.38 10.66
Female 341 37.99 10.23
The choice to include individual initiative behavior in this study was made due to
a theory that the amount of individual initiative behavior would be positively related to
work life imbalance. A correlation was conducted to see if such a relation could be
found. The analysis showed a significant, positive relationship between work life
imbalance and the frequency of individual initiative behavior, (r = .37, p = .01). Bolino
and Turnley (2005), who created the individual initiative behavior scale, found a
correlation between scores for their scale and scores for work stress but did not compare
it to work life balance data.
Work Life Balance Programs
The questions concerning work life balance programs asked participants
about 15 specific programs. Participants were asked about whether or not their company
offered the program; what they felt was the risk associated with using the program; and
how likely they were to participate. Many of the participants did not complete all of the
27
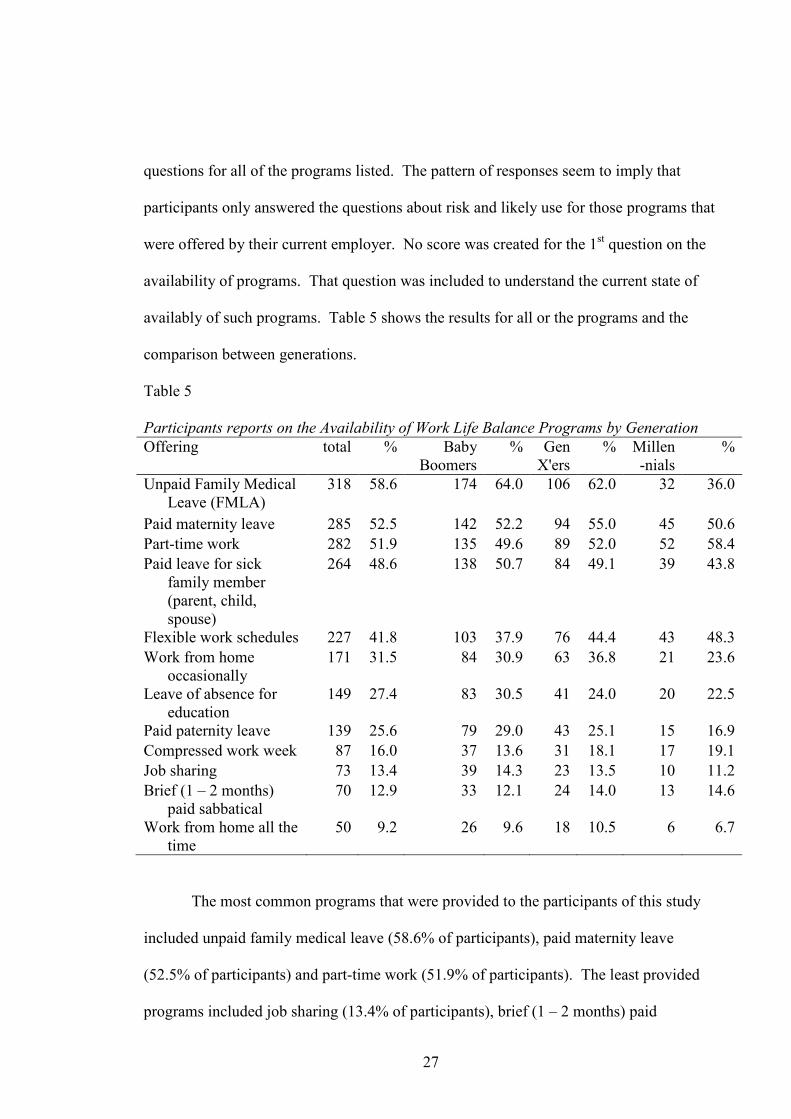
questions for all of the programs listed. The pattern of responses seem to imply that
participants only answered the questions about risk and likely use for those programs that
were offered by their current employer. No score was created for the 1st question on the
availability of programs. That question was included to understand the current state of
availably of such programs. Table 5 shows the results for all or the programs and the
comparison between generations.
Table 5
Participants reports on the Availability of Work Life Balance Programs by Generation
Offering total % Baby
Boomers
% Gen
X'ers
% Millen
-nials
%
Unpaid Family Medical
Leave (FMLA)
318 58.6 174 64.0 106 62.0 32 36.0
Paid maternity leave 285 52.5 142 52.2 94 55.0 45 50.6
Part-time work 282 51.9 135 49.6 89 52.0 52 58.4
Paid leave for sick
family member
(parent, child,
spouse)
264 48.6 138 50.7 84 49.1 39 43.8
Flexible work schedules 227 41.8 103 37.9 76 44.4 43 48.3
Work from home
occasionally
171 31.5 84 30.9 63 36.8 21 23.6
Leave of absence for
education
149 27.4 83 30.5 41 24.0 20 22.5
Paid paternity leave 139 25.6 79 29.0 43 25.1 15 16.9
Compressed work week 87 16.0 37 13.6 31 18.1 17 19.1
Job sharing 73 13.4 39 14.3 23 13.5 10 11.2
Brief (1 – 2 months)
paid sabbatical
70 12.9 33 12.1 24 14.0 13 14.6
Work from home all the
time
50 9.2 26 9.6 18 10.5 6 6.7
The most common programs that were provided to the participants of this study
included unpaid family medical leave (58.6% of participants), paid maternity leave
(52.5% of participants) and part-time work (51.9% of participants). The least provided
programs included job sharing (13.4% of participants), brief (1 – 2 months) paid
28
sabbatical (12.9% of participants) and work from home all the time (9.2% of
participants).
Scores for the risk associated with work life balance programs were calculated by
adding up the individual scores and dividing by the number of questions that were
answered. Questions answered as not applicable were treated as unanswered. This gives
a mean assessment of risk for each participant. A total score was not useful because the
participant answered a varying number of questions. The seventh hypothesis stated that
Baby Boomers and Gen X’ers would report more perceived risk of using one of these
programs than Millennials. The results of this study do not support that hypothesis
because Millennials reported the highest level of perceived risk (see Table 6) and Baby
Boomers reported the least amount of risk. A one way ANOVA was conducted to
determine if the mean of these values were significantly different between generational
groups. The results of this analysis show that there are significant differences between
the groups F(2,417) = 4.35, p = .01. The strength of the relationship between generation
and perception of risk was small (η2 = .02). Since the results do not support the
hypothesis, a Tukey HSD post hoc analysis was run to determine which groups were
significantly different from each other. This analysis showed that there is significance
difference between the level of perceived risk for Baby Boomers and Millennials at p =
.04. Millennials perceive significantly more risk to work life balance programs than do
Baby Boomers.

29
Table 6
Descriptive Statistics for Perceived Risk of Work Life Balance Programs by Generation
Generation n M SD
Millennials 77 2.00 1.02
Gen X’ers 131 1.93 .95
Baby Boomers 212 1.69 .93
Total 420 1.82 .96
The data that participants provided for likely usage of work life balance programs
had similar issues to the questions pertaining to risk. Applicants tended to answer only
for those programs that their companies offered. Many participants left questions blank
or marked several as not applicable. To calculate a score for usage of work life balance
programs, questions that were left blank or marked not applicable were not used.
Individual answers were added together and then divided by the number of questions
used in calculating that total. This provided a mean of the likelihood of using a work life
balance program for each participant. The fifth hypothesis stated that Baby Boomers will
report less usage of work life balance programs than Millennials and Gen X’ers. Baby
Boomers in this study did report less usage of work life balanced programs than both Gen
X’ers and Millennials (see Table 7).

30
Table 7
Descriptive Statistics for Work Life Balance Program Usage by Generation
Generation n M SD
Millennials 85 3.33 .93
Gen X’ers 148 3.10 .99
Baby Boomers 239 2.77 1.03
Total 472 2.97 1.02
A one way ANOVA was conducted to determine if these group differences were
significant. The results of the ANOVA showed a significant difference between the
groups, F(2,469) = 11.49, p = .00. There was a medium relationship between generation
and usage of work life balance programs (η2 = .05). Two independent sample t-tests
were conducted to test the specific hypothesis and to determine if there was a significant
difference between Baby Boomers and both Gen X’ers and Millennials. The first t-test
compared the means between Baby Boomers and Millennials and found a significant
difference, t(322) = 4.38, p = .00. The second t-test also found a significant difference
between Baby Boomers and Gen X’ers t(385) = 3.14, p = .00. These results support the
hypothesis that Baby Boomers are less likely to take advantage of work life programs
than both of the younger generations.
The sixth hypothesis stated that women will report more usage of work life
balance programs than men, regardless of generation. An independent samples t-test was
conducted to see if there was a significant difference between likely usage for men and
women. This analysis found a significant difference between the two group t(468) = -

31
2.93, p = .00. The strength of the relationship between gender and use of work life
balance programs is small (d = .29) Women reported more likely usage of work life
programs than men (see Table 8).
Table 8
Descriptive Statistics for Usage of Work Life Balance Programs by Gender
Gender n M SD
Male 144 2.76 .94
Female 326 3.06 1.04
Summary
Two hypotheses were supported: hypothesis 5 - Baby Boomers will report less
usage of work life balance programs than Millennials and Gen X’ers and hypothesis 6 -
women will report more usage of work life balance programs than men, regardless of
generation. Three hypotheses were not supported: hypothesis 1 - Baby Boomers will
report less work life balance than Gen X’ers or Millennials; hypothesis 2 - women will
report more work life imbalance than men, regardless of the generation; and hypothesis 4
- men will report more individual initiative behavior than women regardless of
generation. The analysis for the remaining two hypotheses produced significant results
but they were contradictory to the stated hypotheses. Hypothesis 3 stated that
Millennials and Baby Boomers will report more individual initiative behavior than Gen
X’ers. The results showed that Baby Boomers reported more individual initiative
behavior than Millennials and both groups were not significantly different from Gen
X’ers. Hypothesis 7 stated that Baby Boomers and Gen X’ers will report more perceived
32
risk of using one of these programs than Millennials. The results showed that Millennials
in this study reported the most perceived risk and that this perception was significantly
higher than for Baby Boomers.
LIMITATIONS
While the data does indicate the existence of some generational differences with
respect to views of work life balance, there are certain restrictions on how the results can
be generalized across the population. The sample used in this study included only
college educated participants. This implies a certain socioeconomic status. The sample
was also overwhelmingly Caucasian and therefore not ethnically diverse. These
restrictions need to be considered in conjunction with the overall theory being tested.
The premise for generational differences requires that members of each cohort experience
similar circumstances throughout their childhood. Zemke et al. (2000) stated that the
similarities within a generation exist regardless of ethnicity or socioeconomic status.
The results from this study cannot be generalized to other ethnicities or to other
socioeconomic statuses. Additional research with a more diverse sample should be
conducted to see if these results can be replicated.
This study is also limited because the participants are graduates of the same
college. One of these limitations is geographic. This study only asked if participants
were born in the United States. It is not possible to determine if the sample was
geographically dispersed. The participants were all graduates of a New York state
university so it is likely that the majority of participants were born in or near the state of
New York. In addition, this college may attract students with similar values. Often the
choice of a college is related to the choice of a career so it is possible that alumni of a

33
specific school could share values around work life balance. It is also possible that this
study over sampled women, especially in the Millennial generation. In recent years the
ratio of women to men at SUNY New Paltz has increased. This may partially explain the
small number of Millennial men who participated.
DISCUSSION
The first two scales that were analyzed attempted to show differences between
generations relating to their ability to achieve work life balance and potential behaviors
that could contribute to work life imbalance. The results did show that there is a
relationship between engaging in individual initiative behaviors and a perception of work
life imbalance. The results also suggest that Baby Boomers engage in those behaviors
more than Millennials. This could be evidence of the younger generation being less
willing to making personal sacrifices for their career. The generational differences in the
participants’ perception of their current work life balance were not significant in this
study. In this sample there was a trend towards better balance in the younger generations,
as hypothesized, which suggests the need for more research in the area of work life
balance and generations.
The analysis of the data related to work life balance programs also provided
evidence of generational differences. The analysis of participants’ willingness to use
work life balance programs showed a significant difference between Baby Boomers and
both Gen X’ers and Millennials. These results match the hypotheses showing evidence
that the generations do differ in their perception of these programs. The results of the
analysis of participants’ perception of risk, however, were surprising. It was expected
that the older generations would perceive more risk but the results showed that the
34
Millennials perceived more risk than the Baby Boomers. The results provide evidence
of significant generational differences but not in the expected direction. It was posited
that Baby Boomers would be more reluctant to use work life balance programs because
they perceived them to be riskier than other generation perceive them to be. This
indicates the need for more understanding about the barriers to work life balance
programs usage for Baby Boomers. It is interesting that the generational group that
perceives the most risk in work life balance programs is also the group most willing to
take advantage of these programs.
Alternative Explanations
This study has shown that there are some significant generational differences in
both behavior and perceptions related to work life balance. There are of course other
possible explanations for group differences. These include, gender differences, age
differences, and level of familial responsibilities at various life stages. This study
collected some relevant data regarding age, and familial responsibility as well as
conducting specific analyses with regard to gender.
Work life balance is often perceived as a “women’s issue. O’Toole and Lawler
(2006) stated that work life balance is associated with women because it became a more
prominent issue when women began entering the workforce in larger numbers. The
results of this study do not provide any evidence to support the theory that work life
balance is primarily a concern for women. The level of work life imbalance was not
significantly different for men or women overall when generation was not considered.
This suggests that the work life issues for men and women are more complicated and
need to be examined along with other factors such as age or generation. The results of

35
this study did however show that women across the generations are more willing to take
advantage of the work life balance programs that are offered. One argument may be that
the programs, having potentially been designed for women, are not as applicable to men.
That was accounted for in this study by allowing participants to state which programs
were not applicable to them and by calculating their score based only on applicable
programs. Therefore, women appear to be more willing to take advantage of programs
that are offered to help create a better balance in their lives. This indicates a need for a
focus on the reluctance men have to use the work life balance programs that are offered.
It is interesting to note that despite the fact that women claim to take more advantage of
work life balance programs, they do not consistently report better work life balance than
men. It is not clear from this study if the programs are not helpful or if, without the
option to use these programs, women’s work life balance would be worse than that of
men’s.
Another possible explanation for the generational differences found in this study
is that they have more to do with age than with generational cohorts. One of the results
from this study provides evidence that age alone may not be a factor. That result is the
perception of risk for work life balance programs. The expectation was that due to their
personal experience of seeing themselves or their parents not being rewarded for loyalty,
both the Baby Boomers and the Gen X’ers would see the most risk in company offered
benefits. It was expected that the “optimistic Millennials” who are more trusting of
institutions in general, would see less risk in the work life balance programs being
offered. The data from this study contradicts those expectations. Millennials in this
study viewed work life balance programs to be more risky. Common sense points to an

36
increase in cynicism with age. The accumulation of life experience removes some of the
naïve belief in people and the general good of the world. Each failure or disappointment
is supposed to create a wiser, more cautious person. Why then, do the youngest
participants in this study perceive more risk and suspicion in programs that were
designed to provide specific benefits to employees? One explanation is an increased
view by both children and adults that the world is now a dangerous place. Murray (1997)
refers to parents who must remain vigilant to protect their children from a variety of
threats. Zemke et al. (2000) discusses a subculture of violence that includes school
shooting perpetrated by Millennials against Millennials. If the world has changed to be
more dangerous, however, why has that not affected each generation equally? According
to Lancaster and Stillman (2003), events experienced during childhood are more likely to
affect how people see the world. This is the premise for generational differences.
Members of the same generational cohort may also be at similar life stages with
similar familial responsibilities. This could also be an explanation for generational
differences rather than a common set of experiences during childhood. Familial
responsibilities include, raising children, caring for aging parents, and whether or not a
person has a spouse or partner with whom to share those responsibilities. This study did
not specifically look at the relationship between these factors and work life balance.
There are, however some interesting characteristics of this sample that are worth
mentioning. The Baby Boomers in this sample reported the least work life balance of the
three generations but that cohort was also the most likely to be married (70%) and the
least likely to have children under the age of 4 (15%). This suggests an opportunity for
additional research that looks at both familial responsibility and generational differences
37
as factors relating to work life balance.
Conclusion
What can be concluded from these results with respect to the importance of work
life balance in the lives of these three generations? The results show that while there is
no significant difference in each generation's perception of their work life balance, there
are differences in the beliefs and behaviors with respect to work life balance. Baby
Boomers did not report better work life balance than the other generations. They did
however report that they were less likely to take advantage of work life balance programs
and were more likely to engage in frequent individual initiative behavior. This behavior
could imply less willingness to address work life balance issues. Conversely Millennials
are less likely to do the extra behaviors at work that relate positively to work life
imbalance and despite their belief that work life balance programs are risky, they are
more likely to take advantage of those programs offered. This may point to a more
determined attitude for taking control of their work life balance. It may show that in
addition to stating the importance of balancing their work and life, they may be more
willing to risk their careers to achieve it. These differences in both behaviors and
perceptions give evidence for generational differences in attitudes about work life
balance.

38
REFERENCES
Bolino, M. C., & Turnley, W. H. (2005). The personal costs of citizenship behavior: The
relationship between individual initiative and role overload, job stress, and work-
family conflict. Journal of Applied Psychology 90, 740-748.
De Cieri, H., Holmes, B., Abbott, J., & Pettit, T. (2005). Achievements and challenges
for work/life balance strategies in Australian organizations. The International
Journal of Human Resource Management, 16, 90 – 103.
Families and Work Institute, 2005, New study reveals one in three Americans are
chronically overworked: Triggers for overwork and solutions for workplace stress
are explored. Retrieved April 16, 2007, from
http://familiesandwork.org/site/newsroom/releases/2005overwork.html
Fisher-McAuley, G., Stanton, J., Jolton, J., & Gavin, J. (2003). Modelling the relationship
between work life balance and organisational outcomes. Paper presented at the
Annual Conference of the Society for Industrial-Organisational Psychology.
Orlando, April 12, 2003, 1-26.
Greenblatt, E. (2002). Work/life balance: Wisdom or whining. Organizational Dynamics
31, 177-193.
Hayman, J. (2005). Psychometric Assessment of an Instrument Designed to Measure
Work Life Balance, Research and Practice in Human Resource Management,
13(1), 85-91.
Jurkiewicz, C. L. (2000). Generation x and the public employee. Public Personnel
Management, 29, 55 – 74.
Lancaster, L. C., & Stillman, D. (2002). When generations collide: Who are they? Why
they clash. How to solve the generational puzzle at work. New York: Harper

39
Collins.
Moen, P. (1998). Recasting careers: Changing reference groups, risks, and realities.
Generations, 22, 40-45.
Murray, N. (1997). Welcome to the future: The millennial generation. Journal of Career
Planning and Employment, 57, 36-40.
Nord, W. R., Fox, S., Phoenix, A., & Viano, K. (2002). Real world reactions to work-life
balance programs: Lessons for effective implementation. Organizational
Dynamics, 30, 223-238.
Organ, D. W. (1997). Organizational citizenship behavior: It’s construct clean-up time.
Human Performance, 10, 85-97.
O’Toole, J., & Lawler, E.E., III, (2006). The new American workplace. New York:
Palgrave Macmillan.
Perlow, L. A. (1998) Boundary control: The social order of work and family time in a
high-tech corporation. Administrative Science Quarterly, 43, 328-357.
Podsakoff, P. M., MacKenzie, S. B., Paine, J. B., & Bachrach, D. G. (2000).
Organizational citizenship behaviors: A critical review of the theoretical and
empirical literature and suggestions for future Research. Journal of Management,
26, 513-563.
Quick, J. D., Henley, A. B., & Quick, J. C. (2004). The balancing act: At work and at
home. Organizational Dynamics, 33, 426-438.
Singleton, A., & Maher, J. (2004). The “new man” is in the house: Young men, social
change and housework. The Journal of Men's Studies, 12, 227-240.

40
Werner, J. M. (1994). Dimensions that make a difference: Examining the impact of in-role
and extrarole behaviors on supervisory ratings. Journal of Applied Psychology 79,
98-107.
William, J. C., & Cooper, H. C. (2004). The public policy or motherhood. Journal of
Social Issues, 60, 849-865.
Zemke, R., Raines, C., & Filipczak, B. (2000). Generations at work: Managing the clash
of veterans, boomers, xers and nexters in your workplace. New York: American
Management Association.

1
APPENDIX A
Part I - Check the answer that best describes how much you agree with each statement below Strongly
Disagree
Disagree Neither Agree
nor Disagree
Agree Strongly
Agree
1. My personal life suffers because of work.
2. My job makes personal life difficult
3. I neglect personal needs because of work
4. I put personal life on hold for work
5. I miss personal activities because of work 6. I struggle to juggle work and non-work.
7. I am happy with the amount of time for non-work activities
Part II - Check the answer that best describes how often you do the following activities Never Rarely Sometimes Frequently Always 1. Work on your days off (e.g., weekends) 2. Bring things home to work on 3. Take work-related phone calls at home 4. Carry a cell phone or pager for work so you can be reached
after normal business hours
5. Check your e-mail or voice mail from home 6. Stay at work after normal business hours 7. Work late into the night at home 8. Attend work-related functions on personal time 9. Travel whenever the company asks you to, even though
technically you don’t have to
10. Work during vacations 11. Go into the office before normal business hours 12. Volunteer for special projects in addition to your normal job
duties
13. Rearrange or alter personal plans because of work 14. Check back with the office even when you are on vacation 15. Participate in community activities for the benefit of the
company or organization

2
Part III - Please answer the following questions for each work life balance program. If you work for more tha
answer for the job where you spend the most time. 1. Does your current
company offer this program
2) What is the level of risk to a person’s position if t
stalled career, overlooked for rewards, seen as less c
Yes No Don’t know None Low Medium H
1. Flexible work schedules
2. Leave of absence for education
3. Part-time work
4. Job sharing
5. Brief (1 – 2 months) paid sabbatical
6. Work from home occasionally
7. Work from home all the time
8. Compressed work week
9. Paid maternity leave
10. Paid paternity leave
11. Paid leave for sick family member
(parent, child, spouse)
12. Unpaid Family Medical Leave (FMLA)
3) How likely are you to use these programs at some point in your career? If you have alrea
of program choose “Very likely – Already have”
Very Unlikely Unlikely Neither unlikely nor likely Likely Very Likely – Alrea
1. Flexible work schedules
2. Leave of absence for education
3. Part-time work
4. Job sharing
5. Brief (1 – 2 months) paid sabbatical
6. Work from home occasionally
7. Work from home all the time
8. Compressed work week
9. Paid maternity leave
10. Paid paternity leave
11. Use of all earned vacation time
12. Paid leave for sick family member
(parent, child, spouse)
13. Unpaid Family Medical Leave (FMLA)

3
Part IV – Please provide the following information
Age: _______ Gender: Male ______ Female _______
Country of birth: __________________________ Country or countries where you were raised: _______
What is your current employment status? Please check all that apply
Employed – other than
self employed ___________ Self –employed ___________
Retired ___________ Unemployed ___________
Volunteer work ___________ Stay-at-home parent ___________
Please check all that apply for each paid job you currently hold
Occupation(s): ________________________________ Union member? Yes ______ No _______
How many children do you have in each of the following age groups?
0 – 4 ________ 5 – 12 _______ 13 – 17 ______ 18 – 23 ________ 24 and older _____________
Marital Status: Single _______ Divorced ______ Widowed ______ Unmarried living with partner ____________ Married/Civil
Race/Ethnicity – Please check all that apply:
No designation ______ Caucasian ______ African American ______ Hispanic ______ Asian ______ Native American ______
Multiracial/Biracial ______ Other (please provide) _____________________________________
Job Level Job #1 Job #2 Job #3 Job #4
Part time
Full time
Non exempt (receives pay for
overtime)
Exempt non manager
Supervisor – Team Leader
Manager
Sr. manager/Executive

1
APPENDIX B
June 4, 2007
Dear Alumnus/Alumnae:
My name is Cathy Parker and I am a graduate student at the State University of New
York at New Paltz. I am looking for people to participate in a research study that I am
conducting as part of my Master’s thesis. Your name was chosen randomly from the list
of SUNY New Paltz alumni. My study will explore attitudes and perceptions on work
life balance. I am looking at how these attitudes and perceptions may vary with people of
different ages and with differing levels of family and work responsibilities.
I am looking for adults between the ages of 18 – 61 who are willing to fill out the survey
that is attached to this letter. It includes questions about:
1) Your perception of your own work life balance
2) The nature of some of your work activities
3) Your view of various work life programs that some employers offer
4) Your role at work
5) Other roles such as parent, spouse or partner
6) Information about you (your age, gender, race/ethnicity).
The questionnaire should take no longer than twenty minutes. It is completely
anonymous and you will not be asked for your name or any other identifying information.
Your participation in this study is completely voluntary. You may choose not to answer
certain questions during the survey.
If you are interested in participating in the study and you are between the ages of 18 and
61, please complete the survey provided with this letter. When you have completed the
survey, place it in the postage paid envelope that was provided and mail it back. I would
appreciate it if you could return the survey by June 29.
If you have questions at anytime, please feel free to contact me or my research supervisor
at the following phone numbers or email addresses
Research Supervisor: Dr. Maryalice Citera (845- 257-3476) [email protected]
Cathy Parker [email protected]
Thank you for your time and consideration.
Sincerely,
Cathy Parker