i data - arxiv · the importance of interactive visualization in data exploration has ... scienti c...
TRANSCRIPT

SlicerAstro: a 3-D interactive visual analytics tool for H I data
D. Punzoa,∗, J.M. van der Hulsta, J.B.T.M. Roerdinkb, J.C. Fillion-Robinc, L. Yud,e
aKapteyn Astronomical Institute, University of Groningen, Landleven 12, 9747 AD Groningen, The NetherlandsbJohann Bernoulli Institute for Mathematics and Computer Science, University of Groningen, Nijenborgh 9, 9747 AG Groningen, The
NetherlandscKitware Inc, Clifton Park, NY, The United States
dUniversity Medical Center Groningen, Center for Medical Imaging North East Netherlands, University of Groningen, Hanzeplein 1, 9713GZ Groningen, The Netherlands
eHangzhou Dianzi University, Zhejiang, China
Abstract
SKA precursors are capable of detecting hundreds of galaxies in H I in a single 12 hours pointing. In deeper surveysone will probe more easily faint H I structures, typically located in the vicinity of galaxies, such as tails, filaments, andextraplanar gas. The importance of interactive visualization in data exploration has been demonstrated by the wideuse of tools (e.g. Karma, Casaviewer, VISIONS) that help users to receive immediate feedback when manipulating thedata. We have developed SlicerAstro, a 3-D interactive viewer with new analysis capabilities, based on traditional 2-Dinput/output hardware. These capabilities enhance the data inspection, allowing faster analysis of complex sources thanwith traditional tools. SlicerAstro is an open-source extension of 3DSlicer, a multi-platform open source softwarepackage for visualization and medical image processing.
We demonstrate the capabilities of the current stable binary release of SlicerAstro, which offers the followingfeatures: i) handling of FITS files and astronomical coordinate systems; ii) coupled 2-D/3-D visualization; iii) interactivefiltering; iv) interactive 3-D masking; v) and interactive 3-D modeling. In addition, SlicerAstro has been designed witha strong, stable and modular C++ core, and its classes are also accessible via Python scripting, allowing great flexibilityfor user-customized visualization and analysis tasks.
Keywords: radio lines: galaxies, scientific visualization, visual analytics, agile software development, object orienteddevelopment, empirical software validation
1. Introduction
Upcoming neutral hydrogen (H I) surveys (e.g., Verheij-en et al., 2009; Duffy et al., 2012) will deliver large datasets.The daily data-flow will be of the order of TBytes andseveral hundreds of galaxies will be detected. To find andcharacterize H I objects, automated processing methodsmust use all of the three-dimensional (3-D) information(two positional dimensions and one spectral dimension)that the surveys make available.
In this context, 3-D visualization techniques provide apowerful tool to inspect the sources under study. In fact,the 3-D view of a galaxy simultaneously presents both itsH I distribution and its kinematics providing an immedi-ate overview of the structures and coherence in the data(Oosterloo, 1995; Goodman, 2012; Punzo et al., 2015). Inaddition, user interaction in the 3-D environment providescapabilities which astronomers can use to quickly ana-lyze complex sources found by automated pipelines (e.g.,Duchamp and SoFiA; Whiting, 2012; Serra et al., 2015).
∗Corresponding authorEmail address: [email protected] (D. Punzo)
These sources include interacting galaxies, tidal tails, fil-aments, and stripped galaxies, and the majority will notexceed dimensions greater than 108 voxels1.
Performing interactive 3-D rendering (and analysis) ofH I sources is computationally affordable using a moderndesktop (Punzo et al., 2015). This has stimulated furtherdevelopment of 3-D visualization tools for astronomicalpurposes. For example, different package developmentshave recently been undertaken, exploiting: the render-ing engine of Blender 2, an open source software for 3-D animations (Taylor, 2015; Kent, 2015; Naiman, 2016);indirect volume rendering3 available in the VisualizationToolKit, VTK 4, and Mayavi25 (Vogt et al., 2016); stereo-scopic visualization and 3-D interaction hardware usingthe gaming engine Unity 6 (Ferrand et al., 2016); and a
1 Voxels are 3-D pixels.2https://www.blender.org/3In scientific visualization and computer graphics, volume render-
ing is a set of techniques used to display a 2-D projection of a 3-Ddiscretely sampled dataset.
4http://www.vtk.org/5http://code.enthought.com/projects/mayavi/6https://unity3d.com/
Preprint submitted to Astronomy and Computing April 4, 2017
arX
iv:1
703.
0665
1v2
[as
tro-
ph.I
M]
3 A
pr 2
017

large-scale, hybrid visualization and supercomputing envi-ronment (Vohl et al., 2016). Although the previous pack-ages have introduced 3-D rendering solutions to visualize3-D astronomical datasets, they do not fully satisfy ourvisualization requirements (see Section 2.1).
In this paper, we present SlicerAstro 7 (Punzo et al.,2016), an extension of 3DSlicer8 (a multi-platform opensource software package for visualization and medical im-age processing; Fedorov et al., 2012), that aims to providean interactive 3-D visual analytics tool based on tradi-tional 2-D input/output hardware.
In Section 2.1 we describe the design of SlicerAstro.In Section 3 we show how interactive filtering and 3-D visu-alization can boost the inspection of faint complex sources.In Section 4 we describe the interactive 3-D masking ca-pabilities available in SlicerAstro. In Section 5 we showhow 3-D visualization, coupled with interactive modeling,provides additional capabilities helping the discovery andanalysis of subtle structures in the 3-D domain. In Sec-tion 6 we discuss the efficiency of such visual analyticstechniques for helping astronomers in the analysis of com-plex sources.
2. The SlicerAstro environment
An exhaustive review of open-source 3-D visualizationpackages in Punzo et al. (2015) led to the choice of 3DSliceras the preferred platform for the development of Slicer-Astro. The most important deciding factors included thefollowing:
I) 3DSlicer is an open-source platform with a BerkeleySoftware Distribution (BSD) license, which allows forfree utilization of the software;
II) the software has a flexible environment for code de-velopment and collaboration;
III) 3DSlicer has adequate documentation for both de-velopers and users;
IV) the 3DSlicer software has a large number of activedevelopers;
V) the 3DSlicer interface already has numerous quan-titative features e.g., data probing, setting fiducialmarkups9 and listing their position, 2-D/3-D rulersand calculating statistics in a selected volume).
Several of the medical visualization tools present in3DSlicer suit the needs of astronomical applications. Forexample, 3DSlicer optimizes the display layout and theprocess of navigating through data for parallel two-dimen-sional visualizations (e.g., movies of channel maps).
7https://github.com/Punzo/SlicerAstro8https://www.slicer.org/9A fiducial markup or fiducial is an object placed in the field of
view of an imaging system which appears in the image produced, foruse as a point of reference or a measure.
In addition, 3DSlicer has been adopted by Kitware10
as key open-source platform similarly to VTK, ITK11 andParaview12 which Kitware has been supporting for morethan 15 years. This guarantees long-term support andfuture updates of 3DSlicer.
2.1. Design
Punzo et al. (2015) analyzed and reviewed the require-ments for the visualization of H I in and around galaxies.These include handling the loading and writing of FlexibleImage Transport System (FITS) files (Pence et al., 2010),the ability to display astronomical World Coordinates Sys-tem (WCS; Calabretta and Greisen, 2002; Greisen et al.,2006), interactive 3-D high-quality rendering capabilities(i.e., graphics processing unit (GPU)-accelerated ray cast-ing rendering Roth, 1982; Schroeder et al., 2006) and in-teractive linking between 1-D/2-D/3-D views. Interactivevisualization which allows the user to extract quantitativeinformation directly from the visual presentation is also ofprimary importance: probing the data with a cursor; dis-playing coordinate axes in the 2-D views; performing 3-Dsegmentation13 techniques; linked 1-D/2-D/3-D region ofinterest (ROI) selection and the ability to calculate statis-tics (e.g., mean, rms, maximum, minimum, etc.) in aspecific area or volume. Another requirement is to cou-ple analysis techniques such as interactive smoothing andtilted-ring model fitting to visualization. Therefore, com-parative visualization (multiple views, overlaid visualiza-tions, etc.) is fundamental for comparing the raw datawith the smoothed version and/or the models. The lastrequirement is interoperability14 with virtual observatory(VO) tools (Taylor et al., 2011). Moreover, in order to fa-cilitate collaborative work, the source code must be open,modular, well documented, and well maintained.
The current version of the 3DSlicer software providesseveral of these capabilities: CPU and GPU renderingbased on the VTK, interface optimized for 2-D visualizationwith a high-level of linking between the 2-D and 3-D views,2-D and 3-D segmentations techniques, high-level of mod-ularity in the source code, embedded python console in theuser interface for fast interaction with the 3DSlicer appli-cation programming interface (API)15, presence of detaileddocumentation for both users and developers. In addi-tion, we made a number of contributions to the 3DSlicer
source: we added more types of units in the 3DSlicer stan-dards and factorized the DataProbe module and widgets
10https://www.kitware.com/11https://itk.org/12http://www.paraview.org/13Image segmentation is the process of partitioning an image into
disjoint regions that are uniform with respect to some property.14Interoperability is the ability of different information technology
systems and software applications to communicate, exchange data,and use the information that has been exchanged.
15The API is a set of subroutine definitions, protocols, and toolsfor building application software.
2

that control the 2-D views to allow their customization by3DSlicer extensions.
In addition, to fulfill the requirements, the followingcapabilities have to be added:
I) proper visualization of astronomical data-cubes usingthe FITS data format;
II) enabling interactive smoothing in all three dimen-sions;
III) interactive 3-D selection of H I sources;
IV) interactive H I data modeling coupled to visualiza-tion;
V) generation of flux density profiles and histograms ofthe voxel intensities;
VI) introduction of the SAMP protocol to enable interop-erability with Topcat (Taylor, 2005), and other VOtools and catalogs.
These software capabilities are particular to astronom-ical applications and, therefore, it is optimal to imple-ment them in an extension of 3DSlicer, i.e. SlicerAstro,rather than in its core.
In the next sections we will discuss the implementationand deployment of such capabilities and use the H I emis-sion in and around WEIN069 (Ramatsoku et al., 2016),a galaxy in a region in the sky where a filament of thePerseus-Pisces Supercluster (PPScl) crosses the plane ofthe Milky Way, as an example.
2.2. Implementation
The 3DSlicer plug-in mechanism enables the rapid de-velopment of custom modules in different programminglanguages and for different levels of integration:
1) The command-line interface modules are standaloneexecutables with a limited input/output argument com-plexity (simple argument types and no user interac-tion).
2) The loadable modules are plugins implemented in theC++ language that are integrated tightly in the 3DSlicercore software. These modules have access to all other3DSlicer core modules and the internals of the applica-tion and they can define custom, interactive graphicaluser interfaces.
3) The scripted modules are written in the Python lan-guage. These modules can be developed and modi-fied without rebuilding or restarting 3DSlicer and theyhave similar access to the application internals as load-able modules.
All objects (volumetric images, surface models, trans-forms, etc.) in 3DSlicer are stored in a hierarchical struc-ture of nodes encoded in the Medical Reality ModelingLanguage (MRML). Each MRML node has its own listof custom attributes that can be used to specify addi-tional characteristics for the data object. This method ofstorage enables the modules to have access to the MRML
tree, allowing new extensions to leverage existing process-ing and visualization functions without directly interferingwith other modules.
In addition, 3DSlicer and its extensions are developedusing a CMake-based16 build system which greatly helpsthe development, packaging and testing of multi-platformsoftware.
Figure 1: The architecture of SlicerAstro is shown in the dia-gram. The dashed arrows indicate the dependency of a componenton another one. The loadable modules are the main componentsof SlicerAstro. The AstroVolume module is the core module ofSlicerAstro and it provides an interface for handling the loadingand writing of FITS files, the control of the 2-D and 3-D color trans-fer functions, and the display of the astronomical world coordinatessystem (WCS; Calabretta and Greisen, 2002; Greisen et al., 2006).The AstroSmoothing and AstroModeling modules take care of spe-cific operations (smoothing and modeling respectively), with theirown interface widgets for user interaction. The scripted moduleshave the role of utilities such as downloading sample datasets.
The SlicerAstro functionality is implemented as mul-tiple plug-in modules, bundled as one downloadable exten-sion. This modularization makes development and main-tenance faster and affordable. Moreover, extensions arebuilt everyday for the nightly build of 3DSlicer to identifybreakage with the core. The architecture of SlicerAstrois shown in Fig. 1. SlicerAstro uses the CTK17 and Qt18
16https://cmake.org/17http://www.commontk.org18https://www.qt.io/
3

packages for user interface widgets, and the VTK library forthe visualization (i.e. 2-D and 3-D rendering). SlicerAstrodepends also on: CFITSIO (Pence, 2010), WCSLIB (Cal-abretta, 2011) and 3D Barolo (Di Teodoro and Fraternali,2015). The loadable modules are the main components ofSlicerAstro, while the scripted modules have the role ofutilities such as presenting a welcoming interface and ca-pabilities to download sample datasets. The AstroVolume
component is the core module (see Section 2.3); AstroSmo-othing and AstroModeling modules take care of specificoperations (smoothing and modeling respectively), withtheir own interface widgets for user interaction (see Sec-tions 3 and 5).
SlicerAstro development focuses on H I datasets. There-fore, we currently provide modules which are mainly aimedfor the analysis of H I data-cubes. However, SlicerAstrocan potentially enhance also the inspection of other datasetssuch as mm/submm molecular line data and optical inte-gral field spectroscopic data. We will elaborate more in thepotential of SlicerAstro for such datasets in Section 6.
2.3. Interface framework
The AstroVolume module provides an interface for han-dling the loading and writing of FITS files, MRML nodesthat store the data in the 3DSlicer object-tree, the dis-play of the WCS and the control of the 2-D and 3-D colortransfer functions.
In Fig. 3, we show the implementation of the 3DSlicerand SlicerAstro interface. On the top, the main menushows several options for loading and writing files (includ-ing FITS files) and for editing the 3DSlicer settings. Thedata loaded from a FITS file are stored in a vtkMRMLAstro-VolumeNode object. The instantiated MRML nodes andtheir properties can be inspected in the SubjectHierarchymodule (see Fig. 2). The output of source finder pipelines,that is, object masks, are loaded as vtkMRMLAstroLabel-MapVolumeNode objects. These masks are delivered as adata-cube where non-detected voxels in the original data-cube have a value of 0 and detected voxels have an integervalue corresponding to the ID of the object they belongto. Due to the complex 3-D nature of the sources (San-cisi et al., 2008) and the noisy character of the data, con-structing a fully automated and reliable pipeline is nottrivial (Popping et al., 2012) and visualization can helpin identifying or rejecting very faint signals (Punzo et al.,2016). For example, in Fig. 3, SlicerAstro shows thevisualization of the H I emission in and around WEIN069and its mask, generated with SoFiA (Serra et al., 2014).The data-cube contains three sources, WEIN069 and twocompanions, each identified as a separate source with itsown mask. In addition there is a tidal tail and a very faintfilament that is connecting two of the galaxies.
The left panel in Fig. 3, includes the widgets for chang-ing the the 2-D and 3-D color transfer functions for vtkMR-MLAstroVolumeNode objects. In the case of vtkMRMLAstro-LabelMapVolumeNode objects, volume rendering is not avail-able, but it is possible to use the MaskVisualization wid-
Figure 2: The interface widgets of the SubjectHierarchy module. Inthe top panel, the interface includes the widgets for selecting MRMLnodes representing the data-cubes. In the bottom panel, the interfaceincludes a tool to inspect and modify the FITS keywords.
get to convert the vtkMRMLAstroLabelMapVolumeNode ob-ject to a vtkMRMLSegmentationNode object. The vtkMRML-SegmentationNode class is a core class of 3DSlicer thathandles the display of data segmentation both in the 2-D and 3-D views, as shown in Fig. 3, and they can beoverlaid on the data of a vtkMRMLAstroVolumeNode ob-ject. The segmentation objects can also be interactivelymodified (see Section 4 for more information) and can beexported for 3-D printing (or imported in Blender) bysaving them in the STL file format.
Moreover, the layout includes interface widgets to con-trol the display properties (e.g., user interaction to rotatethe 3-D view), a window displaying the 3-D World Coordi-nate and data values of the position of a data probe in thelinked 2-D views. The 2-D views also have quantitativeWorld Coordinate axes.
Finally, the MRML infrastructure allows the user tosave the session as a scene. Reloading such a scene restoresthe session. One can also share interesting visualizationswith colleagues using the Datastore module. This mod-ule saves a bundle with all the necessary information (thedata, the visualization views, screen-shots and text com-ments) on the Kitware servers. Other users can downloadthese bundles.
4

Fig
ure
3:
Vis
ualiza
tion
of
the
HI
emis
sion
inan
daro
un
dW
EIN
069
(Ram
ats
oku
etal.,
2016)
an
dit
sm
ask
,gen
erate
dw
ithSoFiA,
inSlicerAstro.
Th
ed
ata
-cu
be
conta
ins
thre
eso
urc
es,
i.e.
,W
EIN
069
an
dtw
oco
mp
an
ion
gala
xie
s,a
tid
al
tail
an
da
ver
yfa
int
fila
men
tth
at
con
nec
tstw
ogala
xie
s.In
the
3-D
vie
wth
ed
ata
are
ren
der
edin
gre
enan
dh
igh
lighte
dat
an
inte
nsi
tyle
vel
equ
al
to3
tim
esth
ero
ot
mea
nsq
uare
(rms)
nois
e.T
he
colo
red
segm
enta
tion
sre
pre
sent
the
mask
an
dea
chco
lor
refe
rsto
asp
ecifi
cso
urc
eID
as
show
nin
the
tab
lew
idget
inth
ele
ftp
an
el.
Th
ele
ftp
an
elin
clu
des
als
oin
terf
ace
wid
get
sto
contr
ol
the
2-D
an
d3-D
colo
rtr
an
sfer
fun
ctio
ns
an
da
data
pro
be
win
dow
.Q
uanti
tati
ve
info
rmati
on
such
as
WC
Sco
ord
inate
sare
show
nb
oth
inth
ed
ata
pro
be
win
dow
an
dalo
ng
the
axes
inth
e2-D
vie
ws.
Th
ew
hit
ela
bel
sin
the
3-D
vie
wre
pre
sent
the
fou
rca
rdin
al
dir
ecti
on
s(N
,S
,E
,W
)an
dth
elin
e-of-
sight
dir
ecti
on
(rep
rese
nti
ng
freq
uen
cy/w
avel
ength
or
vel
oci
ty/re
dsh
ift,
z,h
ence
the
sym
bolZ
).
5

2.4. Rendering and user interactions
In 3DSlicer the visualization representations are ren-dered with the Visualization Toolkit, VTK (Schroeder et al.,2006). In SlicerAstro the data are rendered in 3-D withthe VTK implementation of the ray casting algorithm, a di-rect volume rendering method (Roth, 1982). Ray castingoffers very high-quality results (i.e., free of artifacts), but itis computationally expensive. On the other hand, ray cast-ing is a massively parallel algorithm. On modern desktopsthe VTK GPU implementation offers interactive renderingwith a high (> 5) frame rate (FPS) for data-cubes notexceeding 109 voxels. The use of such high quality render-ing is mandatory in our case. In fact, other methods canproduce many rendering artifacts in the noisy regions ofan H I data-cube. In particular, indirect volume render-ing techniques are very ineffective at signal-to-noise-ratio. 2, because they have to fit geometries to very noisy datathat do not have well-defined closed borders (Punzo et al.,2015).
In SlicerAstro, the masks are visualized as segmen-tations (i.e., 3DSlicer renders them with indirect volumerendering), because they are supposed to be noise-free bydefinition.
3DSlicer offers several 2-D/3-D linked navigation andinteraction tools such as crosshair, fiducials, region of in-terest (ROI), ruler and slice views linked with 3-D views(for more information, we refer to Fedorov et al., 2012,and the 3DSlicer online documentation19). All these fea-tures are extremely useful for navigating and probing thedata. However, the 3-D visualization paradigm used in3DSlicer and SlicerAstro is limited by the use of 2-Dinput and output hardware such as a standard monitorand mouse. An obvious limitation in 3-D is that it is notstraightforward to select features or pick positions (i.e.,voxels) in the 3-D space in an intuitive manner. Comple-mentary visualization in 2-D (linked to the 3-D one) canpartially address these deficiencies.
In 3DSlicer all the modules are accessible at run-timefrom the Python console (Python version 2.7.11 is bundledand delivered together with the 3DSlicer binaries). Note,however, that of the packages often used in astronomy onlynumpy is part of this bundle. This allows additional flexi-bility for user-customized visualization and analysis tasksusing all 3DSlicer and SlicerAstro capabilities. ThePython console and automated Python scripts are a verypowerful tool for interacting with the data itself. Some ex-amples are: accessing the array containing the data, mod-ifying the data and calculating statistics in a region of in-terest. Moreover, the MRML objects store everything thatthe user visualizes and changes in the interface. This al-lows the user to perform the same actions by using Python
scripts. An example for applying smoothing to a data-cube, performing the rendering, and saving the result as avideo is shown in the appendix, Section 7. For example,
19 https://www.slicer.org/wiki/Documentation/Nightly
this framework is extremely useful for creating screenshotsand videos for a large number of sources. For more infor-mation, we also refer to the online documentation20.
3. Interactive filtering
Future blind H I surveys will detect a large variety ofgalaxies with additional complex features such as tails,extra-planar gas, and filaments. These faint structurescan be found in nearby, well resolved galaxies and groupsof marginally resolved galaxies. They have a very lowsignal-to-noise ratio (∼ 1), but are extended over manypixels. Efficiently separating such signals from the noiseis not straightforward (Punzo et al., 2016). Moreover, inthe case of Apertif (Verheijen et al., 2009) and ASKAP(Johnston et al., 2008), it is estimated that tens of suchsub-cubes will be collected weekly (Punzo et al., 2015).This is a large volume of data, and a coupling between thefiltering algorithms and 3-D visualization can enhance theinspection process of large numbers of galaxies and masksprovided by source finder algorithms.
Figure 4: The interface widgets of the AstroSmoothing module. Theinterface includes a widget for changing the input parameters for thesmoothing and a table showing the output segmentations generatedafter the smoothing process.
20https://github.com/Punzo/SlicerAstro/wiki
6
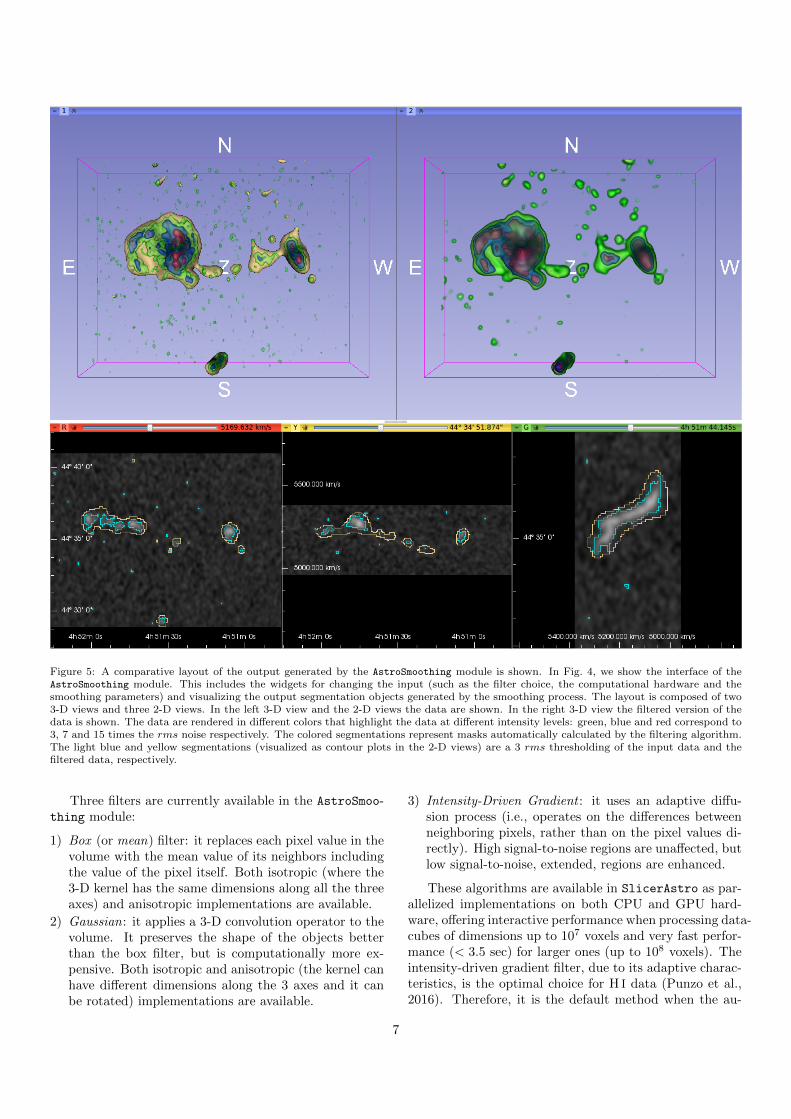
Figure 5: A comparative layout of the output generated by the AstroSmoothing module is shown. In Fig. 4, we show the interface of theAstroSmoothing module. This includes the widgets for changing the input (such as the filter choice, the computational hardware and thesmoothing parameters) and visualizing the output segmentation objects generated by the smoothing process. The layout is composed of two3-D views and three 2-D views. In the left 3-D view and the 2-D views the data are shown. In the right 3-D view the filtered version of thedata is shown. The data are rendered in different colors that highlight the data at different intensity levels: green, blue and red correspond to3, 7 and 15 times the rms noise respectively. The colored segmentations represent masks automatically calculated by the filtering algorithm.The light blue and yellow segmentations (visualized as contour plots in the 2-D views) are a 3 rms thresholding of the input data and thefiltered data, respectively.
Three filters are currently available in the AstroSmoo-thing module:
1) Box (or mean) filter: it replaces each pixel value in thevolume with the mean value of its neighbors includingthe value of the pixel itself. Both isotropic (where the3-D kernel has the same dimensions along all the threeaxes) and anisotropic implementations are available.
2) Gaussian: it applies a 3-D convolution operator to thevolume. It preserves the shape of the objects betterthan the box filter, but is computationally more ex-pensive. Both isotropic and anisotropic (the kernel canhave different dimensions along the 3 axes and it canbe rotated) implementations are available.
3) Intensity-Driven Gradient : it uses an adaptive diffu-sion process (i.e., operates on the differences betweenneighboring pixels, rather than on the pixel values di-rectly). High signal-to-noise regions are unaffected, butlow signal-to-noise, extended, regions are enhanced.
These algorithms are available in SlicerAstro as par-allelized implementations on both CPU and GPU hard-ware, offering interactive performance when processing data-cubes of dimensions up to 107 voxels and very fast perfor-mance (< 3.5 sec) for larger ones (up to 108 voxels). Theintensity-driven gradient filter, due to its adaptive charac-teristics, is the optimal choice for H I data (Punzo et al.,2016). Therefore, it is the default method when the au-
7
tomatic mode has been chosen. This algorithm preservesthe detailed structure of the signal with high signal-to-noise ratio (> 3) at the highest resolution, while smooth-ing only the faint part of the signal (signal-to-noise ratio< 3). For more information regarding the filters and theirperformance, default parameters, advantages and disad-vantages, we refer to Punzo et al. (2016).
After running the smoothing process, SlicerAstro dis-plays automatically a comparative layout composed of two3-D views, one of the original data (top left panel) and oneof the filtered data (top right panel), and three 2-D viewsof the original data (lower three panels) for the inspectionof the data, as shown in Fig. 5. In this particular case,the 3-D visualization of the filtered data highlights im-mediately the presence of the faint filament between twogalaxies that was hardly visible in the original version ofthe data. Moreover, the coupling between 3-D visualiza-tion and interactive filtering enables a user to manuallyand iteratively search the best smoothing parameters formaximally enhancing the local signal-to-noise ratio of thevery faint component.
We will show in the next section how any segmenta-tions generated by the smoothing module (or convertedfrom loaded masks as shown in Section 2.3) can be inter-actively modified in the SegmentationEditor module of3DSlicer.
4. Interactive 3-D masking
Twenty years ago, Norris (1994) pointed out that themain challenge for visualizing astronomical data in 3-Dwas to develop a 3-D visualization tool with interactivecapabilities for data inspection and with interactive andquantitative analysis capabilities. Nowadays, 3-D interac-tive visualization is achievable thanks to the use of mas-sively parallel hardware such as GPUs (see Section 2.4).On the other hand, volumetric data interaction tools (e.g.,picking a voxel or selecting a region of interest in 3-D) arenecessary for performing data analysis in a 3-D environ-ment.
An optimized 3-D selection technique, based on 2-D in-put/output hardware, is still a partially open-problem, notonly in astronomy, but also in medical visualization andcomputer science. Moreover, the optimal selection tech-nique highly depends on the specifications of the use case.Our requirements for a 3-D selection tool are interactivityand a minimal number of user-operations for achieving theselection (i.e., user-friendliness). For a review of the state-of-the-art 3-D selection algorithms we refer to Yu et al.(2012) and Yu et al. (2016).
For our application, we opt for the CloudLasso tech-nique (Yu et al., 2012). The CloudLasso, operated on griddata, is based on the application of the Marching Cubes(MC) algorithm (Wyvill et al., 1986; Lorensen and Cline,1987) for the identification of regions of voxels with sig-nal inside a user-drawn lasso; i.e., CloudLasso is a lasso-constrained Marching Cubes method. The CloudLasso
method allows us to spatially select structures with highsignal-to-noise ratio (> 3) within a lasso region. Even ifdisjoint structures lie visually behind one another, theycan be all selected without including the noisy regions inbetween. For operating the intended selection, a thresholdhas to be chosen. The CloudLasso algorithm, therefore,comprises the following two steps:
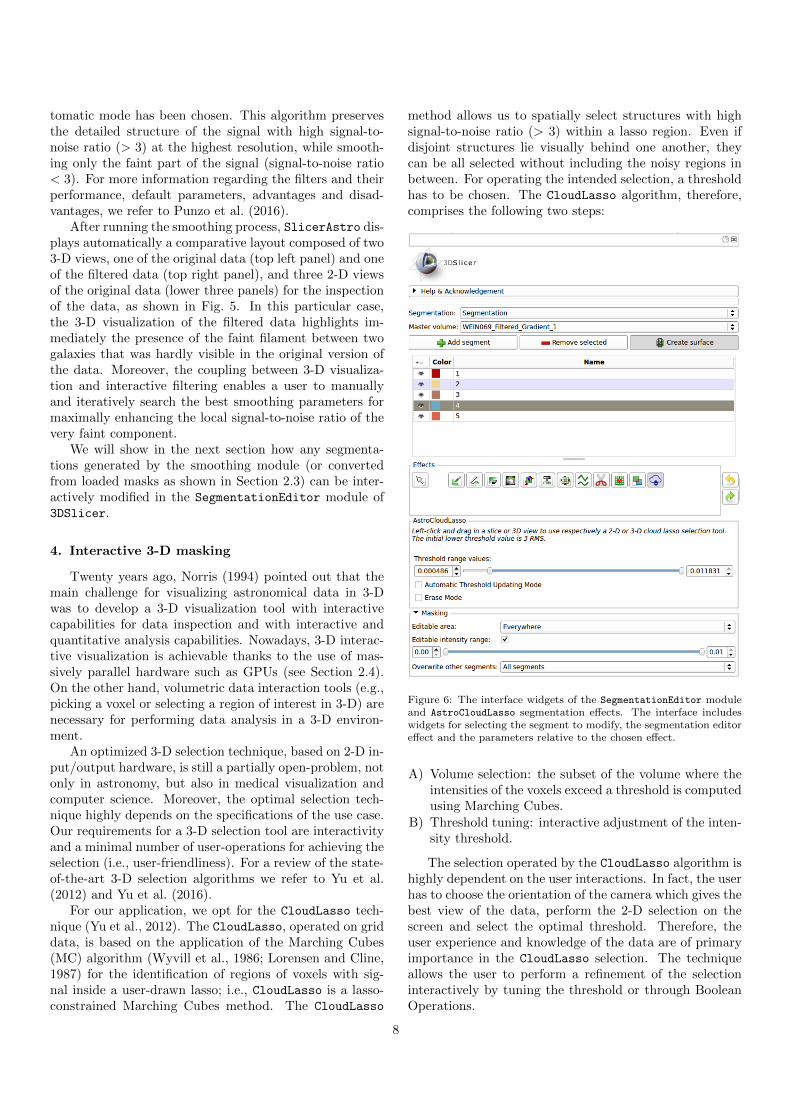
Figure 6: The interface widgets of the SegmentationEditor moduleand AstroCloudLasso segmentation effects. The interface includeswidgets for selecting the segment to modify, the segmentation editoreffect and the parameters relative to the chosen effect.
A) Volume selection: the subset of the volume where theintensities of the voxels exceed a threshold is computedusing Marching Cubes.
B) Threshold tuning: interactive adjustment of the inten-sity threshold.
The selection operated by the CloudLasso algorithm ishighly dependent on the user interactions. In fact, the userhas to choose the orientation of the camera which gives thebest view of the data, perform the 2-D selection on thescreen and select the optimal threshold. Therefore, theuser experience and knowledge of the data are of primaryimportance in the CloudLasso selection. The techniqueallows the user to perform a refinement of the selectioninteractively by tuning the threshold or through BooleanOperations.
8

Figure 7: Usage of the AstroCloudLasso segmentation editor effect in3-D. A smoothed version of the WEIN069 data is rendered in green inthe top and middle panels. In the bottom panel, the original versionof WEIN069 data is rendered. The three renderings highlight thedata at the intensity level equal 3 times the rms. In the top panel, thecolored segmentations represent the mask shown in Fig. 3. In orderto visualize clearly both the data and the mask, the data are renderedwith a higher opacity in the bottom panel compared to the upperpanels. Similarly, the opacity of the segmentations is decreased. TheAstroCloudLasso selection tool is visualized as a yellow tube drawnby the user with the 2-D cursor indicated by the blue cloud. Thistool computes a selection in 3-D space from the 2-D user-selection.It builds a closed surface at the value of the intensity level specifiedin the settings widget (Fig. 6) and visualizes the modified segmentas shown in the middle panel. In the bottom panel, we show all themodified segments.
Although the threshold tuning step can be improved orreplaced by more complex techniques to identify and clas-sify the signal in the selection, the CloudLasso techniqueis the most reliable choice in our case, because it leavesany classification to the user (leveraging his/her knowl-edge about the data). For example, connectivity operators(Heijmans, 1999) can be applied after the thresholding todistinguish the various islands of signal and to label themwith IDs. Moreover, MAX-TREE algorithms (Moschini et al.,2014) can automatically provide a tree classification of thedata. Finally, more advanced selection techniques can beemployed (e.g., Cast selections Yu et al., 2016). The com-mon element in these techniques is the idea to classify (indifferent ways) the information in the data. However, dueto the very noisy nature of H I data, separating the H I sig-nal from the noise is not trivial (Punzo et al., 2016) and,therefore, it is quite challenging to build an automated al-gorithm to classify the data see also (see also Giese et al.,2016).
In the SegmentationEditor module of 3DSlicer weimplemented an AstroCloudLasso segmentation editingcapability, optimized and specialized for the selection ofH I data. A segmentation editor is a 3DSlicer tool thatenables user interaction with the data and creation/modifi-cation of segmentations both in the 2-D and 3-D views. InFig. 6 we show the interface widgets of the AstroCloudLassosegmentation editor. The default value of the threshold isset to 3 times the rms value of the data-cube under study.In Fig. 7, we show how the selection procedure is per-formed in a 3-D view of 3DSlicer and the results for eachsegment are shown (i.e., we repeated the selection proce-dure four times). The tool can also perform 2-D selections(on the 2-D views), it can erase the segment under the se-lection (both in the 2-D and 3-D views) if the erase modehas been enabled, and it can interactively adjust the selec-tion of the intensity threshold if the automatic updatingmode has been enabled.
The AstroCloudLasso segmentation editor effect canbe used for two applications:
A) interactively modify a mask as shown in Fig. 7 (notethat SlicerAstro can save the new mask as a FITSfile). This framework can be used as a modificationtool of the masks generated from source finder pipelines.
B) selecting regions of interest for further analysis.
In the next section, we will apply the segmentation asa selection for operating tilted-ring modeling in the regionof interest.
5. Interactive modeling
In the case of H I in galaxies one can extract additionalinformation from fitting the observations with a so calledtilted-ring model (Warner et al., 1973). Such a model de-scribes the observed H I distribution of the galaxy as aset of concentric, inclined, and rotating rings. Each ringis characterized by the following parameters: the center of
9
the spatial coordinates, and the systemic velocity, rotationvelocity, velocity dispersion, inclination, position angle asa function of the galactocentric radius. A model is spec-ified by a set of ring (radially varying) parameters plus aset of global parameters (e.g., ring width).
To compute a model the rings are populated with anensemble of H I clouds using a Monte Carlo method. Thecloud ensembles are integrated along each line-of-sight inthe data-cube and convolved with a 3D-Gaussian repre-senting the properties of the observing beam and the res-olution in the frequency domain.
A tilted-ring model is necessarily an oversimplificationof the H I distribution inside galaxies. When the orbits aresignificantly non-circular, for example in the presence of abar (Bosma, 1978), the tilted-ring model will not be ableto represent the data accurately. Furthermore, there is adegree of degeneracy between some of the ring parameters(e.g., inclination, position angle and rotational velocity).In many cases, however, the tilted-ring model serves as agood approximation and can provide a deeper understand-ing of the kinematics and morphology of a galaxy, includ-ing asymmetries in surface density and velocity, the pres-ence of gas at anomalous velocities, of extra-planar gas, ofinflows and outflows, etc. It is for example rather easy tolocate the presence of extra-planar gas once the symmetricand regularly rotating disk is modeled (see Section 5.3).
It is, therefore, very useful to add model fitting ca-pabilities to a visual analytics tool for H I data. Such acapability enables an interactive comparison between thedata and models so that the quality of the model can beassessed interactively. This is possible by embedding themodel routine in the visualization interface. This will alsoenable interactive tuning of the model parameters usingthe visualization interface.
Modern 3-D tilted-ring modeling software can generatesymmetric models that reproduce the data with a mini-mal user input and interaction (Di Teodoro and Frater-nali, 2015; Kamphuis et al., 2015). In the next sectionwe will briefly review such software libraries. We will alsodescribe the integration of one of them in SlicerAstro
and show how it provides additional capabilities for thedetection and analysis of subtle structures in the 3-D do-main. Two use cases will be investigated in Sections 5.2and 5.3: using the 3-D selection tool (shown in Section 4)to perform the tilted-ring model fitting only in a regionof interest (i.e., excluding non-symmetric, non-regular, H I
structures such as tidal tails) and using the symmetricalproperties of automated tilted-ring model fitting to locateextra-planar gas.
5.1. Requirements
Tilted-ring model fitting is rather complex. Thereforewe chose to rely on an external state-of-the-art packagerather than designing a new one. In order to be able towrap an external model fitting package into SlicerAstro
the following requirements can be formulated:
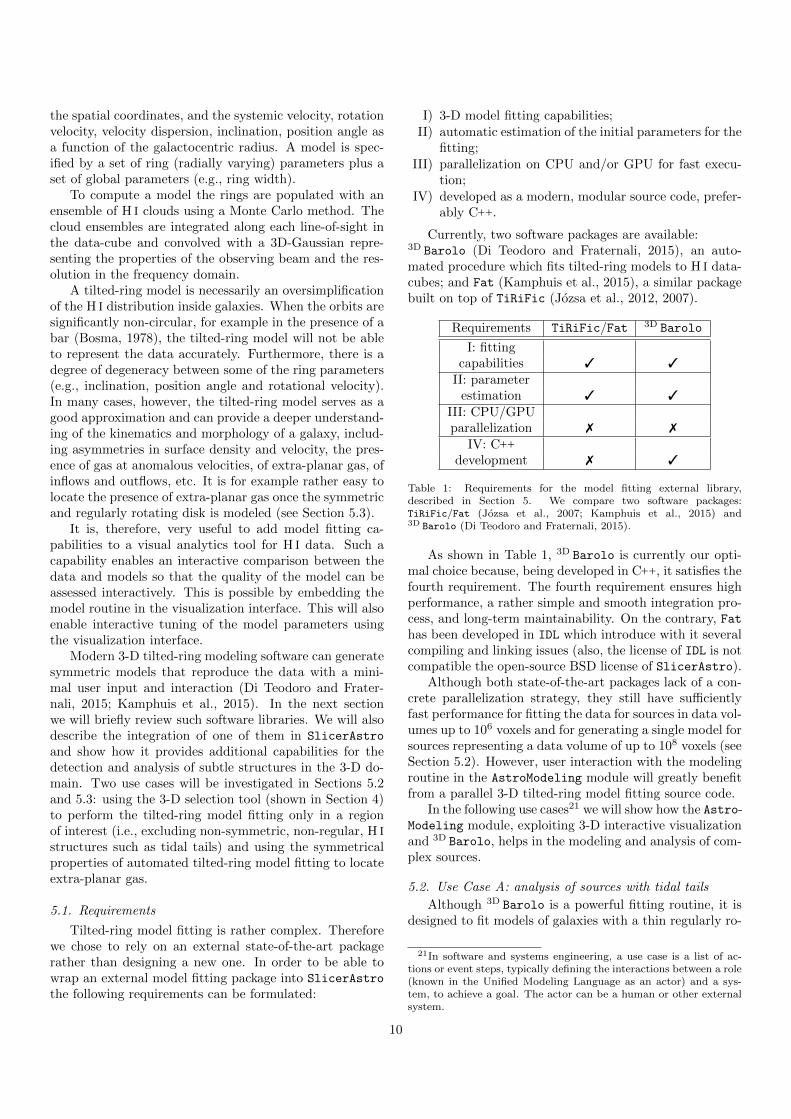
I) 3-D model fitting capabilities;II) automatic estimation of the initial parameters for the
fitting;III) parallelization on CPU and/or GPU for fast execu-
tion;IV) developed as a modern, modular source code, prefer-
ably C++.
Currently, two software packages are available:3D Barolo (Di Teodoro and Fraternali, 2015), an auto-mated procedure which fits tilted-ring models to H I data-cubes; and Fat (Kamphuis et al., 2015), a similar packagebuilt on top of TiRiFic (Jozsa et al., 2012, 2007).
Requirements TiRiFic/Fat 3D Barolo
I: fittingcapabilities 3 3
II: parameterestimation 3 3
III: CPU/GPUparallelization 7 7
IV: C++
development 7 3
Table 1: Requirements for the model fitting external library,described in Section 5. We compare two software packages:TiRiFic/Fat (Jozsa et al., 2007; Kamphuis et al., 2015) and3D Barolo (Di Teodoro and Fraternali, 2015).
As shown in Table 1, 3D Barolo is currently our opti-mal choice because, being developed in C++, it satisfies thefourth requirement. The fourth requirement ensures highperformance, a rather simple and smooth integration pro-cess, and long-term maintainability. On the contrary, Fathas been developed in IDL which introduce with it severalcompiling and linking issues (also, the license of IDL is notcompatible the open-source BSD license of SlicerAstro).
Although both state-of-the-art packages lack of a con-crete parallelization strategy, they still have sufficientlyfast performance for fitting the data for sources in data vol-umes up to 106 voxels and for generating a single model forsources representing a data volume of up to 108 voxels (seeSection 5.2). However, user interaction with the modelingroutine in the AstroModeling module will greatly benefitfrom a parallel 3-D tilted-ring model fitting source code.
In the following use cases21 we will show how the Astro-Modeling module, exploiting 3-D interactive visualizationand 3D Barolo, helps in the modeling and analysis of com-plex sources.
5.2. Use Case A: analysis of sources with tidal tails
Although 3D Barolo is a powerful fitting routine, it isdesigned to fit models of galaxies with a thin regularly ro-
21In software and systems engineering, a use case is a list of ac-tions or event steps, typically defining the interactions between a role(known in the Unified Modeling Language as an actor) and a sys-tem, to achieve a goal. The actor can be a human or other externalsystem.
10

tating disk. Therefore, 3D Barolo (or other current tilted-ring modeling algorithms) cannot recognize, for example,tidal tail structures and separate them from the centralregularly rotating body of the galaxy.
In this section, we show how to use the AstroModel-ing module for the manual quality control of the mod-els. This framework enhances the analysis of gravitationalperturbed galaxies such as WEIN069. In fact, the 3-D se-lection tool described in Section 4 can be used to selecta region of interest for which 3D Barolo provides the bestresults. For example, in the case of WEIN069 the user canseparate the two kinematic components, i.e., the regularlyrotating disk and the tidal tail, and perform the calcula-tions only on the central disk.
Figure 8: 3-D view of WEIN069 rendered in green. It highlightsthe data at the intensity level equal 3 times the rms. The bluesegmentation represents a 3-D selection (see Section 4).
Figs. 8 and 9 show in blue a selection of the centralbody of WEIN069 and the parameters chosen for runningthe fitting routine in 3D Barolo. The fitting results areshown in Figs. 9 and 10: the yellow segmentation, in the2-D and 3-D views, represents the model, while the greenrendering, in the 3-D view, represents the data. The visu-alization highlights the model and the data at the intensitylevel chosen in the contour level interface widget (in thiscase three times the value of the rms noise in the inputdata-cube).
The overlay of the segmentation of the model on the3-D rendering of the data facilitates the inspection of themodel. In the case of Fig. 10, the horizontal and verti-cal axes of the third 3-D view (middle left panel) are thevelocity and the declination dimensions, respectively. Itis immediately clear that the rotation curve of the modelin the inner rings does not rise fast enough. User inter-actions with the 3-D view such as camera zooming androtation enhance the 3-D perspective giving an even bet-ter overview of the differences. On the other hand, forchecking the data pixel by pixel (e.g., for data probing) itis better to use a two-dimensional representation.
Figure 9: The interface widgets of the AstroModeling module. In thetop panel, the interface includes the widgets for selecting a segmentthat will be used as mask for the modeling and the input param-eters for the model fitting. In manual mode one can specify thefitting method (i.e. the kind of residuals between the model and thedata to be minimized) and the weighting function, i.e. the weights(as a function of angle from the minor axis) given to the residualsbefore fitting. These weights correct for the effect that the line ofsight component of the circular velocity in a rotating disk approacheszero when approaching the minor axis. (for more information see DiTeodoro and Fraternali, 2015). In the bottom panel, the interfaceincludes a Contour level widget to choose the threshold value for thesegmentation of the model, an editable table with the parametersof the rings of the output model (see Fig.10), and push buttons forupdating the model.
11

Figure 10: Comparative layout of the output generated by the AstroModeling module. The layout is composed of three 3-D views, three 2-Dviews and a chart view. The WEIN069 data are shown in the 3-D view and the 2-D views. In the 3-D views the data are rendered in green.Each 3-D view has a different camera position: top-left, viewing direction along the velocity axis; top-right, the origin of the camera is in thecenter of the data-cube and the view is parallel to the geometrical major axis of the galaxy; middle-left, the viewing direction is along theRA axis. The white labels z and Z indicate the line of sight velocity (or redshift z) direction (i.e., increasing from z to Z ). The green arrowin the lower right corner of the top right panel points to the plane indicated by the symbol z. The middle-right view has plotting capabilitiesand the different parameters of the rings of the output model can be shown. The bottom views are slices of the data-cube: bottom-left, XY;bottom-middle, XZ; bottom-right, ZY. In the 2-D views the data are displayed with a grayscale color function. The yellow segmentation (inthe 3-D and 2-D views) represents the fitted model. The red segmentation (in the 2-D views) is a contour plot of the data. The renderingand the segmentations highlight the data and model at the rms value chosen in the Contour level widget (Fig. 9). In the chart view, thevalues of the ring parameters of the fitted model are plotted (it is possible to switch the plots in the chart view menu under the awl widget).The values of the parameters are also reported in the table widget on the AstroModeling module window interface (see Fig. 9). The valuesin the table are editable and can be used to refine the model.
12

Figure 11: Illustration of the H I data and model, fitted by 3D Barolo, of NGC2403 from the THINGS survey (Walter et al., 2008). Thegalaxy is very well resolved. The comparative layout is the same as used in Fig. 10. The top-left view is a 3-D view of NGC2403. The whitelabels represent the four cardinal directions (N, S, E, W ). The green arrow points along the line of sight. The white segmentation (in the 3-Dview) represents the model that fits the regular disk. The model has been fitted in automatic mode (i.e., no mask and no input parametershave been provided to 3D Barolo from the graphical user interface). The dark green rendering of the data, from an intensity level of 3 timesthe rms, clearly shows unsettled gas in the inner region. The top-right view has plotting capabilities and the different parameters of therings of the output model can be shown. The bottom views are slices of the data-cube: bottom-left, XY; bottom-middle, XZ; bottom-right,ZY. The blue and the pink segmentations (in the 2-D views) are contours of the data and model, respectively, at the rms value chosen in theContour level widget (see Fig. 9).
Finally, the AstroModeling module provides a tablewidget in the interface (see Fig. 9) that can be used torefine the model and update the visualization. All the ringparameters of the model are available in the table. Therefining process of the output model is crucial. In fact, thetilted-ring model fitting is a process with a high degree ofdegeneracy between the parameters, and the fitting resultsstrongly depend on the value of the initial parameters,especially for the inclination. Therefore, the models mustbe carefully checked, compared with the data, and refined.
The computational time needed by 3D Barolo to fitthe data depends on several factors: the number of vox-els, the number of rings of the model and the goodness
(i.e., whether the error in the estimate is < 10%) of theinitial parameters. However, it is not possible to provideunbiased benchmarks for a fitting routine (i.e., the per-formance highly depends on the input parameters). Togive an example, the time for fitting a source extendedup to 106 voxels, using 20 rings and having a reliable es-timation of the input parameters is ∼ 2.5 min (exploit-ing 1 CPU core at 2.60 GHz). On the other hand, oncethe fitting has been performed, recalculating a single newmodel with the same size in voxels and number of ringstakes less than 2 seconds (the process includes getting themodel from 3D Barolo and creating the 3-D segmentationin SlicerAstro as well). The computational complexity
13

of this second step is O(Nr), where N is the number ofvoxels of the source and r the number of rings. Despitethe fact that the framework is not interactive, it is stillfast enough to provide a powerful tool to refine modelsand compare them with the data.
5.3. Use Case B: finding anomalous velocity gas
It has been demonstrated that the gas distributionof some spiral galaxies (e.g., NGC2403; Fraternali et al.,2002) is not composed of just a cold regular thin disk. Stel-lar winds and supernovae can produce extra-planar gas(e.g., a galactic fountain; Bregman, 1980). In this case,modeling is used to constrain the 3-D structure and kine-matics of the extra-planar gas which is visible in the dataas a faint kinematic component in addition to the disk.
The AstroModeling module uses the output model of3D Barolo for visually highlighting the different compo-nents in the data-cube. After visualizing the model of thesymmetric cold thin disk as a segmentation, it is immedi-ately possible to locate any unusual features in the data-cube of interest and already get an idea of their properties,thus directing further modeling. For example, a model ofthe extra-planar gas above or below the disk with a slowerrotation and a vertical motion provides quantitative infor-mation about the rotation and the infall velocity of suchgas.
In Fig. 11 we show as an example the analysis that weperformed on NGC2403. The input parameters for the fit-ting have not been edited, therefore 3D Barolo performedan automatic estimation of the initial parameters. In the3-D view SlicerAstro illustrates the data of the NGC2403observations rendered in green and the tilted-ring modelgenerated with 3D Barolo as a white segmentation. Thewhite segmentation is rendered with the maximum opacityin order to obscure all the data that have been fitted by3D Barolo. This combination gives an immediate overviewof the extra-planar gas present in the NGC2403 obser-vations (Fraternali et al., 2002). Since 3D Barolo mostlyfits the symmetric regularly rotating part of the galaxy, ittherefore is a powerful tool for locating anomalous featuresin the data, such as the extra-planar gas in NGC2403.
6. Summary
SlicerAstro is an open-source project and its bina-ries are currently available in the extensions manager of3DSlicer22. The novelty of SlicerAstro over traditionalastronomical viewers is the use of 3-D interactive tools forthe visualization and analysis of H I in and around galax-ies. SlicerAstro has been designed with a strong, stableand modular C++ core, but it can be used also via Python
scripting, allowing great flexibility for user-customized vi-sualization and analysis tasks (see Section 2.1).
22The user guide is available at the following link: https://
github.com/Punzo/SlicerAstro/wiki#get-slicerastro
Although SlicerAstro is still under development, italready offers several new qualitative and quantitative vi-sualization and analysis features for the inspection of H I
and other spectral line data. The overall advantage ofSlicerAstro compared to traditional viewers (e.g., KARMA,Casaviewer and VISIONS; Gooch, 1996; McMullin et al.,2007; van der Hulst et al., 1992) is that it bundles analyt-ical operations such as smoothing and modeling with thevisualization. These visual analytics techniques enhancethe visualization itself. More important is in our viewthe interactivity offered by SlicerAstro. Interactivity iskey to enhancing the inspection and analysis of complexdatasets. In fact, precisely the interactive and coupled 3-D/2-D visualization aspects (e.g., volume rendering, nav-igation, changing color/opacity function, selecting regionsof interest in the 3-D space) which are (partially) missingin the traditional tools and which disclose powerful visualanalytics capabilities.
In Section 2.3, we presented the main module, Astro-Volume. This module provides: a user interface for loadingand writing FITS files; the display of astronomical WorldCoordinates; control of 2-D and 3-D color transfer func-tions; MRML nodes for storing the data; and data con-version tools for masks and 3DSlicer segmentation ob-jects. Fig. 3 showed how 3-D visualization gives an imme-diate overview of the H I emission in and around WEIN069(i.e. three interacting galaxies and a tidal tail Weinbergeret al., 1995; Ramatsoku et al., 2016) and the mask gener-ated by automated source finder pipelines such as SoFiA
or Duchamp. 3-D visualization highly enhances and accel-erates the inspection of the data and of the masks, allow-ing efficient manual quality control of part (i.e., complexgalaxies or groups of galaxies) of the large data sets thatwill be provided by the SKA precursors.
In addition, we presented the AstroSmoothing mod-ule in Section 3. Fig. 5 showed the filtered version ofWEIN069, obtained with a newly implemented intensity-driven gradient filter (Punzo et al., 2015). The 3-D vi-sualization highlights immediately the presence of a faintfilament between two galaxies that was hardly visible inthe original data-cube. The coupling between the inter-active smoothing algorithms (available in the parallelizedversion both on CPUs and GPUs) and the 3-D visualiza-tion allows for a detailed inspection of the result and amanual, iterative, search for the best smoothing parame-ters for maximally enhancing the local signal-to-noise ratioof the very faint signal.
Moreover, we introduced the AstroCloudLasso selec-tion tool in Section 4. This is a 3-D interactive selectiontool (Yu et al., 2012), optimized for H I data, added bySlicer-Astro in the SegmentationEditor of 3DSlicer.We showed how to use this tool to create and modify seg-mentation objects in the 3-D views (Fig. 7). The toolcan be also used in the 2-D views for a 2-D selection.CloudLasso is an intuitive and efficient 3-D selection method,which is crucial for allowing manual modification of masksgenerated automatically by source finder pipelines (e.g.,
14

adding very faint signal missed by automated pipelines).A second application of the tool is to select a region ofinterest (ROI). The ROI can be successively used to per-form calculations, such as tilted-ring model fitting, in theselection.
In Section 5, we demonstrated that 3-D visualization,coupled to modeling, provides additional capabilities help-ing the discovery and analysis of subtle structures in the3-D domain. We integrated 3D Barolo, a tilted-ring modelfitting package, in SlicerAstro, providing an interface toset the input parameters for the fitting (Fig. 8). More-over, the interface includes a widget for editing the ringparameters of the output model, for recalculating and vi-sualizing the model on top of the data. We also showedthat 3-D is a powerful tool not only to provide a region ofinterest for the calculations, but also for the inspection ofthe model (Fig. 10) and the data not fitted by the model(e.g. extra-planar gas in NGC2403, Fig. 11).
The efficiency and the effectiveness of the visual ana-lytics techniques implemented in SlicerAstro have beentested. Quantifying the results for the efficiency of themodeling capabilities in SlicerAstro is not straightfor-ward as the speed depends on the size of the data-cubeand on the input parameters. However, even in the caseof a moderately large and well resolved object such asNGC2403 (dimension ∼ 1.4×10⁶ voxels), the model fittingis performed in less than 2 minutes. In addition, modify-ing manually the parameters of the output model is in-teractive. The 3-D smoothing algorithms in SlicerAstro
have interactive performance. An adaptive smoothing op-eration on NGC2403 data-cube is performed in less than0.1 seconds exploiting the computing power of a GPU (i.e.,GeForce GTX860M). The main advantage of SlicerAstrois that the combination of these smoothing and modelingcapabilities with interactive 3-D visualization provides animmediate overview of all the coherent 3-D structures ofthe data, masks and models. This is very powerful and itdefinitely does increase the effectiveness of the visualiza-tion and, thus, the efficiency of the astronomical users inthe manual exploration of many datasets.
We conclude that interactive 3-D quantitative and com-parative visualization, 3-D user interaction and analysiscapabilities available in SlicerAstro form an effective newtool that will boost, in terms both of efficiency and qual-ity, the analysis of complex sources in the context of largedata-flows that will be provided by the SKA precursors.However, in order to fulfill all the visualization require-ments defined in the Section 2.1 (and extensively discussedin Punzo et al., 2015), some quantitative features stillhave to be incorporated in SlicerAstro. For example,a tool displaying the histogram of the flux intensities ofthe data-cube will greatly help the user in setting the 2-D color function. The capability to display flux densityprofiles (i.e. linked 1-D visualization) is also necessary,especially when dealing with unresolved sources. In ad-dition, capabilities for overlaying (in an automated way)other datasets (including datasets with different grids and
projection systems) will enhance the inspection of multi-wave bands datasets and are under development. Fur-thermore, a dedicated tool in SlicerAstro for easily dis-playing position-velocity (P-V) diagrams will improve theinspection and comparison of models. Specialized analysistasks on 3-D selections (e.g., calculating statistics, momentmaps, etc., in regions of interest) can be performed by run-ning scripts in the 3DSlicer Python console. On the otherhand, customized quantitative tasks can also be added, ascore modules, in SlicerAstro, similar to the implemen-tation of the AstroModeling module. These capabilitieswill be integrated in future updates of SlicerAstro.
The implementation of VO interoperability and the ad-vantages of such connectivity will be considered and an-alyzed further in the case of SlicerAstro. In fact, theSAMP protocol and the FITS format are no longer glob-ally accepted standards (Mink, 2015; Mink et al., 2015;Thomas et al., 2015). Other scientific fields such as med-ical imaging can provide insights on how to improve theastronomical standards. For example, the Digital Imag-ing and Communications in Medicine (DICOM) (Milden-berger et al., 2002) protocol is a remarkable example of astandard for handling, storing, printing, and transmittinginformation in medical imaging. DICOM includes a fileformat definition and a network communications proto-col universally accepted and used by the medical scientificcommunity.
SlicerAstro is a project under continuous develop-ment and we have adopted an agile development approach(i.e. development cycles are driven by user-feedback). Inaddition, the software is open-source and third parties areencouraged to contribute. More important, any idea, feed-back, criticism or bug can be reported at the following linkin the tracker issue23.
Finally, although the development of SlicerAstro thusfar mainly focused on 3-D H I data, it will also be a usefultool for any other type of 3-D astronomical data such asmm/submm molecular line data and optical integral fieldspectroscopic data. Molecular line data and optical/NIRspectroscopic data have the additional complication thatoften more than one spectral line are present in a singlespectral window. This makes the visualization more com-plex, though clever stacking of the known spectral linescan e.g. enhance the signal to noise and stacking toolscan help to bring out the kinematic behavior of gas whichemits multiple spectral lines. One can also think of ad-ditional tools to visualize line ratios by e.g. superposingdifferent spectral lines in different colors interactively. Inconclusion, though SlicerAstro is useful for other typesof astronomical 3-D data, additional tools will be requiredtailored to the kind of data and the scientific questions tobe addressed.
23https://github.com/Punzo/SlicerAstro/issues
15

7. Appendix
Below, the Python code provides an example for ap-plying smoothing to a data-cube, performing the render-ing and saving the last as a video. The script can be copyand pasted in the 3DSlicer Python console, or it can belaunched from the command line with the following com-mand:
. / S l i c e r −−python−s c r i p t s c r i p t . py
More information is provided at the following link: https://github.com/Punzo/SlicerAstro/wiki.
# L o a d a d a t a − c u b e i n S l i c e r A s t r oslicer.util.loadVolume("/full path/WEIN069.fits" ,{"center":True })
mw = slicer.util.mainWindow()ms = mw.moduleSelector()
# S m o o t h t h e d a t a − c u b e i na u t o m a t i c mode ( CPU )
ms.selectModule(’AstroSmoothing’)smowidget = slicer.modules.astrosmoothing.widgetRepresentation()
smowidget.onApply()
# S e t u p t h e R e n d e r f o r t h e d a t a −c u b e a n d i t s f i l t e r e d v e r s i o n
ms.selectModule(’AstroVolume’)astrovolumewidget = slicer.modules.astrovolume.widgetRepresentation()
astrovolumewidget.onCurrentQualityControlChanged(1)
volumes = slicer.mrmlScene.GetNodesByClass("vtkMRMLAstroVolumeNode")
volumefiltered = volumes.GetItemAsObject(1)
smomrmlpara.SetInputVolumeNodeID(volumefiltered.GetID())
astrovolumewidget.onCurrentQualityControlChanged(1)
# C r e a t e v i d e o sms.selectModule(’ScreenCapture’)screencapturewidget = slicer.modules.screencapture.widgetRepresentation()
instance = screencapturewidget.self()
# F o r t h e d a t a − c u b eviewNode = slicer.util.getNode(’vtkMRMLViewNode1’)
instance.viewNodeSelector.setCurrentNode(viewNode)
instance.numberOfStepsSliderWidget.setValue(360)
instance.videoExportCheckBox.setChecked(1)
instance.videoFormatWidget.setCurrentIndex(1)
instance.videoFileNameWidget.setText("WEIN069.mp4")
instance.videoLengthSliderWidget.setValue(6)
instance.onCaptureButton()# F o r t h e f i l t e r e d v e r s i o nviewNode = slicer.util.getNode(’vtkMRMLViewNode2’)
instance.viewNodeSelector.setCurrentNode(viewNode)
instance.numberOfStepsSliderWidget.setValue(360)
instance.videoExportCheckBox.setChecked(1)
instance.videoFormatWidget.setCurrentIndex(1)
instance.videoFileNameWidget.setText("WEIN069 smoothed.mp4")
instance.videoLengthSliderWidget.setValue(6)
instance.onCaptureButton()
8. Acknowledgments
We thank M.A. Ramatsoku and M.A.W. Verheijen forproving us with the H I data of WEIN069. Support alsocame from S. Pieper (Isomics, Inc.), A. Lasso (Laboratoryof Percutaneous Surgery at Queen’s University) and E. diTeodoro (Australian National University) in the form offeedback and assistance.
Finally, we thank the reviewers for their constructivecomments, which helped us to improve the paper.
D. Punzo and J.M van der Hulst acknowledge the sup-port from the European Research Council under the Euro-pean Union’s Seventh Framework Programme (FP/2007-2013)/ERC Grant Agreement nr. 291-531.
L. Yu was partially supported from National NaturalScience Foundation of China (Grant No. 61502132).
We are grateful to the various agencies and programsthat funded support and development of 3DSlicer overthe years.
9. References
References
M. Verheijen, T. Oosterloo, G. Heald, W. van Cappellen, HI Surveyswith APERTIF, in: Panoramic Radio Astronomy: Wide-field 1-2GHz Research on Galaxy Evolution, 2009, p. 10.
16

A. R. Duffy, M. J. Meyer, L. Staveley-Smith, M. Bernyk, D. J. Cro-ton, B. S. Koribalski, D. Gerstmann, S. Westerlund, Predictionsfor ASKAP neutral hydrogen surveys, Monthly Notices of theRoyal Astronomical Society 426 (2012) 3385–3402.
T. Oosterloo, Visualisation of Radio Data, Proceedings of the Astro-nomical Society of Australia 12 (1995) 215.
A. A. Goodman, Principles of high-dimensional data visualization inastronomy, Astronomische Nachrichten 333 (2012) 505.
D. Punzo, J. M. van der Hulst, J. B. T. M. Roerdink, T. A. Oosterloo,M. Ramatsoku, M. A. W. Verheijen, The role of 3-D interactivevisualization in blind surveys of H I in galaxies, Astronomy andComputing 12 (2015) 86–99.
M. T. Whiting, DUCHAMP: a 3D source finder for spectral-line data,Monthly Notices of the Royal Astronomical Society 421 (2012)3242–3256.
P. Serra, T. Westmeier, N. Giese, R. Jurek, L. Floer, A. Pop-ping, B. Winkel, T. van der Hulst, M. Meyer, B. S. Koribalski,L. Staveley-Smith, H. Courtois, SOFIA: a flexible source finder for3D spectral line data, Monthly Notices of the Royal AstronomicalSociety 448 (2015) 1922–1929.
R. Taylor, FRELLED: A realtime volumetric data viewer for as-tronomers, Astronomy and Computing 13 (2015) 67–79.
B. R. Kent, 3D Scientific Visualization with Blender, 2015.J. P. Naiman, AstroBlend: An astrophysical visualization package
for Blender, Astronomy and Computing 15 (2016) 50–60.F. P. A. Vogt, C. I. Owen, L. Verdes-Montenegro, S. Borthakur,
Advanced Data Visualization in Astrophysics: The X3D Pathway,The Astrophysical Journal 818 (2016) 115.
G. Ferrand, J. English, P. Irani, 3D visualization of astronomy datacubes using immersive displays, ArXiv e-prints.
D. Vohl, D. G. Barnes, C. J. Fluke, G. Poudel, N. Georgiou-Karistianis, A. H. Hassan, Y. Benovitski, T. H. Wong, O. Kaluza,T. D. Nguyen, C. P. Bonnington, Large-scale comparative visual-isation of sets of multidimensional data, ArXiv e-prints.
D. Punzo, T. van der Hulst, J. Roerdink, J.-C. Fillion-Robin,SlicerAstro: Astronomy (HI) extension for 3D Slicer, AstrophysicsSource Code Library (Nov. 2016).
A. Fedorov, R. Beichel, J. Kalpathy-Cramer, J. Finet, J.-C. Fillion-Robin, S. Pujol, C. Bauer, D. Jennings, F. Fennessy, M. Sonka,J. Buatti, S. Aylward, J. Miller, S. Pieper, R. Kikinis, 3d sliceras an image computing platform for the quantitative imaging net-work 30 (9) (2012) 1323–41.
W. D. Pence, L. Chiappetti, C. G. Page, R. A. Shaw, E. Stobie,Definition of the Flexible Image Transport System (FITS), version3.0, Astronomy and Astrophysics 524 (2010) A42.
M. R. Calabretta, E. W. Greisen, Representations of celestial coor-dinates in FITS, Astronomy and Astrophysics 395 (2002) 1077–1122.
E. W. Greisen, M. R. Calabretta, F. G. Valdes, S. L. Allen, Repre-sentations of spectral coordinates in FITS, Astronomy and Astro-physics 446 (2006) 747–771.
S. D. Roth, Ray casting for modeling solids, Elsevier 18 (1982) 109–144.
W. Schroeder, K. Martin, B. Lorensen, The Visualization Toolkit(4th ed.), Kitware, 2006.
M. Taylor, T. Boch, M. Fitzpatrick, A. Allan, L. Paioro, J. Taylor,D. Tody, IVOA Recommendation: SAMP - Simple ApplicationMessaging Protocol Version 1.3, ArXiv e-prints.
M. B. Taylor, TOPCAT STIL: Starlink Table/VOTable ProcessingSoftware, in: P. Shopbell, M. Britton, R. Ebert (Eds.), Astro-nomical Data Analysis Software and Systems XIV, Vol. 347 ofAstronomical Society of the Pacific Conference Series, 2005, p. 29.
M. Ramatsoku, M. A. W. Verheijen, R. C. Kraan-Korteweg, G. I. G.Jozsa, A. C. Schroder, T. H. Jarrett, E. C. Elson, W. van Driel,W. J. G. de Blok, P. A. Henning, The WSRT ZoA Perseus-Piscesfilament wide-field H I imaging survey - I. H I catalogue and atlas,Monthly Notices of the Royal Astronomical Society 460 (2016)923–941.
W. D. Pence, CFITSIO: A FITS File Subroutine Library, Astro-physics Source Code Library (Oct. 2010).
M. R. Calabretta, Wcslib and Pgsbox, Astrophysics Source Code
Library (Aug. 2011).E. M. Di Teodoro, F. Fraternali, 3D-Barolo: 3D fitting tool for the
kinematics of galaxies, Astrophysics Source Code Library (Jul.2015).
R. Sancisi, F. Fraternali, T. Oosterloo, T. van der Hulst, Cold gasaccretion in galaxies, The Astronomy and Astrophysics Review 15(2008) 189–223.
A. Popping, R. Jurek, T. Westmeier, P. , L. Floer, M. Meyer,B. Koribalski, Comparison of Potential ASKAP HI Survey SourceFinders, Publications of the Astronomical Society of Australia 29(2012) 318–339.
D. Punzo, J. M. van der Hulst, J. B. T. M. Roerdink, Finding faintH I structure in and around galaxies: Scraping the barrel, Astron-omy and Computing 17 (2016) 163–176.
P. Serra, T. Westmeier, N. Giese, R. Jurek, L. Floer, A. Popping,B. Winkel, T. van der Hulst, M. Meyer, B. Koribalski, L. Staveley-Smith, H. Courtois, SoFiA: Source Finding Application, Astro-physics Source Code Library (Dec. 2014).
S. Johnston, R. Taylor, M. Bailes, N. Bartel, C. Baugh, M. Bi-etenholz, C. Blake, R. Braun, J. Brown, S. Chatterjee, J. Dar-ling, A. Deller, R. Dodson, P. Edwards, R. Ekers, S. Ellingsen,I. Feain, B. Gaensler, M. Haverkorn, G. Hobbs, A. Hopkins,C. Jackson, C. James, G. Joncas, V. Kaspi, V. Kilborn, B. Korib-alski, R. Kothes, T. Landecker, A. Lenc, J. Lovell, J.-P. Macquart,R. Manchester, D. Matthews, N. McClure-Griffiths, R. Norris, U.-L. Pen, C. Phillips, C. Power, R. Protheroe, E. Sadler, B. Schmidt,I. Stairs, L. Staveley-Smith, J. Stil, S. Tingay, A. Tzioumis,M. Walker, J. Wall, M. Wolleben, Science with ASKAP. TheAustralian square-kilometre-array pathfinder, Experimental As-tronomy 22 (2008) 151–273.
R. Norris, The Challenge of Astronomical Visualisation, In Astro-nomical Data Analysis Software and Systems III 61 (1994) 51.
L. Yu, K. Efstathiou, P. Isenberg, T. Isenberg, Efficient structure-aware selection techniques for 3d point cloud visualizations with2dof input, Visualization and Computer Graphics, IEEE Trans-actions on 18 (12) (2012) 2245–2254.
L. Yu, K. Efstathiou, P. Isenberg, T. Isenberg, CAST: Effectiveand Efficient User Interaction for Context-Aware Selection in 3DParticle Clouds, IEEE Transactions on Visualization, ComputerGraphics 22 (1) (2016) 886–895.
G. Wyvill, C. McPheeters, B. Wyvill, Data structure forsoft objects,The Visual Computer 2 (4) (1986) 227–234.URL http://dx.doi.org/10.1007/BF01900346
W. E. Lorensen, H. E. Cline, Marching cubes: A high resolution3d surface construction algorithm, SIGGRAPH Comput. Graph.21 (4) (1987) 163–169.URL http://doi.acm.org/10.1145/37402.37422
H. J. A. M. Heijmans, Connected morphological operators for binaryimages, COMPUTER VISION AND IMAGE UNDERSTAND-ING 73 (1999) 99–120.
U. Moschini, P. Teeninga, M. H. F. Wilkinson, N. Giese, D. Punzo,J. M. van der Hulst, S. C. Trager, Towards better segmentationof large floating point 3d astronomical data sets: first results, in:Proceedings of the 2014 Conference on Big Data from Space (BiDS2014), 2014, pp. 232–235.
N. Giese, T. van der Hulst, P. Serra, T. Oosterloo, Non-parametricestimation of morphological lopsidedness, Monthly Notices of theRoyal Astronomical Society 461 (2016) 1656–1673.
P. J. Warner, M. C. H. Wright, J. E. Baldwin, High resolution ob-servations of neutral hydrogen in M33 - II. The velocity field.,Monthly Notices of the Royal Astronomical Society 163.
A. Bosma, The distribution and kinematics of neutral hydrogen inspiral galaxies of various morphological types, Ph.D. thesis, PhDThesis, Groningen Univ., (1978) (1978).
E. M. Di Teodoro, F. Fraternali, 3D BAROLO: a new 3D algorithmto derive rotation curves of galaxies, Monthly Notices of the RoyalAstronomical Society 451 (2015) 3021–3033.
P. Kamphuis, G. I. G. Jozsa, S.-. H. Oh, K. Spekkens, N. Urbancic,P. Serra, B. S. Koribalski, R.-J. Dettmar, Automated kinematicmodelling of warped galaxy discs in large H I surveys: 3D tilted-ring fitting of H I emission cubes, Monthly Notices of the Royal
17

Astronomical Society 452 (2015) 3139–3158.P. Kamphuis, G. I. G. Jozsa, S.-. H. Oh, K. Spekkens, N. Urbancic,
P. Serra, B. S. Koribalski, R.-J. Dettmar, FAT: Fully AutomatedTiRiFiC, Astrophysics Source Code Library (Jul. 2015).
G. I. G. Jozsa, F. Kenn, T. A. Oosterloo, U. Klein, TiRiFiC:Tilted Ring Fitting Code, Astrophysics Source Code Library(Aug. 2012).
G. I. G. Jozsa, F. Kenn, U. Klein, T. A. Oosterloo, Kinematic mod-elling of disk galaxies. I. A new method to fit tilted rings to datacubes, Astronomy and Astrophysics 468 (2007) 731–774.
F. Walter, E. Brinks, W. J. G. de Blok, F. Bigiel, R. C. Kennicutt,Jr., M. D. Thornley, A. Leroy, THINGS: The H I Nearby GalaxySurvey, The Astronomical Journal 136 (2008) 2563–2647.
F. Fraternali, G. van Moorsel, R. Sancisi, T. Oosterloo, Deep H ISurvey of the Spiral Galaxy NGC 2403, The Astronomical Journal123 (2002) 3124–3140.
J. N. Bregman, The galactic fountain of high-velocity clouds, TheAstrophysical Journal 236 (1980) 577–591.
R. Gooch, Karma: a Visualization Test-Bed, in: G. H. Jacoby,J. Barnes (Eds.), Astronomical Data Analysis Software and Sys-tems V, Vol. 101 of Astronomical Society of the Pacific ConferenceSeries, 1996, p. 80.URL http://www.atnf.csiro.au/computing/software/karma/
J. P. McMullin, B. Waters, D. Schiebel, W. Young, K. Golap, CASAArchitecture and Applications, in: R. A. Shaw, F. Hill, D. J. Bell(Eds.), Astronomical Data Analysis Software and Systems XVI,Vol. 376 of Astronomical Society of the Pacific Conference Series,2007, p. 127.
J. M. van der Hulst, J. P. Terlouw, K. G. Begeman, W. Zwitser, P. R.Roelfsema, The Groningen Image Processing SYstem, GIPSY, in:D. M. Worrall, C. Biemesderfer, J. Barnes (Eds.), AstronomicalData Analysis Software and Systems I, Vol. 25 of AstronomicalSociety of the Pacific Conference Series, 1992, p. 131.URL https://www.astro.rug.nl/~gipsy/articles/gipsypaper.
html
R. Weinberger, W. Saurer, R. Seeberger, Penetrating the ”zone ofavoidance”. I. A compilation of optically identified extragalacticobjects within |b| <= 5deg., Astronomy and Astrophysics Supple-ment 110 (1995) 269.
J. D. Mink, Astronomical data formats: What we have and how wegot here, Astronomy and Computing 12 (2015) 128–132.
J. Mink, R. G. Mann, R. Hanisch, A. Rots, R. Seaman, T. Jenness,B. Thomas, W. O’Mullane, The Past, Present, and Future of As-tronomical Data Formats, in: A. R. Taylor, E. Rosolowsky (Eds.),Astronomical Data Analysis Software an Systems XXIV (ADASSXXIV), Vol. 495 of Astronomical Society of the Pacific ConferenceSeries, 2015, p. 11.
B. Thomas, T. Jenness, F. Economou, P. Greenfield, P. Hirst, D. S.Berry, E. Bray, N. Gray, D. Muna, J. Turner, M. de Val-Borro,J. Santander-Vela, D. Shupe, J. Good, G. B. Berriman, S. Kitaeff,J. Fay, O. Laurino, A. Alexov, W. Landry, J. Masters, A. Brazier,R. Schaaf, K. Edwards, R. O. Redman, T. R. Marsh, O. Streicher,P. Norris, S. Pascual, M. Davie, M. Droettboom, T. Robitaille,R. Campana, A. Hagen, P. Hartogh, D. Klaes, M. W. Craig,D. Homeier, Learning from FITS: Limitations in use in modernastronomical research, Astronomy and Computing 12 (2015) 133–145.
P. Mildenberger, M. Eichelberg, E. Martin, Introduction to the dicomstandard, European radiology 12 (4) (2002) 920–927.
18