i- ch ffic - florida department of transportation - · pdf filecorresponding capacity...
TRANSCRIPT


I-
FL
-75 S
LORIDA
SketTra
A DEPA
tch affic
ARTME
CENTR
Nove
InteAna
NT OF
RAL OF
ember 201
erstaalys
TRANS
FICE
10
ate Psis
SPORTA
Plan
ATION
n

Project Team
Florida Department of Transportation • Systems Planning Office
• Transportation Statistics Office
Florida Department of Transportation, Districts Two and Five Representatives
Department Consultants

TABLE OF CONTENTS
Purpose .................................................................................................................................................................................................................1
Method: Mainline AADT Existing and Forecast Conditions .........................................................................................................3 Background .......................................................................................................................................................................................3 Existing Traffic Volumes ..............................................................................................................................................................3 Traffic Forecasting Methodologies and Analysis Procedures .....................................................................................6
Data Collection and Sources .....................................................................................................................................6 Traffic Forecast and Demand Capacity .................................................................................................................................8
Future Year 2035 Mainline Lane Requirement ...............................................................................................9 Results ............................................................................................................................................................................................ 10
Conclusions ...................................................................................................................................................................................................... 11 Next Steps ....................................................................................................................................................................................... 11
References ........................................................................................................................................................................................................ 12
Appendices ....................................................................................................................................................................................................... 13

1
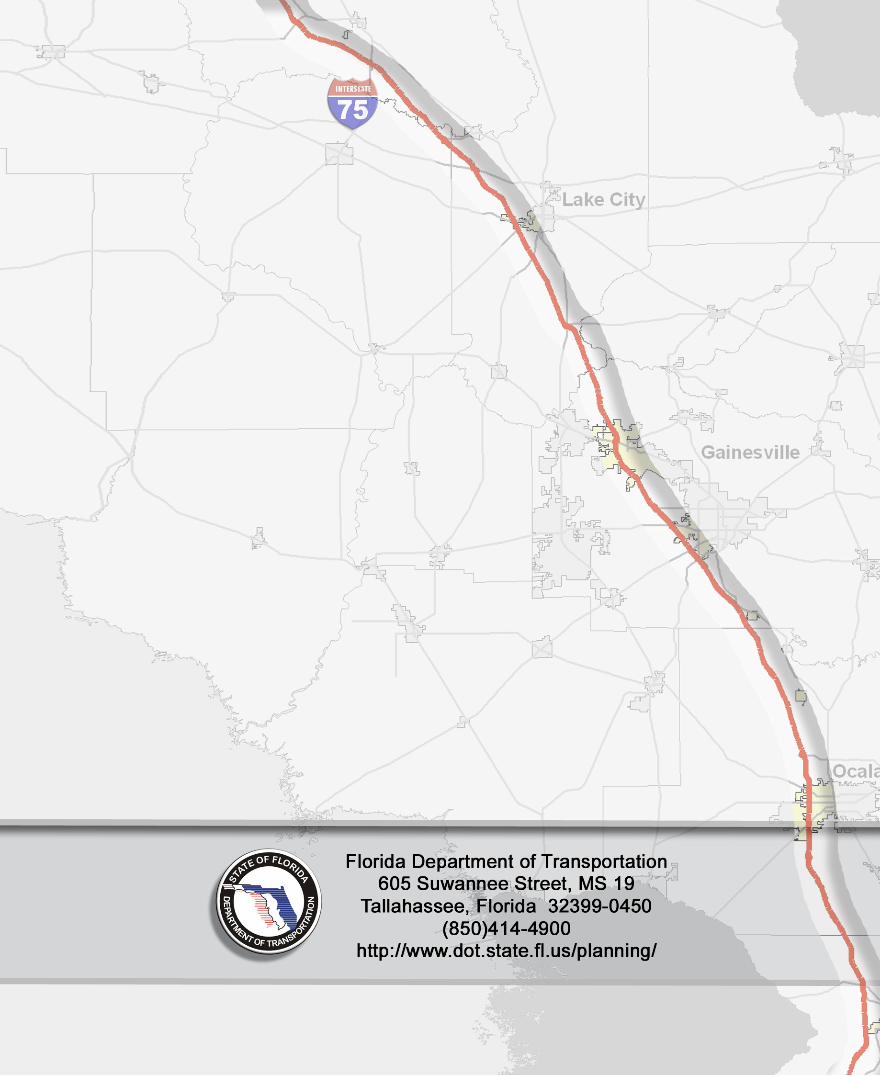
Purpose The Florida Department of Transportation Central Office in coordination with the District Offices has prepared a Sketch Interstate Plan for the I‐75 corridor from the Florida‐Georgia border south through Sumter County, Florida. Exhibit 1 displays the I‐75 Sketch Plan Corridor Area. The major purpose of this Sketch Interstate Plan is to improve the mobility of users of I‐75 by examining the existing interstate system, with respect to planned improvements, and reveal general problem areas and trends that will be examined in more detail in a later phase. The preparation of a Sketch Plan is an integral part of the long range planning process for the development of the Strategic Intermodal System (SIS). As part of the Sketch Plan process, the Project Team, which included Department Staff and their consultant, developed multiple Technical Memorandums to analyze different concepts encompassing the following focus areas:
• Safety
• Traffic
• Freight Mobility
• Environmental Analysis
• Planned Improvements and Conceptual Mobility Opportunities
The purpose of this Traffic Technical Memorandum is to determine existing and future traffic conditions along the I‐75 Sketch Plan corridor. This Technical Memo identified future travel demand and determined capacity needs through year 2035 for the I‐75 mainline. Outlined within this memo are the methods and techniques used in the analysis and results to be found in the completed I‐75 Sketch Plan.

Hamilton
Suwannee
Madison Columbia
Taylor
Lafayette
Dixie
Gilchrist
Baker
Hernando
Duval
Nassau
Citrus
Marion
Levy
Alachua
Union
Bradford
La
Sumter
Putnam
Clay
Gainesville
Ocala
§̈¦75
§̈¦10
£¤301
£¤27
£¤19
£¤301
¬«40
¬«44
¬«26 ¬«20
Gulf of Mexico
Lake City
§̈¦10
¬«100
§̈¦75
Georgia
I-75 Sketch Interstate PlanExhibit 1: Study Area
I-75 Corridor
Other SIS Roads
0 10 205 Miles
Traffic
Sketch Interstate Plan
LEGEND
.
State of FloridaDepartment of TransportationSystems Planning
City Limits
Water

3
Method: Mainline AADT Existing and Forecast Conditions
Background This section describes the methodology used to assess existing and forecasted traffic for the I‐75 Sketch Interstate Plan project. Existing traffic volumes have been presented and alternative sources of future traffic forecasts are offered. The forecast sources include regional planning models and historical trends. A summary of lane requirements on I‐75 mainline for year 2035 is also presented. It should be noted that the purpose of the I‐75 Sketch Plan traffic forecast is to summarize the demand along the mainline only. Ramp and cross street traffic demand is not taken into account for the purposes of this section. This Technical Memorandum provides a snapshot of the I‐75 mainline mobility needs without detailed operational analysis typically found in Master Plans and Project Development and Environmental (PD&E) studies. Results for the mainline are provided as Annual Average Daily Traffic (AADT) along with corresponding capacity thresholds.
Existing Traffic Volumes In order to assess the existing travel demands on an interstate facility it is necessary to gather and evaluate data from a variety of sources. The type of data needed, sources for data, and specific data items to be obtained from the sources are listed within this section. Year 2006 existing traffic volumes for the I‐75 Sketch Plan were developed from the Florida Traffic Information (FTI) CD and from other available studies. The studies included:
• The I‐75 Master Plan being conducted by District Two
• The I‐75 Interchange Operational Analysis Report (IOAR) for the Ocala area created by District Five
• The IOAR for the I‐75/Turnpike interchange developed by the FTE.
• I‐75 PD&E study conducted by District Five
The existing AADT information used for the Sketch Plan is complete and provided within Tables 1 and 2. Exhibit 2 displays the site locations along the corridor. The site locations correlate to permanent and portable count stations along both urban and rural sections of the interstate. For the purposes of this report, only mainline capacity needs are addressed.

Hamilton
Suwannee
Madison Columbia
Taylor
Lafayette
Dixie
Gilchrist
Baker
Hernando
Duval
Nassau
Citrus
Marion
Levy
Alachua
Union
Bradford
La
Sumter
Putnam
Clay
Gainesville
Ocala
§̈¦75
§̈¦10
£¤301
£¤27
£¤19
£¤301
¬«40
¬«44
¬«26 ¬«20
Gulf of Mexico
Lake City
§̈¦10
¬«100
§̈¦75
Georgia
I-75 Sketch Interstate PlanExhibit 2: Traffic Count Locations
I-75 Corridor
Other SIS Roads
0 10 205 Miles
Traffic
Sketch Interstate Plan
LEGEND
.
State of FloridaDepartment of TransportationSystems Planning
City Limits
Water
Site 11
Site 10
Site 9
Site 8
Site 7
Site 12
Site 6Site 5
Site 4
Site 2
Site 3
Site 1
Count Site

5
Table 1
District Two Existing AADT (2006)
Site #
Description Area Type*
Existing
AADT Lanes
1 I‐75, north of CR 143, Hamilton County
Rural 40,400 6
2 I‐75, south of I‐10, Columbia County
Rural 43,400 6
3 I‐75, south of SR 25 (US 441), Columbia County
Rural 47,700 6
4 I‐75, south of SR 20 (US 441), Alachua County
Urban 54,300 6
5 I‐75, south of SR 26, Alachua County
Urban 80,600 6
6 I‐75, south of SR 121, Alachua County
Rural 57,900 6
Source: 2006 FTI CD, Local Plans/Studies *Rural LOS standard is ‘C’ while Urban LOS standard is ‘D’
Table 2 District Five Existing AADT (2006)
Site #
Description Area Type*
Existing
AADT Lanes
7 I‐75, northern FDOT District Five limits, Marion County
Rural 58,300 6
8 I‐75, north of Ocala, Marion County
Urban 69,200 6
9 I‐75, south of Ocala, Marion County
Urban 75,000 6
10 I‐75, north of Florida’s Turnpike, Sumter County
Rural 69,600 6
11 I‐75, south of Florida’s Turnpike, Sumter County
Rural 35,700 4
12 Florida’s Turnpike, east of I‐75, Sumter County
Rural 34,900 4
Source: 2006 FTI CD, Local Plans/Studies *Rural LOS standard is ‘C’ while Urban LOS standard is ‘D’ Based on analysis of the per lane capacity from the 2002 Quality/Level of Service Handbook (revised 2007) for both urban and rural areas, the existing interstate capacity is sufficient to handle the 2006 daily traffic demand. Sites 1 through 4 have capacity needs well under the existing lane configuration. Urban area types apply LOS standards that allow a greater density of traffic before surpassing the threshold.

6
Actual AADT data is collected from permanent, continuous counters (TTMS). AADT counts are estimated for all other locations using portable counters. Adjustment factors are applied to short‐term traffic counts taken by portable axle and vehicle counters (PTMS) to estimate AADT every section break of the State Highway System.
Traffic Forecasting Methodologies and Analysis Procedures In order to assess the traffic forecasts on an interstate facility it is necessary to gather and evaluate data from a variety of sources. Sources may include historical trends, regional models, and/or previous planning studies. This section describes the methodology used to assess the forecasted traffic for the I‐75 Sketch Interstate Plan project. The type of data needed, sources for data, and specific data items to be obtained from the sources are listed within this section.
Data Collection and Sources Traffic forecasting data is usually available from several sources. In urbanized areas with a Metropolitan Planning Organization (MPO) or Transportation Planning Organization (TPO), a regional travel demand model that complies with the Florida Statewide Urban Transportation Model Structure (FSUTMS) is a good resource for future traffic forecasts. In rural areas, historic growth trends from the FTI CD together with the Florida Statewide Model will provide future traffic. Below are the resources used:
• Traffic Volume Projections from Statewide Model
• Traffic Volume Projections from the Central Florida Regional Planning Model (CFRPM)
• Traffic Volume Projections from the Gainesville Metropolitan Planning Organization Model
• Growth Projections based on Historical AADT Trends

7
The AADT information used for the I‐75 Sketch Plan included four sources of traffic forecasts; the Central Florida Regional Planning Model (CFRPM) provided forecasts to year 2025, the Gainesville Metropolitan Planning Organization Model provided forecasts to year 2025, the Statewide Model provided forecasts to 2030, and FTI CD 2006 was used to create a trend line to the year 2035. The AADT volumes from the models were extrapolated to year 2035 to match the historic trend line year from FTI CD. The locations are listed below.
Table 3 Station Numbers Associated with Sites
District Two
Site_Station # Location
1_320112 I‐75, north of CR 143, Hamilton County
2_290320 I‐75, south of I‐10, Columbia County
3_290257 I‐75, south of SR 25 (US 441), Columbia County
4_260454 I‐75, south of SR 20 (US 441), Alachua County
5_260488 I‐75, south of SR 26, Alachua County
6_269904 I‐75, south of SR 121, Alachua County
District Five
Station # Location
7_360436 I‐75, northern FDOT District Five limits, Marion County
8_360438 I‐75, north of Ocala, Marion County
9_360317 I‐75, south of Ocala, Marion County
10_180188 I‐75, north of Florida’s Turnpike, Sumter County
11_189920 I‐75, south of Florida’s Turnpike, Sumter County
12_979931 Florida’s Turnpike, east of I‐75, Sumter County
Sites 4 and 5 are located in urban areas within the cities of Gainesville and Alachua. Sites 8 and 9 are located in urban areas within the city of Ocala. The other sites are located in rural areas.

8
Traffic Forecast and Demand Capacity In order to assess the travel demand on an interstate facility it is necessary to gather and evaluate the existing and forecasted traffic. Forecasting sources included historical trends, regional models, and/or previous planning studies. Acceptable capacity thresholds must also be obtained from the Florida Department of Transportation. Capacity thresholds are upper traffic volume limitations given a specific Level of Service (LOS). LOS standards are rated from ‘A’ to ‘F’ and indicate a driver’s perception of the roadway. This section describes the methodology used to assess the travel demand for the I‐75 Sketch Interstate Plan project through the 2035 design year.
Figure 1 District Five: Site 11 Example
As an example, Figure 1 displays the results of the two models covering District Five and the historical trend derived from the 2006 FTI CD. Lane capacity thresholds are provided for 4, 6, and 8 lanes based on Rural LOS conditions. Intra year volume forecasts can also be estimated between years 2000 and 2035. Conversion factors have been applied to the peak hour model output to provide the AADT.
CFRPM Model
Trend based on Historic Data
4-lanes
6-lanes
Statewide Model
8-lanes
20,000
40,000
60,000
80,000
100,000
120,000
140,000
1990 1995 2000 2005 2010 2015 2020 2025 2030 2035 2040
AA
DT
Year
Site # 11 (Rural ‐ LOS Standard C): I‐75 from CR 470 to Fl Turnpike, Sumter County (FDOT Count Station # 189920)

9
Future Year 2035 Mainline Lane Requirement Urban areas that extend between interchanges along I‐75 were captured within the cities of Ocala and Gainesville. The project area north and south of these cities is rural outside of a small section along Lake City. The minimum FDOT LOS standard for I‐75 in rural areas is ‘C’ and for urban areas is ‘D’.1 The AADT forecasts are shown in Tables 4 and 5. Graphs within Appendix A show the LOS ‘C’ capacity thresholds for 4, 6 and 8 lane freeways in rural areas and LOS ‘D’ capacity thresholds for 4, 6, 8 and 10 lane freeways in urban areas. These capacity thresholds were obtained from the Florida Department of Transportation’s Generalized LOS tables based on the 2002 Quality/Level of Service Handbook (revised 2007). Future demand results are the product of two analysis results; constrained and unconstrained demand. The constrained travel demand was estimated by averaging the AADT forecast from the three data sources. Unconstrained demand is based on the maximum forecasted volume from the three data sources. The data sources consisted of the models and historical trends.
Table 4 District Two Future Year 2035 AADT and Lane Requirement
Site #
Description Area Type
LOS Standard*
Unconstrained Demand** Constrained Demand***
AADT Lanes Needed
AADT Lanes Needed
1 I‐75, north of CR 143, Hamilton County
Rural C 72,100 6 68,600 6
2 I‐75, south of I‐10, Columbia County
Rural C 86,300 8 78,100 8
3 I‐75, south of SR 25 (US 441), Columbia County
Rural C 78,600 8 75,000 8
4 I‐75, south of SR 20 (US 441), Alachua County
Urban D 107,300 8 89,800 6
5 I‐75, south of SR 26, Alachua County
Urban D 141,100 10 114,700 8
6 I‐75, south of SR 121, Alachua County
Rural C 128,400 10 91,100 8
*Based on an internal FDOT white paper recommending changes to FDOT LOS Standards. **Unconstrained demand is based on the maximum forecasted volume from the three data sources. ***Constrained demand is based on the average forecast volume of the three data sources.
1 Based on an internal FDOT white paper recommending changes to FDOT LOS Standards.

10
Table 5
District Five Future Year 2035 AADT and Lane Requirement
Site #
Description Area Type
LOS Standard*
Unconstrained Demand** Constrained Demand***
AADT Lanes Needed
AADT Lanes Needed
7 I‐75, northern FDOT District Five limits, Marion County
Rural C 173,000 10 93,000 8
8 I‐75, north of Ocala, Marion County
Urban D 109,000 8 100,500 8
9 I‐75, south of Ocala, Marion County
Urban D 135,000 8 110,800 8
10 I‐75, north of Florida’s Turnpike, Sumter County
Rural C 130,000 10 99,700 8
11 I‐75, south of Florida’s Turnpike, Sumter County
Rural C 83,300 8 66,800 6
12 Florida’s Turnpike, east of I‐75, Sumter County
Rural C 81,000 8 70,900 6
*Based on an internal FDOT white paper recommending changes to FDOT LOS Standards. **Unconstrained demand is based on the maximum forecasted volume from the three data sources. ***Constrained demand is based on the average forecast volume of the three data sources.
Results The Traffic Technical Memorandum described the analytical techniques used to assess the traffic conditions along the I‐75 Sketch Interstate Plan corridor. Existing traffic volumes were presented and alternative sources of future traffic forecasts were compared. A summary of lane requirements on I‐75 mainline for year 2035 was also presented. It should be noted the purpose of the I‐75 Sketch Plan project traffic forecast is to summarize the demand along the mainline only. Ramp and cross street traffic demand was not taken into account for the purposes of this section. Based on these results and to satisfy lane continuity, it is concluded that I‐75 south of the Turnpike interchange needs to be widened to 6 lanes and I‐75 north of Turnpike needs to be widened to 8 lanes by 2035 under constrained conditions. Unconstrained results call for I‐75 to be widened to 10 lanes between the Turnpike interchange and Gainesville, with 8 lanes needed along the remainder of the corridor to satisfy lane continuity.

11
Conclusions The I‐75 Sketch Interstate Plan traffic analysis provided a snapshot view of how the mainline corridor is functioning. I‐75 is currently operating within capacity under existing traffic conditions according to results. The Technical Memorandum provided the finalized capacity results, both for existing conditions and forecasts. It should be noted that sites along I‐75 have capacity needs greater than 8 lanes by design year according to specific historical growth trends and individual model runs. More detailed traffic conditions may be analyzed in future planning and design stages. Model data, at times, may under or over represent traffic conditions when compared to historical trends. A potentially skewed model output can be seen at site 7 located within Appendix A. Site 7 predicts a potential future AADT of 173,000 which seems quite high compared to the existing AADT. Combining two model results with a historical trend will account for potential skewed representation and reduce the volatility of the results. For this reason, it is suggested to use constrained demand as the traffic predictions through design year. For a more detailed operational analysis of I‐75, refer to the studies reviewed for consistency (i.e. District Two Master Plan, I‐75 PD&E, etc.).
Next Steps The outcome of the Sketch Plan is to be conceptual in nature. A primary function of the completed Sketch Plan is to protect the very nature of the interstate facility, which is to provide for long distance, high speed and high volume movement of people and goods. Since the interstate system was designed to provide high speed, long distance travel with little interruption, the goal of the I‐75 Sketch Plan is to preserve this “… through and to movement…” along the I‐75 corridor. The Sketch Interstate Plan will define and analyze future mobility concepts that have the potential to deal with the growing demand. It has been determined that over the design period, I‐75 will surpass the existing capacity and modifications will need to occur. The traffic results from this report will be applied to these concepts to address the applicability of their use. The plan ultimately will provide for a mainline vision summarizing the future needs for passenger and freight in the corridor and possible concepts or visions to satisfy the future demand.

12
References
• Florida Department of Transportation 2006 Florida Traffic Information (FTI) CD
• Florida Department of Transportation Interstate 75 Master Plan, 2009, conducted by District
Two
• Florida Department of Transportation I‐75 Interchange Operational Analysis Report (IOAR) for
the Ocala Area, conducted by District Five
• Florida Turnpike Enterprise I‐75/Turnpike Interchange Operational Analysis Report (IOAR),
conducted by the Turnpike
• Florida Department of Transportation I‐75 Project Development and Environmental Study
(PD&E), conducted by District Five
• Florida Department of Transportation Central Florida Regional Planning Model (CFRPM)
• Florida Department of Transportation Gainesville MPO Model
• Florida Department of Transportation Florida Statewide Model
• Florida Department of Transportation 2002 Project Traffic Forecasting Handbook
• Florida Department of Transportation 2002 Quality / Level of Service Handbook
• Florida Department of Transportation 2007 LOS Issue Papers (2002 LOS Handbook Addendum):
Internal FDOT white paper recommending changes to FDOT LOS Standards
• Transportation Research Board 2000 Highway Capacity Manual

13
Appendices Appendix A: Method Results
District Two Forecast Analysis A‐1
District Five Forecast Analysis A‐2